

Abundance and Productivity of Marbled Murrelets (Brachyramphus marmoratus) Off Central California During the 2020 and 2021 Breeding Seasons
Links
- Document: Report (6 MB) , HTML , XML
- Data Release: Annual marbled murrelet abundance and productivity surveys off central California (Zone 6), 1999–2021
- Download citation as: RIS | Dublin Core
Acknowledgments
We would like to thank our additional murrelet observer: Alex Rinkert of California State Parks. We would also like to thank Morgan Gilmour (U.S. Geological Survey) for logistical support. Finally, we are grateful to Ben Becker and Julie Yee for reviewing prior versions of this report. This work was funded by the U.S. Fish and Wildlife Service Natural Resource Damage Assessment and Restoration Program under the guidance of the Luckenbach Oil Spill Trustee Council.
Abstract
Marbled murrelets (Brachyramphus marmoratus) have been listed as “endangered” by the State of California and “threatened” by the U.S. Fish and Wildlife Service since 1992 in California, Oregon, and Washington. Information regarding marbled murrelet abundance, distribution, population trends, and habitat associations is critical for risk assessment, effective management, evaluation of conservation efficacy, and ultimately, to meet federal- and state-mandated recovery efforts for this species. During June–August 2020 and 2021, the U.S. Geological Survey Western Ecological Research Center continued previously established, long-term (1999–present), at-sea surveys to estimate abundance and productivity of marbled murrelets in U.S. Fish and Wildlife Service Conservation Zone 6 (San Francisco Bay to Point Sur in central California). The abundance estimated for the entire study area was 470 birds (95-percent confidence interval, 313–707 birds) in 2020 and 402 birds (95-percent confidence interval, 219–737 birds) in 2021. Estimated abundances for both years are comparable with most prior years of study. We estimated reproductive productivity (calculated as the hatch-year to after-hatch-year ratio) after date-correcting hatch-year and after-hatch-year counts to account for birds expected to be absent from the water while inland at nests. The date-corrected juvenile ratio was 0.018±0.011 standard error in 2020 and 0.041±0.024 standard error in 2021. We updated a comprehensive database of all Zone 6 marbled murrelet survey data since 1999 with 2020–21 data to allow scientists and managers to evaluate established survey methods and assess trends in abundance and productivity estimates.
Introduction
The marbled murrelet (Brachyramphus marmoratus) is a small, diving seabird of the family Alcidae. Marbled murrelets inhabit North American nearshore marine waters from Alaska to central California. In California, marbled murrelets nest from March to October in forests within 80 kilometers (km) of the coast (Nelson, 1997). The southernmost known breeding area for marbled murrelets is south of San Francisco Bay in forested areas of the Santa Cruz Mountains and is separated from the nearest northern California breeding population by 240–320 km. An estimated 174–699 individuals compose the annual breeding population of marbled murrelets in this disjunct area (Henry, 2017). During their breeding season (April–August), the at-sea distribution of marbled murrelets adjacent to the Santa Cruz Mountains extends mostly from Half Moon Bay to Santa Cruz, with greatest abundance in the waters near Point Año Nuevo (Henry, 2017). Sightings of marbled murrelets south of Santa Cruz in Monterey Bay during the breeding season are infrequent (Ralph and Miller, 1995; Henkel, 2004), but there has been less survey effort in this region.
In 2020 and 2021, the U.S. Geological Survey Western Ecological Research Center (USGS-WERC), in cooperation with the U.S. Fish and Wildlife Service, performed long-term, at-sea surveys to estimate abundance and reproductive productivity of marbled murrelets in U.S. Fish and Wildlife Service Conservation Zone 6 (central California—San Francisco Bay to Point Sur). Marbled murrelets have been listed as “endangered” by the State of California and “threatened” by the U.S. Fish and Wildlife Service since 1992 in California, Oregon, and Washington (U.S. Fish and Wildlife Service, 2021). Surveys to estimate the abundance of marbled murrelets at sea off central California have been done since 1999 (excluding 2004–06; Henkel and Peery, 2008; Peery and others, 2009; Peery and Henry, 2010; Henry and others, 2012; Henry, 2017; Felis and others, 2018, 2019, 202089) and are funded by the U.S. Fish and Wildlife Service Natural Resource Damage Assessment and Restoration Program under the guidance of the Luckenbach Oil Spill Trustee Council. Information regarding marbled murrelet abundance, distribution, population trends, and habitat associations is critical for risk assessment, effective management and evaluation of conservation efficacy, and ultimately to meet federal- and state-mandated recovery efforts for this species.
The USGS-WERC continued at-sea surveys in 2020 and 2021 to assess abundance and productivity for two primary purposes: (1) to maintain efforts to quantify the status of marbled murrelets in central California (U.S. Fish and Wildlife Service Conservation Zone 6) and (2) to help evaluate marbled murrelet response to ongoing corvid control in coastal California State Parks. Additionally, the CZU Lightning Complex wildfire burned large areas of marbled murrelet nesting habitat in the Santa Cruz Mountains during late August and September 2020 (California Department of Forestry and Fire Protection, 2021); changes in local murrelet population and reproductive success in the wake of this habitat loss are of conservation and management concern. Finally, marbled murrelet distribution data at sea may help resource managers designate critical at-sea habitat for the species (for example, Bellefleur and others, 2009). In this report, we describe our methods and provide summaries of survey effort and results estimating marbled murrelet abundance and productivity (juvenile ratio) for 2020 and 2021.
Methods
At-Sea Survey Methods
In 2020 and 2021, USGS-WERC completed nine at-sea boat-based surveys per year for marbled murrelets between Half Moon Bay and Santa Cruz, California (fig. 1). We performed surveys during the previously established survey window (June 1–August 24; Henry, 2017) and allocated surveys to two periods within this window: three surveys during June 1–July 9 and six surveys during July 10–August 24. We used data from all surveys to estimate marbled murrelet abundance, and we used the six surveys during the second survey period to estimate juvenile ratio (following Henry, 2017). Surveys were almost exclusively performed when viewing conditions were excellent to good (table 1).
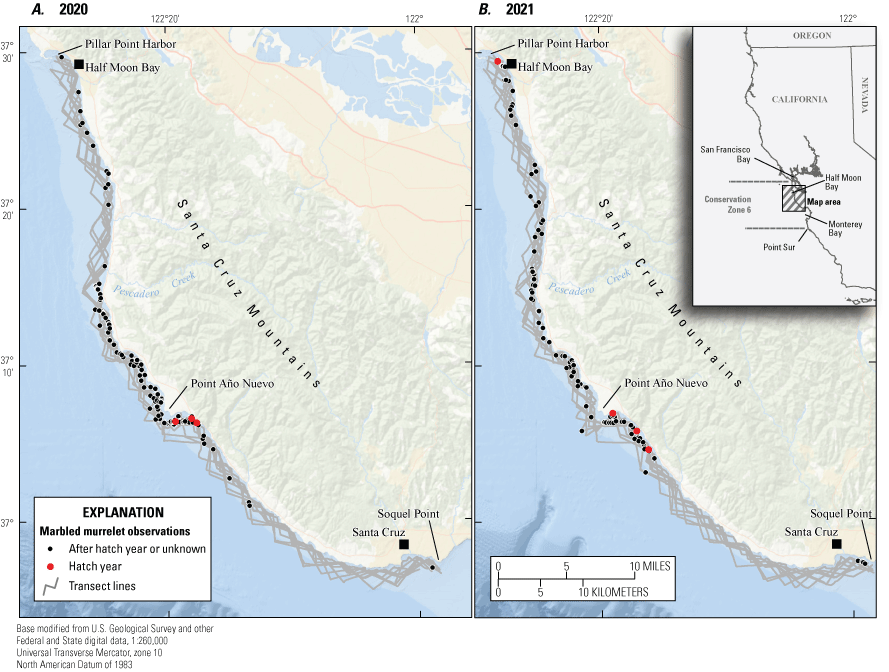
Study area in U.S. Fish and Wildlife Service Conservation Zone 6 showing survey routes and marbled murrelet (Brachyramphus marmoratus) detections from Half Moon Bay to Santa Cruz, central California, in A, 2020; and B, 2021.
Table 1.
Observer view condition classifications and descriptions for marbled murrelet (Brachyramphus marmoratus) surveys completed from Half Moon Bay to Santa Cruz, central California, 2020 and 2021.[~, approximately; m, meters]
In 2001–03, a pool of approximately 40 unique survey routes were designed by Peery and others (2007) as continuous, approximately 100-km long zig-zag transect lines to sample nearshore (200–1,350 meters [m] from coast) and offshore (1,350–2,500 m from coast) strata, with approximately four times greater effort within the nearshore stratum owing to greater known marbled murrelet densities nearshore (Henry, 2017, and references therein). Routes originally were drawn starting at a random distance (200–2,500 m) from shore, and an equal number of routes were drawn using starting points at the north and south ends of the survey area. Survey routes that are drawn from the south typically result in a greater amount of habitat surveyed within south-facing, leeward bays that often have greater relative abundances of marbled murrelets than more exposed stretches of the coast; annual survey replicates have typically included an equal number of routes drawn from north and south (Henry, 2017).
In 2020 and 2021, we randomly selected (without replacement) nine unique survey routes each year (five drawn from the south and four from the north) from the pool of available routes used by Henry (2017) and Peery and others (2006) during 2001–16 surveys. We performed all surveys by following the selected route from north (Pillar Point Harbor, Half Moon Bay) to south (Soquel Point, Monterey Bay) using a Global Positioning System (GPS). When the survey route intersected land or crossed hazardous areas (for example, high surf areas nearshore), we maintained survey effort while safely navigating as close as possible to the transect line. We performed surveys from a small boat, using line-transect methods (Becker and others, 1997; Peery and others, 2006; Henry, 2017). Two observers, standing on either side of a 6-m open skiff (Boston Whaler Guardian 20; research vessel Lucy M) traveling 22–28-km per hour, recorded the observation time, angle off the transect line, distance from the vessel, and group size of all marbled murrelets detected. The skiff was operated by a third crew member whose sole responsibility was piloting the vessel. Skiff size and travel speed were consistent with those used in surveys since 2007. From 1999 to 2003, surveys were performed in a 4-m open inflatable skiff at approximately 18-km per hour.
Observers counted marbled murrelets as a group when individuals were within 2 m of each other or if they showed behavior indicative of group status (for example, co-diving or vocalizing with one another; Strong and others, 1995). Observers recorded the age-class of each marbled murrelet based on three plumage classifications: (1) “after-hatch-year” (AHY), (2) “hatch-year” (HY), or (3) “unknown.” Behavior was recorded as “resting” on the water or “flying,” with flight direction noted. Distance and angle were estimated at the time of first detection, regardless of behavior. Before each survey, observers calibrated distance estimation using a laser rangefinder on buoys and other targets in the harbor. To facilitate estimations of sighting angles, we placed marks along the bow of the boat in 10-degree increments. The vessel occasionally paused or deviated from the transect line to assess marbled murrelet age-class; no additional observations were counted when deviating off the transect line. Observers also recorded observations of all non-murrelet marine birds and mammals encountered along transects, consistent with surveys performed since 2007. Marine mammal observations were recorded using line-transect methods as described for murrelets, and non-murrelet bird observations were counted in a 75-m aside strip transect (no distances or angles recorded). Non-murrelet observations were archived but are not presented or analyzed in this report.
Observers recorded all observations and observation times using digital voice recorders, including survey start and end times, ocean conditions (Beaufort Sea state), viewing conditions (table 1), and periods when effort was paused for any reason (for example, vessel deviated from the transect line to identify marbled murrelet age-class). Observers reviewed their own recordings and transcribed and tabulated their sighting data into a single spreadsheet that was examined for quality assurance and quality control and then merged into a combined spreadsheet. We acquired a continuous 1-second GPS track during each survey using a handheld GPS unit; this track was used to georeference observations based on matching date/time using custom scripting in R (R Core Team, 2016).
A comprehensive database of all marbled murrelet survey data (1999–present) is available in a U.S. Geological Survey data release (Felis and others, 2022) to allow scientists and managers to evaluate established survey methods and assess trends in abundance estimation and juvenile ratios.
Abundance Estimation Methods
We calculated perpendicular distance for each detection (sine of the sighting angle multiplied by observation distance, where the sighting angle is relative to the direction the boat is traveling). Consistent with all previous years (1999–present), we included sightings of flying birds in our analysis, despite the potential that flying birds might have a different probability of detection and including these could affect abundance estimates. Historical protocol (1999–2003) for this monitoring program indicated that flying birds should only be counted if they cross the beam of the vessel and the distance and angle to flying birds was only to be estimated when flying birds crossed the beam (90-degree angle and a distance estimate; Henry and Tyler, 2017). Re-examination of historical data (Felis and others, 2022) showed that this protocol was followed in earlier years (1999–2003) but that flying birds were given a distance/angle estimate for when they were first detected in later years (2007–16). We maintained the methodology of 2007–16 for estimating distance and angle of flying birds at the time of first sighting and counted them whether or not they crossed the beam of the vessel during 2017–present.
We created a spatial representation of strata in ArcGIS based on the same coastline shapefile used in 2007–present (California Department of Fish and Wildlife, 2004) and calculated linear effort for each survey within the nearshore and offshore strata consistent with previous years by using the hypothetical survey route delineated by the zigzag segment nodes (table 2). We assigned marbled murrelet observations to each stratum in ArcGIS based on spatial overlap. The calculation of stratum-specific linear effort and the assignment of observations to strata from 1999 to 2003 was done with an older coastline representation (Peery and others, 2006). We maintained the use of the modern stratum delineation to facilitate comparison of our abundance estimates to recent data (2007–present) but we advise caution when comparing recent estimates with older abundance estimates from 1999 to 2003.
Table 2.
Marbled murrelet (Brachyramphus marmoratus) survey dates, route direction (direction from which route was drawn), transect length, and number of murrelet observations (groups, individuals, and hatch year birds) for all surveys, U.S. Fish and Wildlife Service Conservation Zone 6, central California, 2020 and 2021.[mm/dd/yyyy, month/day/year; km, kilometer]
Following Henry (2017), we used the program DISTANCE v7.1 (Thomas and others, 2010) to model our detection function and estimate marbled murrelet abundance using conventional distance sampling (see Buckland and others, 2015, for detection function modeling, model selection, and line transect abundance estimation methods). For each year, we pooled observations from all surveys to create an annual detection function and applied this function to each survey to calculate stratum- and survey-specific density estimates based on the linear effort sampled during each survey. Consistent with Henry (2017), we grouped perpendicular detection distances into 20-m bins, used a 120-m truncation distance, and evaluated the half-normal function, with or without cosine expansion (expansion orders automatically varied by DISTANCE); of these iterations, DISTANCE automatically selected the detection function model with the smallest Akaike information criterion (AIC; Burnham and Anderson, 2004) value (that is, most parsimonious fit). We used the mean of observed cluster size to estimate cluster (group) sizes at the sample (transect) level. We calculated survey-specific abundances by multiplying the stratum-specific density estimate by the total area of each stratum in the study area (104.65 square kilometers [km2] for each) and then summed the two stratum-specific abundance values for a total area abundance estimate. Variances of abundance estimates incorporate variances from the overall detection model, encounter rates across surveys, and cluster (group) size (Buckland and others, 2015).
We report annual abundances and 95-percent confidence interval (CI) estimates for 2017–21 (current program of study), and previously reported abundance estimates from 1999 to 2016 (as reported by Henry, 2017). Estimates from 1999 to 2016 were calculated similarly, with a few exceptions. Peery and others (2006) included covariates (observer, view conditions) in annual detection function model selection from 1999 to 2003 but this practice was not continued from 2007 to 2016 (Henkel and Peery, 2008; Peery and others, 2008; Peery and Henry, 2010; Henry and others, 2012; Henry and Tyler, 2017). Additionally, detection functions were modeled annually except for 2008, when at-sea murrelet observations and number of surveys were too few to model a year-specific detection function. As a result, Peery and others (2008) modeled a detection function using pooled observation data from 2007 to 2008 and applied it to 2008 data to estimate abundance. Peery and others (2006) used detection distance binning schemes other than 20-m when analyzing data from 1999 to 2003. Finally, the spatial boundaries of strata are different for 1999–2003 and 2007–21 analyses because different coastline representations were used, resulting in subtle changes in stratum-specific linear effort calculations and observation assignments.
Juvenile Ratio Methods
We estimated the juvenile ratio (the ratio of HY to AHY individuals) for marbled murrelet surveys completed during the fledging period. The previously established fledging period ranged from July 10, when an estimated 34 percent of HY birds are thought to have fledged, to August 24, about the time when HY and AHY murrelets become indistinguishable at sea because AHY birds begin pre-basic molt (Long and others, 2001; Peery and others, 2007). Thus, we included only surveys between July 10 and August 24 to estimate annual juvenile ratios (following Peery and others, 2007 and Henry, 2017). We followed techniques outlined by Long and others (2001) to identify HY birds. We also reviewed resources provided by the Alaska murrelet group (K. Nesvacil, Alaska Department of Fish and Game, written commun., 2017) and photographs of HY birds taken during past surveys before starting new surveys. We included only those birds confidently identified to age class to estimate the juvenile ratio. Raw counts are used for the ratio, as opposed to estimates of density or abundance from detection function modeling, with the assumption that HY and AHY murrelets have equivalent detection functions (Peery and others, 2007).
We adjusted HY and AHY counts to account for birds expected to have been inland during the time of the survey. A certain percentage of AHY birds are still incubating young during the fledging period and, therefore, are not on the water during at-sea surveys, potentially creating a positively biased juvenile ratio. The proportion, , of AHY birds incubating in survey , is reported to be less than 6 percent between July 10 and July 17 and less than 1 percent after July 17 (Peery and others, 2004, 2007) and estimated by linear regression model (Peery and others, 2007) shown in eq. 1:
whereTherefore, to correct for the number of AHY birds counted at sea between July 10 and July 17, we calculated, as the date-corrected number of AHY individuals, , as
whereis the number of after-hatch-year (AHY) birds counted on survey i; and
is the proportion of incubating AHY individuals during survey i (eq. 1).
For surveys after July 17, we assumed no birds were incubating, and the observed number of AHY birds was not date-corrected.
In addition to adjusting for incubating adults (to avoid positive bias in the estimated ratio), the juvenile ratio calculation can be negatively biased by not accounting for HY birds that have not yet fledged by the time of the survey. Based on 47 observed fledging events in California, Peery and others (2007) estimated the daily percent of juveniles expected to have fledged during the study timeframe. Therefore, to adjust the number of HY birds observed during a given at-sea survey, we calculated the proportion, , of fledged HY birds in survey , estimated by linear regression model (Peery and others, 2007) as
whereTo correct for the number of HY birds not counted at sea because they had not yet fledged, we calculated the date-corrected number of HY individuals, , as
where andis the proportion of fledged HY birds in survey (eq. 3).
For each year, we used and to estimate the juvenile ratio, , as
whereis the date-corrected number of AHY individuals in survey (eq. 2);
is the date-corrected number of HY individuals in survey (eq. 4); and
n is the number of surveys (Levy and Lemeshow, 1991).
For each year, we estimated the variance of the date-corrected juvenile ratio, , following van Kempen and van Vliet (2000) and Peery and others (2007) as
whereis the variance in the number of date-corrected hatch-year (HY) individuals observed;
is the variance in the number of date-corrected after-hatch-year (AHY) individuals observed;
is the covariance between the numbers of date-corrected HY and AHY individuals observed;
are the mean numbers of date-corrected HY and AHY individuals observed, respectively; and
n is the number of surveys.
We calculated annual juvenile ratios for 1999–2021 using only standardized zig-zag transects (using data compiled in Felis and others, 2022) and report those results herein. We calculated date-corrected juvenile ratios and associated variance using R (R Core Team, 2016).
Results
Abundance Estimation Results
We detected 174 marbled murrelet groups consisting of 303 murrelets on all surveys combined in 2020 (range was 9–55 birds per survey; table 2). We detected 129 marbled murrelet groups consisting of 228 murrelets on all surveys combined in 2021 (range was 7–77 birds per survey; table 2). In 2020, murrelet sightings were concentrated from around Point Año Nuevo to Pescadero Creek; sightings were sporadic between Half Moon Bay and Pescadero Creek and rare from just south of Point Año Nuevo to Santa Cruz (fig. 1). Similar to 2020, murrelet sightings in 2021 were concentrated from Point Año Nuevo to Pescadero Creek and rare from south of Point Año Nuevo to Santa Cruz; however, birds were seen more frequently between Half Moon Bay and Pescadero Creek, and an aggregation of murrelets was seen near Soquel Point on a single survey (July 28, 2021; fig. 1).
Detections approached zero at 120-m horizontal sighting distance for both years (fig. 2); therefore, consistent with Henry (2017), we excluded from analysis observations that were greater than 120 m from the transect line. We included flying birds (4 and 13 percent of all detections in 2020 and 2021, respectively; following Henry, 2017). For all surveys combined in 2020, the half-normal detection model with a cosine adjustment (order 2) was the best-fitting model, and the observed number of sightings was not significantly different from the number predicted using this detection model (chi-squared [χ2]=2.00, degrees of freedom [df]=3, probability value [P]=0.57; fig. 2). The abundance estimated for the entire study area in 2020, using all surveys, was 470 birds (95-percent CI, 313–707 birds; percent coefficient of variation [CV], 19.0; table 3). For all surveys combined in 2021, the half-normal detection model with no adjustments was the best-fitting model, and the observed number of sightings was not significantly different from the number predicted using this detection model (chi-squared [χ2]=1.93, degrees of freedom [df]=4, probability value [P]=0.75; fig. 2). The abundance estimated for the entire study area in 2021, using all surveys, was 402 birds (95-percent CI, 219–737 birds; percent coefficient of variation [CV], 27.8; table 3). Estimated abundances for all study years (2001–21) are shown in table 3 and figure 3.
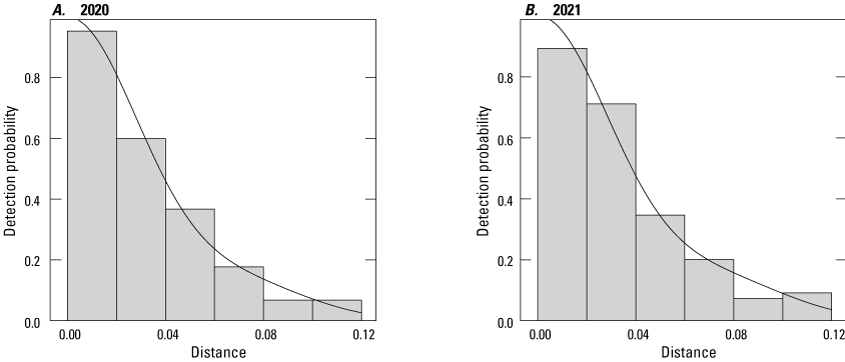
Annual modeled detection probabilities of marbled murrelets (Brachyramphus marmoratus) sighted within perpendicular distance less than or equal to 0.12 kilometers of vessel for all surveys, U.S. Fish and Wildlife Service Conservation Zone 6, central California, in A, 2020; and B, 2021. Bin width is 0.02 kilometers (20 m).
Table 3.
Annual at-sea marbled murrelet (Brachyramphus marmoratus) abundance estimates (N), 95-percent confidence intervals (95% CI), and estimates of date-corrected hatch-year to after-hatch-year (HY:AHY) ratios () and standard errors (SE), U.S. Fish and Wildlife Service Conservation Zone 6, central California, 1999–2021.[Number of surveys, n, used in each estimate is listed. We do not report abundance estimates from 1999–2000 because only north-drawn survey routes were used in those years; see methods for how the draw direction of survey routes can bias abundance estimates. Abbreviations: %, percent; CI, confidence interval; —, no data; N/A, not applicable]
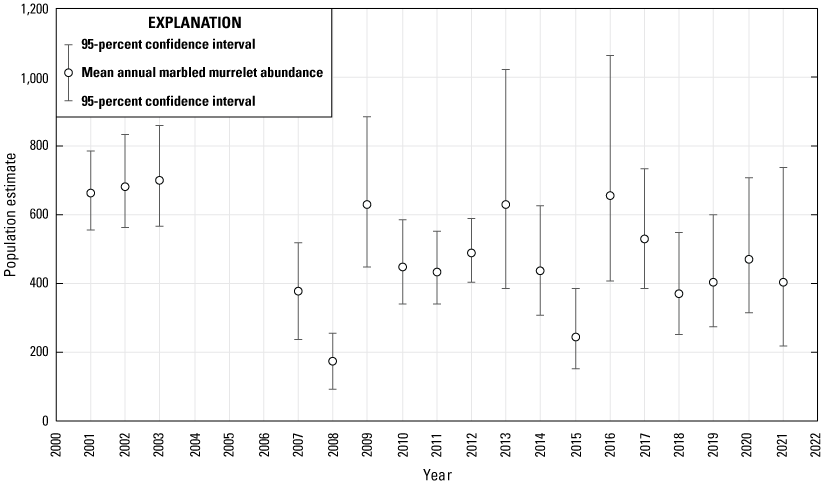
Mean annual marbled murrelet (Brachyramphus marmoratus) at-sea abundance estimates and 95-percent confidence intervals, U.S. Fish and Wildlife Service Conservation Zone 6, central California, for all years for which survey data was available during 2001–2021. Years 1999 and 2000 are excluded because survey routes were only drawn from the north in those years, and no surveys were done in 2004–06. All values from years prior to 2017 were referenced from Henry (2017).
Juvenile Ratio Results
We detected three HY marbled murrelets in 2020: two on August 13, 2020, and one on August 15, 2020 (table 2; fig. 1). In 2020, the corrected juvenile ratio () was 0.018±0.011 standard error (SE). We detected four HY marbled murrelets in 2021: one on July 28, 2021, two on August 9, 2020, and one on August 23, 2020 (table 2; fig. 1). In 2021, the corrected juvenile ratio () was 0.041±0.024 SE. Estimated corrected juvenile ratios using standardized zig-zag surveys (1999–2021; calculated in this study) are shown in table 3 and figure 4.
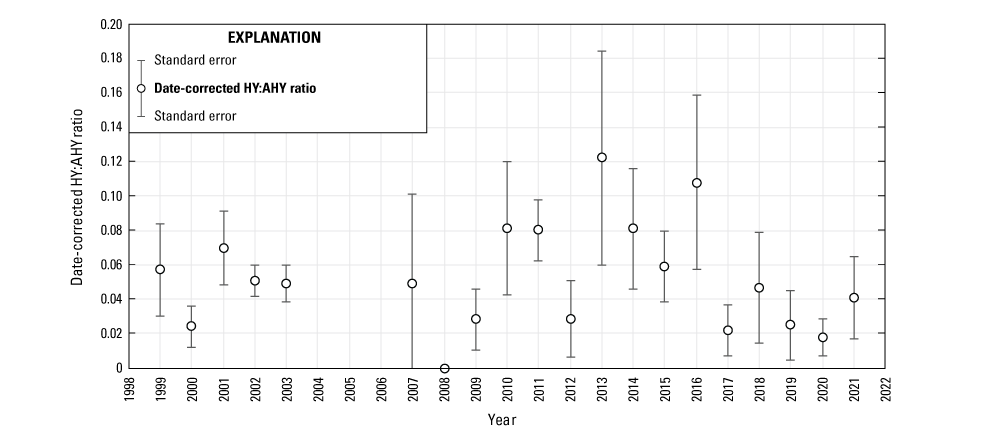
Date-corrected marbled murrelet (Brachyramphus marmoratus) hatch-year (HY) to after-hatch-year (AHY) ratios, plus or minus standard errors, U.S. Fish and Wildlife Service Conservation Zone 6, central California, using standardized zig-zag surveys, 1999–2021. No surveys were done in 2004–06. Surveys used to estimate ratios were limited to July 10–August 24. Date-corrected estimates were corrected for the proportion of hatch-year murrelets that had not fledged and the proportion of after-hatch-year murrelets still incubating at the time the survey was done (Peery and others, 2007).
Discussion
We followed survey methods and analytical procedures to estimate densities and abundances for marbled murrelets using conventional distance sampling off central California according to methods described in Henry (2017). Estimated abundance from 2020 (470 murrelets) was similar to the long-term mean (2001–21; 485 murrelets), whereas estimated abundance from 2021 (402 murrelets) was less; however, both years are comparable at the 95-percent confidence interval level to most prior years of study. The corrected juvenile ratios in 2020 (0.018) and 2021 (0.041) were less than the long-term mean from zig-zag surveys (1999–2021; 0.052). Despite the significant loss of breeding habitat due to the CZU fire, estimated abundance and productivity results for 2021, as well as the spatial distribution of murrelet sightings, were not dramatically different than results from recent years; however, estimated abundance was more variable than is typical, primarily because inter-survey murrelet encounter rates were more variable. The CZU fire started late in the 2020 breeding season when approximately 75 percent of successful murrelet nests are expected to have fledged a chick in this region (Peery and others, 2007), suggesting that fire-induced nest failure due to adult abandonment and chick mortality could have been limited. It is uncertain how long it could take for any potential population changes or distributional shifts of murrelets at the regional scale to manifest in estimated abundances and productivity at sea within the study area.
Future recalculation of annual abundance estimates could (1) model more robust global detection functions for distinct eras of this program (for example, 1999–2003 with a smaller vessel at slower speeds, 2007–present with a larger vessel at faster speeds); (2) consistently allow for covariates (for example, observer, viewing conditions) to be included in detection function modeling; (3) remove flying birds from detection function modeling—and potentially from annual density and abundance estimates—given the inconsistencies in how and when these birds were recorded over time; and (4) use consistent stratum boundaries to assign linear effort and observations to the nearshore and offshore strata. Future annual productivity estimates could (1) investigate differences in juvenile and adult murrelet distribution with respect to distance from shore and alongshore in the study area that could bias ratio estimates, (2) focus survey effort for juveniles in long-term juvenile hot spots, and (3) use juvenile encounter rate or estimated abundance to derive a measure of productivity that is not sensitive to fluctuating numbers of adult murrelets within the study area.
The annual marbled murrelet survey program has involved several different research groups through time; therefore, we updated the comprehensive database of all marbled murrelet survey data since 1999 with 2020 and 2021 data that could be used to facilitate future survey method evaluations and assessments of trends in estimated abundance and juvenile ratios (Felis and others, 2022). This database also facilitates annual survey logistics (for example, pre-survey planning) and promotes repeatability of analytical methods across years and project teams.
References Cited
Becker, B.H., Beissinger, S.R., and Carter, H.R., 1997, At-sea density monitoring of marbled murrelets in central California—Methodological considerations: The Condor, v. 99, no. 3, p. 743–755, accessed November 1, 2021, at https://doi.org/10.2307/1370485.
Bellefleur, D., Lee, P., and Ronconi, R.A., 2009, The impact of recreational boat traffic on marbled murrelets (Brachyramphus marmoratus): Journal of Environmental Management, v. 90, no. 1, p. 531–538. [Available at https://doi.org/10.1016/j.jenvman.2007.12.002.]
Buckland, S.T., Rexstad, E.A., Marques, T.A., and Oedekoven, C.S., 2015, Distance sampling—Methods and applications: Cham, Switzerland, Springer International Publishing, 277 p., accessed November 1, 2021, at https://doi.org/10.1007/978-3-319-19219-2.
Burnham, K.P., and Anderson, D.R., 2004, Multimodel inference—Understanding AIC and BIC in model selection: Sociological Methods & Research, v. 33, no. 2, p. 261–304. [Available at https://doi.org/10.1177/0049124104268644.]
California Department of Fish and Wildlife, 2004, Generalized California coastline—coastn83.shp: California Department of Fish and Wildlife database, accessed October 20, 2017, at https://www.wildlife.ca.gov/Conservation/Marine/GIS/Downloads.
California Department of Forestry and Fire Protection (CAL FIRE), 2021, CZU lightning complex (including Warnella Fire) incident: California Department of Forestry and Fire Protection, accessed October 26, 2021, at https://www.fire.ca.gov/incidents/2020/8/16/czu-lightning-complex-including-warnella-fire.
Felis, J.J., Adams, J., and Kelsey, E.C., 2018, Abundance and productivity of marbled murrelets (Brachyramphus marmoratus) off central California during the 2017 breeding season: U.S. Geological Survey Data Series 1093, 12 p., accessed November 1, 2021, at https://doi.org/10.3133/ds1093.
Felis, J.J., Kelsey, E.C., and Adams, J., 2019, Abundance and productivity of marbled murrelets (Brachyramphus marmoratus) off central California during the 2018 breeding season: U.S. Geological Survey Data Series 1107, 10 p., accessed November 1, 2021, at https://doi.org/10.3133/ds1107.
Felis, J.J., Kelsey, E.C., Adams, J., Horton, C., and White, L., 2020, Abundance and productivity of marbled murrelets (Brachyramphus marmoratus) off central California during the 2019 breeding season: U.S. Geological Survey Data Series 1123, 13 p., accessed November 1, 2021, at https://doi.org/10.3133/ds1123.
Felis, J.J., Adams, J., Peery, M.Z., Henry, R.W., Henkel, L.A., Becker, B.H., and Halbert, P., 2022, Annual marbled murrelet abundance and productivity surveys off central California (Zone 6), 1999–2021: U.S. Geological Survey data release, accessed April 8, 2022, at https://doi.org/10.5066/F75B01RW.
Henry, R.W., 2017, Murrelet at-sea abundance, productivity, and prey resources in Zone 6, chap 7 of Halbert, P., and Singer, S.W., eds., Marbled murrelet landscape management plan for zone 6: Felton, California, California Department of Parks and Recreation, 235 p. [Available at http://www.parks.ca.gov/pages/29882/files/Z6-Plan_FINAL_MASTER_V14_07-17.pdf.]
Nelson, S.K., 1997, Marbled murrelet (Brachyramphus marmoratus), (ver. 2.0), in Poole, A.F., and Gill, F.B., eds., The birds of North America: Ithaca, N.Y., Cornell Lab of Ornithology, accessed November 1, 2021, at https://doi.org/10.2173/tbna.276.p.
Peery, M.Z., Becker, B.H., and Beissinger, S.R., 2006, Combining demographic and count-based approaches to identify source-sink dynamics of a threatened seabird: Ecological Applications, v. 16, no. 4, p. 1516–1528, accessed November 1, 2021, at https://doi.org/10.1890/1051-0761(2006)016[1516:CDACAT]2.0.CO;2.
Peery, M.Z., Becker, B.H., and Beissinger, S.R., 2007, Age ratios as estimators of productivity—Testing assumptions on a threatened seabird, the marbled murrelet (Brachyramphus marmoratus): The Auk, v. 124, no. 1, p. 224–240, accessed November 1, 2021, at https://doi.org/10.1093/auk/124.1.224.
Peery, M.Z., Beissinger, S.R., Newman, S.H., Burkett, E.B., and Williams, T.D., 2004, Applying the declining population paradigm—Diagnosing causes of poor reproduction in the marbled murrelet: Conservation Biology, v. 18, no. 4, p. 1088–1098, accessed November 1, 2021, at https://doi.org/10.1111/j.1523-1739.2004.00134.x.
Peery, M.Z., Newman, S.H., Storlazzi, C.D., and Beissinger, S.R., 2009, Meeting reproductive demands in a dynamic upwelling system—Foraging strategies of a pursuit-diving seabird, the marbled murrelet: The Condor, v. 111, no. 1, p. 120–134, accessed November 1, 2021, at https://doi.org/10.1525/cond.2009.080094.
Ralph, C.J., and Miller, S.L., 1995, Offshore population estimates of marbled murrelets in California, chap 33 in Ralph, C.J., Hunt, G.L., Raphael, M.G., and Piatt, J.F., eds., Ecology and conservation of the marbled murrelet: U.S. Forest Service General Technical Report PSW-GTR-152: Albany, Calif., Pacific Southwest Research Station, Forest Service, U.S. Department of Agriculture, p. 353–360. [Available at https://doi.org/10.2737/PSW-GTR-152.]
R Core Team, 2016, R—A language and environment for statistical computing: Vienna, Austria, R Foundation for Statistical Computing, accessed November 1, 2021, at https://www.R-project.org/.
Strong, C.S., Keitt, B.S., Bradford, S., McIver, W.R., Palmer, C.J., and Gaffney, I., 1995, Distribution and population estimates of marbled murrelets at sea in Oregon during the summers of 1992 and 1993, chap. 32 in Ralph, C.J., Hunt, G.L., Jr., Raphael, M.G., and Piatt, J.F., eds., Ecology and conservation of the marbled murrelet: U.S. Forest Service General Technical Report PSW-GTR-152, p. 339–352.
Thomas, L., Buckland, S.T., Rexstad, E.A., Laake, J.L., Strindberg, S., Hedley, S.L., Bishop, J.R.B., Marques, T.A., and Burnham, K.P., 2010, Distance software—Design and analysis of distance sampling surveys for estimating population size: Journal of Applied Ecology, v. 47, no. 1, p. 5–14. [Available at https://doi.org/10.1111/j.1365-2664.2009.01737.x.]
U.S. Fish and Wildlife Service, 2021, Environmental conservation online system—Marbled murrelet species profile: U.S. Fish and Wildlife Service, accessed April 1, 2022, at https://ecos.fws.gov/ecp/species/4467.
van Kempen, G.M.P., and van Vliet, L.J., 2000, Mean and variance of ratio estimators used in fluorescence ratio imaging: Cytometry, v. 39, no. 4, p. 300–305, accessed November 1, 2021, at https://doi.org/10.1002/(SICI)1097-0320(20000401)39:4<300::AID-CYTO8>3.0.CO;2-O.
For more information concerning the research in this report, contact the
Director, Western Ecological Research Center
U.S. Geological Survey
3020 State University Drive East
Sacramento, California 95819
https://www.usgs.gov/centers/werc
Publishing support provided by the U.S. Geological Survey
Science Publishing Network, Sacramento Publishing Service Center
Suggested Citation
Felis, J.J., Adams, J., Horton, C.A., Kelsey, E.C., and White, L.M., 2022, Abundance and productivity of Marbled Murrelets (Brachyramphus marmoratus) off central California during the 2020 and 2021 breeding seasons: U.S. Geological Survey Data Report 1157, 12 p., https://doi.org/10.3133/dr1157.
ISSN: 2771-9448 (online)
Study Area
| Publication type | Report |
|---|---|
| Publication Subtype | USGS Numbered Series |
| Title | Abundance and productivity of Marbled Murrelets (Brachyramphus marmoratus) off central California during the 2020 and 2021 breeding seasons |
| Series title | Data Report |
| Series number | 1157 |
| DOI | 10.3133/dr1157 |
| Year Published | 2022 |
| Language | English |
| Publisher | U.S. Geological Survey |
| Publisher location | Reston, VA |
| Contributing office(s) | Western Ecological Research Center |
| Description | Report: vi, 12 p.; Data Release |
| Country | United States |
| State | California |
| Online Only (Y/N) | Y |
| Google Analytic Metrics | Metrics page |