

Bedrock-Surface Elevation and Overburden Thickness Maps of the Five Boroughs, New York City, New York
Links
- Document: Report (9.00 MB pdf) , HTML , XML
- Related Work: NYC Bedrock and Groundwater Mapper
- Data Releases:
- USGS data release - Horizontal-to-vertical spectral ratio soundings and depth-to-bedrock data for bedrock surface elevation of the five boroughs, New York City, New York
- USGS data release - Geospatial data for bedrock surface elevation of the five boroughs, New York City, New York
- USGS data release - Continuous marine seismic-reflection surveys and derived depth-to-bedrock point data from the East River, New York City, New York
- Download citation as: RIS | Dublin Core
Acknowledgments
The authors would like to thank the New York City Department of Design and Construction (NYCDDC) for its support of this effort. We also thank Dennis Askins and Alex Posner, formerly of the NYCDDC, for compiling decades of subsurface information on New York City’s bedrock; these maps would not have been possible without their efforts.
We also acknowledge Michael Como, Michael Noll, Anthony Chu, and Marie Zuck of the U.S. Geological Survey (USGS) for their assistance in getting the large datasets compiled and digitized, as well as former USGS employee John Van Hoesen.
Abstract
Digital maps of bedrock elevation and overburden thickness (depth to bedrock) were constructed for the five boroughs of New York City by the U.S. Geological Survey, in cooperation with the New York City Department of Design and Construction, from a compilation of historical and newly acquired data. Raster surfaces were interpolated from a point database containing data from more than 14,000 locations collected from a variety of sources. These data were collected between 1905 and 2021. These maps were constructed to supplement existing tools for the evaluation of potential construction of geothermal heat pump technology for buildings in New York City.
The bedrock underlying the study area ranges from easily weathered to very resistant to weathering. This differential susceptibility to erosion, along with numerous north-northwest-trending faults, is believed to control the shape of the bedrock surface. Glacial scouring of the bedrock during the Pleistocene Epoch is the most recent control on the topography of bedrock surfaces. Overburden thickness is an important consideration for evaluation and construction of geothermal systems.
Bedrock-surface elevation ranges from about 360 feet above sea level (in central Staten Island and northern Bronx) to 1,200 feet below sea level (in southern Queens) (North American Vertical Datum of 1988). The overburden thickness ranges from 0 foot thick at surface outcrops on Staten Island, Manhattan, and the Bronx, to 1,280 feet thick in southeastern Queens.
Introduction
A point database of land-surface elevation and depth to bedrock spanning New York City and Long Island, New York, was used to interpolate bedrock-surface elevation and overburden thickness for the five boroughs of New York City, which includes Manhattan (New York County), the Bronx (Bronx County), Brooklyn (Kings County), Queens (Queens County), and Staten Island (Richmond County). The interpolated surfaces were used to create digital geospatial data and maps in cooperation with the New York City Department of Design and Construction (NYCDDC) in support of city construction projects, notably those involving construction of geothermal heat pump systems, which require knowledge of bedrock and groundwater depths to determine feasibility (Paino and others, 2012). These bedrock elevation and overburden thickness maps also have application to U.S. Geological Survey (USGS) groundwater studies across the New York metropolitan area as part of a larger investigation on the groundwater sustainability of the Long Island aquifer system (Breault and others, 2021).
Maps presented here supersede previous USGS interpretations of bedrock surface elevation and overburden thickness for Manhattan, Bronx, and parts of Queens (Baskerville, 1994), Staten Island (Soren, 1988), and parts of Long Island (Stumm, 2001; Stumm and others, 2002). Improvements in these maps result from the inclusion of thousands of additional data points, including newly acquired geophysical data, and updated GIS-based interpolation tools and techniques. For the purposes of this study, bedrock is defined as consolidated rock that crops out at the surface or lies beneath soil, artificial fill, postglacial and glacial sediments, and (or) weathered bedrock (saprolite). These unconsolidated deposits that overlie bedrock are collectively referred to as overburden.
Purpose and Scope
This report presents maps of bedrock elevation and overburden thickness in the five boroughs of New York City; describes the sources of data and methods of interpolation used to create the maps; summarizes bedrock elevation and overburden thickness in each of the boroughs, as shown in the maps; and discusses limitations of the study. Three USGS data releases are associated with this report: (1) a point database of bedrock elevation and overburden thickness and associated interpolation products (DeMott and others, 2023b), (2) a database of horizontal-to-vertical spectral ratio (HVSR) soundings that were used in estimating overburden thickness (DeMott and others, 2023a), and (3) marine seismic reflection data from the East River (DeMott and others, 2023c). These HVSR and marine seismic data points are included in the point database used for interpolation.
Relevance to Geothermal Resources in New York City
The primary purpose for the collaboration between the USGS and the NYCDDC is to supplement and update existing bedrock elevation and overburden thickness information throughout New York City’s five boroughs. Overburden thickness maps are integral to evaluating the potential feasibility of installing geothermal heat pump technology for the heating and cooling of New York City buildings. Geothermal energy systems rely on constant groundwater temperatures for heat exchange. Overburden thickness is an important parameter for determining the type and scope of geothermal heat pump systems that can be constructed (open loop, standing column, or closed loop systems). In 2013, the NYCDDC published the first manual exploring citywide application of this technology, underscoring an increasing need for detailed mapping of the relevant geologic parameters of each borough (Paino and others, 2012). Since 2013, New York City has passed two laws mandating the development of a screening tool to better evaluate such sites. The maps produced in this report are part of this evaluative dataset for geothermal resources.
Geologic Background
The study area includes a varied topography of exposed bedrock highlands in northern Manhattan, central Staten Island, and parts of the Bronx. On Long Island, bedrock crops out in a few isolated areas in northwestern Queens County. Bedrock in most of the study area is covered by overburden with a thickness ranging from a few feet to over a thousand feet.
Schöpf (1787) was the first to identify the rocks in Manhattan Island (the main island of the Borough of Manhattan), describing them as mica schist. Mather (1843) and Cozzens (1843) described the bedrock of New York City in greater detail and included descriptions of metamorphic and igneous bedrock, including gneiss, mica slate, talcose slate, serpentinite metamorphic limestone, and granite, among others. A topographic and hydrographic map of Manhattan Island by Viele (1865) allows for interpretation of the surface topography as influenced by bedrock geology and geomorphic processes prior to urban development. This map includes the natural stream drainage system, low-lying wetland areas, and topographic features, all overlain with the present street grid in use today in reprinted 1950s-era editions. Kemp (1887) produced the first detailed geological map and sections of Manhattan. Merrill (1890) attempted to determine correlations and a stratigraphic sequence to the rocks in Manhattan, naming the major rock types on the island as the Fordham Gneiss, Manhattan Schist, and Inwood Marble. Hobbs (1905) collated over 1,000 borehole and well logs and produced the first bedrock contour maps of Manhattan. Berkey (1909) used tunnel excavations and test boreholes to describe the geology and structural features of the bedrock in southern Manhattan. Fluhr (1937a, b, c, d, and e) compiled hundreds of test boring logs and well logs into a series of maps and geologic logs for the five boroughs of New York City. Murphy and Fluhr (1944) updated the previous work by Hobbs (1905) and produced geologic, soil, and bedrock elevation contour maps. Perlmutter and Arnow (1953) completed a reconnaissance groundwater study of the New York City area and an updated bedrock elevation contour map of Manhattan.
More recent studies have mapped the bedrock of Manhattan using outcrops, subsurface drill core, and water-tunnel excavations (Baskerville, 1982; Merguerian and Baskerville, 1987; Taterka 1987). Baskerville (1994) mapped the geologic and engineering properties of Manhattan and collated over 80 years of subsurface excavation information into a map of bedrock-surface elevation. Stumm (2005), Stumm and Chowdhury (2003), and Stumm and others (2004) studied the fractured-rock structure and groundwater flow system using borehole geophysical methods in water-tunnel test boreholes in southern Manhattan.
The bedrock underlying the study area has been mapped as a structurally complex assemblage of high-grade metamorphic rocks, which includes gneiss, schist, amphibolite, marble, granite, and serpentinite (Merguerian, 1983; Merguerian and Baskerville, 1987; Taterka, 1987; Baskerville and Mose, 1989; Merguerian and Sanders, 1993; Baskerville, 1994; Brock and Brock, 2001). These rocks include the Fordham Gneiss, Manhattan Schist, Hartland Formation, Ravenswood Granodiorite, Inwood Marble, and the Walloomsac Formation (Merguerian, 2008a, b). Regionally, the bedrock geology consists of numerous fault-bounded accreted terranes that formed during construction of the Pangea supercontinent (Jaret and others, 2021).
The Hartland Formation is commonly migmatitic and consists of schist, gneiss, granofels, and amphibolite. It underlies most of the central and southern parts of Manhattan and the eastern part of the Bronx and is of Cambrian (?) to Ordovician age (Baskerville, 1982, 1994; Merguerian and Baskerville, 1987; Taterka, 1987). The Manhattan Formation is the major rock unit exposed in the highlands of northern Manhattan and consists of schist, gneiss, and migmatite. The Walloomsac Formation of Middle Ordovician age is present with the Inwood Marble in southern and northern Manhattan and the Bronx (Merguerian and Moss, 2006, 2007).
Manhattan bedrock is overlain by Holocene sediments and Pleistocene glacial deposits, except in a few areas in the northern part and Central Park where bedrock outcrops are dominant. Deep, glacially eroded valleys are present in southern Manhattan and in the vicinity of 125th Street in northern Manhattan. In the Bronx, the majority of overburden is thin except in isolated bedrock valleys. These sediments consist of gravel, sand, silt, and clay (Perlmutter and Arnow, 1953; Stumm, 2005).
The Inwood Marble crops out in northern Manhattan and the Bronx, underlies parts of the Harlem River, weathers easily, and is of Cambrian and Ordovician age (Merguerian and Baskerville, 1987). The Fordham Gneiss is the oldest rock formation in New York City and is an assemblage of granitoid and metasedimentary rocks of middle Proterozoic age that is exposed in the Bronx and present in the subsurface in southeastern Manhattan, the East River, and western Queens and Brooklyn (Brock and others, 2001). A middle Proterozoic orthogneiss facies of the Fordham Gneiss informally referred to as the Queens tunnel complex is exposed in the water tunnel that underlies central Queens (Brock and others, 2001).
Rock units on Staten Island consist of younger Triassic-Jurassic sedimentary conglomerates and arkoses, siltstone, and shale (Newark Supergroup) surrounding the Palisades diabase of Jurassic age in the western part of the island (Miller, 1970; Soren, 1988; Rosenberg, 2013). The Staten Island Serpentinite dominates the central part of the island and was first described by Mather (1843) and more recently studied by Behm (1954), Miller (1970), Okulewicz (1979, 1990), and Soren (1988). Several other smaller serpentinite bodies have been mapped throughout the study area and are interpreted as ophiolitic and found in ductile faults in contact with enclosing Hartland rocks or near the Manhattan-Hartland contact (Merguerian, 1979). Hartland Formation bedrock underlies the eastern part of the island (Miller, 1970). Pleistocene- and Cretaceous-age sediments locally overlie the bedrock on Staten Island, mainly in the southern part of the island (Soren, 1988; Rosenberg, 2013).
On Long Island within Kings and Queens Counties, the Ravenswood Granodiorite and Fordham Gneiss, present in the westernmost parts of the area, are in contact with the Hartland Formation, which underlies most of this area. The Ravenswood Granodiorite and Fordham Gneiss crops out in northwestern Queens County (Baskerville and Mose, 1989). The top of bedrock dips gently to the southeast under Long Island and is overlain by unconsolidated coastal-plain sediments of Pleistocene and Cretaceous age that include important aquifer units (Stumm and others, 2002).
Several major faults trending from northwest to southeast have been mapped on Manhattan (Berkey, 1909; Baskerville, 1994). Several northwest-trending brittle faults in Manhattan, including the 125th Street fault, are believed to control the shape and extent of buried valleys (Merguerian 2002, 2015). Analysis of faults detected in 53 test boreholes in southern Manhattan by Stumm (2005) indicated most had north-northwest strikes roughly parallel to the larger faults mapped on Manhattan (Berkey, 1909; Baskerville, 1994; Stumm, 2005).
The bedrock underlying the study area ranges from easily weathered (Inwood Marble) to very resistant (Manhattan Schist, Fordham Gneiss). This differential weathering susceptibility, along with the numerous north-northwest-trending faults, is thought to control the shape of the bedrock surface underlying the study area. Multiple glacial advances and subsequent scouring of the bedrock during the Pleistocene is the most recent control on the topography of the bedrock surface (Sanders and Merguerian, 1994, 1995).
Database and Methods
The bedrock elevation database consists of over 14,000 points across Bronx, Kings, New York, Queens, Richmond, Suffolk, and Nassau Counties (DeMott and others, 2023b). Bedrock elevation at each point was adjusted to the North American Vertical Datum of 1988 (NAVD 88), and depth to bedrock was obtained by subtracting the bedrock elevation from the surface elevation at each point. Raster surfaces for bedrock elevation and depth to bedrock were then generated from these data and from additional interpretive sources by using the Spatial Analyst tools available as an ArcGIS Pro (Esri) extension.
Sources of Data
Bedrock elevation was obtained from test boreholes for construction of bridges, tunnels, and buildings; water and monitoring wells; surface outcrops; marine seismic-reflection profiles; and HVSR soundings. Data were compiled from numerous sources, both published and previously unpublished; these sources and specific references are provided in an accompanying USGS data release (DeMott and others, 2023b). For some data points, sources providing the information requested that, for security purposes, the originator of the data be kept confidential; the source for these data points is listed in the data release as “NYC DDC” with an accompanying reference of “Proprietary data.” All data were converted from the reported original elevation datum of the borough to NAVD 88 where necessary. For marine seismic-reflection profiles collected primarily in the East River, the top of bedrock was interpreted based on seismic reflection characteristics in two-way travel time, and individual points from this bedrock horizon were extracted from the seismic profiles. Depth to bedrock was then obtained by converting two-way travel time (an average of 5,000 feet per second for glacial sediments [Stumm and others, 2002] was used and verified at several control points) to depth below sea level, and the resulting depth was then subtracted from the surface elevation to obtain bedrock elevation. Overburden thickness was estimated from the HVSR soundings by using an empirical relation established between measured resonance frequencies and depths to bedrock at nearby wells in Queens, Suffolk, and Nassau Counties (DeMott and others, 2023a). Measurements for 15 wells with known depths to bedrock (fig. 1) were used to develop a power-law regression equation (R2 = 0.8373) that relates the resonance frequency (fr) to the depth of bedrock (Z), in feet, as follows:
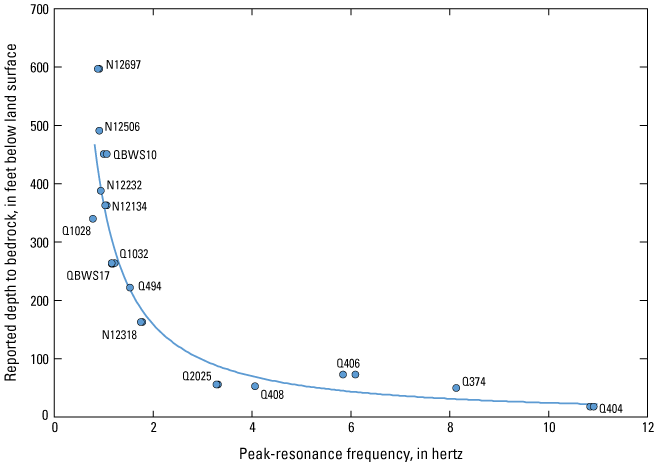
Regression of peak-resonance frequencies from horizontal-to-vertical spectral ratio measurements with reported depths to bedrock at 15 wells in Queens, Suffolk, and Nassau Counties in New York. Blue dots indicate reported depth to bedrock from each well used in the regression (two measurements taken at each well site) (DeMott and others, 2023a).
For each site, resonance frequencies from 1 to 3 HVSR measurements were averaged, then subtracted from the surface elevation to obtain bedrock elevation. Borehole, well, and outcrop data were all provided as bedrock elevation data.
Surface elevation for the area was obtained by mosaicking three topobathymetric models: the 2016 USGS Coastal National Elevation Database (CoNED) topobathymetric model: New England; the 2015 USGS CoNED topobathymetric model: New Jersey and Delaware; and the 2017 New York City topobathy light detection and ranging (lidar) digital elevation model (DEM): New York. All three DEMs have an original cell size of 1 meter (m), with vertical accuracy ranging from 3.8 centimeters (cm) (approximately [~] 1.5 inch) to 50 cm (~1.64 foot [ft]). The final DEM was resampled to a cell size of 100 ft (30.48 m) to correspond with the cell size of the bedrock elevation raster. Overburden thickness was determined for each point in the database by extracting the surface elevation from the DEM, then subtracting the bedrock elevation from the surface elevation. An overburden thickness raster was then calculated by subtracting the bedrock-surface elevation raster from the lidar elevation.
Interpolation of Data
The bedrock data were interpolated by using an iterative finite difference interpolation technique developed for elevation surfaces in ArcGIS Pro (Topo to Raster toolbox). Topo to Raster has been demonstrated to represent input data more accurately than other interpolation methods (for example, Salekin and others, 2018; Chetty and Tesfamichael, 2021). The interpolation tool allows for the use of both point and contour elevation data as inputs and allows additional geological constraints to customize sinks and drainages to create a hydrologically correct digital elevation model, as opposed to other interpolation methods that are less easily customizable. This method was chosen after comparing outputs from Topo to Raster, Natural Neighbor, and geostatistical kriging tools (simple, ordinary, universal, and empirical Bayesian) available in ArcGIS pro using a Python Jupyter Notebook. The notebook runs each interpolation model, then uses a percentage of the original data points (90 percent, for this model) to create a “training” surface, then compares that surface to the remaining “testing” data to examine error with respect to the original point elevation dataset. The Topo to Raster toolbox produced the lowest mean and median training error of all tested interpolation methods and also produced a more realistic looking surface.
To create a geologically realistic elevation surface, point elevation data were combined with published bedrock elevation contours (Stanford, 1993, 1995, 2002a, b), interpretive stream features to define drainages along valleys and faults, and interpretive contours in areas of sparse point data coverage. Where the output interpolation produced values higher than that of surface elevation in areas of sparse point data and shallow depths to bedrock (primarily on the north-central region of Staten Island, the northeastern areas of the Bronx, and areas of Manhattan near the Hudson and East Rivers), the interpolated raster was adjusted to equal surface elevation. The output rasters were interpolated to a cell size of 100 ft x 100 ft based on spatial resolution of the point elevation dataset, where the areas of densest point elevations (Bronx and Manhattan Counties) have an average nearest neighbor distance of ~100 ft. Additional consideration was given to raster development along the eastern limit of the study area to produce a seamless transition with ongoing USGS efforts to refine the bedrock surface elevation for the rest of Long Island (https://www.usgs.gov/centers/new-york-water-science-center/science/groundwater-sustainability-long-island-aquifer-system). Rasters were generated for the full spatial domain of the data, then clipped to each individual borough. Contours at 100-ft intervals were generated from the output rasters and smoothed to match the raster cell size (100 ft) and eliminate square edges along raster pixels by using the Smooth Line tool (ArcGIS Pro) for the final geospatial and map products (figs. 2–13, in back of report, and DeMott and others, 2023b).
Bedrock-Surface Elevation and Overburden Thickness
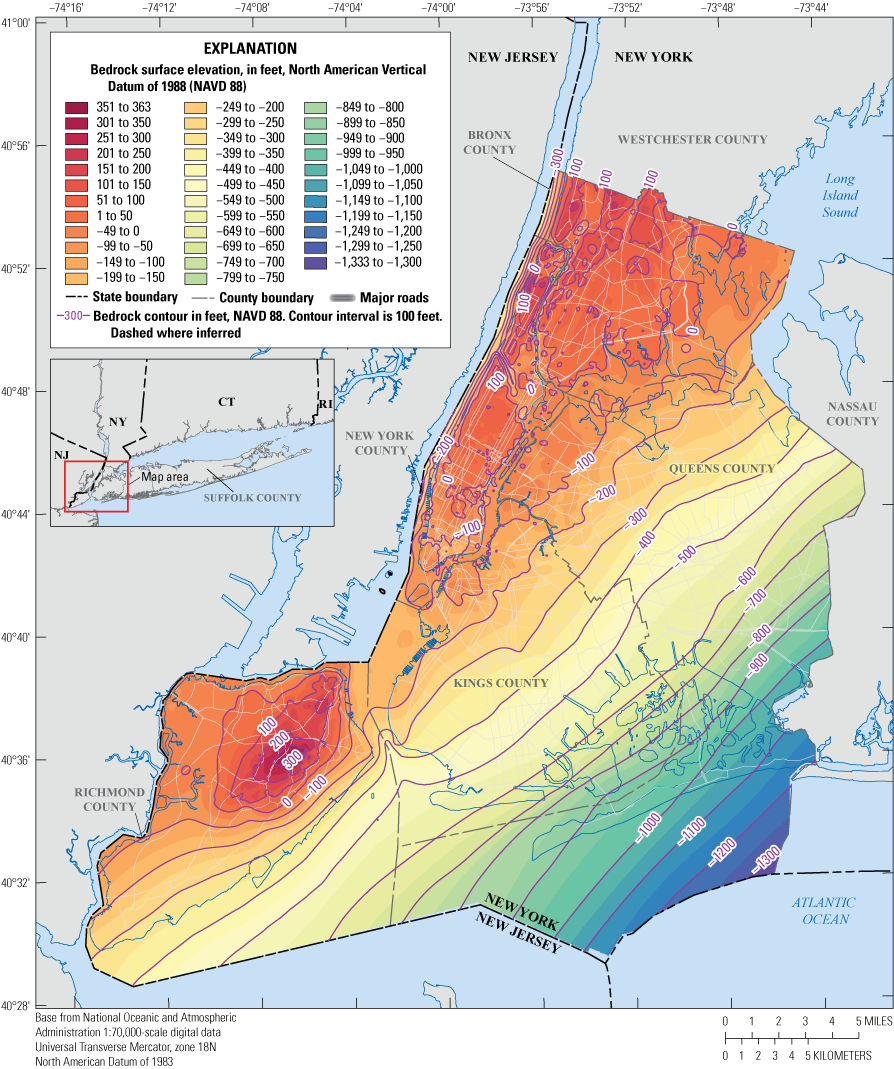
Bedrock elevation and overburden thickness rasters can be used to examine the nature of the bedrock surface across New York City (figs. 2, 8). Broadly, bedrock elevation tends to be higher, and overburden thinner, in Manhattan and the Bronx. The bedrock elevation surface dips to the southeast, with lower elevation and thicker overburden across Brooklyn and Queens.
Bedrock elevation is highest in north-central Staten Island (maximum of about 360 ft above sea level), in northern Manhattan (265 ft above sea level in Bennett Park), and in the northwestern region of the Bronx, corresponding to the areas where bedrock is also at or near the surface (fig. 2). Bedrock is also relatively shallow (50 ft deep or less) throughout most of the Bronx, Manhattan, and Staten Island, including areas along the East River, where high currents can scour down to bedrock (fig. 8).There is a general spatial trend of lower bedrock elevation and thicker overburden to the southeast and of higher elevation and thinner overburden to the northwest; the lowest bedrock elevation in the five boroughs is on the Rockaway Peninsula in southern Queens (about 1,200 ft below sea level). These spatial trends in elevation mirror trends in the surface elevation.
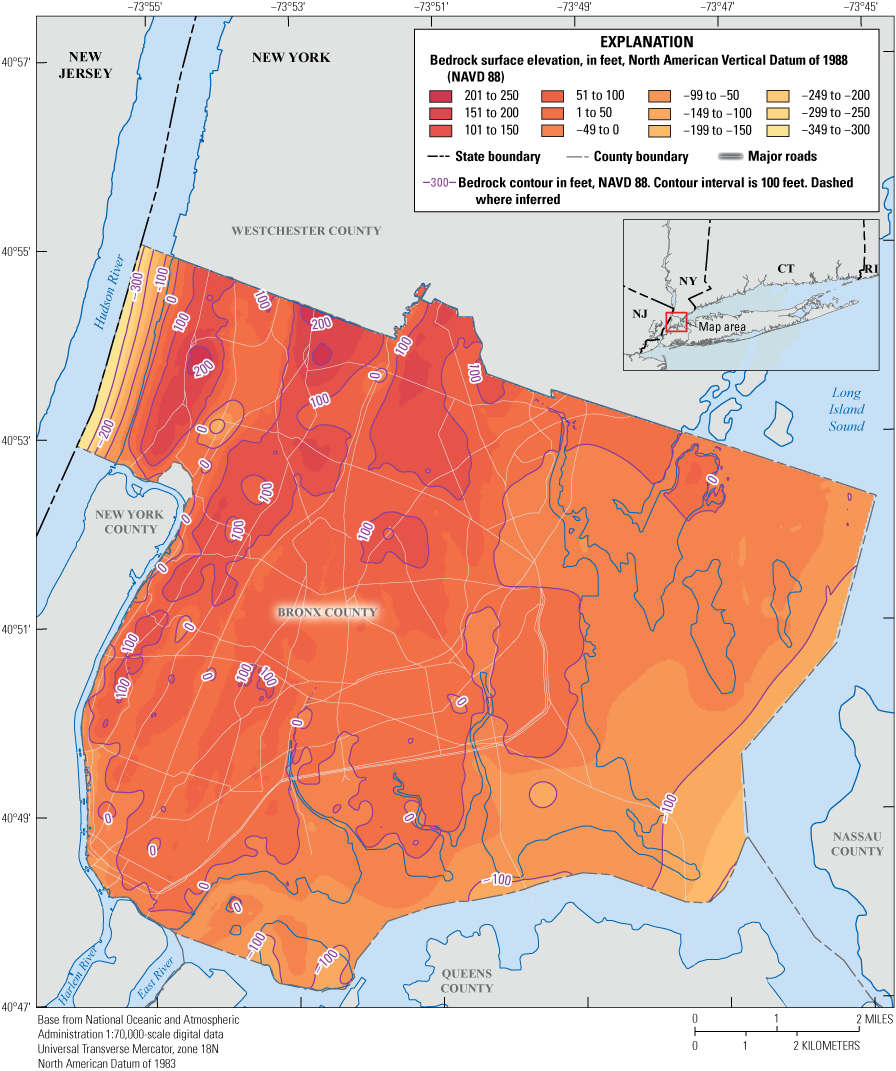
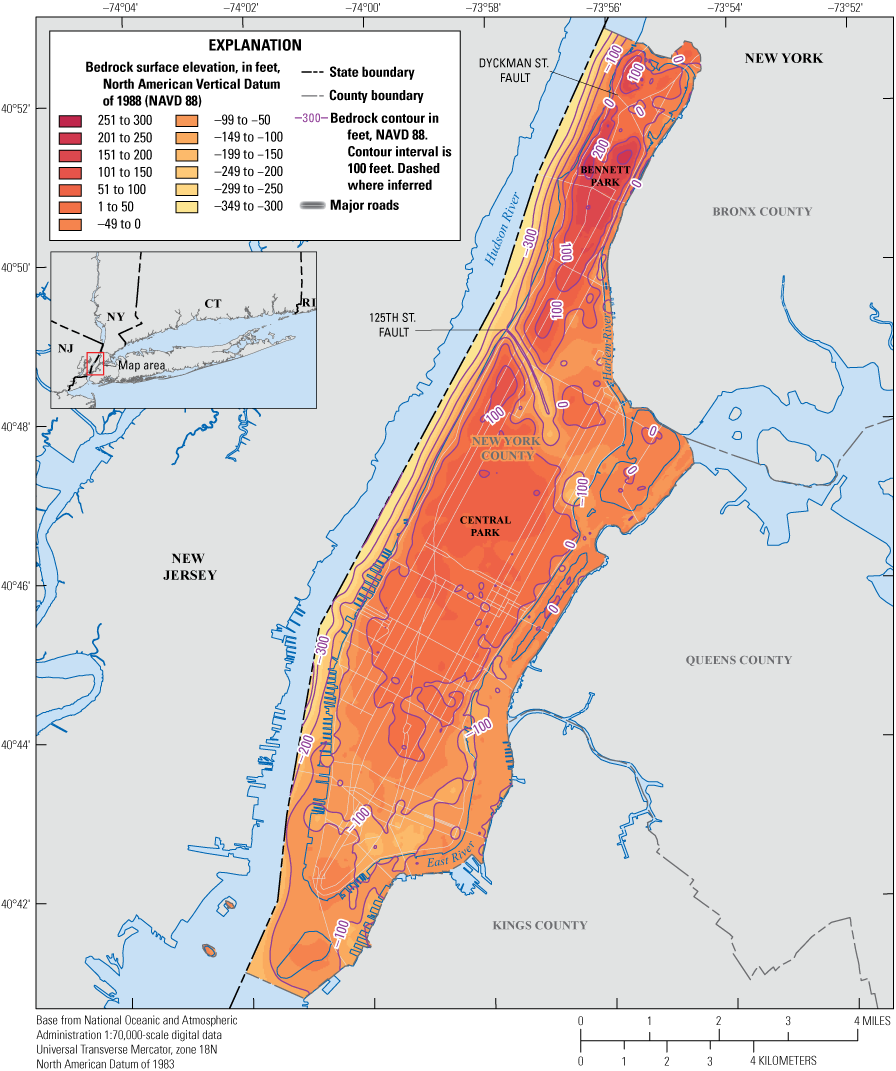
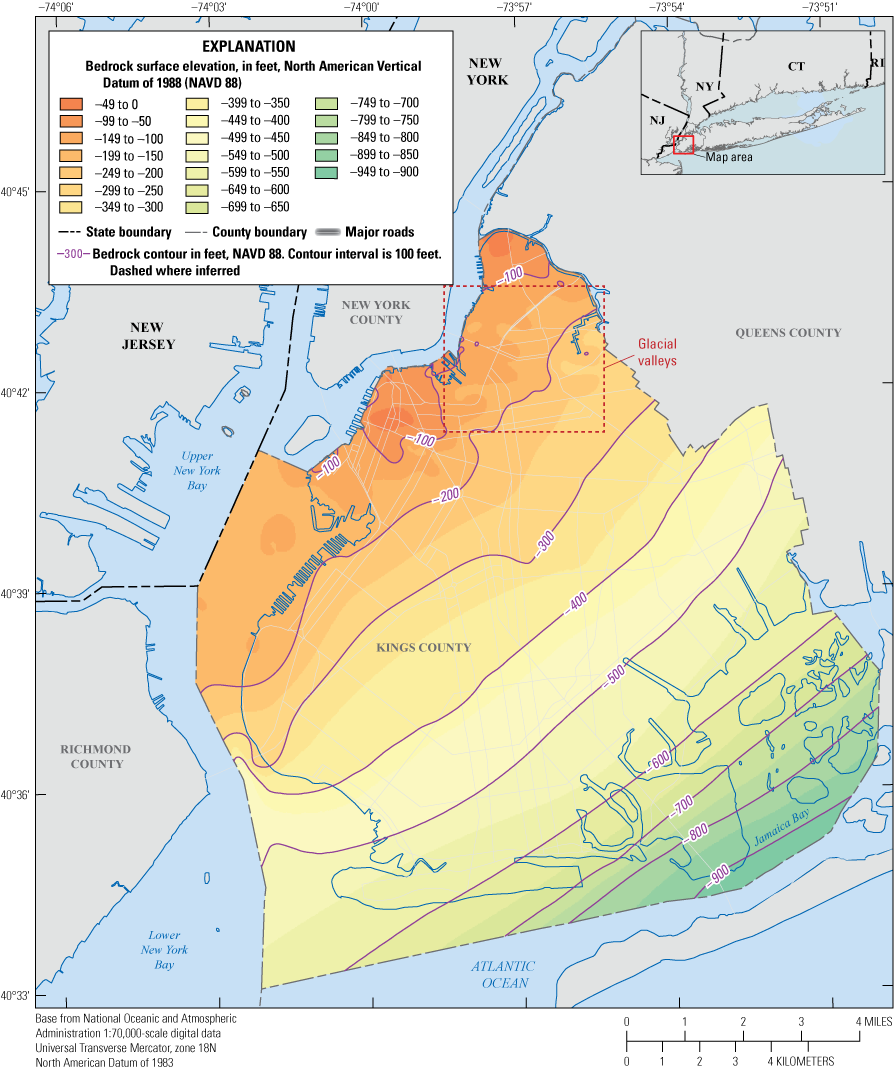
In the northern boroughs of New York City, bedrock elevation is generally high and overburden thickness is low. In Bronx County, bedrock elevation ranges from ~330 ft below sea level in the Hudson River channel to ~230 ft above sea level in the northwestern region of the county (fig. 3), where an elevational high runs parallel to the Hudson channel. The overburden thickness ranges from 300 ft in the Hudson River to 0 ft in numerous areas where bedrock crops out at the surface, including in the East River, parts of Long Island Sound, and other areas scattered throughout the county (fig. 9). Outside of the deep Hudson River channel fill, overburden is generally thin, with an average thickness of 26 ft. A similar range of elevation and overburden thickness is observed in New York County (Manhattan), where elevation ranges from ~335 ft below sea level in the Hudson River channel to ~260 ft above sea level in the northern arm of the island (fig. 4), where a topographic high runs parallel to the river, extending from Bronx County. Linear, topographic lows are observed along the 125th Street and Dyckman Street faults. Overburden thickness ranges from ~310 ft in the Hudson River channel to 0 ft at bedrock outcrops in the northern arm of the island, particularly along the coasts, and along parts of the East River where rapid currents have scoured the channel down to bedrock. Average overburden thickness is ~64 ft (fig. 10).
On Long Island, bedrock elevation is higher to the northwest, near the East River, and dips lower toward the southeast. In Queens County, bedrock elevation ranges from a high point of ~10 ft above sea level to the northwest and reaches the lowest elevation in the study area at ~1,340 ft below sea level to the southeast and offshore (fig. 5), although the southern offshore area is not well constrained by data. Bedrock outcrops are limited to a few small areas along the northern shoreline and in Long Island Sound and the East River. Overburden thickness increases to the south and eventually reaches a maximum of ~1,280 ft to the south on the Rockaway Peninsula, with an average thickness of ~680 ft across Queens County (fig. 11). Kings County exhibits similar trends, but bedrock elevation is overall lower than in Queens County, with a maximum of ~3 ft below sea level along the northeastern county border and a minimum of ~940 ft below sea level to the southeast in Jamaica Bay (fig. 6). Northwest-southeast-oriented topographic valleys, likely caused by glacial scouring, are visible in the higher elevation region to the northeast (referred to as “Glacial valleys” in fig. 6). Overburden thickness also follows the same trend as for Queens County, with the exception that there are no surface outcrops of bedrock in Kings County. Overburden is thinnest along the northern shoreline and reaches a maximum thickness of ~930 ft to the southeast at Jamaica Bay (fig. 12). Average overburden thickness in Kings County is ~450 ft.
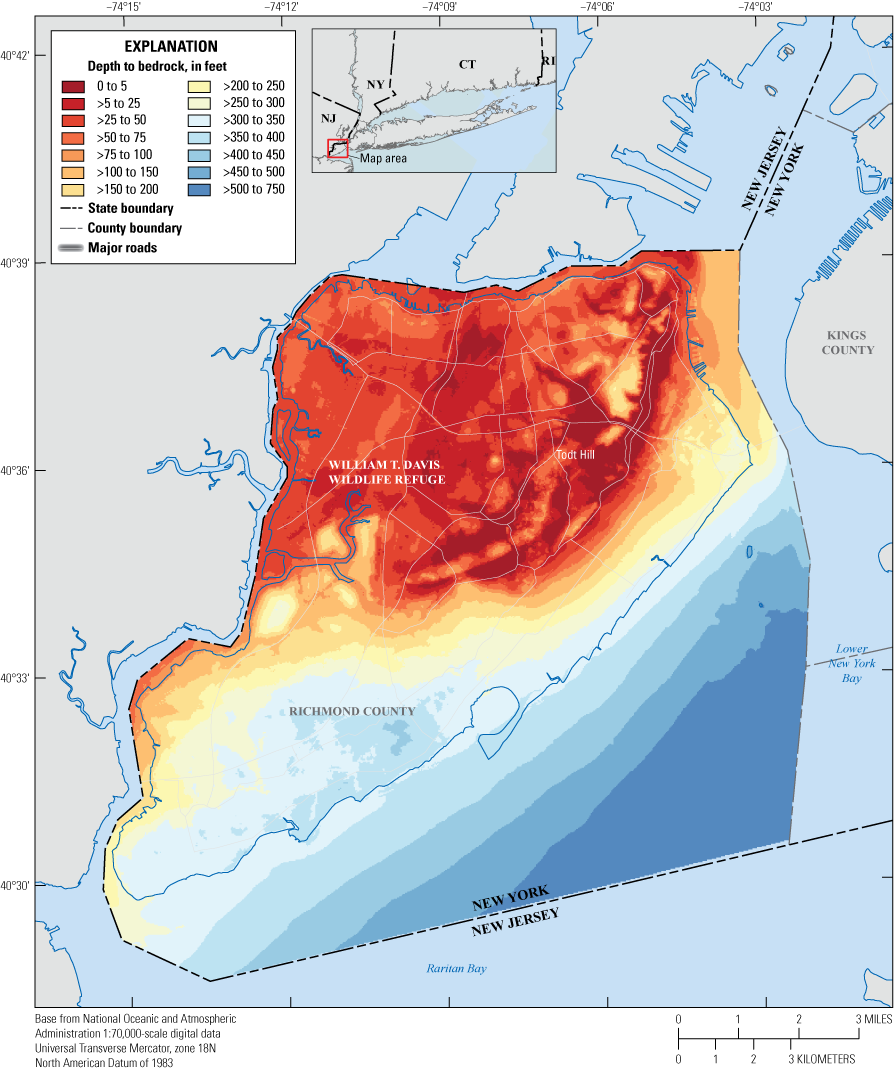
Staten Island (Richmond County) has the highest bedrock elevation in the five boroughs. Bedrock elevation reaches a maximum of ~362 ft above sea level near Todt Hill, in the north-central region of the island (fig. 7). Bedrock elevation is lowest to the southeast, with a minimum elevation of ~680 ft below sea level offshore, in Raritan Bay, although this value is not well constrained by data. Overburden thickness on Staten Island ranges from ~650 ft to 0 ft; overburden is thinnest where serpentinite bedrock crops out in the Todt Hill area and surrounding park lands, as well as in the William T. Davis Wildlife Refuge, along the Palisades Sill, in the west-central part of the island (fig. 13). Overburden becomes thicker in the southern and eastern parts of the island, with the highest values offshore in Raritan Bay.
A comparison of the interpolated surfaces to the original elevation point data inputs was made to assess the accuracy of the surface with respect to the point elevation input. Values for each point were extracted from the bedrock elevation and overburden thickness maps (Extract Multi Values to Points tool in the Spatial Analyst extension, ArcGIS Pro). The original values were then subtracted from the interpolated values to represent the error, and the mean, median, and standard deviation for the interpolation surfaces were calculated. For the bedrock elevation surface, the mean error is −0.97 ft (median error = −0.31 ft, standard deviation = 12.08 ft). For the overburden thickness surface, the mean error is 0.57 ft (median error = 0.10 ft, standard deviation = 13.82 ft).
Limitations
A subset (n=146) of the data points used in the bedrock surface interpolation, originally compiled from Smolensky and others (1990), were used as a proxy for assessment of the uncertainty of the interpolation input data. The subset data were checked against the National Water Information System (NWIS) well database (USGS, 2021), and bedrock elevations were adjusted if necessary and verified based on the original well logs. Differences between the values reported in Smolensky and others (1990) and the verified values are primarily due to the well driller's interpretation of “bedrock.” Some wells have thick layers of saprolite (weathered, noncohesive bedrock) above solid unweathered bedrock; these layers are sometimes referred to as bedrock in drilling reports but do not meet the definition of bedrock used in this study. The median difference between the verified well elevation and the original value was 3 ft (mean difference = 9.7 ft). Of the 146 verified wells, 119 wells had elevations within 10 ft of the value in Smolensky and others (1990).
Although all the points in the dataset could not be independently verified as described above, some data points were adjusted for specific criteria. In some instances, data points obtained from outcrops had bedrock elevations higher than that of the land surface; these data points were adjusted to match the surface elevation from the DEM after examination of the location on satellite imagery to confirm the presence of exposed bedrock. Elevations of other points from borehole or seismic sources that were similarly inconsistent with DEM surface elevations were evaluated independently and either were adjusted to a new elevation or location on the basis of available information (n=311) or were deleted from the database (n=152); duplicate points were also deleted. These differences in elevation are likely due to initial inaccuracies in measurement of the land surface, higher accuracy of the modern DEM than elevation measurements at the time of data collection, and changing land-surface elevation over time due to construction and (or) erosion.
Additional checking and postprocessing of the interpolated bedrock elevation surface was done because of spatial data limitations. In areas where bedrock is probably near the surface (less than 5 ft below land surface) and data points are sparse or absent, interpolated results indicated that the bedrock surface was at a higher elevation than the DEM land surface. These data gaps limit the control on the interpolation performed by the Topo to Raster tool. Although it is possible to set minimum and maximum constraints in the tool, it is not possible to limit the interpolation output so it should always be at or lower than land-surface elevation. Locations where these discrepancies were observed were adjusted through use of the Raster Calculator tool. Pixels with values higher than surface elevation were identified by using Raster Functions (Analysis menu, ArcGIS Pro), first by subtracting the bedrock elevation raster from the surface elevation raster (Minus function). Cells with negative values, indicating bedrock surface higher than land surface, were identified by using the Less Than function. These cells were then set to null (Set Null function), then recalculated to be equal to the surface elevation by mosaicking the surface elevation raster to the bedrock surface (Mosaic to New Raster tool in the Data Management toolbox, ArcGIS Pro), since bedrock is likely to be less than 25 ft below the surface in these areas, but true bedrock elevation is unknown.
Summary
Bedrock elevation and overburden thickness maps presented in this report were created by the U.S. Geological Survey, in cooperation with the New York City Department of Design and Construction, from an extensive database of historical construction test borings, recent exploration drilling boreholes, U.S. Geological Survey observation wells, outcrops, and seismic measurements, combined with published contour data and interpretive features. These map products can assist with future evaluations of hydrogeologic conditions in the city, particularly in evaluating prospective geothermal heat pump installations.
The study area includes a varied topography of exposed bedrock highlands in northern Manhattan, central Staten Island, and parts of the Bronx. On Long Island, bedrock crops out in a few isolated areas in northwestern Queens County. Most of the study area’s bedrock is covered in unconsolidated sedimentary overburden of Pleistocene and (or) Cretaceous age with a thickness ranging from a few feet to over a thousand feet.
The bedrock underlying the study area was previously mapped as a structurally complex assemblage of high-grade metamorphic rocks, which includes gneiss, schist, amphibolite, marble, granite, and serpentinite. These rocks include the Fordham Gneiss and correlative Queens tunnel complex, Manhattan Schist, Hartland Formation, Inwood Marble, Ravenswood Granodiorite, and the Walloomsac Formation.
The bedrock underlying the study area ranges from easily weathered (Inwood Marble) to very resistant to weathering (Manhattan Schist, Fordham Gneiss). This differential susceptibility to erosion along with the numerous north-northwest-trending faults is thought to control the shape of the bedrock surface underlying the study area. Glacial scouring of the bedrock during the Pleistocene is the most recent control on the bedrock surfaces mapped.
The bedrock elevation database consists of over 14,000 points across Bronx, Kings, New York, Queens, Richmond, Suffolk, and Nassau Counties. Bedrock elevation at each point was adjusted to the North American Vertical Datum of 1988, and depth to bedrock was obtained by subtracting the bedrock elevation from the surface elevation at each point. Rasters for bedrock elevation and depth to bedrock were then generated from these data and additional interpretive sources by using ArcGIS Pro spatial analysis tools.
Bedrock elevation was obtained from test boreholes for construction of bridges, tunnels, and buildings; water and monitoring wells; surface outcrops; marine seismic reflection profiles; and horizontal-to-vertical spectral ratio soundings.
The bedrock elevation data were interpolated by using an iterative finite difference interpolation technique developed for elevation surfaces in ArcGIS Pro. The interpolation tool allows for multiple types of input data and additional geological constraints to customize sinks and drainages to create a hydrologically correct digital elevation model.
Surface elevation for the area was obtained by merging three topobathymetric models. Depth to bedrock was acquired for each point in the database by extracting the surface elevation from the digital elevation model, then subtracting the bedrock elevation from the surface elevation. The overburden thickness raster was then calculated by subtracting the bedrock-surface elevation raster from the land-surface lidar elevation. The output rasters were interpolated to a cell size of 100 feet, based on spatial resolution of the dataset. Rasters were generated for the full dataset, then clipped to each individual borough. Contours at 100-foot intervals were generated from the output rasters and smoothed for the final geospatial and map products.
Bedrock elevation is highest in north-central Staten Island (maximum of about 360 feet above sea level), northern Manhattan, and the northwestern region of the Bronx. There is a general spatial trend of lower bedrock elevation to the southeast and higher elevation to the northwest, with the lowest bedrock elevation in the five boroughs in the Rockaway Peninsula in southern Queens (about 1,200 feet below sea level).
Bedrock elevation for the five boroughs (Bronx [Bronx County], Manhattan [New York County], Queens [Queens County], Brooklyn [Kings County], and Staten Island [Richmond County]) of New York City, New York.
Bedrock elevation of the Bronx (Bronx County), New York.
Bedrock elevation of Manhattan (New York County), New York.
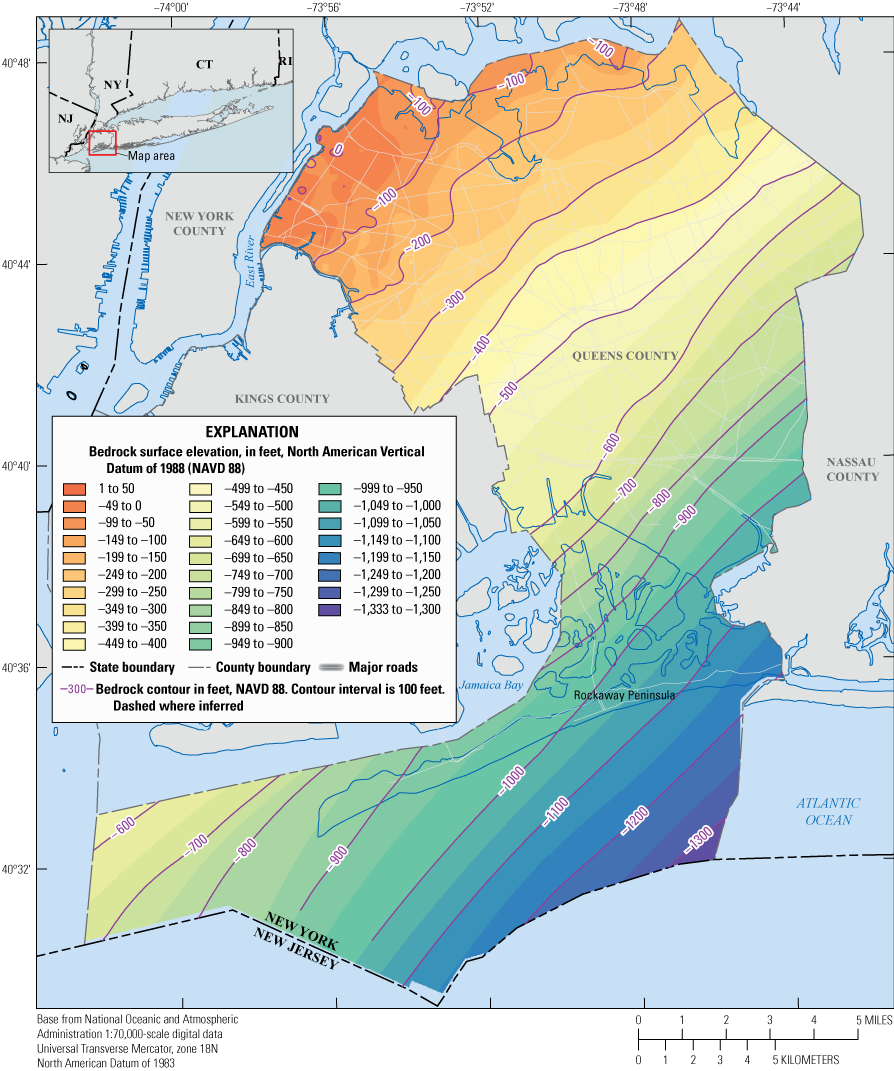
Bedrock elevation of Queens (Queens County), New York.
Bedrock elevation of Brooklyn (Kings County), New York.
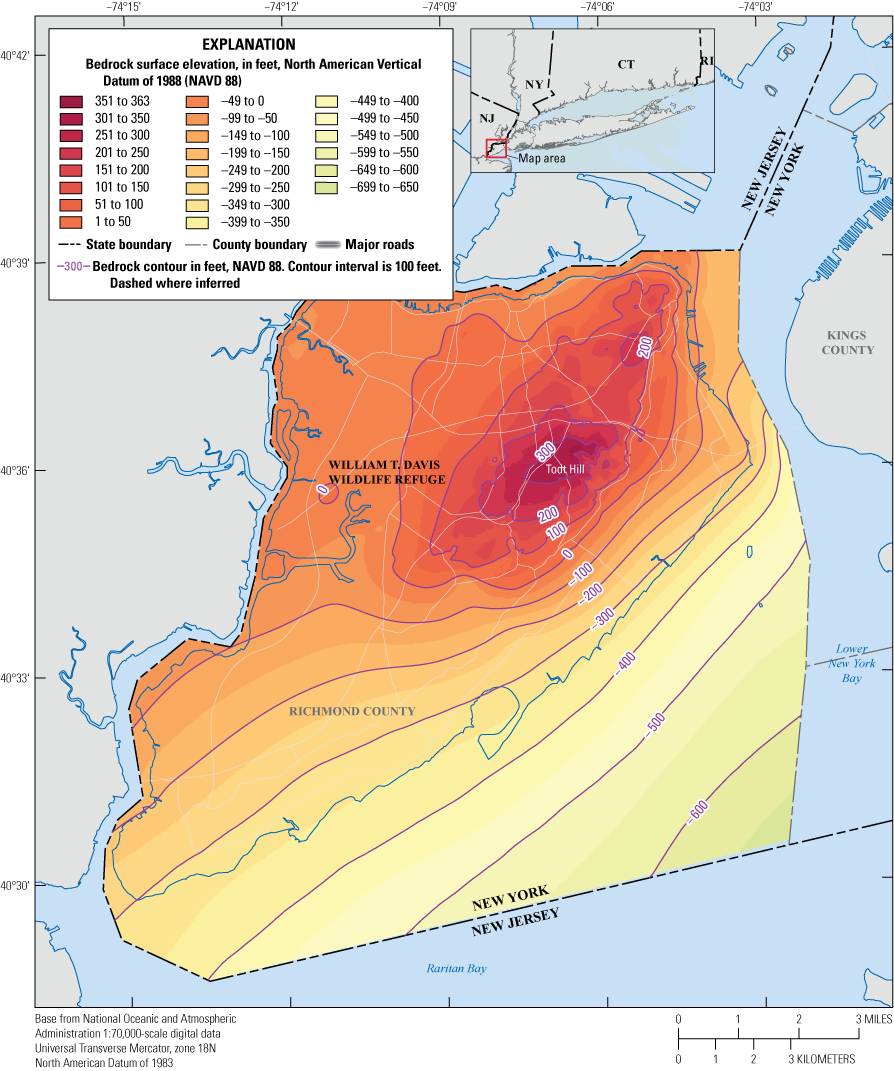
Bedrock elevation of Staten Island (Richmond County), New York.
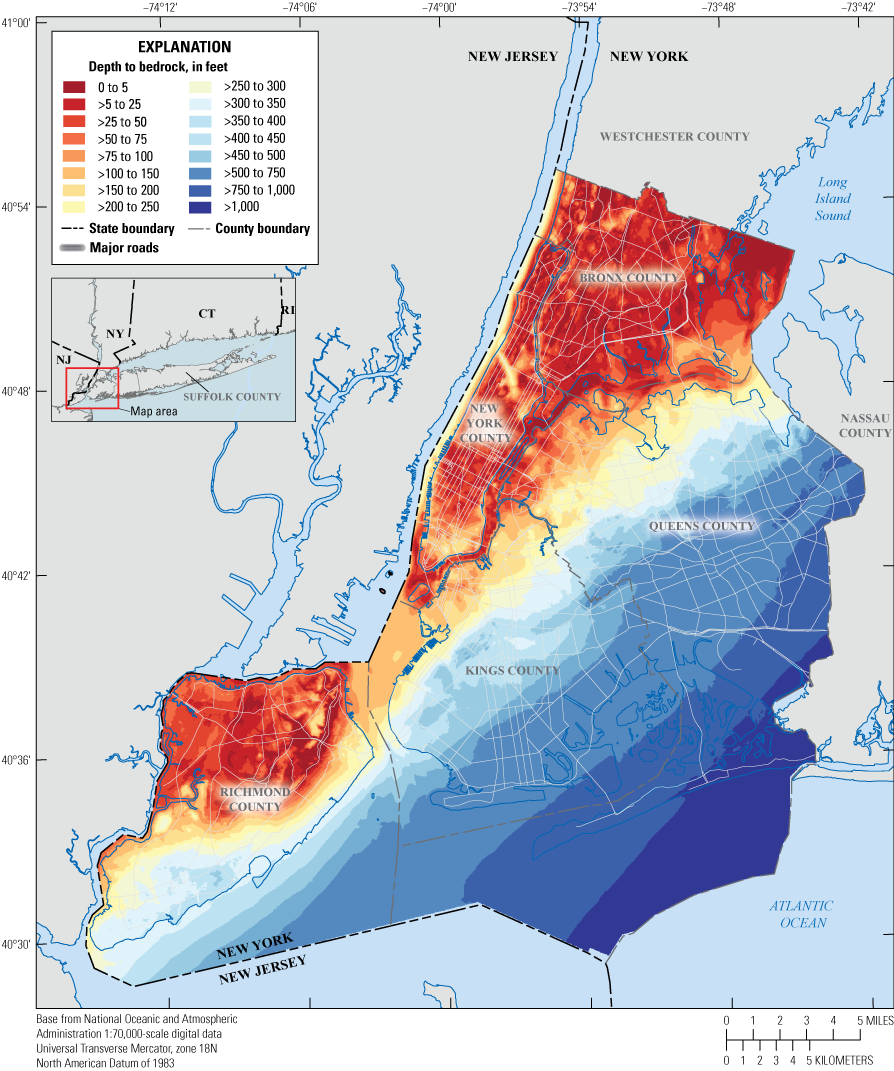
Overburden thickness of the five boroughs (Bronx [Bronx County], Manhattan [New York County], Queens [Queens County], Brooklyn [Kings County], and Staten Island [Richmond County] of New York City, New York.
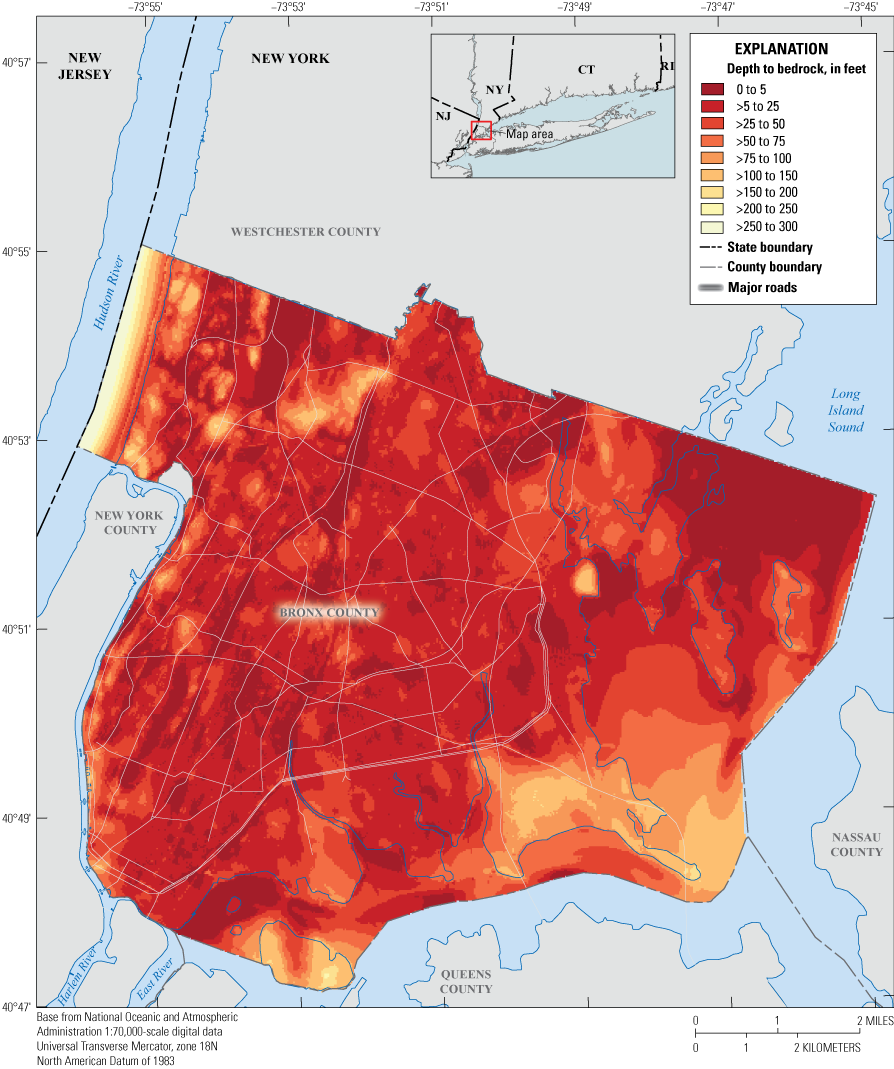
Overburden thickness of the Bronx (Bronx County), New York.
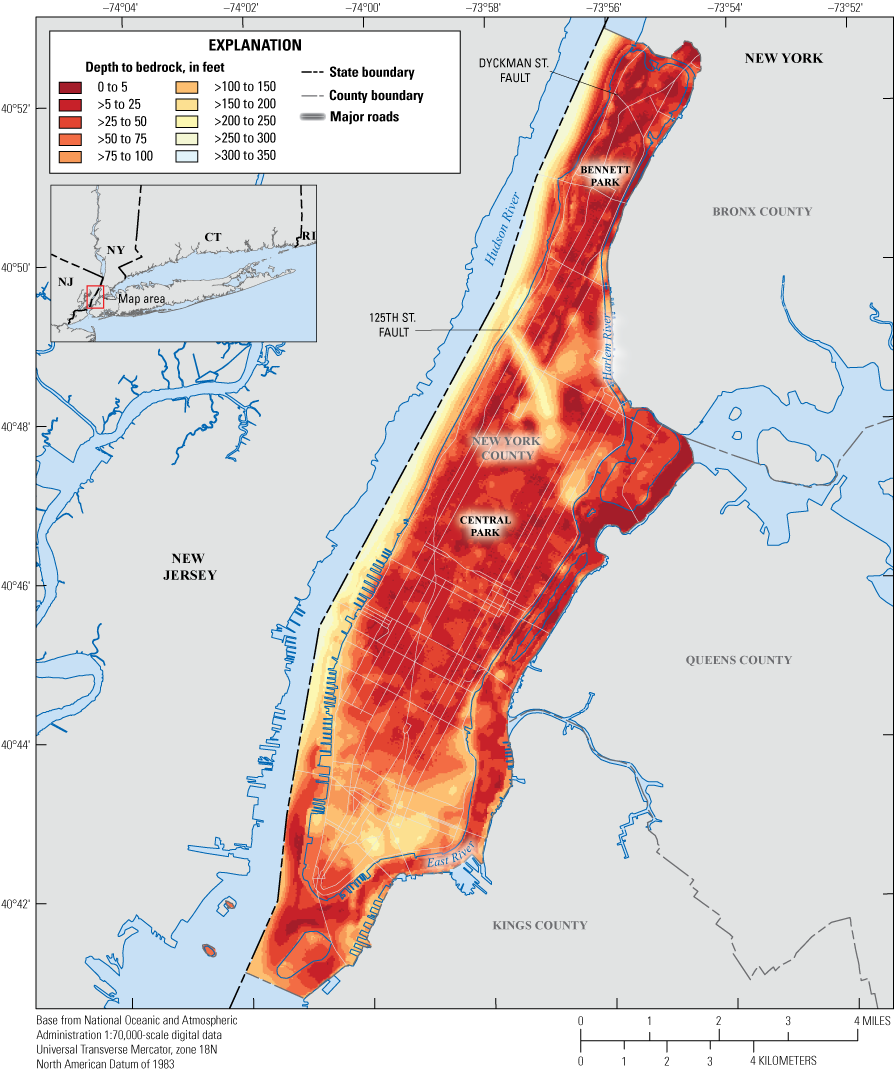
Overburden thickness of Manhattan (New York County), New York.
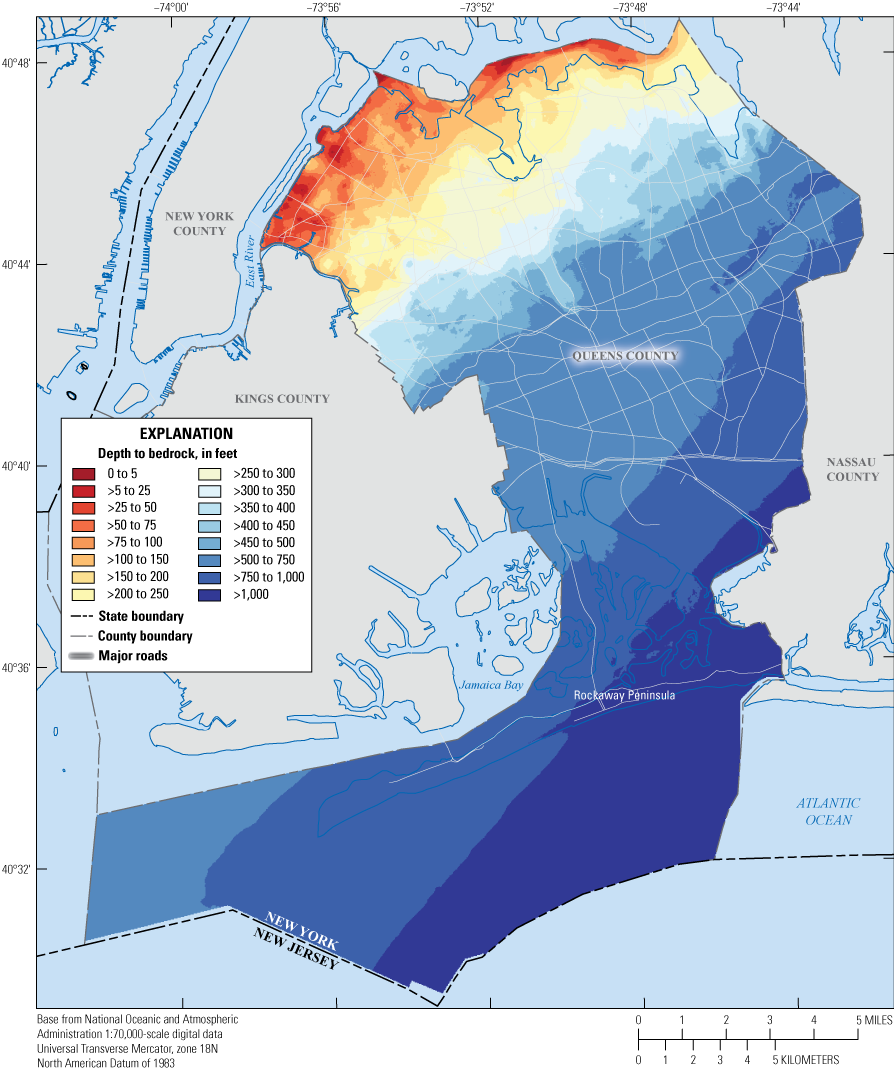
Overburden thickness of Queens (Queens County), New York.
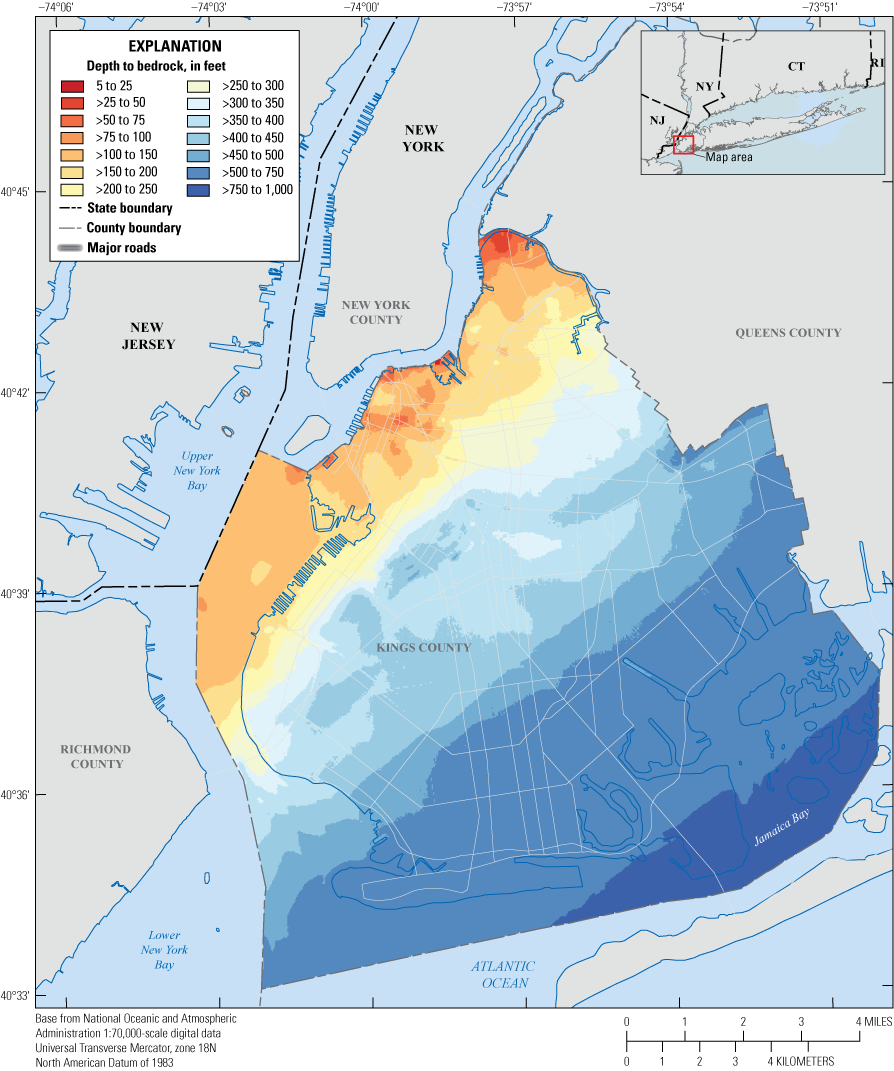
Overburden thickness of Brooklyn (Kings County), New York.
Overburden thickness of Staten Island (Richmond County), New York.
References Cited
Baskerville, C.A., 1982, The foundation geology of New York City, in Legget, R.F., ed., Geology under cities: Boulder, Colo., Geological Society of America, p. 95–117. [Also available at https://doi.org/10.1130/REG5-p95.]
Baskerville, C.A., 1994, Bedrock and engineering geologic maps of New York County and parts of Kings and Queens Counties, New York, and parts of Bergen and Hudson Counties, New Jersey: U.S. Geological Survey Miscellaneous Investigation Series Map I–2306, scale 1:24,000, 2 sheets, accessed April 20, 2022, at https://doi.org/10.3133/i2306.
Berkey, C.P., 1909, Areal and structural geology of southern Manhattan Island: Annals of the New York Academy of Sciences, v. 19, no. 1, p. 247–282. [Also available at https://doi.org/10.1111/j.1749-6632.1909.tb56920.x.]
Breault, R.F., Masterson, J.P., Schubert, C.E., and Herdman, L.M., 2021, Managing water resources on Long Island, New York, with integrated, multidisciplinary science: U.S. Geological Survey Fact Sheet 2021–3044, 4 p., accessed February 24, 2022, at https://doi.org/10.3133/fs20213044.
Brock, P.J.C., and Brock, P.W.G., 2001, Bedrock geology of New York City—More than 600 m.y. of geologic history: Stony Brook University Department of Geosciences web page, accessed February 2022 at https://pbisotopes.ess.sunysb.edu/reports/ny-city/.
Brock, P.C., Brock, P.W.G., and Merguerian, C., 2001, The Queens Tunnel Complex—A newly discovered granulite facies Fordham orthogneiss complex that dominates the subsurface of western Queens, in Eighth Annual Conference on Geology of Long Island and Metropolitan New York, Stony Brook, N.Y., April 21, 2001 [Proceedings]: State University of New York at Stony Brook, Long Island Geologists Program with Abstracts, 128 p., accessed February 2022 at https://sites.hofstra.edu/charles-merguerian/wp-content/uploads/sites/89/2019/11/PBPBCM2001_QueensTunnelComplex.pdf.
Chetty, P., and Tesfamichael, S., 2021, A comparison of interpolation techniques in producing a DEM from the 5 m National Geospatial Institute (NGI) contours: Proceedings of the 7th International Conference on Geographical Information Systems Theory, Applications and Management (GISTAM 2021), p. 37–47, accessed June 2022 at https://doi.org/10.5220/0010525100370047.
Cozzens, I., Jr., 1843, A geological history of Manhattan or New York Island: New York, W.E. Dean, 114 p., accessed February 2022 at http://resource.nlm.nih.gov/60741070R.
DeMott, L.M., Stumm, F., Como, M., and Finkelstein, J., 2023a, Horizontal-to-vertical spectral ratio soundings and depth-to-bedrock data for bedrock surface elevation of the five boroughs, New York City, New York: U.S. Geological Survey data release, https://doi.org/10.5066/P9S7Q68D.
DeMott, L.M., Stumm, F., and Finkelstein, J., 2023b, Geospatial data for bedrock surface elevation of the five boroughs, New York City, New York: U.S. Geological Survey data release, https://doi.org/10.5066/P911CSI3.
DeMott, L.M., Stumm, F., and Monti, J., 2023c, Continuous marine seismic-reflection surveys and derived depth-to-bedrock point data from the East River, New York City, New York: U.S. Geological Survey data release, https://doi.org/10.5066/P9O24NP7.
Hobbs, W.H., 1905, The configuration of the rock floor of Greater New York: U.S. Geological Survey Bulletin 270, 96 p., accessed February 1, 2022, at https://doi.org/10.3133/b270.
Jaret, S.J., Tailby, N.D., Hammond, K.G., Rasbury, E.T., Wooton, K., Ebel, D.S., DiPadova, E., Smith, R., Yuan, V., Jaffe, N., Smith, L.M., and Spaeth, L., 2021, Geology of Central Park, Manhattan, New York City, USA—New geochemical insights, in Florsheim, J., Koeberl, C., McKay, M.P., and Riggs, N., eds., Field excursions from the 2021 GSA section meetings: Geological Society of America Field Guide 61, p. 21–34, accessed February 2022 at https://doi.org/10.1130/2020.0061(02).
Kemp, J.F., 1887, The geology of Manhattan Island [N.Y.]: Transactions of the New York Academy of Sciences, v. 7, p. 49–64, accessed February 2022 at https://doi.org/10.1111/j.2164-0947.1887.tb02097.x.
Merguerian, C., 2002, Brittle faults of the Queens Tunnel Complex—NYC water tunnel #3, p. 63–73 in Hanson, G.N., Ninth Annual Conference on Geology of Long Island and Metropolitan New York, Stony Brook, N.Y., April 20, 2002, [Proceedings]: State University of New York at Stony Brook, Long Island Geologists Program with Abstracts, 116 p.
Merguerian, C., 2008b, Geological controls on means and methods of hard rock excavation, New York City, NY, in Gorring, M.L., ed., Environmental and Engineering Geology of Northeastern New Jersey, Geological Society of New Jersey XXV Annual Conference Proceedings, Montclair, N.J., October 17–18, 2008: Geological Association of New Jersey, p. 79–109.
Merguerian, C., 2015, Review of New York City bedrock with a focus on brittle structures, in Herman, G.C. and Macaoay, F.S., eds., Neotectonics of the New York Recess, 32nd Annual Conference and Field Trip, Geological Association of New Jersey Guidebook, Easton, Pa., October 16–17, 2015: Geological Association of New Jersey, p. 17–67.
Merguerian, C., and Baskerville, C.A., 1987, Geology of Manhattan Island and the Bronx, New York City, New York, in Roy, D.C., ed., Northeastern Section of the Geological Society of America Centennial Field Guide volume 5: Boulder, Colo., Geological Society of America, p. 137–140. [Also available at https://doi.org/10.1130/0-8137-5405-4.137.]
Merguerian, C., and Moss, C.J., 2006, Structural implications of Walloomsac and Hartland rocks displayed by borings in southern Manhattan, in Hanson, G.N., Thirteenth Annual Conference on Geology of Long Island and Metropolitan New York, Stony Brook, N.Y., April 22, 2006, [Proceedings]: State University of New York at Stony Brook, Long Island Geologists Program with Abstracts, 12 p., accessed February 2022 at https://www.geo.sunysb.edu/lig/Conferences/abstracts06/merguerian-06.pdf.
Merguerian, C., and Moss, C.J., 2007, Newly discovered serpentinite bodies associated with the St. Nicholas thrust zone in northern Manhattan, in Hanson, G.N., Fourteenth Annual Conference on Geology of Long Island and Metropolitan New York, Stony Brook, N.Y., April 14, 2007, [Proceedings]: State University of New York at Stony Brook, Long Island Geologists Program with Abstracts, 13 p., accessed February 2022 at https://www.geo.sunysb.edu/lig/Conferences/abstracts07/abstracts/merguerian-07.pdf.
Merrill, F.J.H., 1890, On the metamorphic strata of southeastern New York: American Journal of Science, v. s3–39, no. 233, p. 383–392, accessed February 2022 at https://doi.org/10.2475/ajs.s3-39.233.383.
Paino, T., Posner, A., and Wan, W., eds., 2012, Geothermal heat pump manual—A design and installation guide for New York City: New York City Department of Design and Construction, 239 p. [Also available at https://www1.nyc.gov/site/ddc/resources/publications.page.]
Salekin, S., Burgess, J.H., Morgenroth, J., Mason, E.G., and Meason, D.F., 2018, A comparative study of three non-geostatistical methods for optimising digital elevation model interpolation: ISPRS International Journal of Geo-Information, v. 7, no. 8, 15 p., accessed April 20, 2022, at https://doi.org/10.3390/ijgi7080300.
Sanders, J.E., and Merguerian, C., 1994, The glacial geology of New York City and vicinity, in A.I. Benimoff, ed., The geology of Staten Island, New York, Geological Association of New Jersey, XI Annual Meeting, Somerset, N.J., October 14–15, 1994, Field guide and Proceedings: Geological Association of New Jersey, p. 93–200.
Smolensky, D.A., Buxton, H.T., and Shernoff, P.K., 1990, Hydrologic framework of Long Island, New York: U.S. Geological Survey Hydrologic Investigations Atlas 709, 3 sheets, scale 1:250,000. [Also available at https://doi.org/10.3133/ha709.]
Soren, J., 1988, Geologic and geohydrologic reconnaissance of Staten Island, New York: U.S. Geological Survey Water-Resources Investigations Report 87–4048, 22 p., 4 pls. [Also available at https://doi.org/10.3133/wri874048.]
Stanford, S.D., 1993, Surficial geology of the Weehawken and Central Park Quadrangles, Bergen, Hudson, and Passaic Counties, New Jersey: New Jersey Geological Survey Open-File Map 13, 1 sheet, scale 1:24,000, accessed February 2022 at https://www.nj.gov/dep/njgs/pricelst/ofmaps.htm.
Stanford, S.D., 1995, Surficial geology of the Jersey City Quadrangle, Hudson and Essex Counties, New Jersey: New Jersey Geological Survey Open-File Map 20, 1 sheet, scale 1:24,000, accessed February 2022 at https://www.nj.gov/dep/njgs/pricelst/ofmaps.htm.
Stanford, S.D., 2002a, Surficial geology of the Elizabeth Quadrangle, Essex, Hudson, and Union Counties, New Jersey: New Jersey Geological Survey Open-File Map 42, 1 sheet, scale 1:24,000, accessed February 2022 at https://www.nj.gov/dep/njgs/pricelst/ofmaps.htm.
Stanford, S.D., 2002b, Surficial geology of the Yonkers and Nyack Quadrangles, Bergen County, New Jersey: New Jersey Geological Survey Open-File Map 50, 1 sheet, scale 1:24,000, accessed February 2022 at https://www.nj.gov/dep/njgs/pricelst/ofmaps.htm.
Stumm, F., 2001, Hydrogeology and extent of saltwater intrusion of the Great Neck Peninsula, Great Neck, Long Island, New York: U.S. Geological Survey Water-Resources Investigations Report 99–4280, 41 p. [Also available at https://doi.org/10.3133/wri994280.]
Stumm, F., 2005, Delineation of the fractured-rock and unconsolidated overburden ground-water flow systems, on the southern part of Manhattan, New York, through use of advanced borehole-geophysical techniques: New York, City University of New York Graduate Center, Ph.D. dissertation, 144 p. [Also available at https://academicworks.cuny.edu/gc_etds/3895/.]
Stumm, F., and Chowdhury, S., 2003, Delineation of ground water flow in fractured rock in the southwestern part of Manhattan, New York, through use of advanced borehole geophysical methods: Ground Water Monitoring & Remediation, v. 23, no. 3, p. 42–49, accessed February 2022 at https://doi.org/10.1111/j.1745-6592.2003.tb00682.x.
Stumm, F., Chu, A., and Monti, J., Jr., 2004, Delineation of faults, fractures, foliation, and ground-water-flow zones in fractured-rock, on the southern part of Manhattan, New York, through use of advanced borehole-geophysical techniques: U.S. Geological Survey Open-File Report 2004–1232, 212 p. [Also available at https://doi.org/10.3133/ofr20041232.]
Stumm, F., Lange, A.D., and Candela, J.L., 2002, Hydrogeology and extent of saltwater intrusion on Manhasset Neck, Nassau County, New York: U.S. Geological Survey Water-Resources Investigations Report 00–4193, 42 p. [Also available at https://doi.org/10.3133/wri004193.]
U.S. Geological Survey, 2021, USGS water data for the Nation: U.S. Geological Survey National Water Information System database, accessed August 2021 at https://doi.org/10.5066/F7P55KJN.
Viele, E.L., 1865, Sanitary and topographical map of the city and island of New York: NYC Council of Hygiene and Public Health, 1 sheet, scale 1:12,000. [Also available at https://digitalcollections.nypl.org/items/82566ae0-084f-0131-9e8d-58d385a7b928.]
Conversion Factors
Datum
Vertical coordinate information is referenced to the North American Vertical Datum of 1988 (NAVD 88).
Horizontal coordinate information is referenced to the North American Datum of 1983 (NAD 83).
Elevation, as used in this report, refers to distance above the vertical datum.
Supplemental Information
Peak-resonance frequencies are reported in hertz, equivalent to cycles per second.
Abbreviations
For more information about this report, contact:
Director, New York Water Science Center
U.S. Geological Survey
425 Jordan Road
Troy, NY 12180–8349
(518) 285–5602
or visit our website at
Suggested Citation
DeMott, L.M., Stumm, F., and Finkelstein, J., 2023, Bedrock-surface elevation and overburden thickness maps of the five boroughs, New York City, New York: U.S. Geological Survey Data Report 1176, 22 p., https://doi.org/10.3133/dr1176.
ISSN: 2771-9448 (online)
| Publication type | Report |
|---|---|
| Publication Subtype | USGS Numbered Series |
| Title | Bedrock-surface elevation and overburden thickness maps of the five boroughs, New York City, New York |
| Series title | Data Report |
| Series number | 1176 |
| DOI | 10.3133/dr1176 |
| Year Published | 2023 |
| Language | English |
| Publisher | U.S. Geological Survey |
| Publisher location | Reston, VA |
| Contributing office(s) | New York Water Science Center |
| Description | Report: vi, 22 p.; 3 Data releases |
| Online Only (Y/N) | Y |
| Additional Online Files (Y/N) | N |
| Google Analytic Metrics | Metrics page |