

Massachusetts and Landsat
Links
- Document: Report (7.65 MB pdf) , HTML , XML
- Version History: Version History (1.86 kB txt)
- Download citation as: RIS | Dublin Core
Abstract
Massachusetts is the seventh smallest U.S. State in land area, but its size is surpassed by its contributions to U.S. history and the economy, its academic and medical expertise, and its natural features. The Atlantic Ocean to the east gives the “Bay State” more than 1,500 miles of coastline that were important in past fishing and maritime trade industries and in the tourism industry of today for destinations such as Boston, Cape Cod, Nantucket, and Martha’s Vineyard. Forests cover roughly 60 percent of the State, which owns 315,000 acres of forests in parklands, reserves, and woodlands.
Massachusetts celebrates many strengths, but its strengths can be vulnerable to environmental change. A robust population of 7 million translates to a density of more than 800 people per square mile; in Boston, the density rises to more than 18,000 people per square mile. Urban temperature hotspots can increase health risks to residents.
Although the whims of wind and water have long reshaped coastlines, climate change-induced sea-level rise and severe storms can amplify coastal effects. In forests, changes in temperature or precipitation can provide more favorable conditions for invasive species.
State and local governments have been taking steps to address climate change. Here are several ways Landsat has benefited the residents of Massachusetts.
Tracking Invasive Species Damage
Landsat’s 30- by 30-meter pixels, consistency, and surface reflectance data are well-suited for monitoring the health of broad forest stands that would be too labor-intensive to track closely from the ground. A recent University of Massachusetts-Amherst study used Landsat scenes of southern New England from 2015, 2016, and 2017 to examine the extent of defoliation from the first outbreak of the invasive Lymantria dispar (spongy moth) in more than 30 years. Dry springs in 2014, 2015, and 2016 may have contributed to the significant outbreak. By understanding the dynamics of an outbreak, forest managers can monitor affected wildlife communities and make treatment decisions (Pasquarella and others, 2018).
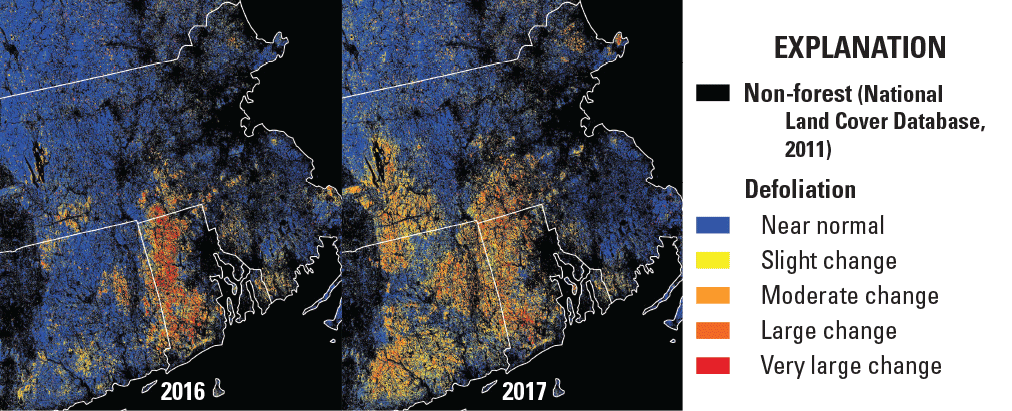
Areas of defoliation during an outbreak of Lymantria dispar in southern New England, including central Massachusetts. Image credit: Pasquarella and others, 2018; used with permission.
Developing a Decarbonization Plan
To address climate change, Massachusetts made a plan in 2020 to reduce its greenhouse gas emissions at least 85 percent by 2050. State officials consulted with Harvard University researchers to conduct several land use and land cover change scenarios and their expected effect on forests, which store and sequester a vast amount of carbon. Most changes tend to result from continued forest growth, property development, and tree harvesting. The Landsat record of land cover change from 1990 to 2017 helped predict future patterns (Thompson and others, 2020).
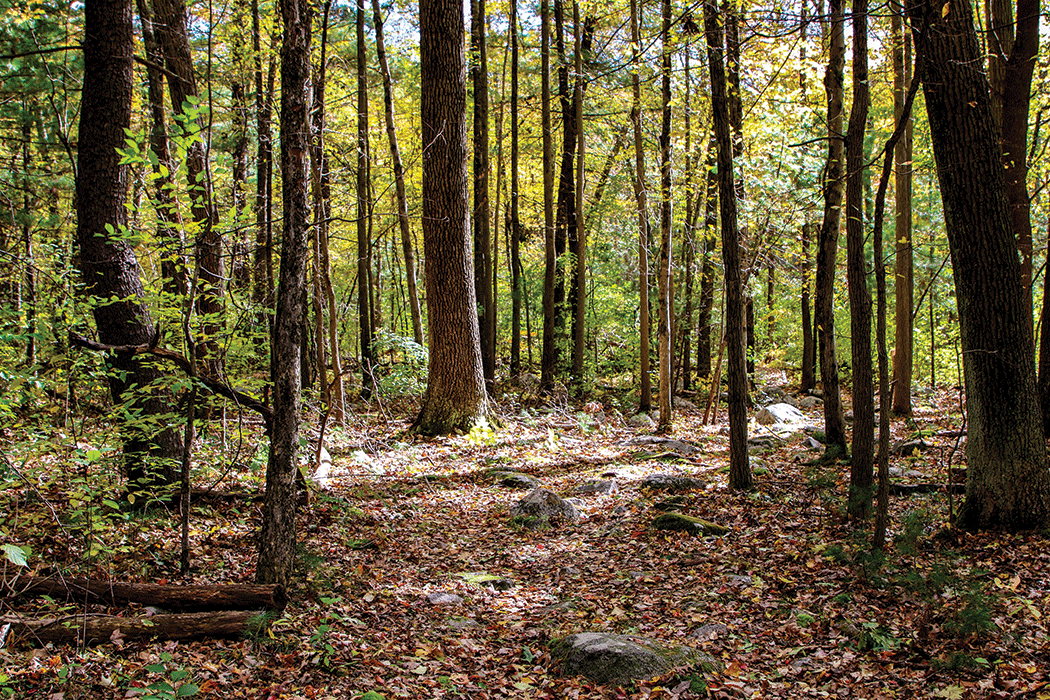
Forests, like this one in Minute Man National Historic Park, occupy more than 60 percent of Massachusetts and are significant sources of carbon storage and sequestration. Photograph credit: Victoria Stauffenberg, National Park Service; used with permission.
Identifying City Hotspots
Urban heat islands are areas within cities that have more impervious surface (buildings and pavement) and fewer natural features. These characteristics contribute to urban temperatures that exceed those of surrounding areas. Measurements derived from Landsat’s sensors include land-surface temperature, which can help pinpoint where urban heat islands exist. The City of Cambridge used Landsat data to help develop an urban heat island model that considers rising temperatures to inform the 2021 Resilient Cambridge Plan, a roadmap for reducing the risks and effects of climate change on City residents (City of Cambridge, Massachusetts, 2021).
Viewing Coastal Changes
Landsat can capture sudden and prolonged changes in landscape, including barrier island shoreline shifts wrought by storms or continual wind and waves. Cape Cod, for example, has experienced substantial changes over several decades, including the creation of new islands and the merging of other islands. Related research that identifies patterns of beach change, development, and recovery can help local and State authorities improve coastal management (Carlowicz, 2014).
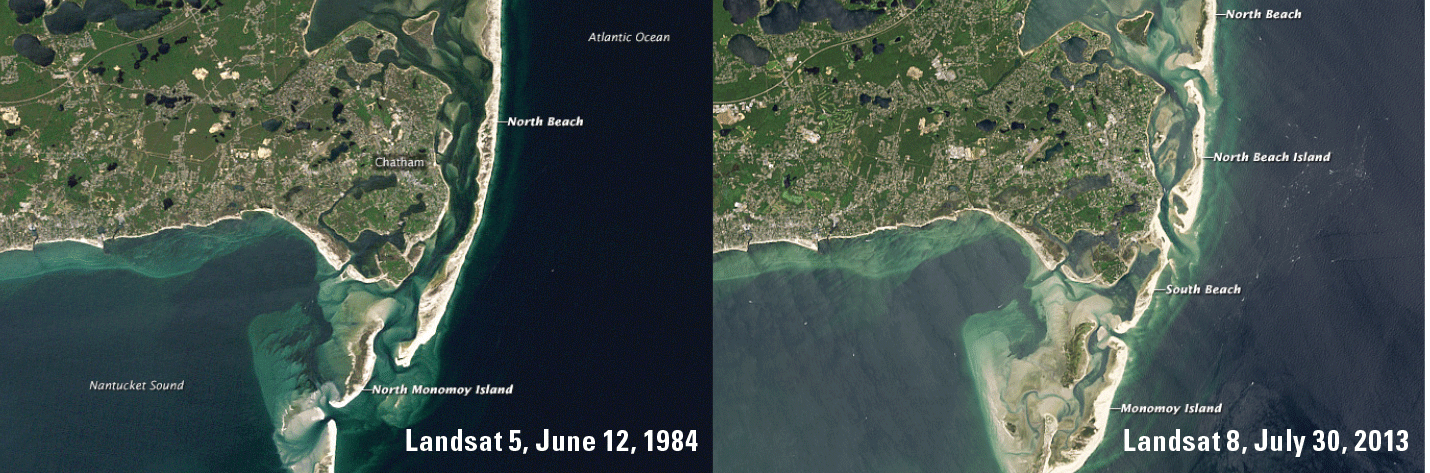
These images of the southeastern edge of Cape Cod. In 1984, an unbroken barrier spit shielded the coast, while North and South Monomoy Islands were separate. By 2013, three breaches opened in the barrier, and the Monomoy islands connected. Image credit: Jesse Allen and Robert Simmon, National Aeronautics and Space Administration; and the U.S. Geological Survey.
National Land Imaging Program Benefits—Massachusetts
The U.S. Geological Survey (USGS) National Land Imaging Program provides a wide range of satellite imagery and other remotely sensed and geospatial data to Government, commercial, academic, and public users. Those users can get worldwide access to Landsat satellite data through the National Land Imaging Program-funded USGS Earth Resources Observation and Science (EROS) Center.
Landsat—Critical Information Infrastructure for the Nation
Landsat is the most widely used land remote sensing data source within Federal civilian agencies. Local, State, Tribal, and Federal agencies use Landsat to monitor and forecast a wide range of land surface phenomena. Information from Landsat contributes to day-to-day decisions on land, water, and resource use that protect life and property; safeguard the environment; advance science, technology, and education; support climate change resiliency; and grow the U.S. economy. Landsat’s imagery provides a landscape-level view of land surface, inland lake, and coastal processes, both natural and human-induced. Landsat enables us to better understand the scope, nature, and speed of change to the natural and built environment.
Businesses draw upon Landsat data to provide customer-specific applications to improve logistics, resource allocation, and investment decisions. Commercial space imaging firms leverage Landsat data to refine product offerings and support new information services. A 2017 USGS study determined the total annual economic benefit of Landsat data in the United States. to be $2.06 billion, far surpassing its development and operating costs (Straub and others, 2019).
Landsat 8 and Landsat 9 provide 8-day repeat coverage of the Earth’s land surfaces. The National Aeronautics and Space Administration (NASA) and the USGS are currently reviewing the findings from a joint Architecture Study Team, which will inform the design and implementation approach for Landsat Next, the follow-on mission to Landsat 9. Landsat 9 and its successors are planned to provide a sustainable, space-based system to extend the 50-year Landsat series of high-quality global land imaging measurements—the world’s longest time series of the Earth’s land surface.
The long-term availability of consistent and accurate Landsat data, combined with a no-cost data policy, allows users to analyze extensive geographic areas and better understand and manage long-term trends in land surface change. New cloud computing and data analytics technologies use Landsat data in a wide range of decision-support tools for Government and industry. Much like global positioning systems and weather data, Landsat data are used every day to help us better understand our dynamic planet.
References Cited
Carlowicz, M., 2014, Changes on the Cape Cod coastline: National Aeronautics and Space Administration Earth Observatory web page, accessed January 13, 2022, at https://earthobservatory.nasa.gov/images/83749/changes-on-the-cape-cod-coastline.
City of Cambridge, Massachusetts, 2021, Urban heat island technical report: City of Cambridge, accessed January 13, 2022, at https://www.cambridgema.gov/-/media/Files/CDD/Climate/resilientcambridge/urbanheatislandtechnicalreport.pdf.
Pasquarella, V.J., Elkinton, J.S., and Bradley, B.A., 2018, Extensive gypsy moth defoliation in southern New England characterized using Landsat satellite observations: Biological Invasions, v. 20, p. 3047–3053, accessed January 13, 2022, at https://doi.org/10.1007/s10530-018-1778-0.
Straub, C.L., Koontz, S.R., and Loomis, J.B., 2019, Economic valuation of Landsat imagery: U.S. Geological Survey Open-File Report 2019–1112, 13 p., accessed January 13, 2022, at https://doi.org/10.3133/ofr20191112.
Thompson, J.R., Laflower, D., Plisinski, J., and Graham MacLean, M., 2020, Land sector report, a technical report of the Massachusetts 2050 decarbonization roadmap study: Commonwealth of Massachusetts, accessed January 13, 2022, at https://www.mass.gov/info-details/ma-decarbonization-roadmap.
For additional information on Landsat, please contact:
Program Coordinator
USGS National Land Imaging Program
12201 Sunrise Valley Drive
Reston, VA 20192
703–648–4567
The Landsat series is a joint effort of USGS and NASA. NASA develops and launches the spacecraft; USGS manages satellite operations, ground reception, data archiving, product generation, and data distribution. Funding for the National Land Imaging Program’s Landsat operations and data management is provided through the USGS.
Suggested Citation
U.S. Geological Survey, 2022, Massachusetts and Landsat (ver. 1.1, January 2023): U.S. Geological Survey Fact Sheet 2022–3018, 2 p., https://doi.org/10.3133/fs20223018.
ISSN: 2327-6932 (online)
ISSN: 2327-6916 (print)
Study Area
| Publication type | Report |
|---|---|
| Publication Subtype | USGS Numbered Series |
| Title | Massachusetts and Landsat |
| Series title | Fact Sheet |
| Series number | 2022-3018 |
| DOI | 10.3133/fs20223018 |
| Edition | Version 1.0: March 24, 2022; Version 1.1: January 23, 2023 |
| Year Published | 2022 |
| Language | English |
| Publisher | U.S. Geological Survey |
| Publisher location | Reston, VA |
| Contributing office(s) | Earth Resources Observation and Science (EROS) Center |
| Description | 2 p. |
| Country | United States |
| State | Massachusetts |
| Online Only (Y/N) | N |
| Google Analytic Metrics | Metrics page |