

Connecticut and Landsat
Links
- Document: Report (2.47 MB pdf) , HTML , XML
- Download citation as: RIS | Dublin Core
Abstract
Connecticut, the third-smallest State by land area, is the fourth most densely populated in the United States. Connecticut’s tightly packed cities serve as international hubs for the finance and insurance industries. These same urban enclaves host highly regarded institutions of higher learning, such as Yale, the University of Connecticut, and Quinnipiac and Wesleyan Universities.
Yet Connecticut has surprisingly varied natural features. Its residents are never far from pristine environments that teem with wildlife and convey the sounds, scents, and scenery of the natural world.
The Connecticut River, the longest in New England at 407 miles, cuts through the State’s center and drains into Long Island Sound, as do the Thames and Housatonic Rivers. Together, these rivers form an estuary spawning ground for hundreds of fresh and saltwater aquatic species. North and east of the coastal lowlands that hug the estuary are the highlands of the Southern Taconic Range and the Berkshires. North and west of the coastline, smaller rivers and valleys weave through densely forested landscapes dotted with State parks and scenic lakes.
Imagery from the USGS Landsat archive, a trusted public resource with more than 50 years of worldwide Earth observations, provides a powerful tool for analyzing the interplay of human habitation and natural landscapes in Connecticut. Landsat data also offer land managers a critical information source for managing damage from invasive species and monitoring the local landscape effects of a changing global climate.
Here are a few examples of how Landsat data have been used in Connecticut.
A Watchful Eye Over Forests
About 60 percent of Connecticut is forested. In recent years, one of the primary threats to the health of forested lands has come in the form of Lymantria dispar (Linnaeus, 1758) (spongy moth, previously known as the gypsy moth). Landsat’s landscape-scale observations and decades of repeat coverage offer invaluable insight into spongy moth-related tree mortality and potential mitigation strategies. A study from 2018 mapped the extent of the damage (Pasquarella and others, 2018), and a study from 2021 used Landsat as the foundation of a predictive defoliation model for New England. The University of Connecticut, meanwhile, leans on Landsat-derived vegetation health information to map potential damage from the spongy moth, drought, and other factors (Worthley, 2019).
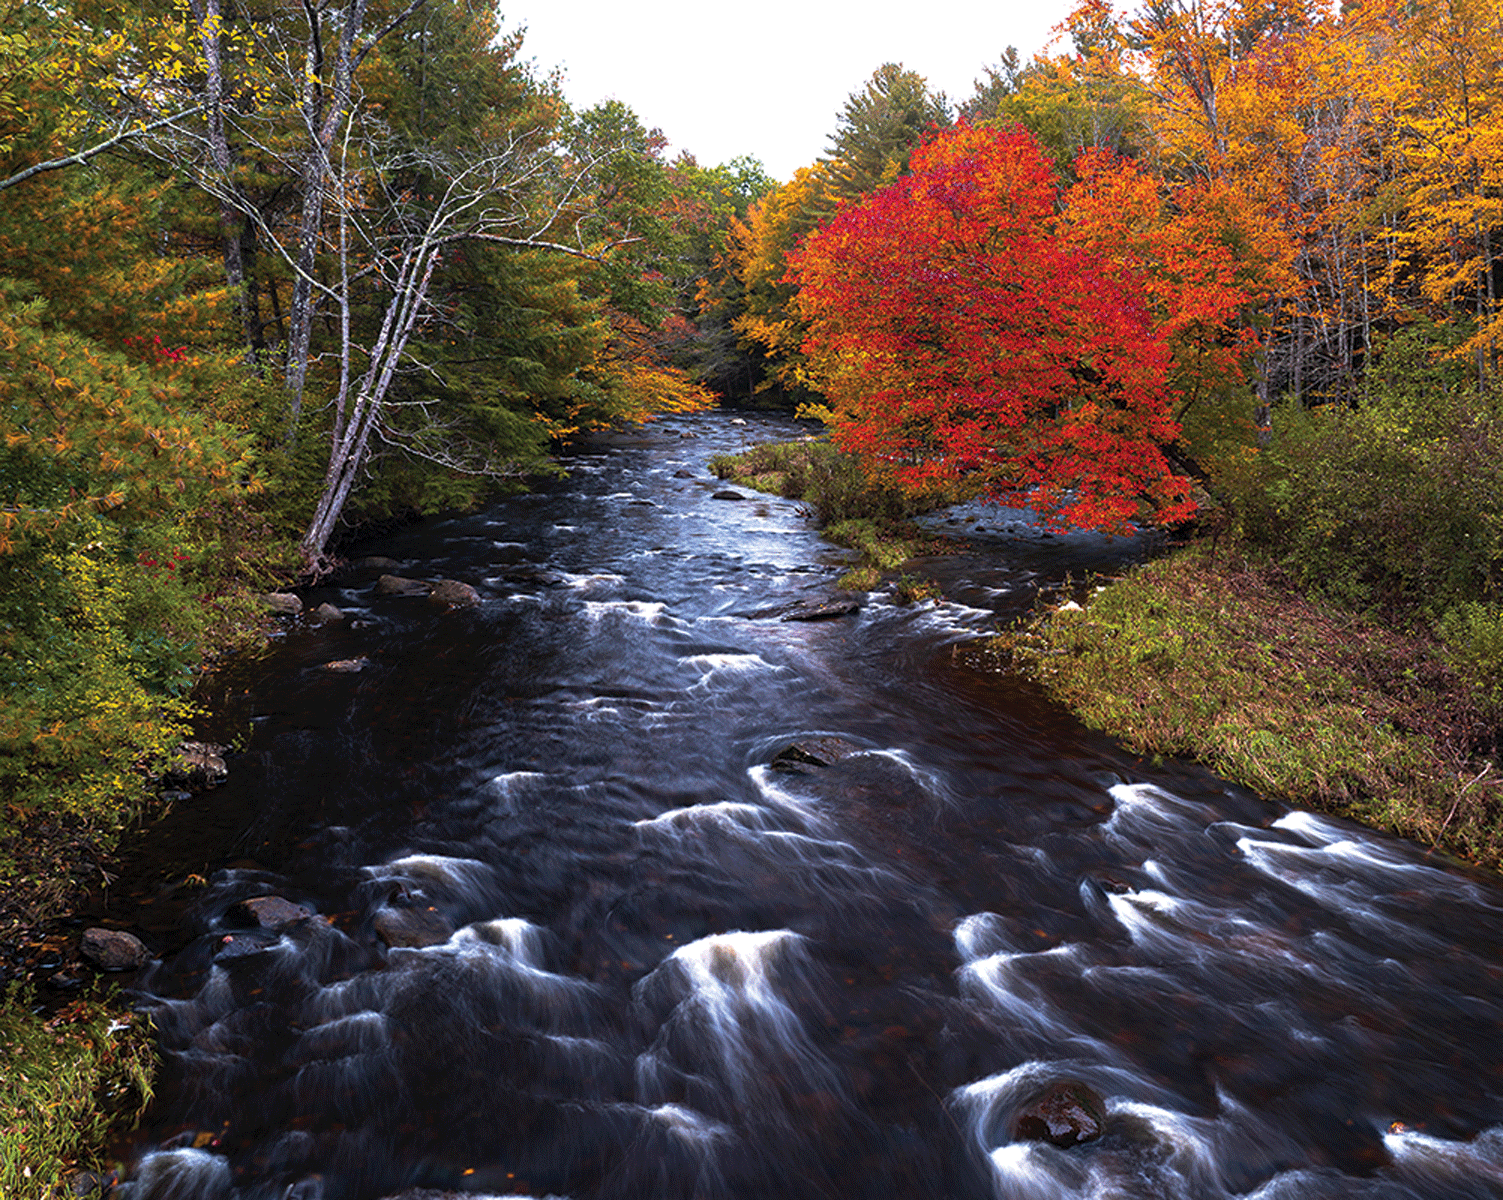
Photograph of Farmington River near Riverton, Connecticut, during the fall, taken from a bridge. Photograph credit: Paul Solis, U.S. Geological Survey.
Mapping, Managing Urban Landscapes
Population is typically denser in New England than in other parts of the United States. The issue is especially pronounced in Connecticut. Urban density begets impervious urban surfaces such as parking lots, roads, and buildings—a planning issue with implications for runoff management, urban heat, and ultimately, human health. Impervious surfaces trap and retain heat, leaving dense cityscapes warmer through the day and into the evening than adjacent rural areas. With their thermal measurement capabilities, Landsat satellites can monitor this phenomenon, known as the urban heat island effect. Researchers with Yale University’s School of Forestry and Environmental Management used Landsat to investigate urban tree cover losses, urban heat, and equity issues in green infrastructure in 2020 (Murphy-Dunning, 2020). Meanwhile, a University of Connecticut partnership called Connecticut’s Changing Landscapes used Landsat data to map land cover and change in the State over a 30-year period (Arnold and others, 2020).
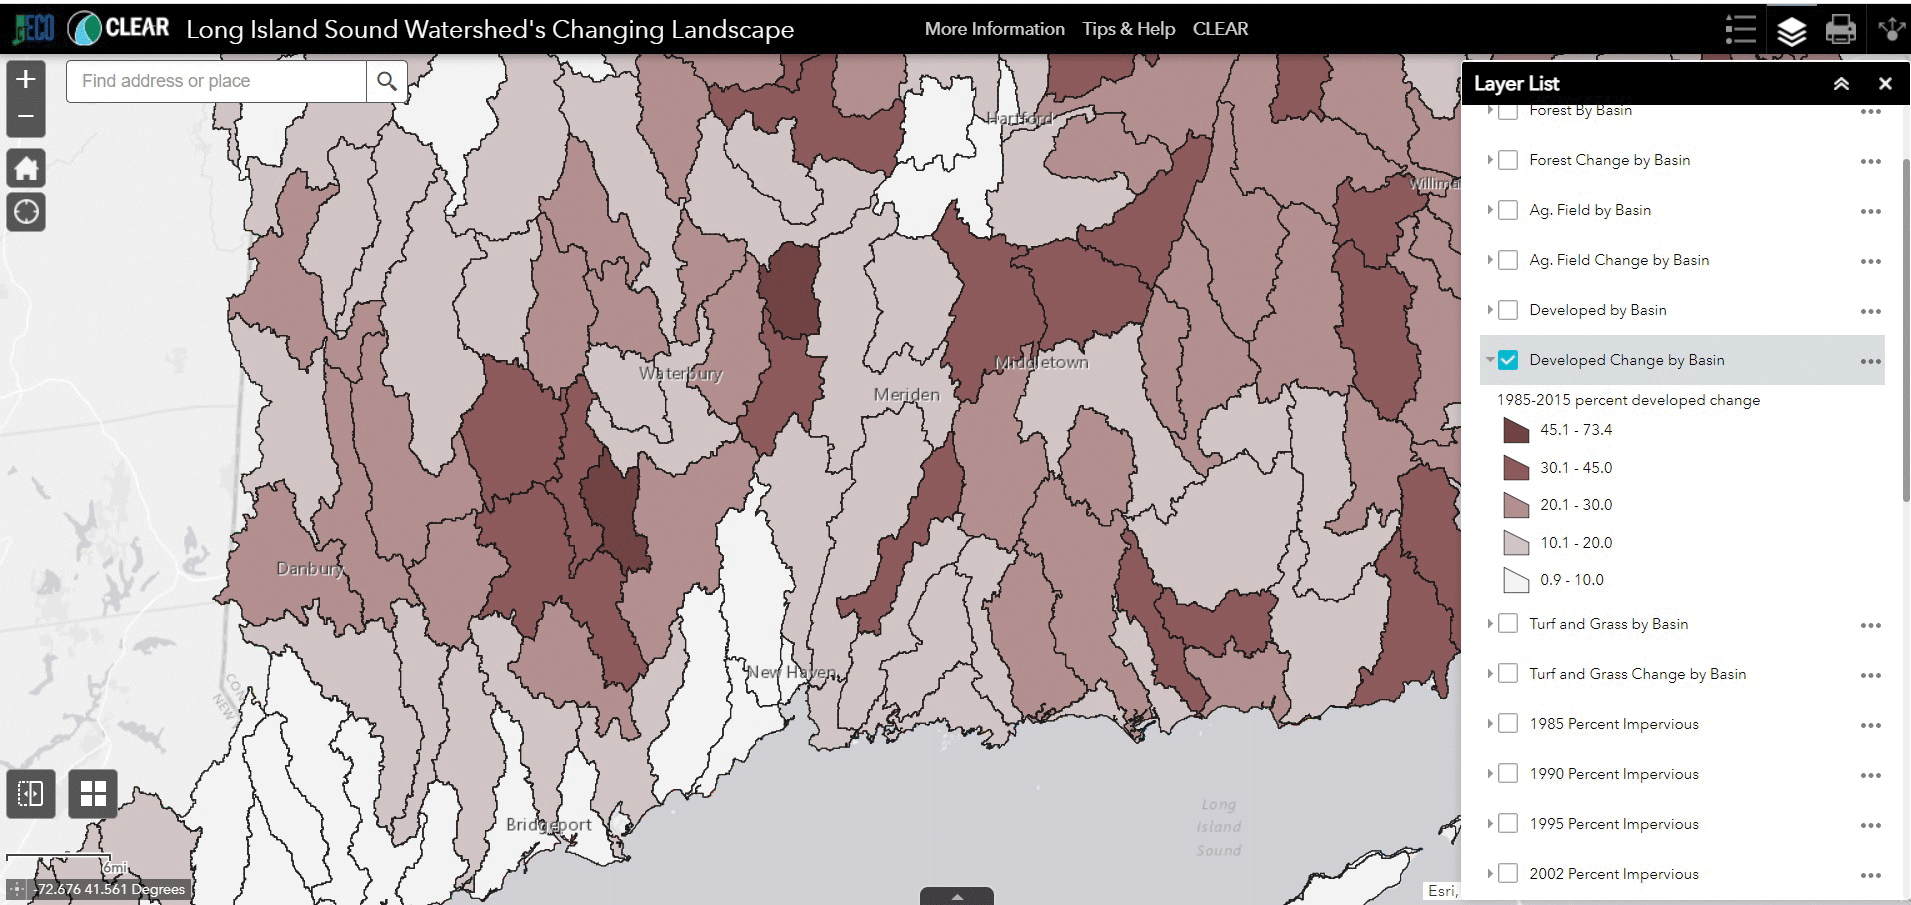
Screen capture of land cover and change viewer developed by the University of Connecticut Center for Land Use Education & Research program, which counts Landsat data among its sources. Image credit: University of Connecticut; used with permission.
Tracking Coastal Change
The coastline of Connecticut and the expansive estuary of Long Island Sound have not escaped the effect of human development, nor have the State’s extensive waters. In 2018, for example, the Interstate Environmental Commission, a tristate water and air pollution control agency for New York, New Jersey, and Connecticut, released a report on hypoxia along the western parts of Long Island Sound. Hypoxia, the lack of oxygen in waterbodies, is an indication of poor water quality. The Interstate Environmental Commission report used a host of data sources to analyze historical patterns of land cover, including Landsat-based information on impervious surfaces, a major contributing factor to rapid runoff and hypoxia (Ballestero and others, 2018). Landsat’s repeat observations offer added insight in monitoring coastal and inland flooding and other storm-related damage in Connecticut and across New England.
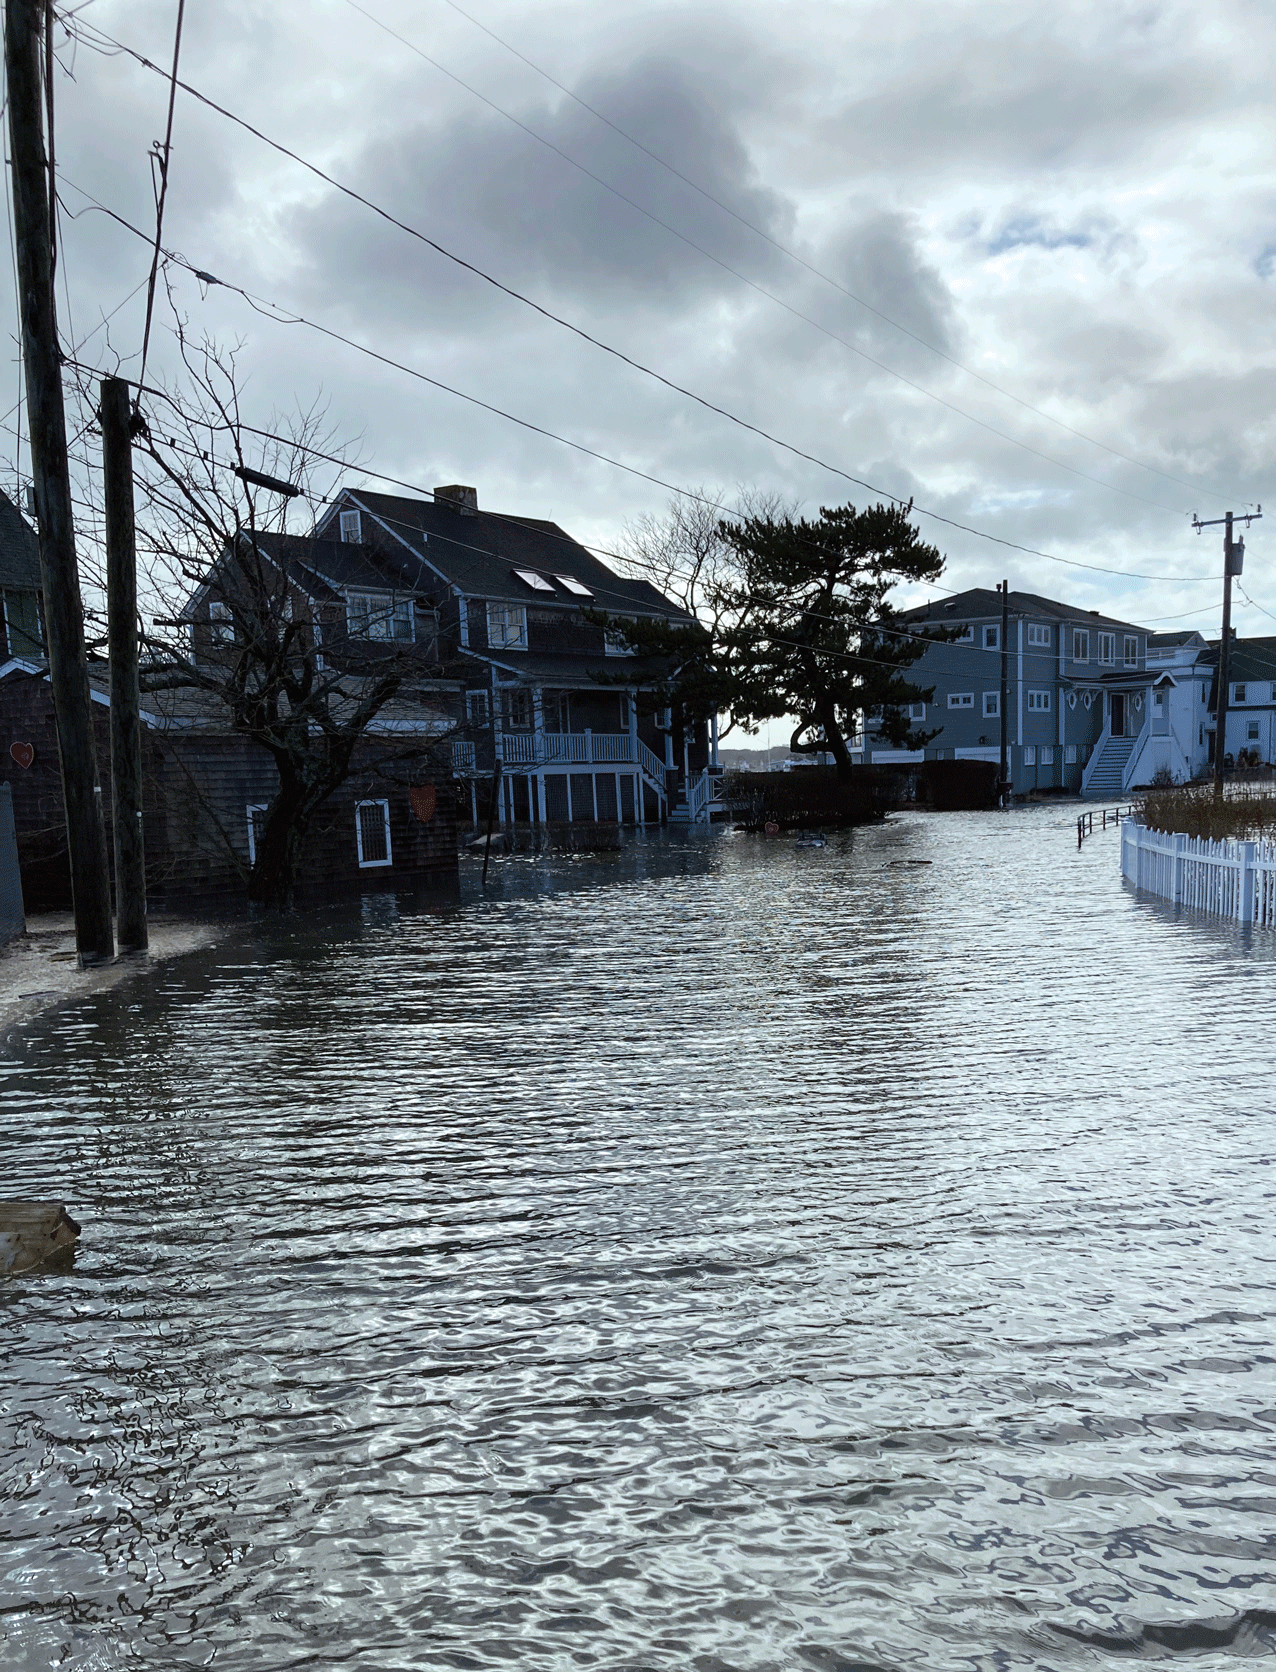
Street flooding at high tide during a storm event on January 17, 2022, at Crescent Beach in Niantic, Connecticut. Photograph credit: Timothy C. Sargent, U.S. Geological Survey.
National Land Imaging Program Benefits—Connecticut
The U.S. Geological Survey (USGS) National Land Imaging Program provides a wide range of satellite imagery and other remotely sensed and geospatial data to Government, commercial, academic, and public users. Those users can get worldwide access to Landsat satellite data through the National Land Imaging Program-funded USGS Earth Resources Observation and Science (EROS) Center.
Landsat—Critical Information Infrastructure for the Nation
Landsat is the most widely used land remote sensing data source within Federal civilian agencies. Local, State, Tribal, and Federal agencies use Landsat to monitor and forecast a wide range of land surface phenomena. Information from Landsat contributes to day-to-day decisions on land, water, and resource use that protect life and property; safeguard the environment; advance science, technology, and education; support climate resiliency; and grow the U.S. economy. Landsat’s imagery provides a landscape-level view of land surface, inland lake, and coastal processes, both natural and human-induced. Landsat enables us to better understand the scope, nature, and speed of change to the natural and built environment.
Businesses draw upon Landsat data to provide customer-specific applications to improve logistics, resource allocation, and investment decisions. Commercial space imaging firms leverage Landsat data to refine product offerings and support new information services. A 2017 USGS study determined the total annual economic benefit of Landsat data in the United States. to be $2.06 billion, far surpassing its development and operating costs (Straub and others, 2019).
Landsat 8 and Landsat 9 provide 8-day repeat coverage of the Earth’s land surfaces. The National Aeronautics and Space Administration (NASA) and the USGS are currently reviewing the findings from a joint Architecture Study Team, which will inform the design and implementation approach for Landsat Next, the follow-on mission to Landsat 9. Landsat 9 and its successors are planned to provide a sustainable, space-based system to extend the 50-year Landsat series of high-quality global land imaging measurements—the world’s longest time series of the Earth’s land surface.
The long-term availability of consistent and accurate Landsat data, combined with a no-cost data policy, allows users to analyze extensive geographic areas and better understand and manage long-term trends in land surface change. New cloud computing and data analytics technologies use Landsat data in a wide range of decision-support tools for Government and industry. Much like global positioning systems and weather data, Landsat data are used every day to help us better understand our dynamic planet.
References Cited
Arnold, C., Wilson, E., Hurd, J., and Civco, D., 2020, 30 years of land cover change in Connecticut, USA—A case study of long-term research, dissemination of results, and their use in land use planning and natural resource conservation: Land, v. 9, no. 8, art. 255, 26 p., accessed April 13, 2022, at https://doi.org/10.3390/land9080255.
Ballestero, H., Doiron, K., Levine, M., and Friedman, S., 2018, Synthesis and analysis of historical hypoxia data in the Western Narrows of Long Island Sound: Interstate Environmental Commission and New England Interstate Water Pollution Control Commission, prepared by Industrial Economics, Incorporated, 94 p., accessed April 13, 2022, at https://www.iec-nynjct.org/sites/default/files/2018-08/Industrial%20Economics_%20Hypoxia%20Narrows%20LIS%20Repor.pdf.
Murphy-Dunning, C., 2020, Equity issues in urban forestry & green infrastructure: Yale School of Forestry and Environmental Studies, 36-slide presentation, accessed March 29, 2020, at https://portal.ct.gov/-/media/DEEP/climatechange/GC3/GC3-2020-agendas-and-minutes/GC3_Forests_slides_032420.pdf.
Pasquarella, V.J., Elkinton, J.S., and Bradley, B.A., 2018, Extensive gypsy moth defoliation in Southern New England characterized using Landsat satellite observations: Biological Invasions, v. 20, no. 11, p. 3047–3053. [Also available at https://doi.org/10.1007/s10530-018-1778-0.]
Straub, C.L., Koontz, S.R., and Loomis, J.B., 2019, Economic valuation of Landsat imagery: U.S. Geological Survey Open-File Report 2019–1112, 13 p., accessed April 8, 2022, at https://doi.org/10.3133/ofr20191112.
Worthley, T.E., 2019, The slow storm—Implications of tree mortality due to gypsy moth, drought, TLCB, Armillaria, etc.: University of Connecticut, 57-slide presentation, accessed March 29, 2022, at https://portal.ct.gov/-/media/CAES/DOCUMENTS/Publications/Forest_Health_Monitoring_Workshops/2019/Assessing-the-degree-and-Extent-of-Oak-Mortality-in-Eastern-CT.pdf.
For additional information on Landsat, please contact:
Program Coordinator
USGS National Land Imaging Program
12201 Sunrise Valley Drive
Reston, VA 20192
703–648–4567
The Landsat series is a joint effort of USGS and NASA. NASA develops and launches the spacecraft; USGS manages satellite operations, ground reception, data archiving, product generation, and data distribution. Funding for the National Land Imaging Program’s Landsat operations and data management is provided through the USGS.
Suggested Citation
U.S. Geological Survey, 2022, Connecticut and Landsat: U.S. Geological Survey Fact Sheet 2022–3045, 2 p., https://doi.org/10.3133/fs20223045.
ISSN: 2327-6932 (online)
ISSN: 2327-6916 (print)
Study Area
| Publication type | Report |
|---|---|
| Publication Subtype | USGS Numbered Series |
| Title | Connecticut and Landsat |
| Series title | Fact Sheet |
| Series number | 2022-3045 |
| DOI | 10.3133/fs20223045 |
| Year Published | 2022 |
| Language | English |
| Publisher | U.S. Geological Survey |
| Publisher location | Reston, VA |
| Contributing office(s) | Earth Resources Observation and Science (EROS) Center |
| Description | 2 p. |
| Country | United States |
| State | Connecticut |
| Online Only (Y/N) | N |
| Google Analytic Metrics | Metrics page |