

Indiana and Landsat
Links
- Document: Report (6.78 MB pdf) , HTML , XML
- Download citation as: RIS | Dublin Core
Abstract
Natural resources have always been a strength for Indiana. Once largely covered by forest, the State now includes a mix of forest, farmland, wetlands, and small lakes. In fact, farms and forested areas make up more than 80 percent of the land (Indiana State Department of Agriculture, 2022). The Ohio River forms the southern border, and the south shore of Lake Michigan contrasts with urban development in the northwestern corner. Indiana Dunes National and State Parks reside just east of the Chicago metropolitan area.
Agriculture adds more than $30 billion to the economy in Indiana, which placed eighth in the country for agricultural exports at $4.6 billion in 2017 (Indiana State Department of Agriculture, 2022). Indiana ranks in the top five States nationally for the production of corn and soybeans. The “Hoosier State” also grows sizable crops of popcorn, spearmint, peppermint, pumpkins, tomatoes, and watermelon. Additionally, hogs, cattle, dairy, and poultry contribute to the agricultural economy. Other industries important to Indiana include manufacturing, medicine, energy, and mining. Mineral sources vary from coal, building stone, and gypsum to sand, gravel, and shale.
Landsat can help monitor the condition of natural resources and the effects of extreme weather events. Here are several ways Landsat has benefited Indiana.
Keeping an Eye on Crops
Using a foundation of Landsat and other data, the U.S. Department of Agriculture has developed Cropland Data Layer (CDL) maps that display crop type, acreage, and yield for fields in Indiana and nationally. The annual CDL reveals what is planted, how much, and the location, as well as where land use has changed. This helps agricultural producers and others in the industry make prudent decisions (U.S. Department of Agriculture, 2022). An Applied GeoSolutions project used Landsat data from 2006 to 2015 to map annual tillage practices and cover crops across Indiana. Information like this can help companies in the agricultural industry make decisions and can provide officials and land managers with a better understanding of productivity and soil condition (Hagen and others, 2016).
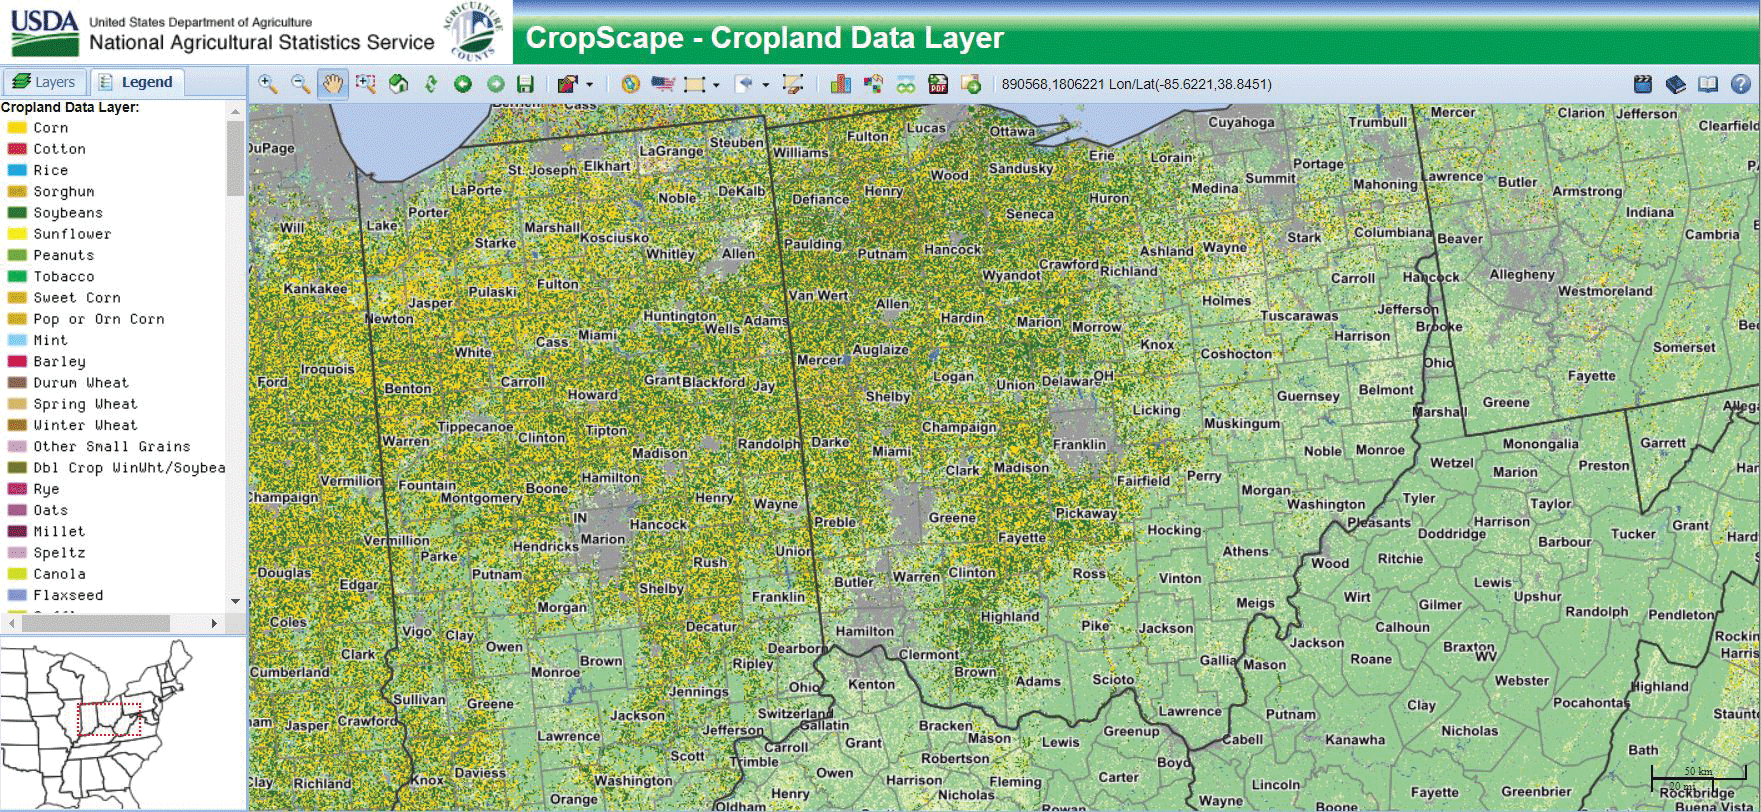
The 2021 Cropland Data Layer for Indiana (left full State) and nearby States includes forest (medium green), grassland (pale yellow green), corn (golden yellow), and soybeans (dark green). Image credit: U.S. Department of Agriculture.
Assessing Flood Damage
Flooding is a threat to Indiana’s agriculture and economy because of heavy precipitation and changing climate patterns (Widhalm and others, 2018). One destructive flood affected southern Indiana in 2008 when 7–10 inches of rain fell and water levels peaked on June 10–11. Flooding affected thousands of people, killed four, and damaged structures and crops. Purdue University researchers compared a June 11 Landsat 5 image to one from the year before to measure the extent of flooding and floodplain boundaries and assess damages. Within a week, the researchers made their results available to users (Hussain and others, 2009).

Landsat 5 images show the difference a year before flooding, on June 9, 2007 (left), and during flooding, on June 11, 2008 (right), in southern Indiana. Image credit: U.S. Geological Survey.
Monitoring Landscape Change
An exploration of Landsat’s archive can reveal gradual change. One example is a study of the effects of transitioning the 50,000-acre Jefferson Proving Ground Army munitions testing facility to the Big Oaks National Wildlife Refuge. The refuge provides habitat for rare birds and other plant and animal species, along with hunting grounds for turkey and deer. Images from the years 1985–2013 quantified changes in land cover, such as forest to shrubland (Gibbes and others, 2017). A similar analysis of Indiana Dunes National Park used data of vegetative changes from 2007 to 2012 to determine the extent and types of disturbances that had happened, ranging from development outside the park to wetland and forest restoration within the park (Gafvert and Kirschbaum, 2015).
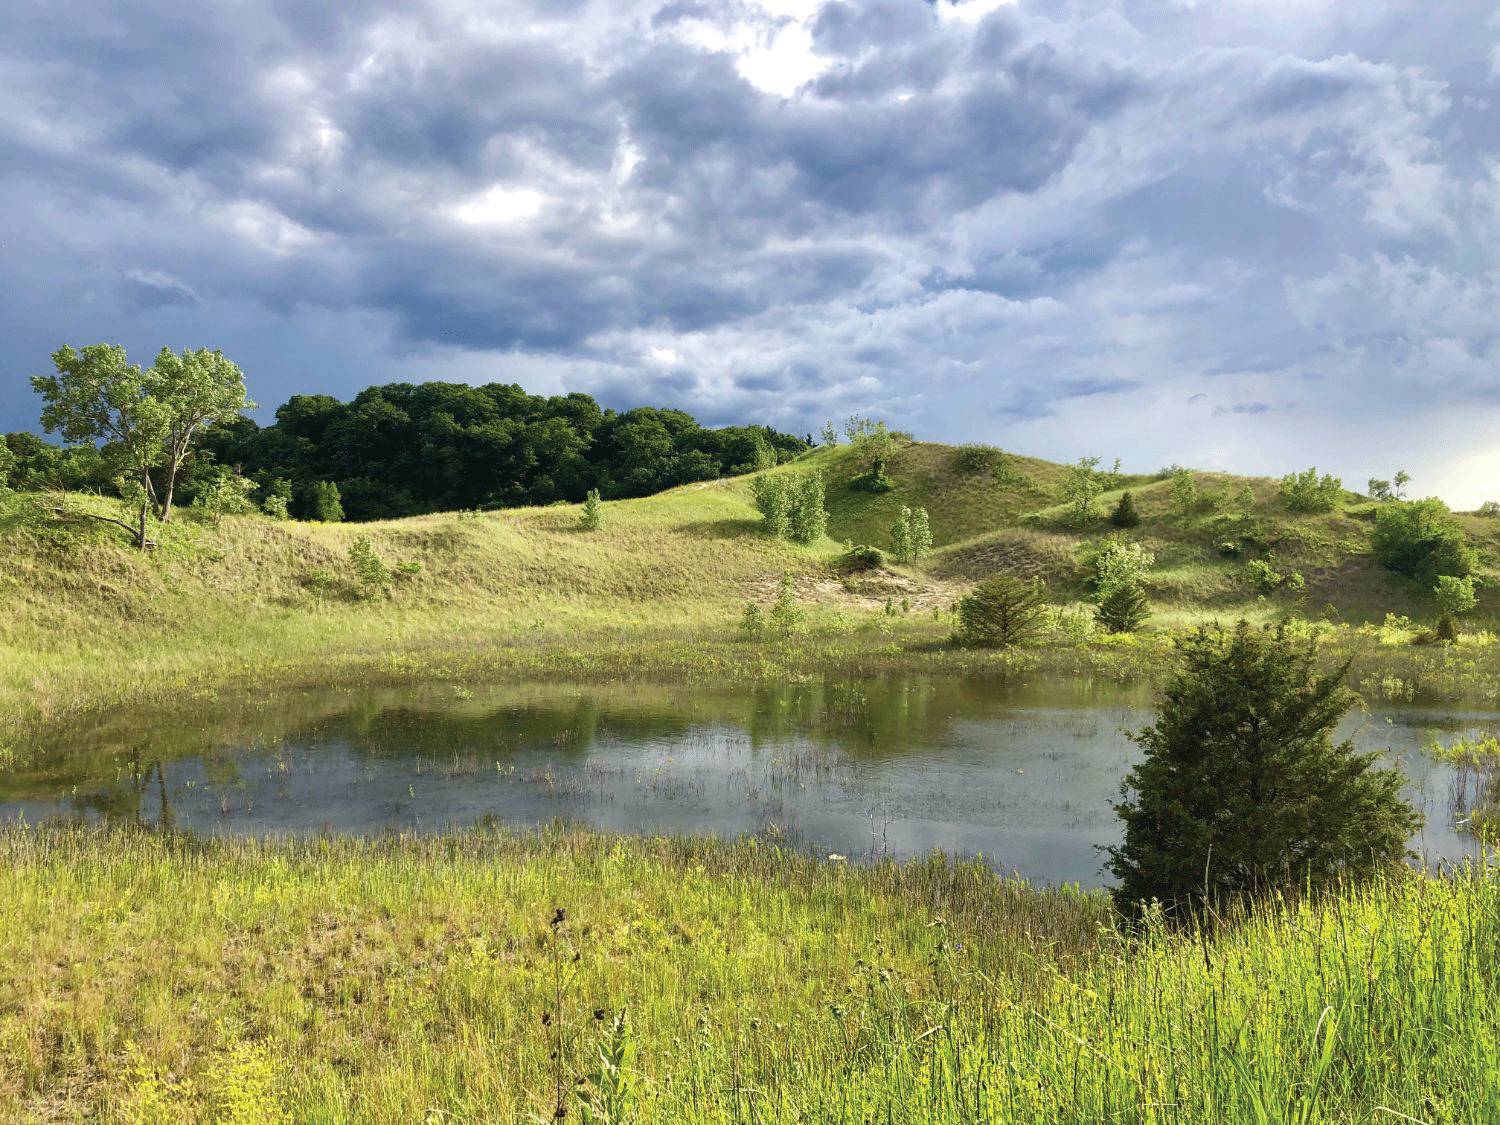
Indiana Dunes National Park contains wetlands in addition to shoreline. Restoration of wetlands is one example of land cover change that has been detected at the park. Photograph credit: National Park Service.
National Land Imaging Program Benefits—Indiana
The U.S. Geological Survey (USGS) National Land Imaging Program provides a wide range of satellite imagery and other remotely sensed and geospatial data to Government, commercial, academic, and public users. Those users can get worldwide access to Landsat satellite data through the National Land Imaging Program-funded USGS Earth Resources Observation and Science (EROS) Center.
Landsat—Critical Information Infrastructure for the Nation
Landsat is the most widely used land remote sensing data source within Federal civilian agencies. Local, State, Tribal, and Federal agencies use Landsat to monitor and forecast a wide range of land surface phenomena. Information from Landsat contributes to day-to-day decisions on land, water, and resource use that protect life and property; safeguard the environment; advance science, technology, and education; support climate change resiliency; and grow the U.S. economy. Landsat’s imagery provides a landscape-level view of land surface, inland lake, and coastal processes, both natural and human-induced. Landsat enables us to better understand the scope, nature, and speed of change to the natural and built environment.
Businesses draw upon Landsat data to provide customer-specific applications to improve logistics, resource allocation, and investment decisions. Commercial space imaging firms leverage Landsat data to refine product offerings and support new information services. A 2017 USGS study determined the total annual economic benefit of Landsat data in the United States. to be $2.06 billion, far surpassing its development and operating costs (Straub and others, 2019).
Landsat 8 and Landsat 9 provide 8-day repeat coverage of the Earth’s land surfaces. The National Aeronautics and Space Administration (NASA) and the USGS are currently reviewing the findings from a joint Architecture Study Team, which will inform the design and implementation approach for Landsat Next, the follow-on mission to Landsat 9. Landsat 9 and its successors are planned to provide a sustainable, space-based system to extend the 50-year Landsat series of high-quality global land imaging measurements—the world’s longest time series of the Earth’s land surface.
The long-term availability of consistent and accurate Landsat data, combined with a no-cost data policy, allows users to analyze extensive geographic areas and better understand and manage long-term trends in land surface change. New cloud computing and data analytics technologies use Landsat data in a wide range of decision-support tools for Government and industry. Much like global positioning systems and weather data, Landsat data are used every day to help us better understand our dynamic planet.
References Cited
Gafvert, U.B., and Kirschbaum, A.A., 2015, Landsat-based monitoring of landscape dynamics at Indiana Dunes National Lakeshore—2007–2012: National Park Service Natural Resource Report NPS/GLKN/NRR—2015/1073, 62 p., accessed May 12, 2022, at https://irma.nps.gov/DataStore/DownloadFile/530611.
Gibbes, C., Havlick, D.G., and Robb, J.R., 2017, Land use and land cover in a transitioning militarized landscape: Journal of Land Use Science, v. 12, no. 2–3, p. 182–196, 182–196, accessed May 12, 2022, at https://doi.org/10.1080/1747423X.2017.1313325.
Hagen, S., Cooke, I., Watts, C., Scanlon, K., Towery, D., and Salas, W., 2016, Operational Tillage Information System (OpTIS)—A pilot demonstration project mapping tillage practice and winter cover crops annually across the state of Indiana between 2006 and 2015: Applied GeoSolutions and the Conservation Technology Information Center, 28 p., accessed May 12, 2022, at http://optis.ags.io/.
Hussain, E., Kim, K., and Shan, J., 2009, Object-based image classification and web-mapping techniques for flood damage assessment, in American Society for Photogrammetry and Remote Sensing Annual Conference, 2009, Baltimore, Md., March 9–13, 2009, [Proceedings]: Red Hook, N.Y., Curran Associates, Inc., p. 332–343, accessed May 12, 2022, at https://www.asprs.org/a/publications/proceedings/baltimore09/0039.pdf.
Indiana State Department of Agriculture, 2022, About Indiana agriculture: Indiana State Department of Agriculture web page, accessed June 16, 2022, at https://www.in.gov/isda/about/about-indiana-agriculture/.
Straub, C.L., Koontz, S.R., and Loomis, J.B., 2019, Economic valuation of Landsat imagery: U.S. Geological Survey Open-File Report 2019–1112, 13 p., accessed April 8, 2022, at https://doi.org/10.3133/ofr20191112.
U.S. Department of Agriculture, 2022, CropScape and Cropland Data Layers—FAQs: U.S. Department of Agriculture, National Agricultural Statistics Service web page, accessed April 21, 2022, at https://www.nass.usda.gov/Research_and_Science/Cropland/sarsfaqs2.php#Section3_17.0.
Widhalm, M., Hamlet, A., Byun, K., Robeson, S., Baldwin, M., Staten, P., Chiu, C., Coleman, J., Hall, E., Hoogewind, K., Huber, M., Kieu, C., Yoo, J., and Dukes, J.S., 2018, Indiana’s past & future climate—A report from the Indiana Climate Change Impacts Assessment: West Lafayette, Ind., Purdue Climate Change Research Center, Purdue University, 13 p., accessed June 16, 2022, at https://ag.purdue.edu/indianaclimate/indiana-climate-report/.
For additional information on Landsat, please contact:
Program Coordinator
USGS National Land Imaging Program
12201 Sunrise Valley Drive
Reston, VA 20192
703–648–4567
The Landsat series is a joint effort of USGS and NASA. NASA develops and launches the spacecraft; USGS manages satellite operations, ground reception, data archiving, product generation, and data distribution. Funding for the National Land Imaging Program’s Landsat operations and data management is provided through the USGS.
Suggested Citation
U.S. Geological Survey, 2022, Indiana and Landsat: U.S. Geological Survey Fact Sheet 2022–3049, 2 p., https://doi.org/10.3133/fs20223049.
ISSN: 2327-6932 (online)
ISSN: 2327-6916 (print)
Study Area
| Publication type | Report |
|---|---|
| Publication Subtype | USGS Numbered Series |
| Title | Indiana and Landsat |
| Series title | Fact Sheet |
| Series number | 2022-3049 |
| DOI | 10.3133/fs20223049 |
| Year Published | 2022 |
| Language | English |
| Publisher | U.S. Geological Survey |
| Publisher location | Reston, VA |
| Contributing office(s) | Earth Resources Observation and Science (EROS) Center |
| Description | 2 p. |
| Country | United States |
| State | Indiana |
| Online Only (Y/N) | N |
| Google Analytic Metrics | Metrics page |