

Database of Biodiversity, Habitat, and Aquatic-Resource Quantification Tools Used in Market-Based Conservation — 2022 Update
Links
- Document: Report (558 KB pdf) , HTML , XML
- Data Release: USGS data release - Database of Biodiversity, Habitat, and Aquatic Resource Quantification Tools Used for Market-based Conservation in the United States (ver. 2.0, June 2022)
- Download citation as: RIS | Dublin Core
Contents of the Updated Database
The updated database describes 107 quantification tools, which collectively assess at least 34 species and 39 habitat types. The attributes used to describe each tool encompass three broad categories: (1) general; (2) technical; and (3) ecological and geographic (table 1). Attributes were selected to convey the purpose and design of each tool, as well as the resources and skills needed to use them. Information about these tools was obtained from the websites of the tool owners as well as technical documents such as user guides, fillable forms, spreadsheet calculators and scientific methods documents. When these sources of information were unavailable or lacked certain details, points of contact (experts who developed or managed the tool) were asked to provide input about the tool attributes. The points of contact were also asked to confirm the accuracy of tool-specific information.
Table 1.
Types of descriptive information contained in the database of quantification tools used in aquatic-resource compensatory mitigation, biodiversity, and habitat markets in the United States.[Information in this table is grouped into three categories to aid interpretation; information in the database is not presented in the order displayed below]
Benefits of the Quantification Tools Database
The database is a centrally located and publicly available collection of diverse quantification tools that provides various benefits to users and the market-based conservation mechanisms that rely on these tools. It enables conservation practitioners and others engaged in conservation markets to better understand the purpose and function of the existing tools, thereby addressing the need for more transparency surrounding many assessment methods (Chiavacci and Pindilli, 2020). Greater transparency can help broaden the application of market-based conservation mechanisms. Additionally, an awareness of existing tools and an understanding of their purpose can facilitate the identification of taxonomic, habitat, or regional gaps in tool coverage. Lastly, the database can help tool developers avoid devoting resources to developing an assessment method like one that already exists. The wide variety of tools contained in the database, and the range of market and conservation program types they encompass, will likely greatly reduce the chances of redundant tool-building efforts.
Accessing the Database
Users can access and download the database by visiting https://doi.org/10.5066/F79G5M3X. The database is available in two formats: (1) a primary Excel file (.xlsx file extension) containing a database worksheet and two supporting information worksheets and formatted for ease of use and visual appeal, and (2) three single worksheets each representing one worksheet from the primary Excel file in comma-separated values (.csv file extension) format. The website listed above also contains a guide that briefly explains how to interpret the contents of each database file.

a. Assessing the quality and functionality of streams is a common objective of many quantification tools developed in the United States. These tools are often used to estimate the level of impairment or improvement to streams. Photograph by Ryan Hagerty, U.S. Fish and Wildlife Service, used with permission.

b. Population declines of the monarch butterfly (Danaus plexippus) led to a range of conservation efforts. One effort involves using a habitat quantification tool to assess habitat suitability for the species. Photograph by Grayson Smith, U.S. Fish and Wildlife Service, used with permission.
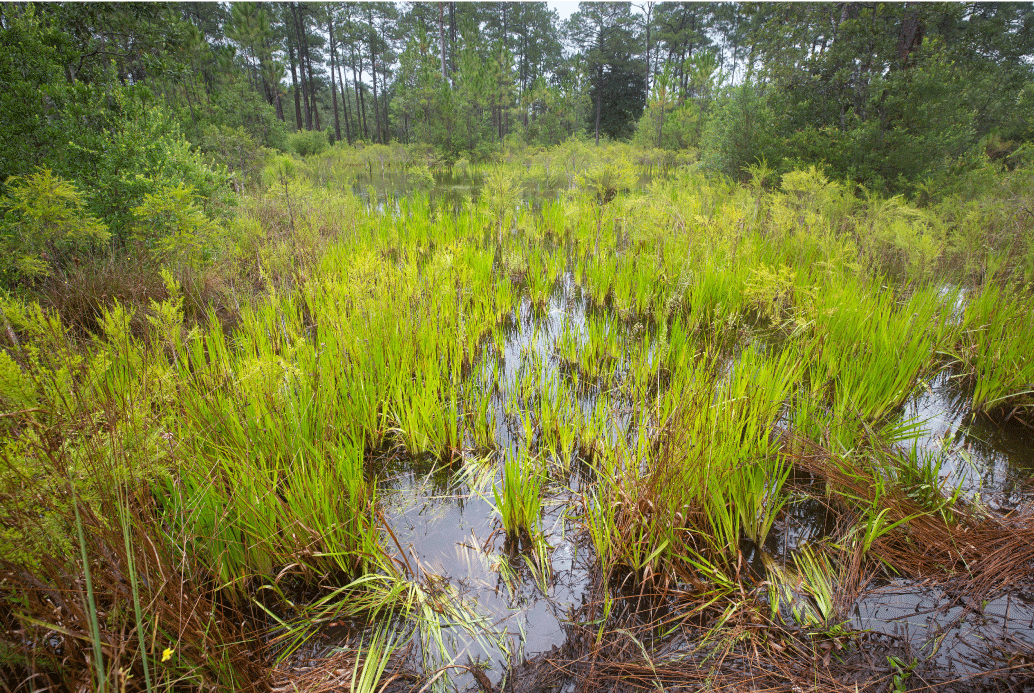
c. Wetlands, similar to streams, are a common focus of habitat quantification tools. Such tools are typically designed to estimate wetland quality before or following adverse effects or restoration efforts. Photograph by Ryan Hagerty, U.S. Fish and Wildlife Service, used with permission.
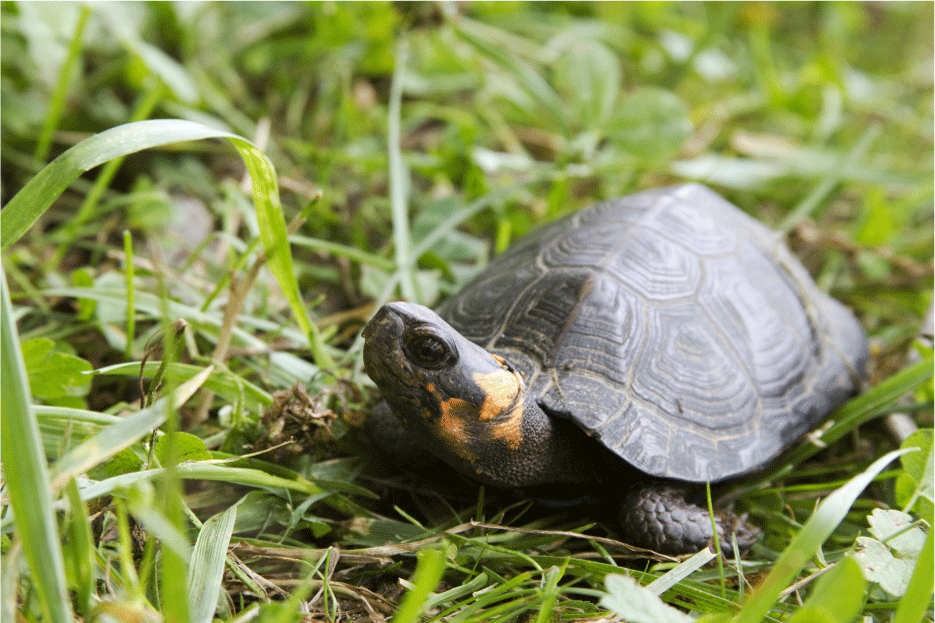
d. The bog turtle (Glyptemys muhlenbergii) is the smallest turtle in the United States. The species depends on spring fed wetlands and has been listed as federally threatened by the U.S. Fish and Wildlife Service since 1997. Efforts to conserve the species include the use of quantification tools for assessing habitat quality. Photograph by Garry Pebbles, U.S. Fish and Wildlife Service, used with permission.
References Cited
Chiavacci, S.J., and Pindilli, E.J., 2020, Trends in biodiversity and habitat quantification tools used for market-based conservation in the United States: Conservation Biology, v. 34, no. 1, p. 125–136. [Also available at https://doi.org/10.1111/cobi.13349].
Chiavacci, S.J., French, E.D., and Morgan, J.A., 2022, Database of biodiversity, habitat, and aquatic resource quantification tools used for market-based conservation in the United States (ver. 2.0, June 2022): U.S. Geological Survey data release, https://doi.org/10.5066/F79G5M3X.
For additional information, contact:
Scott J. Chiavacci, Ph.D., Ecologist
U.S. Geological Survey
Science and Decisions Center
12201 Sunrise Valley Drive
Reston, VA 20192
703-648-4063
schiavacci@usgs.gov
Suggested Citation
Chiavacci, S.J., French, E.D., and Morgan, J.A., 2022, Database of biodiversity, habitat, and aquatic-resource quantification tools used in market-based conservation — 2022 update: U.S. Geological Survey Fact Sheet 2022–3068, 2 p., https://doi.org/10.3133/fs20223068.
ISSN: 2327-6932 (online)
| Publication type | Report |
|---|---|
| Publication Subtype | USGS Numbered Series |
| Title | Database of biodiversity, habitat, and aquatic-resource quantification tools used in market-based conservation — 2022 update |
| Series title | Fact Sheet |
| Series number | 2022-3068 |
| DOI | 10.3133/fs20223068 |
| Year Published | 2022 |
| Language | English |
| Publisher | U.S. Geological Survey |
| Publisher location | Reston, VA |
| Contributing office(s) | Science and Decisions Center |
| Description | 2 p. |
| Online Only (Y/N) | Y |
| Additional Online Files (Y/N) | N |
| Google Analytic Metrics | Metrics page |