

Continuous Water-Quality and Suspended-Sediment Transport Monitoring in San Francisco Bay, California, Water Years 2020–21
Links
- Document: Report (2.03 MB pdf) , HTML , XML
- Download citation as: RIS | Dublin Core
Water-Quality in San Francisco Bay
The U.S. Geological Survey (USGS) has continuously monitored real-time water quality and suspended-sediment transport in San Francisco Bay (the Bay) since 1989 as part of a multi-agency effort (see “Acknowledgments” section) to address estuary management, water supply, and ecological concerns. The San Francisco Bay area is home to millions of people and biologically diverse marine and terrestrial flora and fauna. Freshwater mixes with saltwater in the Bay and is subject to riverine influences (floods, droughts, managed reservoir releases, and freshwater diversions) and marine influences (tides, waves, and effects of saltwater).
Water temperature, salinity, suspended-sediment concentration (SSC), and turbidity, are used by State and Federal resources managers and are monitored at eight key locations throughout the Bay (fig. 1). Water temperature and salinity affect the density of water, which controls gravity-driven circulation patterns and stratification in the water column. Salinity indicates the relative mixing of fresh and ocean waters in the Bay and is derived from specific conductance measurements. Turbidity is a measure of light scattered from suspended particles in the water that is used to estimate suspended-sediment concentration. Suspended-sediment concentrations also are directly measured through depth-integrated water sampling.
Suspended sediment affects Bay water quality in multiple ways. Suspended sediment affects phytoplankton growth by attenuating sunlight in the water column. Suspended sediment deposition on tidal marshes and intertidal mudflats helps to restore and sustain these habitats as sea level rises. Settling of suspended sediment in ports and shipping channels creates the need for more dredging. In addition, suspended sediment often carries adsorbed contaminants as it is transported in the water column, which affects the distributions and concentrations of adsorbed contaminants in the environment. Excessive concentrations of sediment-adsorbed contaminants in deposits on the bottom of the Bay can affect ecosystem health.
External factors, such as tidal currents, waves, and wind can also affect water quality in the Bay. Tidal currents in the Bay change direction four times daily, and wind direction and intensity typically fluctuate on a daily cycle. Consequently, salinity, water temperature, and suspended-sediment concentration differ spatially and temporally throughout the Bay. Therefore, high-frequency measurements at multiple locations are needed to monitor these changes. Data collected at eight stations throughout the Bay are transmitted in near real-time using cellular telemetry and posted to the USGS National Water Information System (NWIS; https://waterdata.usgs.gov/usa/nwis). The purposes of this fact sheet are to (1) provide information about the USGS San Francisco Bay water-quality monitoring network; (2) highlight various applications in which these data can be used; and (3) provide internet links to access the resulting continuous water-quality data collected by the USGS.
Program Overview
Continuous water-quality measurements are collected at eight stations in San Francisco Bay (table 1; fig. 1). Instruments are typically suspended in the water from stainless-steel cables that are anchored to the bottom of the Bay (figs. 2, 3) and are equipped with sensors that measure specific conductance, temperature, and turbidity (fig. 4A). Data are recorded every 15 minutes and are transmitted by cellular telemetry (yielding provisional data available within 1 hour of measurement) or retrieved during periodic station visits (yielding provisional data available within 1 week of the station visit). Table 1 lists the vertical location of the instruments at each station and provides the percentage of valid data collected during each instrument’s deployment during water years 2020–21 (the USGS water year runs from October 1 to September 30 and is defined by the calendar year in which the period ends). The percentage of valid data, after review and finalizing, ranged from 55 to 100 percent, with an average of 88 percent across all parameters and stations. The variability in the range of values is attributed to biological fouling and sensor failure. Biological growth (fig. 4B) affects sensor readings most frequently and usually increases with time, which requires the affected data to be revised or deleted. Copper tape is added around the instrument sensors (fig. 4A) because the copper reduces the rate and abundance of biological growth.
Each station is visited every 2–5 weeks for instrument inspection, cleaning, data retrieval, and instrument calibration as needed. Water samples are collected at the sensor depth to statistically relate turbidity data to co-located SSC (fig. 5). Periodically, discharge and cross-sectionally averaged SSC are measured concurrently at some stations to estimate the suspended-sediment flux at that location (Rasmussen and others, 2009). These data assist resource managers in quantifying the amount and direction of suspended sediment flowing in the Bay, which is necessary to understand sediment deposition. Discharge is measured using a boat-mounted acoustic Doppler current profiler (Mueller and others, 2013), and water samples are collected at several points across the channel with a depth-integrating suspended-sediment sampler (fig. 6; U.S. Geological Survey, 2006) using the equal-discharge-increment method (Edwards and Glysson, 1999). Suspended-sediment flux, expressed in mass per unit time, is computed as the product of discharge and the channel-average SSC at the indicated cross section.
Specific conductance, water temperature, and turbidity data are collected at two depths in the water column at stations featuring depths greater than 50 feet (ft) to help characterize the vertical variability in water quality. For stations in shallow water of less than 35 ft, such as San Francisco Bay at Pier 17 at San Francisco, California (table 1, USGS station number 374811122235001) and San Francisco Bay at the Northeast Shore of Alcatraz Island, California (table 1, USGS station number 374938122251801), data are collected only at one depth (U.S. Geological Survey, 2021). Specific conductance values are reported in microsiemens per centimeter (µS/cm) at 25 degrees Celsius (°C) and water temperatures reported in °C are measured using real-time smart sensors. Two types of optical sensors are used to measure turbidity values reported in formazin nephelometric units (FNU) because the YSI 6920 equipment is gradually being phased into the updated YSI EXO3 technology. In 2021, turbidity monitoring was added to the Carquinez Strait at Carquinez Bridge near Crockett, California (table 1, USGS station number 11455820).
Records undergo a thorough evaluation process before final approval. Data are analyzed, approved, and audited to ensure integrity. Data corrections (necessary because of biological fouling, sedimentation of the sensor, or instrument electronic drift) are applied to the affected periods of record following USGS guidelines (Wagner and others, 2006). Further details about these methods are available in the 2019 USGS state of the network newsletter (Work and Downing-Kunz, 2018).
Data obtained from this network have several applications, including calibrating numerical models (Bever and MacWilliams, 2013) and understanding the response of Bay water quality to extreme events such as prolonged drought (Work and others, 2017). Continuous water-quality and suspended sediment transport data, including water years 2020–21, are archived in the USGS National Water Information System (U.S. Geological Survey, 2021) and are available to the public (https://waterdata.usgs.gov/usa/nwis).
Table 1.
Continuous water-quality monitoring stations in San Francisco Bay, California, for the period October 1, 2019, through September 30, 2021 (U.S. Geological Survey, 2021).[MLLW, mean lower low water; WY, water year; µS/cm; microsiemens per centimeter; °C, degrees Celsius; SSC, suspended-sediment concentration; FNU, formazin nephelometric units; m, meter; —, parameter not collected at that station]
Percentage of valid data represents the number of valid data points for all of water years 2020–21 divided by the maximum possible number of data points for that period (96 data points is the maximum number per day with data collected at 15-minute intervals), multiplied by 100. The optical turbidity sensors tend to have higher sensitivity to fouling than the non-optical specific conductance and temperature sensors, leading to less valid data being collected.
Estimated from the National Oceanic and Atmospheric Agency Nautical Chart Catalog during the 1983–2001 National Tidal Datum Epoch (National Oceanic and Atmospheric Administration, 2021, https://www.charts.noaa.gov/InteractiveCatalog/nrnc.shtml).
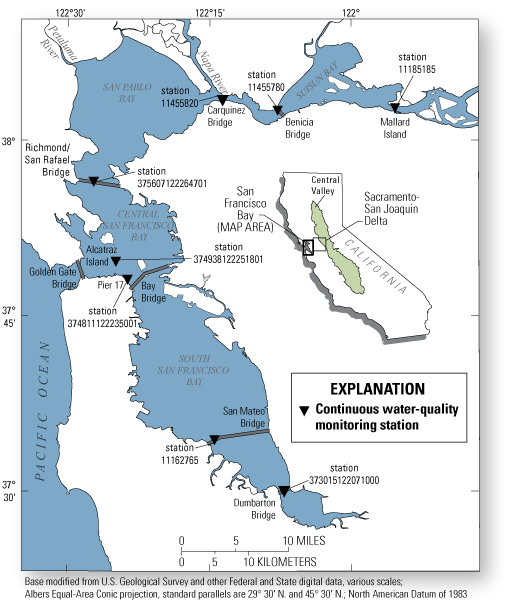
San Francisco Bay study area and monitoring stations, California (Einhell and others, 2020; table 1).
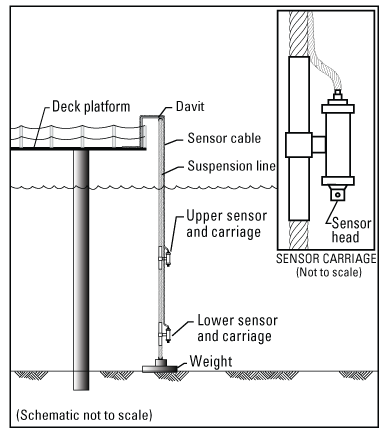
Monitoring installation schematic, San Francisco Bay study.

Monitoring installation with labeled equipment at San Francisco Bay at the Northeast Shore of Alcatraz Island, California (station number 374938122251801; U.S. Geological Survey, 2021). The solar panel provides power to the real-time equipment inside the enclosure. Data are received from the instruments and then transmitted by cellular telemetry. Photograph by Darin Einhell, U.S. Geological Survey, February 6, 2018.
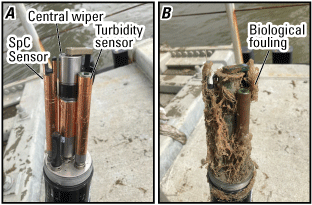
Instrument comparison at South San Francisco Bay at Dumbarton Bridge, California (station number 373015122071000; U.S. Geological Survey, 2021). A, Equipment setup showing copper tape used to deter biological growth and sensors labelled to show specific conductance (SpC), turbidity, and central wiper used to clean sensors. B, Example of biological fouling that can occur on instruments. Photographs by Darin Einhell, U.S. Geological Survey, March 30, 2022.
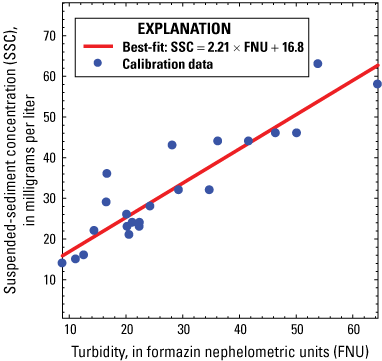
Example of using turbidity data from Suisun Bay at Mallard Island, California (station number 11185185; U.S. Geological Survey, 2021) from water years 2018 to 2020 to estimate suspended-sediment concentration (SSC). This statistical regression model from Einhell and others (2020) shows SSC in discrete water samples in relation to continuous optical turbidity sensor outputs. Turbidity is measured continuously at each site to provide a surrogate model to estimate SSC.
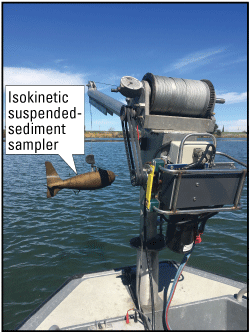
Depth-integrating sampler used to collect a suspended-sediment concentration sample in Sacramento–San Joaquin Delta. Photograph by Darin Einhell, U.S. Geological Survey, March 6, 2018.
For additional information:
https://ca.water.usgs.gov/projects/baydelta/
California Water Science Center
6000 J Street, Placer Hall, Sacramento, CA 95819
Acknowledgments
Collection of these data were supported by the U.S. Army Corps of Engineers, San Francisco District, as part of the Regional Monitoring and Regional Sediment Management Programs; Interagency Ecological Program, with support from the California Department of Water Resources; California State Coastal Conservancy; Bureau of Reclamation; U.S. Geological Survey Priority Landscapes Program; and the U.S. Geological Survey Federal/State Cooperative Program.
The use of firm, trade, and brand names in this fact sheet is for identification purposes only and does not constitute endorsement by the U.S. Government.
References Cited
Bever, A.J., and MacWilliams, M.L., 2013, Simulating sediment transport processes in San Pablo Bay using coupled hydrodynamic, wave, and sediment transport models: Marine Geology, v. 345, p. 235–253, accessed April 1, 2022, at https://doi.org/10.1016/j.margeo.2013.06.012.
Edwards, T.K., and Glysson, G.D., 1999, Field methods for measurement of fluvial sediment: U.S. Geological Survey Techniques of Water-Resources Investigations, book 3, chap. C2, 89 p., accessed April 4, 2022, at https://doi.org/10.3133/twri03C2.
Einhell, D.C., Downing-Kunz, M.A., and Livsey, D.N., 2020, Continuous water-quality and suspended-sediment transport monitoring in the San Francisco Bay, California, water years 2016–17: U.S. Geological Survey Fact Sheet 2020–3023, 4 p., accessed April 4, 2022, at https://doi.org/10.3133/fs20203023.
Mueller, D.S., Wagner, C.R., Rehmel, M.S., Oberg, K.A., and Rainville, F., 2013, Measuring discharge with acoustic Doppler current profilers from a moving boat (ver. 2.0, December 2013): U.S. Geological Survey Techniques and Methods, book 3, chap. A22, 95 p., accessed March 28, 2022, at https://doi.org/10.3133/tm3A22.
National Oceanic and Atmospheric Administration, 2021, Office of Coast Survey web page, accessed August 6, 2021, at https://www.charts.noaa.gov/InteractiveCatalog/nrnc.shtml.
Rasmussen, P.P., Gray, J.R., Glysson, G.D., and Ziegler, A.C., 2009, Guidelines and procedures for computing time-series suspended-sediment concentrations and loads from in-stream turbidity-sensor and streamflow data: U.S. Geological Survey Techniques and Methods, book 3, chap. C4, 53 p., accessed December 7, 2021, at https://pubs.usgs.gov/tm/tm3c4/.
U.S. Geological Survey, 2006, Collection of water samples (ver. 2.0): U.S. Geological Survey Techniques of Water-Resources Investigations, book 9, chap. A4, p. 50–58, accessed August 24, 2017, at https://pubs.water.usgs.gov/twri9A4/.
U.S. Geological Survey, 2021, USGS water data for the Nation: U.S. Geological Survey National Water Information System database, accessed August 6, 2021, at https://doi.org/10.5066/F7P55KJN.
Wagner, R.J., Boulger, R.W., Jr., Oblinger, C.J., and Smith, B.A., 2006, Guidelines and standard procedures for continuous water-quality monitors—Station operation, record computation, and data reporting: U.S. Geological Survey Techniques and Methods, book 1, chap. D3, 51 p., accessed March 17, 2021, at https://doi.org/10.3133/tm1D3.
Work, P.A., and Downing-Kunz, M.A., 2018, State of the network—Long-term, high-frequency flow and water quality data in the San Francisco Estuary, California—Interagency Ecological Program (IEP): Newsletter, v. 32, no. 1, p. 59–64. [Available at https://pubs.er.usgs.gov/publication/70199115.]
Work, P.A., Downing-Kunz, M.A., and Livsey, D., 2017, Record-high specific conductance and water temperature in San Francisco Bay during water year 2015: U.S. Geological Survey Open-File Report 2017–1022, 4 p., accessed March 17, 2021, at https://doi.org/10.3133/ofr20171022.
Suggested Citation
Palm, D.L., Einhell, D.C., Davila Olivera, S.M., 2022, Continuous water-quality and suspended-sediment transport monitoring in San Francisco Bay, California, water years 2020–21: U.S. Geological Survey Fact Sheet 2022–3087, 4 p., https://doi.org/10.3133/fs20223087.
ISSN: 2327-6932 (online)
Study Area
| Publication type | Report |
|---|---|
| Publication Subtype | USGS Numbered Series |
| Title | Continuous water-quality and suspended-sediment transport monitoring in San Francisco Bay, California, water years 2020–21 |
| Series title | Fact Sheet |
| Series number | 2022-3087 |
| DOI | 10.3133/fs20223087 |
| Year Published | 2022 |
| Language | English |
| Publisher | U.S. Geological Survey |
| Publisher location | Reston, VA |
| Contributing office(s) | California Water Science Center |
| Description | 4 p. |
| Country | United States |
| State | California |
| Other Geospatial | San Francisco Bay |
| Online Only (Y/N) | Y |
| Additional Online Files (Y/N) | N |
| Google Analytic Metrics | Metrics page |