

Magnitude and Frequency of Floods for Rural Streams in Georgia, South Carolina, and North Carolina, 2017—Summary
Links
- Document: Report (3.52 MB pdf) , HTML , XML
- Related Work: Scientific Investigations Report 2023–5006 - Magnitude and Frequency of Floods for Rural Streams in Georgia, South Carolina, and North Carolina, 2017—Results
- Data Releases:
- USGS data release - Magnitude and frequency of floods for rural streams in Georgia, South Carolina, and North Carolina, 2017—Data
- USGS data release - Model archive for magnitude and frequency of floods for rural streams in Georgia, South Carolina, and North Carolina, 2017
- Download citation as: RIS | Dublin Core
Overview
Reliable flood-frequency estimates are an important factor for hydraulic structure design and floodplain management. Annual peak streamflows (hereafter, referred to as peak flows) measured at 965 U.S. Geological Survey (USGS) streamgages were used to compute flood-frequency estimates with annual exceedance probabilities (AEPs) of 50, 20, 10, 4, 2, 1, 0.5, and 0.2 percent. These AEPs correspond to flood-recurrence intervals of 2, 5, 10, 25, 50, 100, 200, and 500 years, respectively. A subset of these streamgages (801) were used to develop equations to predict the flood-frequency estimates (hereafter, referred to as AEP streamflows) at ungaged stream locations. This study was completed by the USGS in cooperation with the Georgia, South Carolina, and North Carolina Departments of Transportation and the North Carolina Department of Crime Control and Public Safety; the results are summarized in this fact sheet. Complete results and the supporting data are presented in the companion scientific investigations report and data release (Feaster and others, 2023; Kolb and others, 2023).
Trends in Annual Peak Streamflows
From a hydraulic design and floodplain-management perspective, the assessment of trends in annual peak flows over time are important. Long-term trends in the annual peak flows could indicate changes in the hydrologic regime in a region, which could increase the uncertainty of estimating the AEP for future flood events based on the statistical analysis of historical data. Of the 331 current (operational in 2017), long-term (having 30 or more years of systematic record) streamgages, 276 (83 percent) indicated no statistically significant trend in peak flows, 45 (14 percent) indicated a significant downward trend, and 11 (3 percent) indicated a significant upward trend. The Kendall’s tau nonparametric test was used to assess the potential trends in the peak flows (Helsel and others, 2020). The results from the trend tests indicate no substantial long-term change in the peak-flow patterns for rural streams in Georgia, South Carolina, and North Carolina.
Flood-Frequency Estimates at Streamgage Locations
Flood-frequency estimates at 965 USGS streamgages with a minimum of 10 years of record through 2017 were completed using “Guidelines for Determining Flood Flow Frequency Bulletin 17C” (England and others, 2019). These guidelines improve on Bulletin 17B (B17B), which had been the Federal guidelines used for flood-frequency analyses since 1982 (Interagency Advisory Committee on Water Data, 1982). Like B17B, Bulletin 17C (B17C) recommends fitting the Pearson Type III distribution to the logarithms of annual peak flows, known as the log-Pearson type III (LPIII) distribution. Enhancements in B17C include (1) the expected moments algorithm (Cohn and others, 1997), an improved method-of-moments approach for fitting the LPIII distribution to the peak flows that can accommodate interval estimates of peak flow, censored estimates of peak flow, and multiple thresholds of observation; (2) a generalization of the Grubbs Beck low-outlier test called the multiple Grubbs Beck test (Cohn and others, 2013) that permits identification of multiple potentially influential low floods, which are small values (“low outliers”) that depart from the trend of the rest of the data, and; (3) accurate confidence interval formulas that can account for historical and paleoflood information, as well as regional skew information (Cohn and others, 2001).
Update of Regional Skew
The equation for the LPIII distribution to estimate AEP floods from annual peak flows at a USGS streamgage is a function of three parameters from the peak flows: mean, standard deviation, and skewness coefficient (skew). The skew measures the deviation of the LPIII distribution of the peak flows from the normal distribution, which is symmetrical on both sides of the distribution. Because uncertainty is relatively large in the skew computed at a streamgage (the streamgage skew) for short- to moderate-length records, B17C recommends weighting the streamgage skew with a regional skew coefficient (Griffis and Stedinger, 2007; England and others, 2019). A comparison of this and previous regional skew studies is shown in table 1.
Table 1.
Comparison of this and previous regional skew studies.[NA, not available; B17B, Bulletin 17B, Interagency Advisory Committee on Water Data, 1982]
| Study | Number of streamgages in regional skew analysis | Minimum length of record | Regional skew coefficient | Mean square error | Effective record length |
|---|---|---|---|---|---|
| Feaster and others, 2023 | 368 | 35 years | 0.048 | 0.092 | 73 years |
| Feaster and others, 2009 | 342 | 30 years | −0.019 | 0.143 | 39 years |
| B17B | NA | NA | NA | 0.302 | 17 years |
This substantial improvement in the mean square error from B17B and from the previous rural flood-frequency study can be partly attributed to improved analytical methods and long-term streamflow records at USGS streamgages.
Regionalization: Estimating Peak Streamflows at Ungaged Locations
Regionalization is a process for developing regression equations using the at-site AEP streamflows. The regression equations allow for the estimation of AEP streamflows at ungaged locations (Farmer and others, 2019). A multistate approach was used in the previous rural flood-frequency study for Georgia (Gotvald and others, 2009), South Carolina (Feaster and others, 2009), and North Carolina (Weaver and others, 2009), and in the previous urban flood-frequency study including Georgia, South Carolina, and North Carolina by Feaster and others (2014). Similarly, a multistate approach was used to develop regional flood-frequency equations to estimate the magnitude and frequency of floods at ungaged locations for rural streams in Georgia, South Carolina, and North Carolina. This also included streamgages near the border from the surrounding States of Alabama, Florida, Tennessee, and Virginia (Feaster and others, 2023). Using the multistate approach allows for a larger database of streamgages covering a larger geographical area that will represent a broader range of hydrologic conditions likely to result at ungaged locations. This approach also provides consistency in flood-frequency estimates across Georgia, South Carolina, and North Carolina, which is beneficial for hydraulic projects that include basins located in more than one State.
The five hydrologic regions (HRs) included in the previous flood-frequency reports noted earlier were verified to still be appropriate: HR1, Piedmont and Ridge and Valley; HR2, Blue Ridge; HR3, Sand Hills; HR4, Coastal Plain; and HR5, Lower Tifton Upland (fig. 1). Of the 965 streamgages for which at-site AEP streamflows were computed, 801 streamgages were included in the regional regression analysis (670 from Georgia, South Carolina, and North Carolina, and 131 from the surrounding States). The remaining 164 streamgages were excluded from the regression analysis because of redundancy, which results when the drainage basins of two streamgages are nested one within the other and are similar in size. The regression equations relate 50‑, 20‑, 10‑, 4‑, 2‑, 1‑, 0.5‑, and 0.2‑percent AEP streamflows to drainage area and the percentage of the basin draining from the five HRs with the HR4, Coastal Plain considered to be the base region (table 2). For basins that drain 100 percent from a single hydrologic region, the regression equations simplify to the form shown in table 3 and the regression curves shown in figure 2. The regression curve for HR2, Blue Ridge was shown to have a different slope from the other HRs, and this difference in slope was accounted for by adding a cross product of drainage area and percentage of drainage area from HR2, Blue Ridge (fig. 2; table 2).
The pseudo coefficient of determination (pseudo R2) metric is a measure of how much the uncertainty in the AEP streamflows is explained by the explanatory variables used in the equations after removing the effect of the time-sampling error, which is based on the available period of record for the analysis. The pseudo R2 for the regression equations developed in this study ranged from 94.1 to 89.5 percent for the 50‑ and 0.2‑percent AEP streamflows, respectively. The average standard error of prediction, which is a measure of the average accuracy of the regression equations when predicting AEP streamflows at ungaged sites, ranged from 35.8 to 44.4 percent. There is about a 68‑percent probability that the true AEP streamflow at an ungaged location will be within plus or minus the average standard error of prediction of the regression estimate (Hodgkins, 1999).
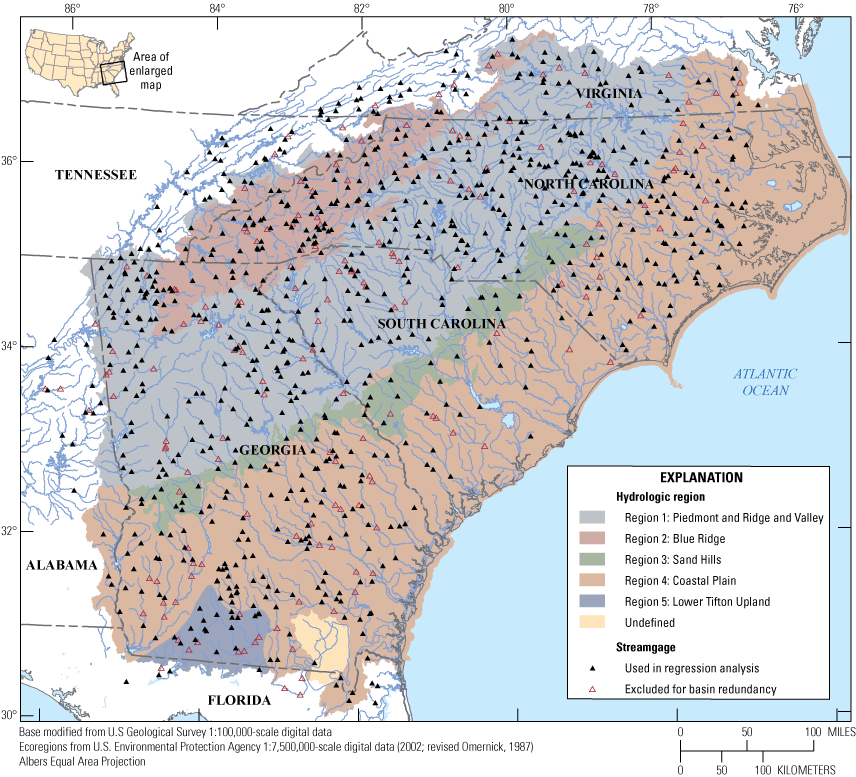
Map showing hydrologic regions and locations of rural U.S. Geological Survey streamgages with 10 or more years of record that were considered for use in the regional regression analysis for rural streams in Georgia, South Carolina, North Carolina, and surrounding States. See figure 2 in Feaster and others (2023) for streamgage site identifiers.
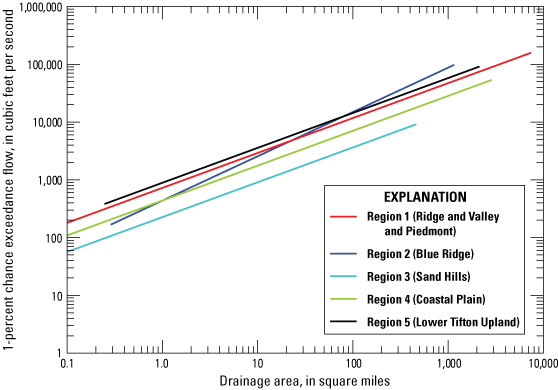
Graph showing rural flood-frequency relations for the 1‑percent annual exceedance probability flow by hydrologic region for basins located 100 percent within one hydrologic region, for Georgia, South Carolina, and North Carolina.
Table 2.
Regional flood-frequency equations for estimating peak flows at unregulated, ungaged rural locations in Georgia, South Carolina, and North Carolina.[Q50%, Q20%,…, Q0.2%, peak flows with annual exceedance probabilities of 50 percent, 20 percent,…, and 0.2 percent, in cubic feet per second; PCT1, PCT2, PCT3, and PCT5 are the basin percentages in hydrologic regions 1, 2, 3, and 5, in percent; DA, drainage area, in square miles. Note: When PCT1, PCT2, PCT3, and PCT5 are zero, the equation represents sites that are located 100 percent in hydrologic region 4]
Table 3.
Regional flood-frequency equations for estimating peak flows at unregulated, ungaged rural locations in Georgia, South Carolina, and North Carolina for drainage basins located 100 percent within one hydrologic region.[HR, hydrologic region; DA, drainage area, in square miles. Hydrologic regions are shown in figure 1]
Possible Future Studies
Streamflow statistics, such as flood frequency and low-flow frequency, are strongly affected by length of streamflow record included in the analysis and hydrologic conditions determined in that record. Therefore, such statistics are typically recommended to be updated about every 10 years. At the end of water year 2023 (September 30, 2023), 12 years will have passed since urban flood-frequency statistics and regional regression equations have been updated in Georgia, South Carolina, and North Carolina. Thus, a reasonable and logical next step following the update of the rural flood-frequency at-site statistics and regional regression equations would be to update the urban flood-frequency statistics. In such a study, the rural flood-frequency statistics recently published in Feaster and others (2023) could be leveraged for use in a possible study of urban flood-frequency statistics. In Feaster and others (2014), urban and rural streamgages were included in the flood-frequency analysis but the drainage-area sizes were limited based on the upper limit of drainage areas of the urban streamgages. In a possible future study to update the urban flood-frequency statistics and regional regression equations, the exploratory analysis could include the 801 rural streamgages used in Feaster and others (2023) along with updated urban flood-frequency statistics from peak-streamflow data through at least 2023. Statistical tests could include adding additional explanatory variables, such as percentage of impervious area or percent development, to account for changes in AEP streamflows because of urbanization in a basin. In addition, the study could test the possibility of having one set of equations that apply to both rural and urban basins providing consistency in regional-regression results across rural and urban basins and simplifying the application of USGS flood-frequency equations for users.
References Cited
England, J.F., Jr., Cohn, T.A., Faber, B.A., Stedinger, J.R., Thomas, W.O., Jr., Veilleux, A.G., Kiang, J.E., and Mason, R.R., Jr., 2019, Guidelines for determining flood flow frequency—Bulletin 17C (ver. 1.1, May 2019): U.S. Geological Survey Techniques and Methods, book 4, chap. B5, 148 p. [Also available at https://doi.org/10.3133/tm4B5.]
Farmer, W.H., Kiang, J.E., Feaster, T.D., and Eng, K., 2019, Regionalization of surface-water statistics using multiple linear regression: U.S. Geological Survey Techniques and Methods, book 4, chap. A12, 40 p., accessed January 2020 at https://doi.org/10.3133/tm4A12.
Feaster, T.D., Gotvald, A.J., Musser, J.W., Weaver, J.C., Kolb, K.R., Veilleux, A.G., and Wagner, D.M., 2023, Magnitude and frequency of rural floods in Georgia, South Carolina, and North Carolina, 2017—Results: U.S. Geological Survey Scientific Investigations Report 2023–5006, 75 p., https://doi.org/10.3133/sir20235006.
Feaster, T.D., Gotvald, A.J., and Weaver, J.C., 2014, Methods for estimating the magnitude and frequency of floods for urban and small, rural streams in Georgia, South Carolina, and North Carolina, 2011 (ver. 1.1, March 2014): U.S. Geological Survey Scientific Investigations Report 2014–5030, 104 p. [Also available at https://doi.org/10.3133/sir20145030.]
Gotvald, A.J., Feaster, T.D., and Weaver, J.C., 2009, Magnitude and frequency of rural floods in the southeastern United States, 2006—Volume 1, Georgia: U.S. Geological Survey Scientific Investigations Report 2009–5043, 120 p. [Also available at https://doi.org/10.3133/sir20095043.]
Helsel, D.R., Hirsch, R.M., Ryberg, K.R., Archfield, S.A., and Gilroy, E.J., 2020, Statistical methods in water resources: U.S. Geological Survey Techniques and Methods, book 4, chap. A3, 458 p., https://doi.org/10.3133/tm4a3. [Supersedes U.S. Geological Survey Techniques of Water-Resources Investigations, book 4, chapter A3, version 1.1.]
Kolb, K.R., Musser, J.W., Feaster, T.D., Gotvald, A.J., and Weaver, J.C., 2023, Magnitude and frequency of floods for rural streams in Georgia, South Carolina, and North Carolina, 2017—Data: U.S. Geological Survey data release, https://doi.org/10.5066/P9TSBPFS.
Weaver, J.C., Feaster, T.D., and Gotvald, A.J., 2009, Magnitude and frequency of rural floods in the southeastern United States, through 2006—Volume 2, North Carolina: U.S. Geological Survey Scientific Investigations Report 2009–5158, 111 p. [Also available at https://doi.org/10.3133/sir20095158.]
For additional information, contact:
Director, South Atlantic Water Science Center
U.S. Geological Survey
1770 Corporate Drive, Suite 500
Norcross, GA 30093
Full results available in Scientific Investigations Report 2023–5006:
Suggested Citation
Feaster, T.D., Gotvald, A.J., Musser, J.W., Weaver, J.C., and Kolb, K.R., 2023, Magnitude and frequency of floods for rural streams in Georgia, South Carolina, and North Carolina, 2017—Summary: U.S. Geological Survey Fact Sheet 2023–3011, 6 p., https://doi.org/10.3133/fs20233011.
ISSN: 2327-6932 (online)
Study Area
| Publication type | Report |
|---|---|
| Publication Subtype | USGS Numbered Series |
| Title | Magnitude and frequency of floods for rural streams in Georgia, South Carolina, and North Carolina, 2017—Summary |
| Series title | Fact Sheet |
| Series number | 2023-3011 |
| DOI | 10.3133/fs20233011 |
| Year Published | 2023 |
| Language | English |
| Publisher | U.S. Geological Survey |
| Publisher location | Reston, VA |
| Contributing office(s) | Georgia Water Science Center, South Atlantic Water Science Center |
| Description | Report: 6 p.; 2 Data Releases |
| Country | United States |
| State | Georgia, North Carolina, South Carolina |
| Online Only (Y/N) | Y |
| Additional Online Files (Y/N) | N |
| Google Analytic Metrics | Metrics page |