

Implementation Plan of the National Cooperative Geologic Mapping Program Strategy—Great Lakes (Central Lowland and Superior Upland Physiographic Provinces)
Links
- Document: Report (3.16 MB pdf) , HTML , XML
- Download citation as: RIS | Dublin Core
Introduction
The U.S. Geological Survey (USGS) National Cooperative Geologic Mapping Program (NCGMP) has published a strategic plan entitled “Renewing the National Cooperative Geologic Mapping Program as the Nation’s Authoritative Source for Modern Geologic Knowledge” (Brock and others, 2021). This plan provides the following vision, mission, and goals for the program for the years 2020–30:
-
Vision: create an integrated, three-dimensional (3D), digital geologic map of the United States.
-
Mission: characterize, interpret, and disseminate a national geologic framework model of the Earth through geologic mapping.
-
Goal: focus on geological mapping as a core function of the USGS within the long-term vision and mission of creating a digital geologic map and geologic framework model of the Nation.
To achieve the goal outlined in the strategic plan, the NCGMP has developed an Implementation Plan. This Implementation Plan will guide annual reviews of the FEDMAP component (that is, the component of the USGS NCGMP that funds geologic mapping by USGS geologists) of the NCGMP projects described in the plan and the development of the annual FEDMAP prospectus, which will ensure the application of the NCGMP strategy.
This publication is part of the Implementation Plan of the NCGMP strategy and addresses the following three major topics:
-
continued development of a consistent National geologic map and database;
-
the major unanswered geologic questions in the region; and
-
the societal concerns associated with these geologic questions, such as hazards, geologic and hydrologic resources, and environmental issues.
The regions used in this chapter correspond with physiographic divisions of the United States as defined by Fenneman (1917, 1928, 1946). Physiographic divisions are delineated on the basis of topography, and to a lesser extent, the geologic structure and history. The physiographic divisions are subdivided into physiographic provinces, and the physiographic provinces are subdivided into physiographic sections. Fenneman’s physiographic divisions of the United States provide a robust and useful spatial organization for delineating large geographic regions of the United States for various scientific and industrial applications.
Geographic Location, Physiography, and Member States
As defined in this Implementation Plan, the Great Lakes Geologic Province (Central Lowland and Superior Upland Physiographic Provinces) includes the States within the Great Lakes watershed (drainage basin) and parts of surrounding States in the Central Lowland Physiographic Province that were glaciated during the Quaternary (fig. 1). States fully or almost fully within the geologic province (as defined in this Implementation Plan) include Minnesota, Iowa, Wisconsin, Michigan, and Illinois. States partially within the geologic province (as defined in this Implementation Plan) include North Dakota, South Dakota, Nebraska, Kansas, Missouri, Indiana, Ohio, Pennsylvania, and New York.
Great Lakes region physiographic provinces and watershed boundary.
The Great Lakes Geologic Province, as defined for this Implementation Plan (fig. 1), includes the U.S. portion of the Central Lowland Physiographic Province, which spans about (~) 1,102,500 square kilometers (km2) (~425,700 square miles [mi2]) and the U.S. portion of the Superior Upland Physiographic Province, which spans ~110,700 km2 (~42,700 mi2). The Central Lowland Physiographic Province is the low relief eastern portion of the Interior Plains Physiographic Division of Fenneman (1917, 1928, 1946). Many of the physiographic features of the Central Lowland Physiographic Province extend into Canada. The Central Lowland Physiographic Province is an area of modest to low relief, rising less than 300 meters (m; ~980 feet [ft]) elevation above sea level in the east to about 610 m (~2,000 ft) elevation in the west. The Superior Upland Physiographic Province is the portion of the Laurentian Highland Physiographic Division that surrounds Lake Superior (Fenneman, 1917, 1928, 1946). The Superior Upland Physiographic Province extends mostly south and west from Lake Superior and is in northern Wisconsin and northeastern Minnesota. The Superior Upland Physiographic Province is also an area of low relief, ranging from ~180 m (~600 ft) elevation above sea level on the shores of Lake Superior to ~500 m (~1,640 ft) elevation in northeastern Minnesota. The Superior Upland Physiographic Province is the southern extension of the Laurentian Highland Province, most of which is in Canada.
The Great Lakes watershed consists of the Great Lakes and the hydrologically contributing lands of the States of Illinois, Indiana, Michigan, Minnesota, New York, Ohio, Pennsylvania, and Wisconsin in the United States, and the Province of Ontario in Canada. Direct surface runoff and groundwater discharge contribute to the water budgets of the Great Lakes. As summarized by Quinn (1992) and Sterner (2021), Lake Superior has a mean surface elevation of 183 m and mean depth of 141 m; Lake Michigan has a mean surface elevation of 176 m and mean depth of 84 m; Lake Huron has a mean surface elevation of 176 m and mean depth of 59 m; Lake Erie has a mean surface elevation of 174 m and mean depth of 19 m; and Lake Ontario has a mean surface elevation of 75 m and mean depth of 89 m. The lake bottoms are not flat and numerous bathymetric depressions (or “depositional basins”) are present within each of the Great Lakes (Larson and Schaetzl, 2001).
Geologic Framework
The “geologic framework” (or “stratigraphic architecture”) of the Great Lakes region consists primarily of Precambrian and Paleozoic strata (although some thin beds of Mesozoic strata are present in a few places), capped by a regional unconformity that is overlain by Quaternary sediments (for example, Kesler, 2019). The Paleozoic strata are particularly thick in the following geologic basins that underlie the Great Lakes region: the Michigan Basin, the Illinois Basin, and the Appalachian Basin (fig. 1). These Paleozoic basins consist predominantly of carbonate strata, with three major intervals of siliciclastic strata that accumulated during time durations of 10–40 million years (for example, Ryder and others, 2008; Swezey, 2008, 2009). These three intervals of siliciclastic strata that each accumulated during time durations of 10–40 million years are coincident with the three major glaciations of the Paleozoic, and they are also associated with orogenic events in the Appalachian Basin (Swezey, 2018).
Precambrian igneous, metamorphic, and sedimentary rocks are exposed at the surface in the Superior Upland Physiographic Province, but in most areas of the Great Lakes region Quaternary glacial sediments are exposed at the surface and these sediments rest directly on an unconformity above Paleozoic strata. These Paleozoic strata include sandstone, shale, carbonate, and coal. These Paleozoic strata contain many economic resources such as oil, natural gas, economic minerals, evaporites (salt, gypsum, brine), sandstone, limestone, and dolomite (for example, Swezey and others, 2015). The USGS Earth Mapping Resources Initiative (Earth MRI) program (https://www.usgs.gov/special-topic/earthmri) has a strong interest in various “critical minerals” (minerals for which the United States is dependent upon other countries for supply) that are found in these Precambrian and Paleozoic rocks. Of these “critical minerals,” the highest priority is rare earth elements (REEs), which are found in association with black shale in the Paleozoic basins (Hammarstrom and others, 2020). Other critical minerals in these Precambrian and Paleozoic rocks include fluorspar, potash, and graphite (for a list of priority critical minerals, see Fortier and others, 2018).
The Quaternary sediments of the Great Lakes region are associated with ice sheets that advanced into and withdrew from the Central Lowland Physiographic Province repeatedly during the Pleistocene, and the modern morphology of the Great Lakes is the result of repeated glacial scour by subglacial erosion processes during the Quaternary (see reviews by Larson and Schaetzl, 2001; Curry and others, 201117). These Quaternary sediments include deposits of glacial environments (tills, glaciolacustrine, and outwash) and associated environments (for example, eolian, fluvial, lacustrine). During the most recent ice age (the Wisconsin), which reached its maximum ~31.1 to 23.2 thousand years ago (ka; reported by Clark and others [2009] as 26.5 to 19–20 ka in radiocarbon years before present, and then converted to calibrated years; see also Dalton and others, 2020), major ice lobes of the Laurentide Ice Sheet advanced southward into North Dakota, South Dakota, Minnesota, Iowa, Wisconsin, Illinois, Michigan, Indiana, Ohio, Pennsylvania, New York, and the New England States (fig. 2). Thick units of Quaternary sediments accumulated in areas marginal to these major ice lobes. In the State of Illinois, the last glaciation reached a maximum extent at approximately 24,200 calibrated years Before Present (Curry and others, 2018). During the late Quaternary from approximately 12.9 to 8.4 ka (Teller and Leverington, 2004), glacial Lake Agassiz formed in front of (south of) the retreating ice sheets and extended across much of eastern Saskatchewan, Manitoba, northern Ontario, eastern North Dakota, and northwestern Minnesota (fig. 2). This lake covered more than 160,900 km2 (100,000 mi2) and had a strong influence on the Quaternary sediments and geomorphology of the Great Lakes region. Since the formation of Lake Agassiz, the Great Lakes have had a complicated history of high and low lake levels caused by glacial advances and retreats, changing outlets, and isostatic adjustments (see review by Larson and Schaetzl, 2001). Postglacial variations in climate and continued isostatic rebound have caused additional alterations of nearshore environments of the Great Lakes (Lewis and others, 2005; Mainville and Craymer, 2005).
Extent of various Quaternary ice sheet advances in the Great Lakes region (modified from Mickelson and Colgan, 2003; Larson and Kincare, 2009). Lake Agassiz location and dates are from Leverington and Teller (2003). Age of last glacial maximum (Wisconsin) is from Clark and others (2009) (converted from radiocarbon years before present to calibrated years before present); age of Illinois glaciation is from Curry and others (2011); and age of pre-Illinois glaciations is from Balco and others (2005) and Rovey and Balco (2011). Outlines of geologic (Paleozoic) basins are from East and others (2012).
Because the Great Lakes region was glaciated multiple times during the Quaternary (for example, Wisconsin, Illinois, and several pre-Illinois glacial episodes), each major successive glacial advance and retreat (including multiple smaller advances and retreats within each episode) partly eroded and partly buried some portions of the existing landscape while preserving other portions. These advances and retreats produced a region characterized by complex landscapes and stratigraphy truncated by unconformities. The resulting topography is relatively flat and the stratigraphy is poorly exposed. However, some outcrops of Quaternary sediments are exposed by natural erosion and human extractive and engineering activities (for example, roads).
Status of Geologic and Topographic Mapping
Geologic maps are used by many sectors of the economy, such as the exploration and development of natural resources (groundwater, minerals, energy), environmental consulting (pollution prevention and mitigation issues), geologic hazard protection and prevention, engineering and infrastructure applications (buildings, roads, railroads, pipelines, utilities, dams), and city planning (zoning decisions, building codes, landscape planning). Geologic maps also provide intangible benefits such as time and money saved in project completions and avoiding costly mistakes, the generation of new knowledge, and increased credibility of reports using geologic map data (Bhagwat and Ipe, 2000). In other words, the data portrayed in geologic maps provide information that can maximize benefits and minimize damage to society. A study of costs and benefits of geologic mapping programs in Illinois determined that geologic mapping is a public good whereby future costs to society can be avoided because of knowledge gained through geologic mapping (Bhagwat and Berg, 1991). A detailed study of the effects of geologic map use on the economy of Kentucky determined that the “value of the geologic maps to the users was at least 25 to 38 times higher than the cost of the mapping program” (Bhagwat and Ipe, 2000, p. 24). This study also determined that the “overwhelming scale preference is for 1:24,000 maps” and that the 1:24,000 scale “better facilitates planning and resource decisions than do other scales” (Bhagwat and Ipe, 2000, p. 10). However, as stated in USGS Circular 1111, “producing uniform geologic map coverage for the Nation, at a scale detailed enough for nearly all perceived uses, will be extremely expensive and thus should be a long-term goal that is systematically approached by establishing mapping priorities that represent shorter term goals” (Bernknopf and others, 1996, p. 4).
During the 1990s, the USGS began significant funding of geologic mapping projects by State Geological Surveys (STATEMAP; that is, the component of the USGS NCGMP that funds geologic mapping by State Geological Surveys) and to a lesser extent academia (EDMAP; that is, the component of the USGS NCGMP that funds geologic mapping by university and college students). This funding revitalized geologic mapping of glacial deposits across the Great Lakes region at scales of 1:24,000 to 1:100,000. Much of this geologic mapping was driven by the need for information to help solve environmental problems or to assess groundwater or mineral resources. Many State Geological Surveys have also developed derivative maps (for example, contamination potential, aggregate resources) on the basis of maps of Quaternary sediments in the Great Lakes region (Berg and others, 2016).
Status of Existing Geologic Maps
Many geologic maps have been published in the Great Lakes region at scales of 1:24,000 and 1:100,000, and also at scales of 1:48,000, 1:50,000, 1:62,500, and 1:250,000 (fig. 3). Not all of these maps are “general purpose” geologic maps or compilations; some are structure contour maps, isopach maps, or maps showing other targeted geologic data. Many of these geologic maps, however, include geologic cross sections. These cross sections, along with isopach maps and structure contour maps, provide a framework for visualizing the subsurface geology in three dimensions. Such elements of 3D geologic mapping are common in geological studies of energy, mineral, and groundwater resources.
Status of existing published geologic maps in the Great Lakes region. These data were extracted from the U.S. Geological Survey National Geologic Map Database (U.S. Geological Survey, 2021). The data include standard geologic maps and derivative maps such as structure contour maps, isopach maps, or maps of other targeted geologic data.
Three-dimensional (3D) geological maps are an extension of traditional geological maps, which portray a two-dimensional (2D) view of the surface geology along with 3D views shown in cross sections. Modern 3D geological maps can portray stacked subsurface stratigraphic units showing structure-contoured surfaces of depth, thickness, and material properties within a volumetric space.
Status of Existing and Planned Lidar Topographic Data
Modern geologic mapping is done preferentially in conjunction with light detection and ranging (lidar) data. At present, modest lidar coverage exists for many areas of the Great Lakes region (fig. 4). Although high-resolution topographic data are not necessarily a requirement for all scales of geologic mapping, such data should be used where possible for 1:24,000 to 1:100,000 geologic mapping because these data greatly enhance the ability to perceive high-resolution details of a landscape.
Status of existing and planned light detection and ranging (lidar) data in the Great Lakes region. These data were extracted from the U.S. Geological Survey National Geologic Map Database (U.S. Geological Survey, 2021).
Status of Existing Geophysical Potential Field Data
Some USGS geophysical potential field data that are focused on Quaternary sediments are available for southwestern Michigan and have been useful for geologic mapping in this area (Stone, 2001; Stone and others, 2017). New geophysical potential field data in the Great Lakes region may be acquired by the USGS Earth MRI program, although most of these new data are likely to be focused primarily on aspects of deeper bedrock geology that host mineral resources. Nevertheless, any new geophysical data should be consulted as they become available.
Areas of detailed geologic mapping should use geophysical survey data with quality of Rank 1 (data that were acquired digitally with Global Positioning System [GPS] navigation), which is most appropriate for 1:24,000 scale geologic mapping (Drenth and Grauch, 2019). However, much of the available USGS geophysical data that might be used to determine the elevation of the bedrock surface are classified as having quality of Ranks 3 or 4 (data that have significant or unresolvable issues, large gaps, and [or] unknown or poorly known survey parameters), which are most appropriate for 1:250,000 to 1:500,000 scale geologic mapping (Drenth and Grauch, 2019).
Synopsis of Recent NCGMP-Funded Science and Geologic Mapping
The USGS, State Geological Surveys, and academic research groups (including EDMAP) have made major contributions to the understanding of the Quaternary glacial record of the Great Lakes region (for example, Karrow and Calkin, 1985; Gillespie and others, 2004; Kehew and Curry, 2018). Recent geologic mapping efforts funded by FEDMAP and STATEMAP have focused on Quaternary sediments in many locations throughout the Great Lakes watershed (fig. 5). Recent FEDMAP efforts have focused primarily on locations in Michigan, whereas STATEMAP efforts have been spread across most of the other Great Lakes States. In addition, the Great Lakes Geologic Mapping Coalition (GLGMC), which is a joint effort of USGS FEDMAP, U.S. State Geological Surveys of the Great Lakes region, and the Ontario Provincial Geological Survey (Canada), has provided a context by way of annual meetings to discuss findings and plan collaborative activities. The GLGMC has emphasized mapping of the Quaternary glacial geology of the region, including 3D geologic maps to depths of several hundred meters, to provide scientific interpretations for decision-makers (Berg and others, 2000, 2016). This effort has stimulated research questions toward improved understanding of glacial stratigraphy and 3D geologic mapping and modeling.
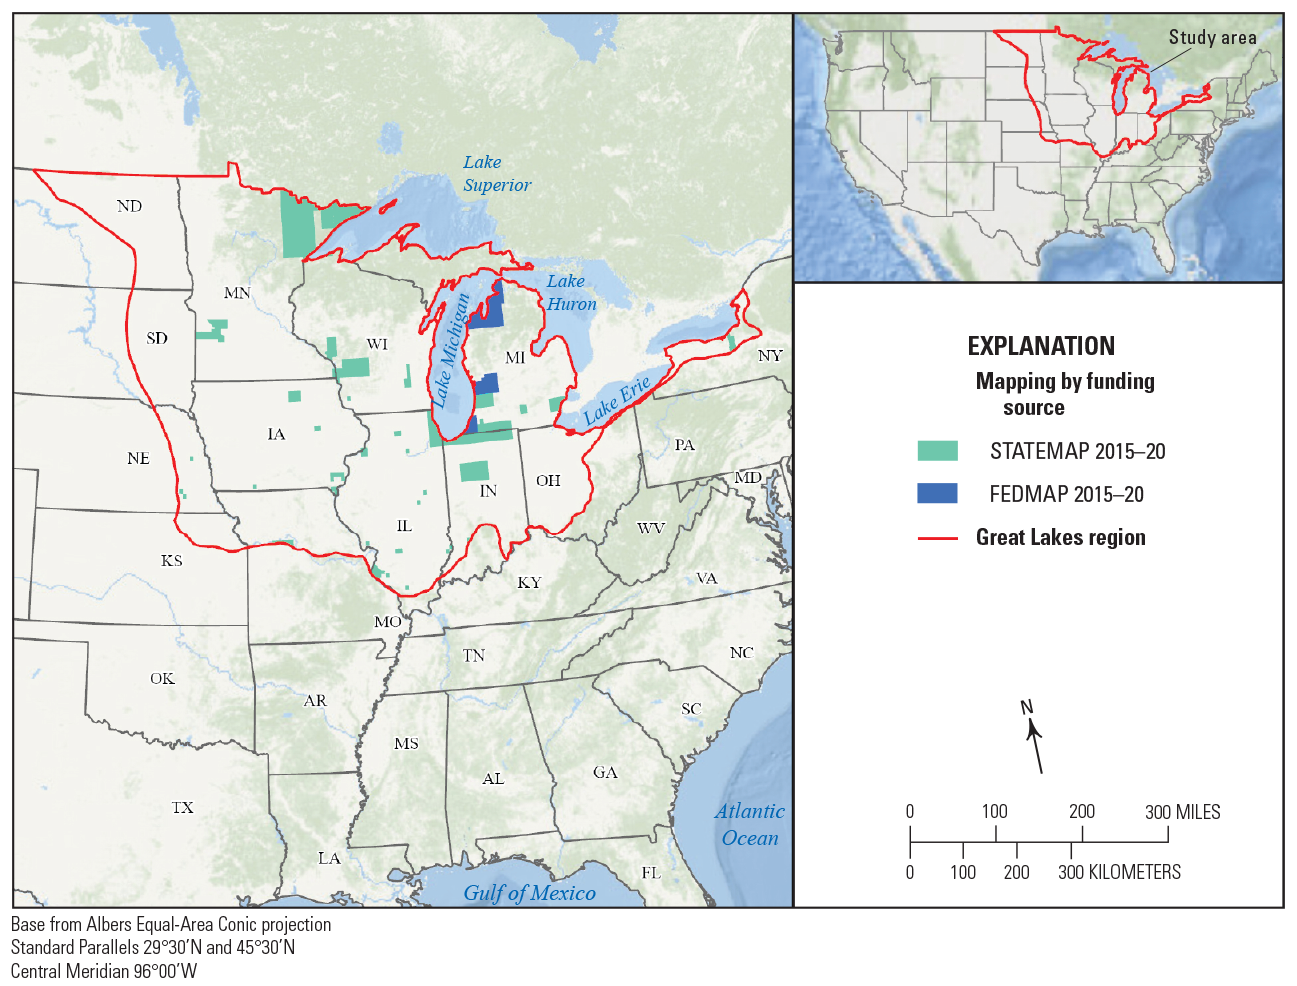
Status of FEDMAP and STATEMAP geologic mapping efforts for 2015–20 in the Great Lakes region. These data were extracted from the U.S. Geological Survey National Geologic Map Database (U.S. Geological Survey, 2021).
A significant contribution to understanding the Quaternary glacial geology of the Great Lakes region is the “Quaternary Geologic Atlas of the United States” (for example, Goebel and others, 1983; Lineback and others, 1983; Farrand and others, 198424). This atlas depicts the areal distribution of Quaternary surficial sediments at 1:1,000,000 scale. The maps were published by the USGS as printed editions during the 1980s and were digitized during 2001–16. Digital datasets associated with these maps include map unit polygons, linear glacial features, point data for drumlins and type localities, important stratigraphic sections, and line coverages for hydrology and topography.
A subsequent NCGMP-sponsored regional effort resulted in the publication of 1:1,000,000 scale maps and various digital derivatives of Quaternary glacial sediments (Soller, 1993, 1997; Soller and others, 2012; Soller and Garrity, 2018). These maps are different from the Quaternary Geologic Atlas because they portray the thickness and character of the Quaternary sediments and provide a regional 3D view of these sediments including the following features: (1) surface distribution of predominant lithologies of Quaternary sediments; (2) total thickness of Quaternary sediments; (3) bedrock topography; and (4) “stacked” maps showing Quaternary sediment texture and character.
Groundwater studies by USGS scientists have made additional contributions to understanding the Quaternary geology of the Great Lakes region at a regional scale (for example, Feinstein and others, 2010; Bayless and others, 20173). These studies are derived from databases of water-well drilling records. These studies include regional maps that portray features such as the total thickness of Quaternary sediments, thicknesses of coarse-grained sediment units within the Quaternary sediments, horizontal hydraulic conductivity and transmissivity (determined on the basis of specific capacity) of coarse-grained sediment within the Quaternary sediments, equivalent horizontal and vertical hydraulic conductivity (estimated on the basis of sediment grain sizes) of the Quaternary sediments, and equivalent transmissivity (estimated on the basis of sediment grain sizes) of the Quaternary sediments.
At the county scale, the NCGMP sponsored a USGS 3D geologic mapping study in southwestern Michigan that used geological and geophysical expertise of the USGS, the Michigan Geological Survey, and other State Geological Surveys (Stone, 2001; Berg and others, 2016; Stone and others, 2017). This mapping study combined surface and subsurface techniques and explored stratigraphic relations among regional moraine systems; proglacial lakes; glaciofluvial terraces; and postglacial shorelines, eolian dunes, and fluvial systems affected by changing lake levels in the Lake Michigan watershed. This work also demonstrated FEDMAP capability to map in the region at scales of 1:24,000 to 1:100,000.
Scientific and Societal Relevance
Geologic mapping results in numerous benefits of scientific and societal relevance. Although it is sometimes difficult to separate scientific themes from societal themes, some of the major scientific themes associated with geologic mapping in the Great Lakes region are (1) a regional understanding of Quaternary glaciations and interglaciations; (2) understanding landscape responses to changes in isostasy, climate, and lake levels; (3) ascertaining the elevation of the bedrock surface (and what this information tells us about glacial processes and controls on the accumulation and preservation of sediments); and (4) understanding regional groundwater systems.
Some of the major societal themes associated with geologic mapping in the Great Lakes region are (1) land management, (2) groundwater resources, (3) coastal erosion hazards, and (4) mineral resources. According to Berg and others (2000, 2016), geological mapping and investigations of the geological framework (stratigraphic architecture) across the Great Lakes region are associated with the following societal impacts and benefits:
-
· cost-effective economic development;
-
· enhanced groundwater availability assessments;
-
· identification of terrain susceptible to natural hazards;
-
· delineation of areas especially prone to coastal erosion, flooding, and subsidence;
-
· accurate inventories of sand and gravel (aggregate) resources for infrastructure use;
-
· management, preservation, and restoration of wetlands and ecosystems; and
-
· understanding impacts of changing patterns of land use.
Scientific Themes
As described by Dear (2006), science themes may be divided into the following two categories: (1) the natural philosophy component of science, the goal of which is a greater understanding of the natural world; and (2) the instrumental component of science, the goal of which is operational techniques to do or control things. For example, the NCGMP vision of creating an integrated, 3D, digital geologic map of the United States might fall primarily under the category of being an instrumental component of science. Indeed, during the past several decades, modern society has emphasized the instrumental component of science more than the natural philosophy component of science (Dear, 2006). With this understanding in mind, some of the “natural philosophy” scientific themes associated with geologic mapping in the Great Lakes region are a regional understanding of Quaternary glaciations; a greater understanding of landscape responses to changes in isostasy, climate, and lake levels; a greater knowledge of the elevation of the bedrock surface and what this information tells us about glacial processes and processes of sediment accumulation and preservation; and a greater understanding of the extent and behavior of regional groundwater systems.
Regional Understanding of Quaternary Glaciations
The development of a regional understanding of Quaternary glaciations and an internally consistent Quaternary geologic framework (regional “stratigraphic architecture”) for glacial deposits in the Great Lakes region remain some of the more contentious challenges to a unified understanding of the geology of the northern United States. Early emphasis on multiple glacial history and ice transport directions led to studies on (1) lithostratigraphic units; (2) geotechnical, petrologic, and geochemical characterization; and (3) engineering, agricultural, and mineral exploration, with an emphasis on till lithostratigraphic units (for example, Flint, 1943, 1945; Karrow and Calkin, 1985). Much information about the regional characteristics of Quaternary glacial deposits was portrayed in a series of 1:1,000,000 scale 4° x 6° quadrangle maps published by the USGS during the 1980s (for example, Goebel and others, 1983; Lineback and others, 1983; Farrand and others, 1984). Additional information about the thickness and character of Quaternary sediments in the glaciated United States was summarized in 1:1,000,000 scale maps by Soller (1993). New geologic data can provide a better understanding of stratigraphy and origins of meltwater sediments deposited in various environments (for example, subglacial, lacustrine, fluvial), bedrock influence on glacial sediment aquifers, earthquake hazards, and geologic concerns relevant to coastal erosion hazards and large construction projects in densely populated regions. The integration of post-1993 detailed geologic maps into new regional datasets, maps, and other publications can greatly enhance an understanding of the Quaternary glacial history (for example, Kehew and Curry, 2018). This enhanced understanding of the glacial history of the northern United States may also clarify how North American ice sheets responded to global and regional changes in climate conditions throughout the Quaternary. The types of physical and temporal constraints on the extent and volume of large ice sheets that can be determined through geologic mapping are important for generating ice sheet reconstructions (for example, Dalton and others, 2020; Gowan and others, 2021) that can be used to reconcile and improve ice sheet models (for example, Lecavalier and others, 2014).
Landscape Responses to Changes in Isostasy, Climate, and Lake Levels
The geomorphology of the Great Lakes region has been affected by Quaternary to recent isostatic adjustments, changes in climate, and changes in lake levels. The integrated effects of these processes have resulted in complex interactions between Holocene lacustrine, coastal, fluvial, and eolian systems (for example, Hansen and others, 2020). The integration of regional-scale and local-scale geological mapping with high-resolution topographical data (lidar) has enabled recognition of recent geomorphological changes and recognition of areas at greater risk from natural hazards such as coastal erosion, flooding, and landslides (for example, Palaseanu and others, 2019).
A priority of the USGS is to promote lidar acquisition to meet the standards of the USGS National Geospatial Program and the 3D Elevation Program initiative (Brock and others, 2021). The 3D Elevation Program initiative is being developed to respond to the growing needs for high-quality topographic data and for a wide range of other 3D representations of natural and constructed features of the Nation. The National Geospatial Program is cooperating with the USGS Coastal Marine and Geology Program to acquire lidar in coastal areas for inclusion in topobathymetric models (Thatcher and others, 2016). The topobathymetric digital elevation models are invaluable in studying and modeling shoreline change, coastal erosion and flooding, and wetland loss (for example, Sataer and others, 2017).
Elevation of the Bedrock Surface
The elevation of the bedrock surface and the thickness of the overlying Quaternary sediments are major themes of interest to the USGS and the GLGMC. This information helps to constrain 3D models of glacial processes and controls on the accumulation and preservation of sediments. This interest is also associated with aquifer resources and the drilling of water wells, as well as Quaternary glacial history and ice sheet behavior, and the need to know the depth to the surface of the bedrock, which might host energy and mineral resources. Where outcrops are not present, bedrock information in the Great Lakes region may be obtained by drilling and geophysical data (borehole geophysical log data, geophysical potential field data). Many oil and gas wells have been drilled in the Great Lakes region, and these well data are a great source of stratigraphic information. Well drilling data are particularly dense in northern Michigan where Devonian shale lies immediately below Quaternary sediments. In this region, natural gas in the Devonian shale is thought to be of biogenic origin associated with the influx of meteoric water along fractures generated by the advance and retreat of Quaternary glaciers (for example, Coburn and others, 2011; McIntosh and others, 2011). In addition to oil and gas well data, bedrock information may be obtained from geophysical data. The acquisition of new borehole geophysical data and geophysical potential field data may require collaboration with the USGS Earth MRI Program, State Geological Surveys, and industry. Such a collaborative effort could combine surface geological mapping with borehole geophysical data and with airborne and ground geophysical surveys, including electromagnetic, geomagnetic, and passive seismic surveys to derive data on the elevation of the bedrock surface.
Regional Groundwater Systems
Quaternary glacial sediments in upland areas within the Great Lakes region constitute major areas of groundwater recharge for the Great Lakes watershed. Large volumes of Quaternary glacial meltwater also penetrated to great depths into the underlying Paleozoic strata (for example, McIntosh and others, 2004; McIntosh and Walter, 2005). The modern water budget of each lake includes an unknown but possibly large discharge of groundwater that may account for substantial effects on lake-water quality (for example, Feinstein and others, 2010). Management of surface-water and groundwater resources in the Great Lakes region requires a knowledge of the groundwater system configuration, properties, and behavior. Such understanding could be gained by the characterization of aquifers on the basis of their lithologic and hydraulic properties, and their 3D stratigraphic architecture.
Societal Themes
The States that border the Great Lakes have shared characteristics of high populations, high agricultural productivity, a long and complex history of light and heavy industry, and commercial and physical connections to the Great Lakes shoreline (Berg and others, 2016). These States also have in common the presence of complex stratigraphy of glacial sediments containing groundwater resources used by ~50 percent of the residents. Furthermore, these glacial sediments are underlain by Paleozoic strata that are important reservoirs of oil and gas (Swezey and others, 2015; Berg and others, 2016). Despite their importance to environmental issues, economic issues, and water-resource assessments, large areas of surficial sediments and shallow underlying bedrock in the Great Lakes region remain poorly mapped. Full 3D maps of these sediments and strata could be used to support hydrologic modeling, geotechnical engineering, resource inventory, and applications that address critical land-use and water-use decisions. Some of the societal themes associated with geologic mapping in the Great Lakes region are land management, groundwater resources, coastal erosion hazards, and mineral resources.
Land Management
Much of the work described in this implementation plan is focused on Quaternary glacial sediments. A greater understanding of the history and characteristics of Quaternary glacial sediments of the Great Lakes region (Central Lowland and Superior Upland Physiographic Provinces) can help to ensure sustainable and continued economic growth. There are numerous applications of geologic mapping as related to land management decisions associated with groundwater, energy resources, and mineral resources (industrial minerals, aggregate). For example, Quaternary glacial sediments in this region contain significant groundwater resources; are a source of aggregate for construction; are parent materials of rich soils for agriculture; and provide areas of land for development, recreation, and wildlife habitats (Berg and others, 2000).
The systematic development of regional-scale geologic maps with a 3D “geologic framework” component (from geologic cross sections, isopach maps, and structure contour maps), combined with detailed geologic mapping of key regions of importance, could enhance and provide guidance for growth along transportation corridors, infrastructure improvements (pipelines, data corridors, roadways), and the protection of sensitive wildlife habitats. Such geologic maps could also provide guidance for the use and protection of groundwater resources as well as for mineral exploration and development.
Groundwater Resources
Human activities in areas of Quaternary glacial sediments have led to the following complex and critical resource-management issues and topics (Berg and others, 2000):
-
availability of groundwater and surface-water resources;
-
decreases in groundwater quality and quantity; and
-
water pollution plumes from agricultural runoff.
The top of bedrock is the base of surficial aquifer systems, and this contact is a significant boundary in all studies that model groundwater storage (supply, heat exchange), water flow (supply, contaminant transport), water quality (contaminants, salt-water intrusion), seismic-hazard assessments, and designs for critical facilities (for example, large infrastructure projects, nuclear power stations). Glacial geology is also relevant in assessments of large point-source and non-point-source contamination of groundwater.
Quaternary glacial sediments provide abundant groundwater resources for the Great Lakes region, yet they are especially sensitive to contamination from man-made activities and natural geologic influences. Municipal wells are affected significantly by volatile organic-chemical, pesticide, and nitrate contaminants. During recent years, unregulated fluorochemicals (Per- and Polyfluoroalkyl substances [PFAS]) have been discovered in drinking water supplies and in the waters of the Great Lakes (for example, Codling and others, 2018). PFAS compounds came into common use during the 1950s and 1960s and are now used in hundreds of industrial processes, notably in firefighting foams and numerous consumer products such as packaging material and clothing (Prevedouros and others, 2006; Paul and others, 2009). In many areas throughout the Great Lakes watershed, concentrations of pharmaceuticals, pesticides, and nonylphenol ethoxylates exceed toxicity benchmarks (Hull and others, 2015). In the waters of the Great Lakes, surface concentrations of PFAS are greater near urban sites (Codling and others, 2018). Some groundwater problems in Quaternary glacial sediments, however, are not man made but are associated with the details of the underlying bedrock geology. For example, within the Lower Peninsula of Michigan, groundwater in Quaternary glacial sediments contains elevated concentrations of arsenic derived from pyrite in the underlying Mississippian strata (Szramek and others, 2004). Elevated arsenic concentrations are also present in glacial sediment aquifers in Minnesota and adjacent States, and it is hypothesized that the presence of this arsenic is related to certain physical characteristics that are specific to the Wisconsin-age glacial sediments (Erickson and Barnes, 2005). In addition, radon hazards are present in parts of the Great Lakes region in association with uranium-bearing groundwater where the underlying bedrock is Devonian black shale (for example, Hand and Banikowski, 1988; Harrell and others, 1991).
Coastal Erosion Hazards
Coastal landforms in the Great Lakes region include cliffs consisting of bedrock, bluffs consisting of unconsolidated Quaternary glacial till or mud (silt, clay), and lower relief beaches consisting of sand (Hansen and others, 2020). Some of the coastal bluffs are susceptible to erosion, which in some places occurs catastrophically and in other places gradually. Geologic mapping of these Great Lakes coastal regions can lead to a greater understanding of the relations of coastal geology and bluff erosion. Such studies are particularly relevant at present because lake levels have been rising in the Great Lakes and coastal bluff erosion has been increasing. For example, from 2013 to 2019 the water level in Lake Michigan rose at a rate of about 16 centimeters per year and the threat of coastal bluff erosion likewise increased with many bluffs experiencing sudden and widespread erosion (Krueger and others, 2020). This coastal bluff erosion is a serious hazard with impacts on property values, coastal management, infrastructure, safety, and the local economy.
Many factors contribute to the timing of coastal bluff erosion. Greater bluff erosion generally occurs during times of sustained high lake levels coincident with intervals of high precipitation and high water tables (Berg and Collinson, 1976; Brown and others, 2005; Chase and Selegean, 2013; Hansen and others, 2020; Krueger and others, 2020). During times of low lake levels, eolian dunes may form on beaches at the base of bluffs, protecting the bluffs from wave-induced erosion. During times of high lake levels, however, these eolian dunes are destroyed and waves are able to erode the base of the bluffs, triggering slumps. Times of high lake levels also coincide with times of perched groundwater and greater seepage of groundwater. In addition, many coastal bluff landslides occur during the spring thaw portion of freeze-thaw cycles when groundwater seeps that were previously frozen during winter become active with spring thawing (Roland and others, 2021)
The locations of coastal bluff erosion in the Great Lakes region are frequently settings where the bluffs are composed of interbedded sand and clay (Chase and Selegean, 2013). Such settings provide ideal environments for perched groundwater and are common where geologic maps show Quaternary glacial till. Thus, detailed geologic mapping of coastal regions may identify settings where coastal bluff erosion is more likely to occur. Such geologic data, in combination with analysis of coastal geomorphological features, can provide the basis for predictions of bluff stability in the Great Lakes region (for example, Krueger and others, 2020).
Geological Mapping Strategy
Enhanced geological mapping in the Great Lakes region involves the creation of regional and local geological maps with close coordination between the USGS and State Geological Surveys. This mapping strategy can integrate detailed site-specific geologic mapping into a broader context to create a holistic regional understanding of the stratigraphy and to create products tied to common scientific and societal mapping themes.
At present (2021), the geology of approximately 2 percent of the land in the four-State area surrounding Lake Michigan (Michigan, Indiana, Illinois, and Wisconsin) is mapped at a scale greater than 1:30,000 (fig. 3). Thus, most of the area is not mapped with sufficient detail to provide geological data for making informed decisions by land and water resource managers. Furthermore, many traditional surficial geological maps do not provide sufficient information to resolve the current societal and management issues (Berg and others, 2000, 2016).
Previous USGS work, much of which has been funded by the NCGMP, produced digital maps of Quaternary sediments at 1:1,000,000 scale that cover the entire Great Lakes region. Compilation of 1:500,000-scale State geological maps provides similar coverage of bedrock geology for the Great Lakes region (Nicholson and others, 2004; Horton and others, 2017). These regional maps, appropriately integrated and reconciled with each other, form a natural starting point for creating seamless geologic map compilations at larger scales. Improvements to regional compilations are envisioned to come from the integration of detail from areas of higher-confidence, more data-rich geological mapping (fig. 6).
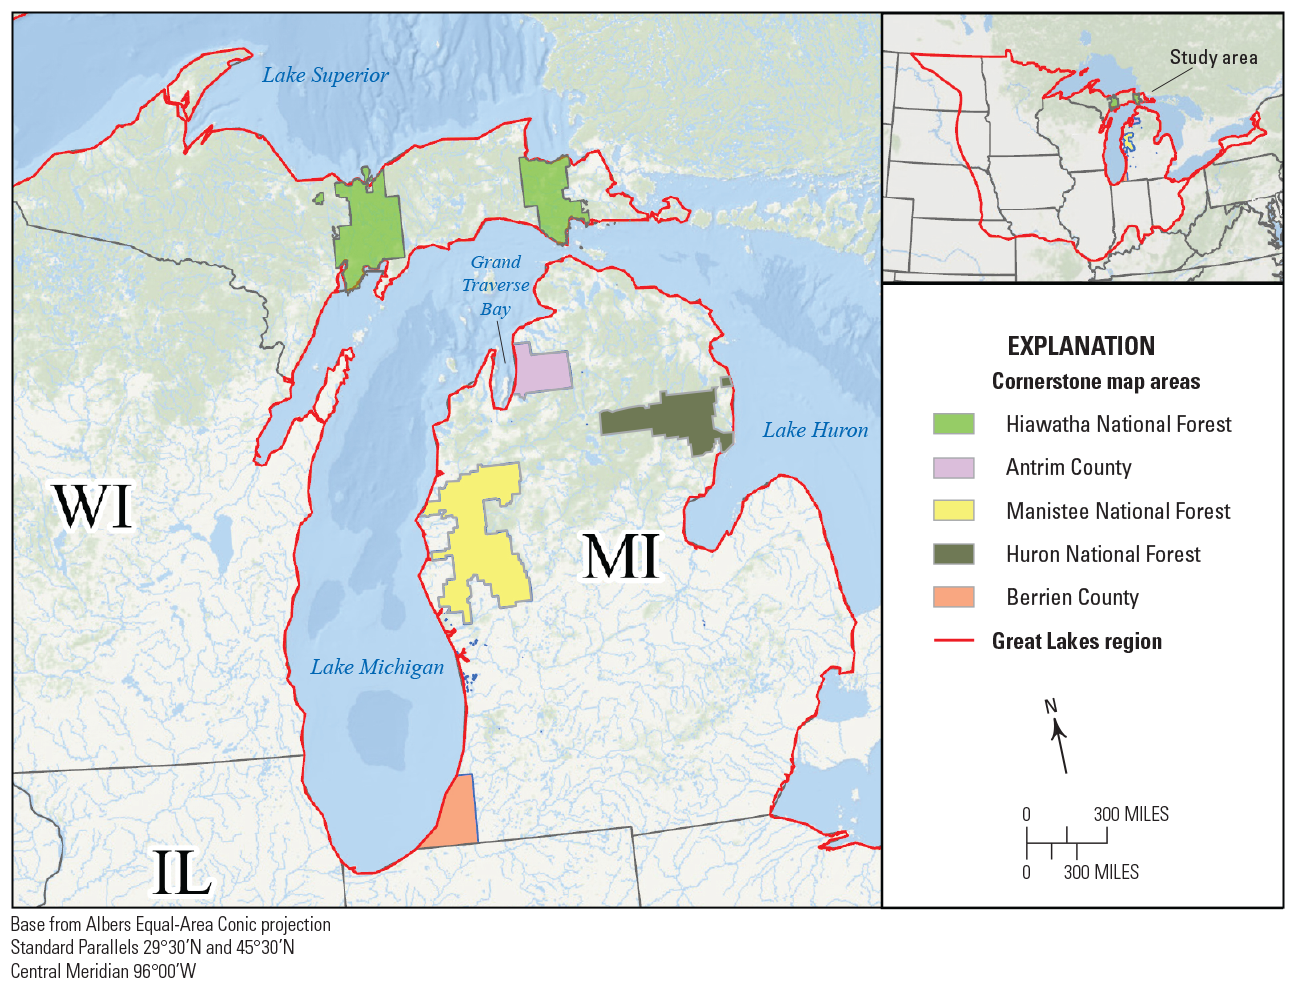
Map of Michigan and surrounding region, with examples of potential “cornerstone” map areas. Shapes and locations of map areas are approximate and generalized.
The higher-confidence, more data-rich geologic maps are referred to as “cornerstone” maps, which are defined as geological maps of areas of variable size, shape, and scale that have many of the following characteristics:
-
high-quality, large-scale 2D geologic maps of surficial and bedrock features that have great relevance to understanding the stratigraphy, structure, or other geologic relations elsewhere in the region;
-
subsurface (structure and isopach) maps derived from borehole, cross section, and geophysical data;
-
datasets (for example, geophysical) that define depth to bedrock and (or) define the internal heterogeneity of Quaternary sediments and bedrock strata; and
-
other detailed geological data that are relevant to the map area.
Some “cornerstone” maps have already been completed (for example, Berrien County, Michigan; Stone and others, 2017), whereas others are in process or planned (for example, Manistee National Forest and Huron National Forest; fig. 6). In all cases, the relative merits of candidate “cornerstone” map areas need to be defined and prioritized. Previously mapped areas that have 2D and 3D geologic data could be considered as “cornerstone” maps (fig. 6). FEDMAP and (or) STATEMAP projects would define additional “cornerstone” map areas that have a high priority for more focused (1:24,000 to 1:100,000) geologic mapping. These new map areas would be selected on the basis of the expected occurrence of diagnostic stratigraphic relations and (or) characteristic glacial features that when mapped and understood would have relevance elsewhere in the region. “Cornerstone” map areas could also be selected on the basis of (1) national requirements for geologic map information in areas of multiple-issue need or areas of compelling single-issue need; (2) national requirements for geologic map information in areas where mapping is required to solve critical earth science problems; and (3) the needs of land management agencies of the Department of the Interior.
Where appropriate, “cornerstone” maps should be tied to high-quality borehole data and other geophysical data. High-resolution downhole geophysical tools (for example, gamma-ray logs, resistivity logs) can be used to measure material properties. In addition, the following airborne and (or) ground-based geophysical survey data may be needed in the construction of a regional geological framework model of the Great Lakes region:
-
Airborne surveys of electromagnetic properties may be used to show the subsurface distribution of shallow fine-grained and coarse-grained Quaternary sediments, as well as the elevation of the bedrock surface.
-
Airborne gravity surveys may be used to estimate the Quaternary sediment/pre-Quaternary bedrock contact, as well as the tops of other subsurface stratigraphic units.
-
Seismic reflection profiles and passive seismic surveys may indicate bounding surfaces and internal characteristics of Quaternary subsurface units and top of bedrock.
-
Electromagnetic and gravity soundings may provide data to model subsurface Quaternary sediments (for example, resistive sand and gravel versus conductive clay).
-
Ground-penetrating radar profiles may provide detailed stratigraphic information of glacial deposits of special interest in “cornerstone” map areas.
The USGS staff within FEDMAP, working closely with State Geological Surveys, can integrate geologic mapping and focus on target areas of critical interest. The identification of “cornerstone” map areas can allow geologic, geomorphic, and stratigraphic understanding to be propagated outwards from these areas of detailed mapping.
Enhancement of regional geologic maps is envisioned to take place during three 4-year phases. The general succession of planned mapping activities is organized into the following three phases (fig. 7):
-
Phase 1 (2019–22): Focus effort on the core region of the Great Lakes watershed surrounding Lake Michigan, including Michigan, Indiana, Illinois, and Wisconsin.
-
Phase 2 (2023–26): Expand the mapping area to include the following additional States within the Great Lakes watershed: New York, Pennsylvania, Ohio, and Minnesota. Engage in more detailed mapping and compilation activities within the Phase 1 area.
-
Phase 3 (2027–30): Expand the mapping area to include the following additional States along the margins of the Great Lakes watershed: North Dakota, South Dakota, Nebraska, Kansas, Iowa, and Missouri. Continue more detailed mapping and compilation activities within the Phase 1 and Phase 2 areas.
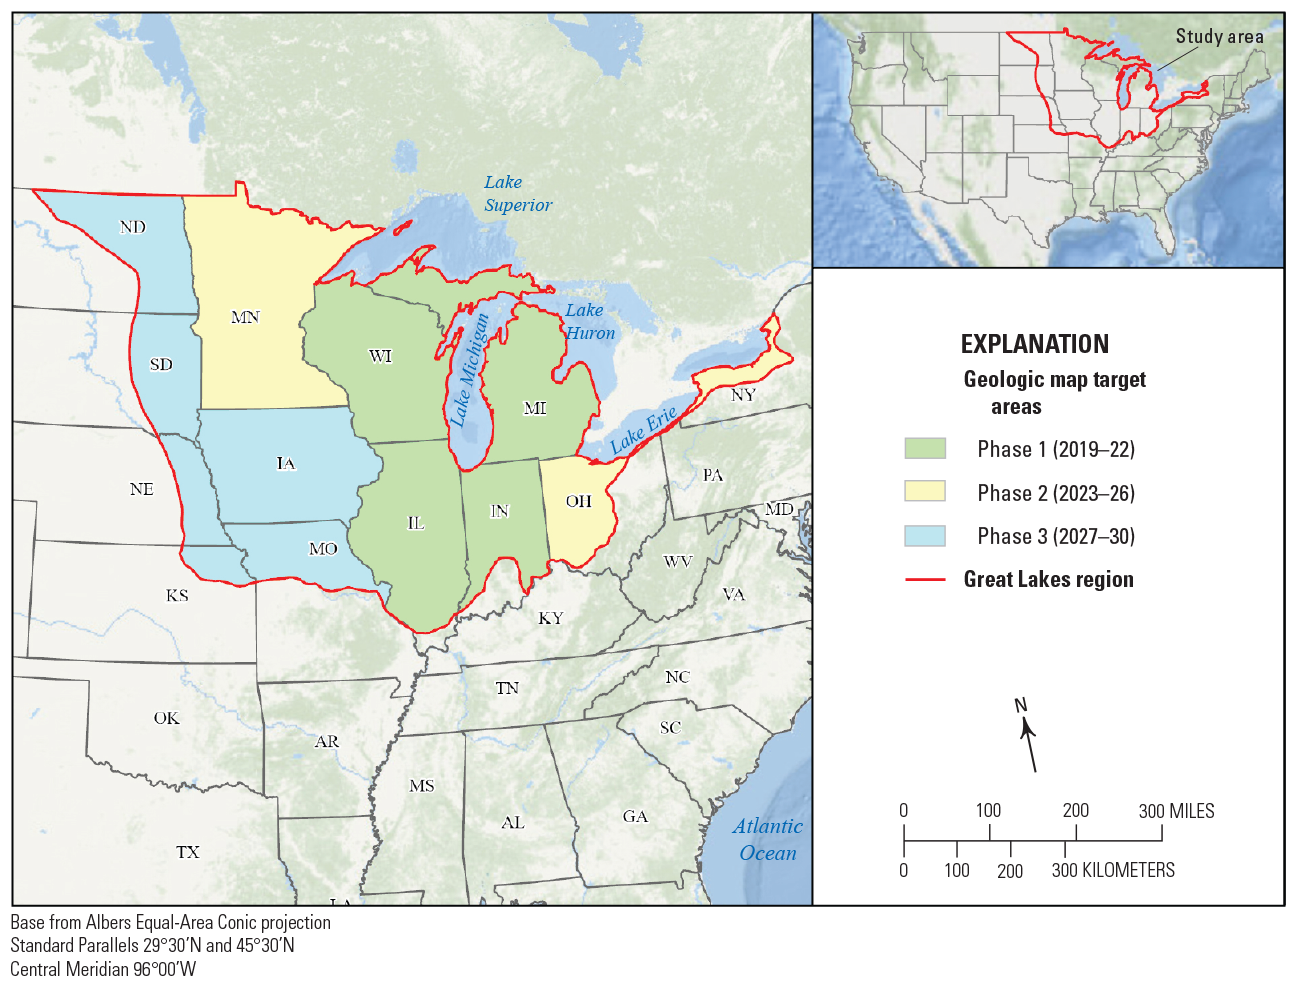
Map of the Great Lakes region (Central Lowland and Superior Upland Physiographic Provinces) with the regional geologic mapping targets symbolized by 4-year phase.
An overarching strategy is to develop 2D maps, 3D volumes, and digital datasets across the Great Lakes region and in targeted “cornerstone” areas to define the geologic framework of Quaternary sediments and the underlying bedrock units. Regional datasets that would be critical for a 3D mapping effort include high-resolution digital topography and bathymetry, 2D geologic maps, subsurface data from boreholes and cross sections, and maps that portray thickness, depth, and character of strata and sediments.
Regional geologic mapping and compilation should employ data from multiple scales of observation, from regional to local. Regional-scale map compilation can help meet the NCGMP and State Geological Survey goals of seamless geologic map compilation (Bristol and others, 2013; American Association of State Geologists, 2014). Intermediate-scale 2D and 3D products can help to address issues that are critical to the local 3D geologic framework, including the strata geometry, geologic relations, and lithologic heterogeneity within Quaternary sediments and their potential hydrogeologic connection to underlying bedrock units. Local-scale efforts focused on geologic mapping for topical studies such as the needs of land management agencies of the Department of the Interior, identifying geologic controls on coastal zone cliff retreat, and other site-specific issues can help people make informed decisions about land use.
Geologic Mapping Scientific Objectives
For the Great Lakes region, the geologic mapping scientific objectives can be organized according to three phases of increasing geographic scope. The first phase (2019–22) focuses on the area around Lake Michigan in the States of Michigan, Indiana, Illinois, and Wisconsin. The second phase (2023–26) increases the geographic area of study to include the Phase 1 study area as well as New York, Pennsylvania, Ohio, and Minnesota. The third phase (2027–30) increases the geographic area of study to include the Phase 1 and Phase 2 study areas as well as Missouri, Iowa, Kansas, Nebraska, South Dakota, and North Dakota.
Phase 1 scientific objectives (tied to themes above and directly to Phase 1 activities, where Phase 1 is centered around Lake Michigan) are listed as follows:
-
Integrate and synthesize the geologic record of Quaternary ice sheet advance and retreat in the core region of Lake Michigan, which coincides approximately with the location of the “Lake Michigan lobe” of the Wisconsin-age ice sheet. Evaluate, compare, and contrast the range of available interpretive models and their validity, appropriateness, and utility in characterizing the 3D surficial geology. Map, characterize, and develop predictive genetic models for subglacial valley morphologies and effects on bedrock topography. Map, characterize, and improve understanding of subglacial versus ice-marginal and proglacial morphology and stratigraphy. Map, characterize, and synthesize the geologic record of postglacial environments and changes in the area, including a wide variety of spatially and temporally varying coastal, lacustrine, fluvial, eolian, and wetland depositional systems.
-
Develop ways of prioritizing detailed mapping areas by FEDMAP and State Geological Surveys, and develop an integration strategy between regional and local maps.
-
For the core Phase 1 area, resolve (or begin to resolve) regional stratigraphic issues, and link this work to the construction of regional cross sections through “cornerstone” map areas and along promising transects that join the core areas.
-
Characterize and map the range of contrasting types of coastal changes around Lake Michigan, with initial emphasis on its eastern shore.
-
For “cornerstone” map areas and areas radiating outward from such, develop integrated digital bedrock topography and subcrop geologic maps that are integrated with Quaternary geology and with bedrock geology.
-
Through the GLGMC, NCGMP geologists of the Great Lakes project work with State Geological Surveys to map the elevation of top of bedrock and to construct isopach maps of Quaternary sediments. This work may involve the construction of a well core and well-log database for the Phase 1 area, and collaboration with geophysicists from the USGS and State Geological Surveys on airborne electromagnetic and geomagnetic surveys of select areas.
Phase 2 scientific objectives (tied to themes above and directly to Phase 2 activities) are listed as follows:
-
Extend geologic mapping to improve understanding of Quaternary ice sheet dynamics and related erosional and depositional records in areas surrounding the Phase 1 area; improve understanding of regional variations in glacial stratigraphy across a larger area of the Great Lakes watershed.
-
Refine maps of the elevation of top of bedrock and construct isopach maps of Quaternary sediments across a larger part of the Great Lakes watershed.
Phase 3 scientific objectives (tied to themes above and directly to Phase 3 activities) are listed as follows:
-
Extend geologic mapping of Quaternary sediments to the entire Great Lakes region.
-
Describe postglacial modification of the landscape and the Quaternary sediments. Such modifications may include isostatic rebound, lake level changes, changes in fluvial drainage basins, and eolian dune stabilization/mobilization.
Geologic Mapping Work Plan and Strategy
The geologic mapping work plan and strategy is similar in each of the three phases. The work progresses outwards from the core Great Lakes region to surrounding areas.
Phase 1 geologic mapping objectives (tied to themes and scientific objectives above and directly to Phase 1 activities) have been developed using the following strategy:
At the start of Phase 1, the FEDMAP project assessed the following items for the core region of the Great Lakes watershed surrounding Lake Michigan (Michigan, Indiana, Illinois, and Wisconsin):
-
What previously published geological maps are available, including digitally available regional and more local Quaternary maps, Quaternary properties, and depth-to-bedrock maps? What data were used to create these maps? How have the maps been updated through time?
-
What data are available from the State Geological Surveys that could be used to improve previously published maps?
-
Where are the data gaps that FEDMAP could fill through geologic mapping?
-
What are the geologic mapping needs of land management agencies of the Department of the Interior within the Phase 1 study area?
The FEDMAP, project in coordination with State Geological Surveys, is addressing the following questions for the core region of the Great Lakes watershed surrounding Lake Michigan (Michigan, Indiana, Illinois, and Wisconsin):
-
What areas are of high priority and should be mapped in detail? What areas are of medium priority? What areas are of low priority (where we can accept existing level of mapping detail)?
-
What are additional “cornerstone” map targets?
“Cornerstone” areas are to be mapped by FEDMAP, STATEMAP, and GLGMC projects at 1:24,000 to 1:100,000 scales, with STATEMAP and GLGMC projects being planned through the STATEMAP and GLGMC processes. Geologic mapping should expand from “cornerstone” map areas into adjoining areas to include the following key characteristics, which are included in the “cornerstone” geologic map of Berrien County, Michigan (Stone and others, 2017):
-
locations of contacts (with location uncertainty specified) between stratigraphic units that were deposited during specified glacial advances;
-
similar characterization of subsurface distribution, internal boundaries, and uncertainties therein of stratigraphic units;
-
definition of the largely buried bedrock surface topography at the base of Quaternary sediments; and
-
mapping of bedrock subcrop (that is, a bedrock geologic map as if the Quaternary sediments were removed) classified by a practical combination of formations identified by lithology.
Another “cornerstone” geologic map area could be centered on Antrim County and other counties around Grand Traverse Bay, Michigan (fig. 6). This area contains sediments from the latest Pleistocene glacial readvance (Two Rivers Phase readvance, also referred to as the “Greatlakean readvance”; ~14–13 ka; Kincare and Larson, 2009). A synthesis of the Quaternary geology and subcropping pre-Quaternary bedrock geology of this area could be assembled using the borehole data from oil and gas exploration, and previous stratigraphic studies of Paleozoic bedrock. This approach could be continued into the eastern Upper Peninsula of Michigan (for example, Hiawatha National Forest; fig. 6) where areas of relatively thin Quaternary sediments and greater frequency of pre-Quaternary bedrock outcrops provide insights to the northern onlap of Paleozoic strata of the Michigan Basin, as well as insights into the latest glacial transition from glacial Lake Algonquin to the Marquette glacial advance during the Younger Dryas event (~12.8 to 11.5 ka; Lowell and others, 1999; Larson and Schaetzl, 2001).
Regional responsibilities include coastal geology mapping using high-resolution lidar data and geographic information system (GIS) mapping technology. Automated digital methods can be used for extracting high-resolution lidar-derived digital elevation models, combined with coastal shoreline vector data and measurements of distances between shoreline and cliff tops (Palaseanu-Lovejoy and others, 2016). The automated aerial lidar-based results can be validated by field GPS survey and surficial mapping data. This work may include topographic models created from suites of aerial photographs (using structure-from-motion techniques) that can be compared to the lidar data to evaluate volumetric changes along the coasts. These data may be useful in understanding ongoing glacial isostatic adjustments and sediment transport patterns throughout the Phase 1 area.
The FEDMAP project, in coordination with State Geological Surveys and the GLGMC, plans to develop prototypes of 1:500,000-scale geological maps on the basis of revision of USGS 1:1,000,000-scale maps. Revision of the 1:1,000,000-scale maps should be consistent with larger-scale mapping and existing “cornerstone maps.” Revisions should be consistent with lidar data and other detailed topographic data. The FEDMAP project, in coordination with State Geological Surveys and the GLGMC, also plans to construct regional cross sections tied to high-resolution “cornerstone” maps. This work can begin to resolve regional stratigraphic correlation issues within the Phase 1 area.
Given sufficient resources, FEDMAP may cooperate with the USGS Energy and Minerals mission area to refine and optimize the existing 1:500,000-scale bedrock State Geologic Map Compilation (Horton and others, 2017) to resolve stratigraphic issues in pre-Quaternary bedrock units. Given sufficient personnel and resources, FEDMAP may also develop a prototype of a 1:500,000-scale 3D geologic map or model that would digitally combine (1) bedrock geology from State Geologic Map Compilation (Horton and others, 2017) and (2) digital polygons from the Quaternary Geologic Atlas and the regional Quaternary sediment thickness and bedrock topography of Soller and Garrity (2018). This new compilation could be the starting point of a regional compilation that would be a living, updatable database.
Phase 2 geologic mapping objectives (tied to themes and scientific objectives above and directly to Phase 2 activities) plan to be developed using the following strategy:
At the start of Phase 2, the FEDMAP project plans to assess the following items for additional States (New York, Pennsylvania, Ohio, and Minnesota) within the Great Lakes watershed:
-
What previously published geological maps are available, including digitally available regional and more local Quaternary maps, Quaternary properties, and depth-to-bedrock maps? What data were used to create these maps? How have the maps been updated through time?
-
What data are available from the State Geological Surveys that could be used to improve previously published maps?
-
Where are the data gaps that FEDMAP could fill through geologic mapping?
-
What are the geologic mapping needs of land management agencies of the Department of the Interior within the Phase 2 study area?
The FEDMAP project, in coordination with State Geological Surveys, plans to address the following questions for the Phase 2 area of the Great Lakes watershed (New York, Pennsylvania, Ohio, and Minnesota):
-
What areas are of high priority and should be mapped in detail? What areas are of medium priority? What areas are of low priority (where we can accept existing level of mapping detail)?
-
What are additional “cornerstone” map targets?
“Cornerstone” areas are to be mapped by FEDMAP, STATEMAP, and GLGMC projects. FEDMAP geologists plan to map “cornerstone” areas at 1:24,000 to 1:100,000 scales. Likewise, State Geological Surveys plan to map “cornerstone” areas at 1:24,000 to 1:100,000-scale, as planned through STATEMAP and GLGMC processes.
The FEDMAP project, in coordination with State Geological Surveys and the GLGMC, plans to construct regional cross sections tied to high-resolution “cornerstone” maps. This work can begin to resolve regional stratigraphic correlation issues within additional States within the Great Lakes watershed (New York, Pennsylvania, Ohio, and Minnesota), tying data to the Phase 1 area.
The FEDMAP project, in coordination with State Geological Surveys and the GLGMC, plans to continue development of 1:500,000-scale geological maps on the basis of revision of USGS 1:1,000,000-scale maps. Revision of the 1:1,000,000-scale maps should be consistent with larger-scale mapping and existing “cornerstone” maps. Revisions should be consistent with lidar data and other detailed topographic data.
Given sufficient resources, FEDMAP geologists may continue cooperation with the USGS Energy and Minerals Mission area to refine and optimize the existing 1:500,000-scale bedrock State Geologic Map Compilation (Horton and others, 2017) to resolve stratigraphic discontinuities in pre-Quaternary bedrock units. Given sufficient personnel and resources, FEDMAP geologists may continue development of a 1:500,000-scale 3D geologic map or model that would digitally combine (1) bedrock geology from State Geologic Map Compilation (Horton and others, 2017); and (2) digital polygons from the Quaternary Geologic Atlas and the regional Quaternary sediment thickness and bedrock topography of Soller and Garrity (2018).
Phase 3 geologic mapping objectives (tied to themes and scientific objectives above and directly to Phase 3 activities) plan to be developed using the following strategy:
At the start of Phase 3, the FEDMAP project plans to assess the following items for additional States (Missouri, Iowa, Kansas, Nebraska, South Dakota, and North Dakota) within the Great Lakes watershed:
-
What previously published geological maps are available, including digitally-available regional and more local Quaternary maps, Quaternary properties, and depth-to-bedrock maps? What data were used to create these maps? How have the maps been updated through time?
-
What data are available from the State Geological Surveys that could be used to improve previously published maps?
-
Where are the data gaps that FEDMAP could fill through geologic mapping?
-
What are the geologic mapping needs of land management agencies of the Department of the Interior within the Phase 3 study area?
The FEDMAP project, in coordination with State Geological Surveys, plans to address the following questions for the Phase 3 area of the Great Lakes watershed (Missouri, Iowa, Kansas, Nebraska, South Dakota, and North Dakota):
-
What areas are of high priority and should be mapped in detail? What areas are of medium priority? What areas are of low priority (where we can accept existing level of mapping detail)?
-
What are additional “cornerstone” map targets?
“Cornerstone” areas are to be mapped by FEDMAP, STATEMAP, and GLGMC projects. FEDMAP geologists plan to map “cornerstone” areas at 1:24,000 to 1:100,000 scales. Likewise, State Geological Surveys plan to map “cornerstone” areas at 1:24,000 to 1:100,000-scale, as planned through STATEMAP and GLGMC processes.
The FEDMAP project, in coordination with State Geological Surveys and the GLGMC, plans to construct regional cross sections tied to high-resolution “cornerstone” maps. This work can begin to resolve regional stratigraphic correlation issues within additional States within the Great Lakes watershed (Missouri, Iowa, Kansas, Nebraska, South Dakota, and North Dakota), tying data to the Phase 1 and Phase 2 areas.
The FEDMAP project, in coordination with State Geological Surveys and the GLGMC, plans to continue development of 1:500,000-scale geological maps on the basis of revision of USGS 1:1,000,000-scale maps. Revision of the 1:1,000,000-scale maps should be consistent with larger-scale mapping and existing “cornerstone” maps. Revisions should be consistent with lidar data and other detailed topographic data.
Given sufficient resources, USGS FEDMAP geologists may continue cooperation with the USGS Energy and Mineral Resources Mission area to refine and optimize the existing 1:500,000-scale bedrock State Geologic Map Compilation (Horton and others, 2017) to resolve stratigraphic discontinuities in pre-Quaternary bedrock units. Given sufficient personnel and resources, USGS FEDMAP geologists may continue development of a 1:500,000-scale 3D geologic map or model that would digitally combine (1) bedrock geology from State Geologic Map Compilation (Horton and others, 2017) and (2) digital polygons from the Quaternary Geologic Atlas and the regional Quaternary sediment thickness and bedrock topography of Soller and Garrity (2018).
Capability Gaps
For FEDMAP, the currently envisioned scope of work lacks at least four full-time-equivalent employees, including one to two stratigraphers with expertise in Quaternary settings, one to two stratigraphers with expertise in bedrock settings, one subsurface mapping specialist, and one geologist with extensive knowledge of 3D mapping software, as well as some dedicated GIS staff capable of integrating GIS data into subsurface 3D geological maps/models. Furthermore, the currently envisioned FEDMAP scope of work lacks at least one additional geophysicist with experience in ground-penetrating radar, borehole geophysical data, and (or) seismic reflection and passive seismic data.
The USGS laboratory for optically stimulated luminescence dating is currently at capacity and unable to analyze additional samples from “cornerstone” map projects at the current staffing level. Some State Geological Surveys have optically stimulated luminescence labs that may be used to increase capacity.
Partners
-
Sleeping Bear Dunes National Lakeshore (U.S. National Park Service)
-
Manistee National Forest (U.S. Forest Service)
-
Huron National Forest (U.S. Forest Service)
-
Illinois State Geological Survey
-
Indiana Geological and Water Survey
-
Michigan Geological Survey
-
Minnesota Geological Survey
-
New York State Geological Survey
-
Ohio Division of Geological Survey
-
Pennsylvania Bureau of Geological Survey
-
Wisconsin Geological and Natural History Survey
-
Western Michigan University
-
University of Toledo (Ohio)
Anticipated Impacts
Understanding the Quaternary and pre-Quaternary geology (“geologic framework”), as well as the coastal dynamics, can help to ensure sustainable growth in the Great Lakes region. More precisely, the systematic development of 2D geologic maps and 3D geologic framework models in the Great Lakes region can (1) improve regional understanding of Quaternary stratigraphy and interpretations of glaciations and landscape evolution; (2) improve understanding of regional groundwater systems; (3) improve understanding of regional bedrock topography; (4) provide greater insight into coastal change processes; (5) improve understanding of regional Paleozoic stratigraphy; and (6) improve prediction of the distribution of certain lithologies that are essential to energy and mineral resources. This improved understanding and greater insight, in turn, may help to enhance improvements in land management (for example, infrastructure improvements, growth along transportation corridors), groundwater resource management, resilience to climate change impacts, and exploration for energy and mineral resources.
As stated previously in the “Geological Mapping Strategy” section, areas for geologic mapping could be selected on the basis of (1) national requirements for geologic map information in areas of multiple-issue need or areas of compelling single-issue need; (2) national requirements for geologic map information in areas where mapping is required to solve critical earth science problems; and (3) the needs of land management agencies of the Department of the Interior. Geological mapping and geological framework investigations across the Great Lakes region are associated with the following impacts and benefits (as delineated by Berg and others, 2000, 2016): (1) cost-effective economic development; (2) enhanced groundwater availability assessments; (3) identification of terrain susceptible to natural hazards; (4) delineation of areas especially prone to coastal erosion, flooding, and subsidence; (5) accurate inventories of energy and mineral resources (for example, critical minerals); (6) accurate inventories of sand and gravel resources for infrastructure development; (7) management, preservation, and restoration of wetlands and ecosystems; and (8) understanding impacts of changing patterns of land use.
Acknowledgments
The authors of this implementation plan thank Monica Palaseanu-Lovejoy (U.S. Geological Survey) and Lorrie Coiner Skiffington (U.S. Geological Survey) for their support in creating the figures. This manuscript benefitted from reviews by Mark Carter (U.S. Geological Survey) and Arthur Merschat (U.S. Geological Survey).
References Cited
American Association of State Geologists, 2014, Resolution on AASG commitment to the role of geologic mapping in society: Association of American State Geologists Annual Meeting, 106th, Lexington, Kentucky; June 11, 2014, 1 p. [Also available at https://ngmdb.usgs.gov/info/docs/2014_AASG-ResolutionOnGeologicMapping.pdf.]
Bayless, E.R., Arihood, L.D., Reeves, H.W., Sperl, B.J.S., Qi, S.L., Stipe, V.E., and Bunch, A.R., 2017, Maps and grids of hydrogeologic information created from standardized water-well drillers’ records of the glaciated United States: U.S. Geological Survey Scientific Investigations Report 2015–5105, 34 p. [Also available at https://doi.org/10.3133/sir20155105.]
Berg, R.C., Brown, S.E., Thomason, J.F., Hasenmueller, N.R., Letsinger, S.L., Kincare, K.A., Esch, J.M., Kehew, A.E., Thorleifson, L.H., Kozlowski, A.L., Bird, B.C., Pavey, R.R., Bajc, A.F., Burt, A.K., Fleeger, G.M., and Carson, E.C., 2016, A multiagency and multijurisdictional approach to mapping the glacial deposits of the Great Lakes region in three dimensions, in Wessel, G.R., and Greenberg, J.K., eds., Geoscience for the public good and global development—Toward a sustainable future: Geological Society of America Special Paper 520, p. 415–447., accessed October 2021 at https://doi.org/10.1130/2016.2520(37).
Bristol, R.S., Euliss, N.H., Jr., Booth, N.L., Burkardt, N., Diffendorfer, J.E., Gesch, D.B., McCallum, B.E., Miller, D.M., Morman, S.A., Poore, B.S., Signell, R.P., and Viger, R.J., 2013, U.S. Geological Survey Core Science Systems Strategy—Characterizing, synthesizing, and understanding the critical zone through a modular science framework: U.S. Geological Survey Circular 1383–B, 33 p. [Also available at https://doi.org/10.3133/cir1383B.]
Brock, J., Berry, K., Faulds, J., Berg, R., House, K., Marketti, M., McPhee, D., Schmidt, K., Schmitt, J., Soller, D., Spears, D., Thompson, R., Thorleifson, H., and Walsh, G., 2021, Renewing the National Cooperative Geologic Mapping Program as the Nation’s authoritative source for modern geologic knowledge: U.S. Geological Survey Open-File Report 2021–1013, 10 p., accessed October 2021 at https://doi.org/10.3133/ofr20211013.
Chase, R.B., and Selegean, J.P., 2013, Geology, erosion history, and mitigation strategies applied to Great Lakes coastal bluffs: An examination of the Allegan County, Michigan, dewatering demonstration site, in Gillespie, R., ed., Insights into the Michigan Basin: Salt deposits, impact structure, youngest basin bedrock, glacial geomorphology, dune complexes, and coastal bluff stability: Geological Society of America Field Guide 31, p. 103–118.
Coburn, T.C., Freeman, P.A., and Attanasi, E.D., 2011, Empirical methods for detecting regional trends and other spatial expressions in Antrim Shale gas productivity, with implications for improving resource projections using local nonparametric estimation techniques: Natural Resources Research, v. 21, no. 1, p. 21p.
Codling, G., Sturchio, N.C., Rockne, K.J., Li, A., Peng, H., Tse, T.J., Jones, P.D., and Giesy, J.P., 2018, Spatial and temporal trends in poly- and per-fluorinated compounds in the Laurentian Great Lakes Erie, Ontario, and St. Clair: Environmental Pollution, v. 237, p. 396–405. [Also available at https://doi.org/10.1016/j.envpol.2018.02.013.]
Curry, B.B., Lowell, T.V., Wang, H., and Anderson, A.C., 2018, Revised time-distance diagram for the Lake Michigan Lobe, Michigan Subepisode, Wisconsin Episode, Illinois, USA, in Kehew, A.E., and Curry, B.B., eds., Quaternary glaciation in the Great Lakes Region—Process, landforms, sediments, and chronology: Geological Society of America Special Paper 530, p. 69–101.
Dalton, A.S., Margold, M., Stokes, C.R., Tarasov, L., Dyke, A.S., Adams, R.S., Allard, S., Arends, H.E., Atkinson, N., Attig, J.W., Barnett, P.J., Barnett, R.L., Batterson, M., Bernatchez, P., Borns, Jr., H.W., Breckenridge, A., Briner, J.P., Brouard, E., Campbell, J.E., Carlson, A.E., Clague, J.J., Curry, B.B., Daigneault, R.-A., Dubé-Loubert, J., Easterbrook, D.J., Franzi, D.A., Friedrich, H.G., Funder, S., Gauthier, M.S., Gowan, A.S., Harris, K.L., Hétu, B., Hooyer, T.S., Jennings, C.E., Johnson, M.D., Kehew, A.E., Kelly, S.E., Kerr, D., King, E.L., Kjeldsen, K.K., Knaeble, A.R., Lajeunesse, P., Lakeman, T.R., Lamothe, M., Larson, P., Lavoie, M., Loope, H.M., Lowell, T.V., Lusardi, B.A., Manz, L., McMartin, I., Nixon, F.C., Occhietti, S., Parkhill, M.A., Piper, D.J.W., Pronk, A.G., Richard, P.J.H., Ridge, J.C., Ross, M., Roy, M., Seaman, A., Shaw, J., Stea, R.R., Teller, J.T., Thompson, W.B., Thorleifson, L.H., Utting, D.J., Veillette, J.J., Ward, B.C., Weddle, T.K., and Wright, H.E., Jr., 2020, An updated radiocarbon-based ice margin chronology for the last deglaciation of the North American Ice Sheet Complex: Quaternary Science Reviews, v. 234, article 106223, 27 p.
Dear, P., 2006, The intelligibility of nature: Chicago, The University of Chicago Press, 242 p. [Also available at https://doi.org/10.7208/chicago/9780226139500.001.0001.]
Drenth, B.J., and Grauch, V.J.S., 2019, Finding the gaps in America’s magnetic maps: Eos (Washington, D.C.), v. 100, no. 8, p. 24–29, accessed October 2021, at https://doi.org/10.1029/2019EO120449.
East, J.A., Swezey, C.S., Repetski, J.E., and Hayba, D.O., 2012, Thermal maturity map of Devonian shale in the Illinois, Michigan, and Appalachian Basins of North America: U.S. Geological Survey Scientific Investigations Map 3214, 1 sheet, accessed October 2021 at http://pubs.er.usgs.gov/publication/sim3214.
Erickson, M.L., and Barnes, R.J., 2005, Glacial sediment causing regional-scale elevated arsenic in drinking water: Groundwater, v. 43, no. 6, p. 796–805. [Also available at https://doi.org/10.1111/j.1745-6584.2005.00053.x.]
Farrand, W.R., Mickelson, D.M., Cowan, W.R., and Goebel, J.E., 1984, Quaternary geologic map of the Lake Superior 4°×6° quadrangle, United States and Canada, in Richmond, G.M., and Fullerton, D.S., eds., Quaternary geologic atlas of the United States: U.S. Geological Survey Miscellaneous Investigations Series Map I–1420 (NL–16), 1:1,000,000 scale; 1 sheet.
Feinstein, D.T., Hunt, R.J., and Reeves, H.W., 2010, Regional groundwater-flow model of the Lake Michigan Basin in support of Great Lakes Basin water availability and use studies: U.S. Geological Survey Scientific Investigations Report 2010–5109, 379 p., accessed October 2021 at https://doi.org/10.3133/sir20105109.
Fenneman, N.M., 1928, Physiographic divisions of the United States, 3rd Revision with map: Annals of the Association of American Geographers, v. 18, no. 4, p. 261–353. [Also available at https://doi.org/10.1080/00045602809357034.]
Fenneman, N.M., 1946, Physiographic divisions of the United States, Map with legend: U.S. Geologic Survey, 1 plate, accessed October 2021 at https://doi.org/10.3133/70207506.
Fortier, S.M., Nassar, N.T., Lederer, G.W., Brainard, J., Gambogi, J., and McCullough, E.A., 2018, Draft critical mineral list—Summary of methodology and background—U.S. Geological Survey technical input document in response to Secretarial Order No. 3359: U.S. Geological Survey Open-File Report 2018–1021, 15 p.
Goebel, J.E., Mickelson, D.M., Farrand, W.R., Clayton, L., Knox, J.C., Cahow, A., Hobbs, H.C., and Walton, M.S., Jr., 1983, Quaternary geologic map of the Minneapolis 4°×6° quadrangle, United States, in Richmond, G.M., and Fullerton, D.S., eds., Quaternary geologic atlas of the United States: U.S. Geological Survey Miscellaneous Investigations Series Map I–1420 (NL–15), 1:1,000,000 scale; 1 sheet.
Hammarstrom, J.M., Dicken, C.L., Day, W.C., Hofstra, A.H., Drenth, B.J., Shah, A.K., McCafferty, A.E., Woodruff, L.G., Foley, N.K., Ponce, D.A., Frost, T.P., and Stillings, L.L., 2020, Focus areas for data acquisition for potential domestic resources of 11 critical minerals in the conterminous United States, Hawaii, and Puerto Rico—Aluminum, cobalt, graphite, lithium, niobium, platinum-group elements, rare earth elements, tantalum, tin, titanium, and tungsten, chap. B of U.S. Geological Survey, Focus areas for data acquisition for potential domestic sources of critical minerals: U.S. Geological Survey Open-File Report 2019–1023, 67 p., accessed October 2021 at https://doi.org/10.3133/ofr20191023B.
Hand, B.M., and Banikowski, J.E., 1988, Radon in Onondaga County, New York—Paleohydrogeology and redistribution of uranium in Paleozoic sedimentary rocks: Geology, v. 16, no. 9, p. 775–778. [Also available at https://doi.org/10.1130/0091-7613(1988)016%3C0775:RIOCNY%3E2.3.CO;2.]
Harrell, J.A., Belsito, M.E., and Kumar, A., 1991, Radon hazards associated with outcrops of Ohio Shale in Ohio: Environmental Geology and Water Sciences, v. 18, no. 1, p. 17–26. [Also available at https://doi.org/10.1007/BF01704574.]
Horton, J.D., San Juan, C.A., and Stoeser, D.B., 2017, The State Geologic Map Compilation (SGMC) geodatabase of the conterminous United States: U.S. Geological Survey Data Series 1052, 46 p., accessed October 2021 at https://doi.org/10.3133/ds1052.
Hull, R.N., Kleywegt, S., and Schroeder, J., 2015, Risk-based screening of selected contaminants in the Great Lakes Basin: Journal of Great Lakes Research, v. 41, no. 1, p. 238–245. [Also available at https://doi.org/10.1016/j.jglr.2014.11.013.]
Kesler, S.E., 2019, Great Lakes rocks—4 Billion years of geologic history in the Great Lakes region: Ann Arbor, Michigan, University of Michigan Press, 336 p. [Also available at https://doi.org/10.3998/mpub.9437616.]
Krueger, R., Zoet, L.K., and Rawling, J.E., III, 2020, Coastal bluff evolution in response to a rapid rise in surface water level: Journal of Geophysical Research – Earth Surface, v. 125, article e2019JF005428, 16 p. [Also available at https://doi.org./10.1029/2019JF005428.]
Larson, G.J., and Schaetzl, R., 2001, Origin and evolution of the Great Lakes: Journal of Great Lakes Research, v. 27, no. 4, p. 518–546. [Also available at https://doi.org/10.1016/S0380-1330(01)70665-X.]
Lecavalier, B.S., Milne, G.A., Simpson, M.J., Wake, L., Huybrechts, P., Tarasov, L., Kjeldsen, K.K., Funder, S., Long, A.J., Woodroffe, S., and Dyke, A.S., 2014, A model of Greenland ice sheet deglaciation constrained by observations of relative sea level and ice extent: Quaternary Science Reviews, v. 102, p. 54–84.
Leverington, D.W., and Teller, J.T., 2003, Paleotopographic reconstructions of the eastern outlets of glacial Lake Agassiz: Canadian Journal of Earth Sciences, v. 40, no. 9, p. 1259–1278. [Also available at https://doi.org/10.1139/e03-043.]
Lewis, C.F.M., Blasco, S.M., and Gareau, P.L., 2005, Glacial isostatic adjustment of the Laurentian Great Lakes Basin—Using the empirical record of strandline deformation for reconstruction of early Holocene paleo-lakes and discovery of a hydrologically closed phase: Géographie physique et Quaternaire, v. 59, p. 187–210.
Lineback, J.A., Bleuer, N.K., Mickelson, D.M., Farrand, W.R., and Goldthwait, R.P., 1983, Quaternary geologic map of the Chicago 4°×6° quadrangle, United States, in Richmond, G.M., and Fullerton, D.S., eds., Quaternary geologic atlas of the United States: U.S. Geological Survey Miscellaneous Investigations Series Map I-1420 (NK-16), 1:1,000,000 scale; 1 sheet.
McIntosh, J.C., and Walter, L.M., 2005, Volumetrically significant recharge of Pleistocene glacial meltwaters into epicratonic basins—Constraints imposed by solute mass balances: Chemical Geology, v. 222, no. 3–4, p. 292–309. [Also available at https://doi.org/10.1016/j.chemgeo.2005.07.010.]
McIntosh, J.C., Garven, G., and Hanor, J.S., 2011, Impact of Pleistocene glaciation on large-scale groundwater flow and salinity in the Michigan Basin: Geofluids, v. 11, no. 1, p. 18–33. [Also available at https://doi.org/10.1111/j.1468-8123.2010.00303.x.]
McIntosh, J.C., Walter, L.M., and Martini, A.M., 2004, Extensive microbial modification of formation water geochemistry—Case study form a Midcontinent sedimentary basin, United States: Geological Society of America Bulletin, v. 116, no. 5, p. 743–759. [Also available at https://doi.org/10.1130/B25371.1.]
Mickelson, D.M., and Colgan, P.M., 2003, The southern Laurentide Ice Sheet—Developments in Quaternary Science, v. 1, p. 1–16, accessed October 2021 at https://doi.org/10.1016/S1571-0866(03)01001-7.
Nicholson, S.W., Dicken, C.L., Foose, M.P., and Mueller, J.A.L., 2004, Integrated geologic map databases for the United States; the upper midwest states: Minnesota, Wisconsin, Michigan, Illinois, and Indiana: U.S. Geological Survey Open-File Report 2004–1355, accessed October 2021 at https://doi.org/10.3133/ofr20041355.
Palaseanu, M., Becker, R., Yellich, Y.A., Sataer, G., and Kincare, K., 2019, Creeping before the fall—Glacial bluff landslides, Lake Michigan: American Geophysical Union, Fall Meeting 2019, abstract #EP43D-2397, accessed October 2021 at https://ui.adsabs.harvard.edu/abs/2019AGUFMEP43D2397P/abstract.
Ryder, R.T., Swezey, C.S., Crangle, R.D., Jr., and Trippi, M.T., 2008, Geologic cross section E-E’ through the central Appalachian Basin from the Findlay Arch, Wood County, Ohio, to the Valley and Ridge Province, Pendleton County, West Virginia: U.S. Geological Survey Scientific Investigations Map 2985, 2 sheets with 48-page pamphlet, accessed October 2021 at https://doi.org/10.3133/sim2985.
Sataer, G., Sultan, M., Yellich, J.A., Becker, R., Emil, M.K., and Palaseanu, M., 2017, Shoreline erosion and slope failure detection over southwest lakeshore Michigan using temporal radar and digital elevation model: American Geophysical Union, Fall meeting 2017, abstract #NH43A-0184, accessed October 2021 at https://ui.adsabs.harvard.edu/abs/2017AGUFMNH43A0184S/abstract.
Soller, D.R., 1993, Map showing the thickness and character of Quaternary sediments in the glaciated United States east of the Rocky Mountains; Northeastern states, the Great Lakes, and parts of southern Ontario and the Atlantic offshore area (east of 80° 31’ west longitude): U.S. Geological Survey Miscellaneous Investigations Series Map I-1970-A, scale 1:1,000,000; 1 sheet, accessed October 2021 at https://doi.org/10.3133/i1970A.
Soller, D.R., 1997, Map showing the thickness and character of Quaternary sediments in the glaciated United States east of the Rocky Mountains; Northern and Central Plains States (90° to 102° west longitude): U.S. Geological Survey Miscellaneous Investigations Series Map I-1970-C, scale 1:1,000,000, 1 sheet, accessed October 2021 at https://doi.org/10.3133/i1970C.
Soller, D.R., and Garrity, C.P., 2018, Quaternary sediment thickness and bedrock topography of the glaciated United States east of the Rocky Mountains: U.S. Geological Survey Scientific Investigations Map 3392, scale 1:5,000,000; 2 sheets, accessed October 2021 at https://doi.org/10.3133/sim3392.
Soller, D.R., Packard, P.H., and Garrity, C.P., 2012, Database for USGS Map I-1970—Map showing the thickness and character of Quaternary sediments in the glaciated United States east of the Rocky Mountains: U.S. Geological Survey Data Series 656, accessed October 2021 at https://doi.org/10.3133/ds656.
Stone, B.D., ed., 2001, Surficial geologic map of Berrien County, Michigan: U.S. Geological Survey Open-File Report 01–156, version 1.0, 1 sheet, scale 1:100,000. [Also available at https://pubs.usgs.gov/of/2001/ofr-01-0156/.]
Stone, B.D., Kincare, K.A., O’Leary, D.W., Newell, W.L., Taylor, E.M., Williams, V.S., Lundstrom, S.C., Abraham, J.E., and Powers, M.H., 2017, Surficial geologic map of Berrien County, Michigan, and the adjacent offshore area of Lake Michigan: U.S. Geological Survey Scientific Investigations Map 3383, 2 sheets, scale 1:50,000, and 49-p. pamphlet, accessed October 2021 at https://doi.org/10.3133/sim3383.
Swezey, C.S., 2008, Regional stratigraphy and petroleum systems of the Michigan Basin, North America: U.S. Geological Survey Scientific Investigations Map 2978, 1 sheet, accessed October 2021 at http://doi.org/10.3133/sim2978.
Swezey, C.S., 2009, Regional stratigraphy and petroleum systems of the Illinois Basin, U.S.A.: U.S. Geological Survey Scientific Investigations Map 3068, 1 sheet, accessed October 2021 at http://doi.org/10.3133/sim3068.
Swezey, C.S., 2018, Allogenic controls on lithostratigraphy, and implications regarding the geologic mapping of black shale in the eastern United States, in Thorleifson, H.L., ed., Geologic Mapping Forum 2018 abstracts: Minnesota Geological Survey Open-File Report OFR-18-01, p. 91–92, accessed October 2021 at https://conservancy.umn.edu/handle/11299/194852.
Swezey, C.S., Hatch, J.R., East, J.A., Hayba, D.O., and Repetski, J.E., 2015, Total petroleum systems of the Michigan Basin—Petroleum geology and geochemistry and assessment of undiscovered resources, chap. 2 of U.S. Geological Survey Michigan Basin Assessment Team, eds., Geologic assessment of undiscovered oil and gas resources of the U.S. portion of the Michigan Basin: U.S. Geological Survey Digital Data Series DDS-69-T, 162 p., accessed October 2021 at https://doi.org/10.3133/ds69T.
Szramek, K., Walter, L.M., and McCall, P., 2004, Arsenic mobility in groundwater/surface water systems in carbonate-rich Pleistocene glacial drift aquifers (Michigan): Applied Geochemistry, v. 19, no. 7, p. 1137–1155. [Also available at https://doi.org/10.1016/j.apgeochem.2004.01.012.]
Thatcher, C.A., Brock, J.C., Danielson, J.J., Poppenga, S.K., Gesch, D.B., Palaseanu-Lovejoy, M., Barras, J.A., Evans, G.A., and Gibbs, A.E., 2016, Creating a coastal national elevation database (CoNED) for science and conservation applications: Journal of Coastal Research, v. 76, p. 64–74. [Also available at https://doi.org/10.2112/SI76-007.]
U.S. Geological Survey, 2021, The National Geological Map Database: U.S. Geological Survey website, accessed January 2021 at https://ngmdb.usgs.gov/ngmdb/ngmdb_home.html.
Abbreviations
2D
two-dimensional
3D
three-dimensional
Earth MRI
Earth Mapping Resources Initiative
GIS
geographic information system
GLGMC
Great Lakes Geologic Mapping Coalition
GPS
Global Positioning System
lidar
light detection and ranging
NCGMP
National Cooperative Geologic Mapping Program
PFAS
Per- and Polyfluoroalkyl substances
REE
rare earth element
USGS
U.S. Geological Survey
Suggested Citation
Swezey, C.S., Blome, C.D., Kincare, K.A., Lundstrom, S.C., Stone, B.D., Sweetkind, D.S., Berg, R.C., Brown, S.E., and Yellich, J.A., 2022, Implementation plan of the National Cooperative Geologic Mapping Program strategy—Great Lakes (Central Lowland and Superior Upland Physiographic Provinces): U.S. Geological Survey Open-File Report 2021–1120, 24 p., https://doi.org/10.3133/ofr20211120.
ISSN: 2331-1258 (online)
Study Area
| Publication type | Report |
|---|---|
| Publication Subtype | USGS Numbered Series |
| Title | Implementation plan of the National Cooperative Geologic Mapping Program strategy—Great Lakes (Central Lowland and Superior Upland Physiographic Provinces) |
| Series title | Open-File Report |
| Series number | 2021-1120 |
| DOI | 10.3133/ofr20211120 |
| Year Published | 2022 |
| Language | English |
| Publisher | U.S. Geological Survey |
| Publisher location | Reston, VA |
| Contributing office(s) | Central Energy Resources Science Center, Eastern Geology and Paleoclimate Science Center, Florence Bascom Geoscience Center |
| Description | iv, 24 p. |
| Country | Canada, United States |
| Other Geospatial | Great Lakes (Central Lowland and Superior Upland Physiographic Provinces) |
| Online Only (Y/N) | Y |
| Additional Online Files (Y/N) | N |
| Google Analytic Metrics | Metrics page |