

Evaluation of Two Existing Flood Management Structures in U.S. Army Garrison Fort Gordon, Georgia, 2020
Links
- Document: Report (6.04 MB pdf) , HTML , XML
- Download citation as: RIS | Dublin Core
Abstract
Two existing flood management structures in U.S. Army Garrison Fort Gordon, Georgia, were evaluated for potential retrofitting to address water-quality impacts, pursuant of U.S. Army Garrison Fort Gordon’s storm water management program. Stormwater calculations were computed according to the Georgia Stormwater Management Manual, including drainage area delineations, design-storm runoff volumes and peak discharges, stage-storage and stage-discharge curves, and outflow calculations. The results of these analyses were compared to Georgia’s regulatory requirements for dry detention basins. The two existing flood management structures did not meet the requirements for a dry detention basin. Planning-level analyses for these basins indicate that the existing structures do not have adequate storage capacity for the overbank flood design-storm runoff volume (25-year, 24-hour storm) or the extreme flood design-storm runoff volume (100-year, 24-hour storm) and neither storm water structural control 2 nor storm water structural control 3 has the emergency spillway needed to safely convey overflows. Furthermore, land use changes (forest removal) and the risk for additional sediment loads to these structures may reduce available storage volume, increasing the risk for design failure. Three potential retrofit alternatives were provided for planning purposes only, with a brief discussion of advantages and disadvantages of each alternative retrofit strategy.
Introduction
U.S. Army Garrison Fort Gordon, Georgia encompasses about 56,000 acres and supports a population of about 80,000 service members, families, contractors, and others (U.S. Army Garrison Fort Gordon, 2020). U.S. Army Garrison Fort Gordon’s storm water management program is regulated through the National Pollution Discharge Elimination System municipal separate storm sewer system (MS4) permitting program. U.S. Army Garrison Fort Gordon’s current storm water management plan defines six minimum control measures with each including multiple best management practices (BMPs) that outline specific actions to improve stormwater management (S. Scott, U.S. Army Garrison Fort Gordon, written commun., 2019). This study was designed to support U.S. Army Garrison Fort Gordon with assessing the effectiveness of two existing flood management structures (detention/retention ponds) for providing adequate runoff reduction and treatment.
In cooperation with the Environmental and Natural Resources Management Division of the U.S. Army Garrison Fort Gordon, the U.S. Geological Survey (USGS) South Atlantic Water Science Center evaluated the hydrologic, hydraulic, and water-quality design parameters for two existing dry detention basins. The two dry detention basins are storm water structural control 2 (SWSC–02) and storm water structural control 3 (SWSC–03), in the western part of U.S. Army Garrison Fort Gordon’s municipal area in Richmond County (fig. 1). These dry detention basins discharge to unnamed tributaries to Spirit Creek (not shown), which is listed as impaired on Georgia’s 2020 303(d) impaired waters list because of urban stormwater runoff (Georgia Department of Natural Resources Environmental Protection Division, 2020). SWSC–02 and SWSC–03 were constructed in 1999–2000 before the latest edition of the Georgia Stormwater Management Manual (Atlanta Regional Commission, 2016). In this study, SWSC–02 and SWSC–03 were evaluated using methods and criteria from the 2016 edition of the Georgia Stormwater Management Manual (Atlanta Regional Commission, 2016).
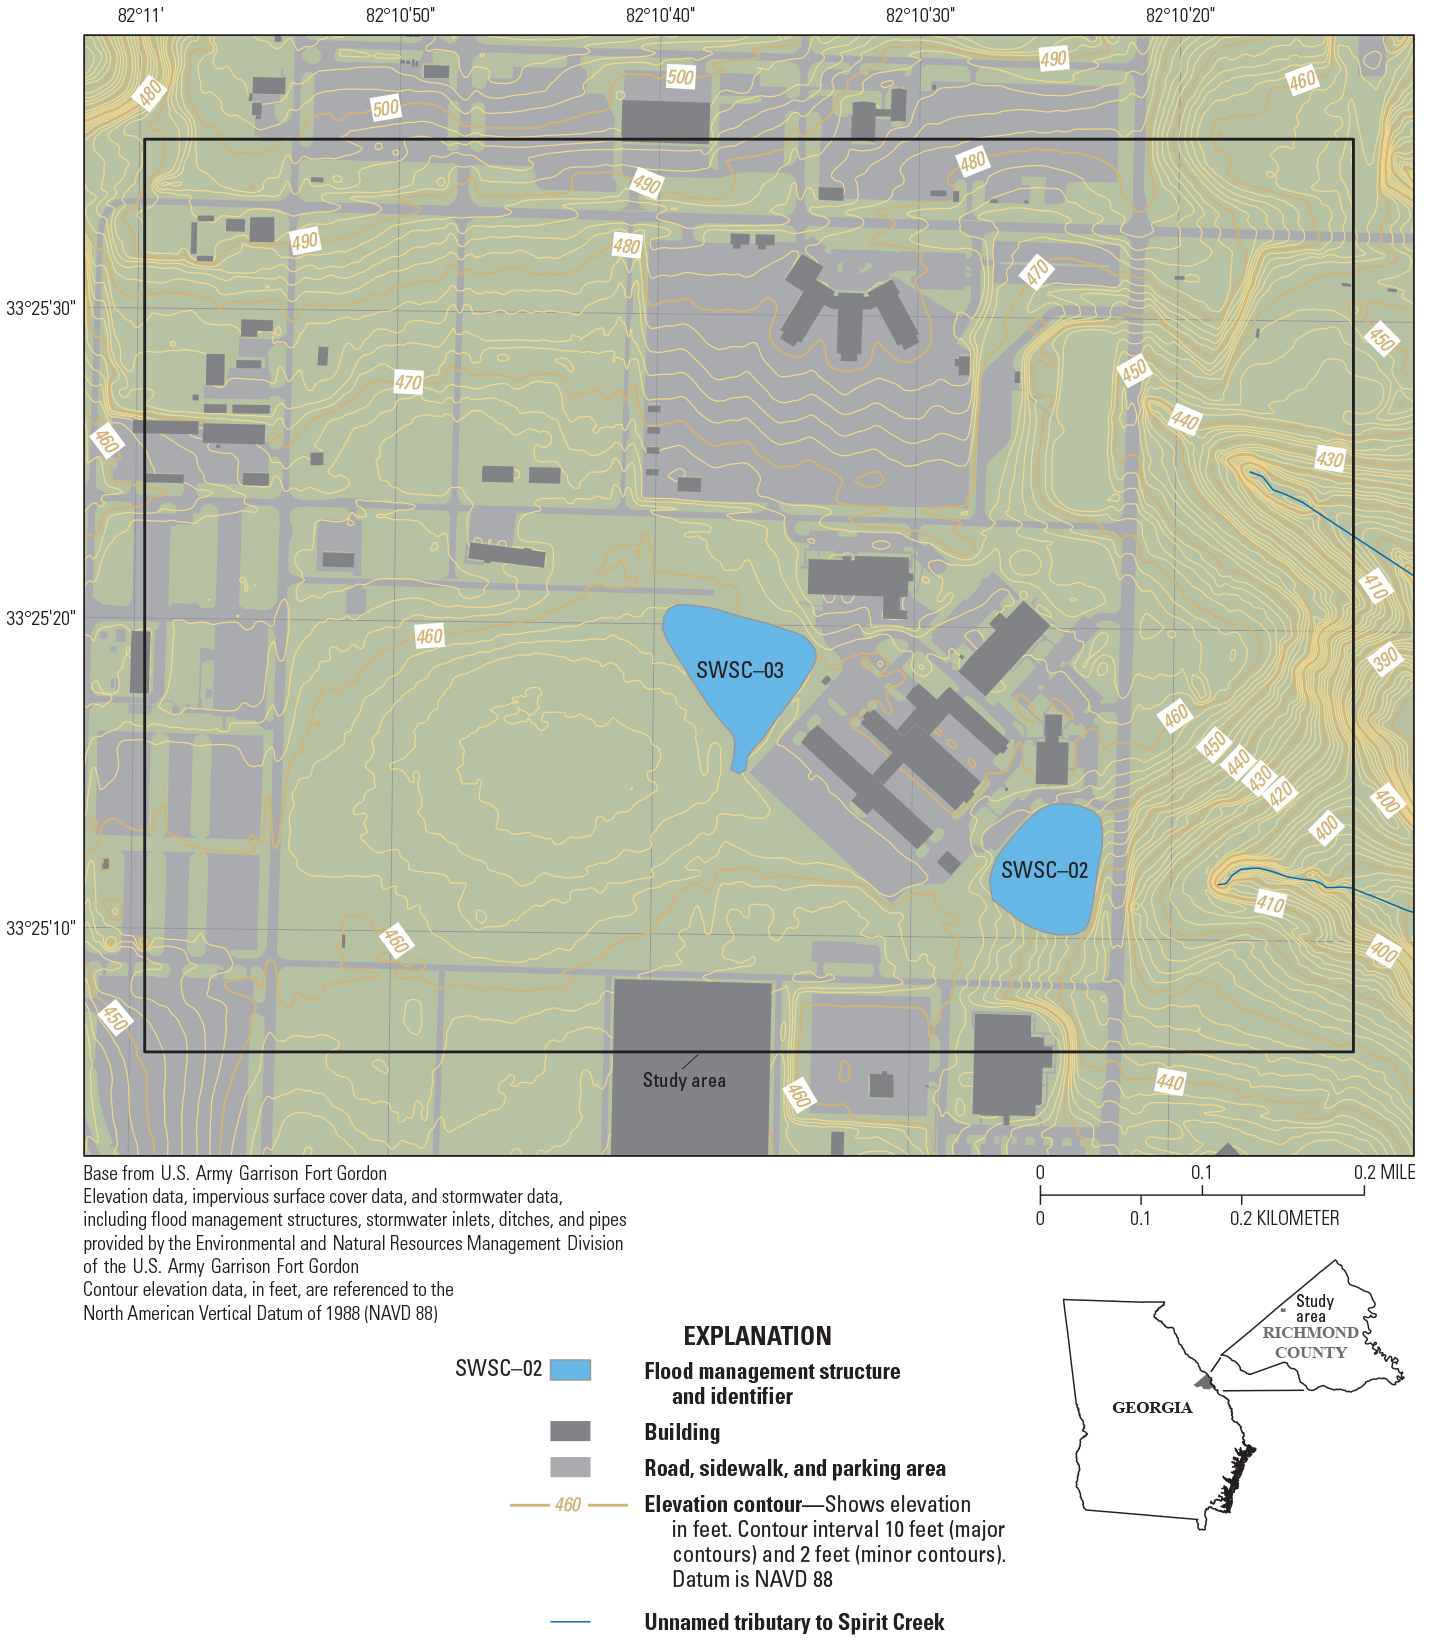
Location map showing flood management structures, storm water structural control 2 (SWSC–02) and storm water structural control 3 (SWSC–03), in U.S. Army Garrison Fort Gordon, Richmond County, Georgia.
This report presents the following: (1) computed stormwater runoff characteristics for the existing dry detention basins, including stormwater runoff volumes, peak inflows and allowable outflow rates, and storage requirements for multiple design storms; (2) comparison of the existing dry detention basins to the requirements from the 2016 edition of the Georgia Stormwater Management Manual (Atlanta Regional Commission, 2016) to identify criteria compliance; and (3) potential retrofit alternatives to update any noncompliant requirements per the 2016 edition of the Georgia Stormwater Management Manual (Atlanta Regional Commission, 2016). The retrofit alternatives examined by the USGS are provided only for preliminary planning-level estimates of the potential feasibility of retrofitting the existing facilities. Specific retrofits and designs that may be required by the U.S. Army Garrison Fort Gordon will need to be fully evaluated by a licensed engineer. This collaborative project aligns with the USGS water science strategy’s core capabilities to partner with other Federal agencies, including the Department of Defense, to provide support for water resource issues such as flooding (Evenson and others, 2013).
Stormwater Calculations for Existing Flood Management Structures
Calculations described in this section are found in “Section 3.1—Methods for Estimating Stormwater Runoff” of the Georgia Stormwater Management Manual Volume 2—Technical Handbook (Atlanta Regional Commission, 2016). The use of the Georgia Stormwater Management Manual for this study was necessitated by local regulations and standards relevant to the U.S. Army Garrison Fort Gordon and does not imply endorsement by the U.S. Government.
Justification for Remote Desktop Analyses
This project began in late 2019 and was initially expected to be completed by September 2020. However, the coronavirus disease 2019 (COVID–19) was first detected in the United States in January 2020 and proceeded to spread across the Nation, causing shut-downs and halting work. As a result, the timeline and approach for this project were amended to accommodate national COVID–19 safety protocols put forth by the Centers for Disease Control and Prevention. Therefore, flood management structures were evaluated remotely using existing geospatial datasets, which obviated the need for manual data collection tasks that would require USGS staff to enter the U.S. Army Garrison Fort Gordon.
The geospatial datasets used for the evaluation of the existing flood management structures are summarized in table 1. The datasets provided for use in this study by U.S. Army Garrison Fort Gordon have limited availability, contact the Environmental and Natural Resources Management Division of the U.S. Army Garrison Fort Gordon for further information. All geospatial analysis was completed using Esri ArcGIS Desktop 10.7.1. A 4-foot digital elevation model (DEM) developed from light detection and ranging (lidar) data collected in 2011 was used for drainage area and stage-storage analyses. The 2011 4-foot DEM was the most recent elevation data available in the study area with the required spatial resolution for the intended analyses. Calculations requiring the 2011 DEM did not represent 2020 elevations; however, changes to elevations between 2011 and 2020 because of sediment accumulation, erosion, or other potential sources are not expected to alter the outcomes of the evaluations of existing flood management projects.
Table 1.
Geospatial datasets used for this study.[lidar, light detection and ranging; DEM, digital elevation model; NAVD 88, North American Vertical Datum of 1988; MS4, municipal separate storm sewer system]
| Dataset | Description | Source |
|---|---|---|
| 2011 Georgia Lidar DEM: Burke Richmond Lincoln Columbia Counties | Raster DEM, cell size 4 feet, vertical accuracy 2.36 inches, horizontal accuracy 48 inches, NAVD 88. | Office for Coastal Management, 2021. |
| U.S. Army Garrison Fort Gordon impervious areas | Geodatabase of all impervious surfaces (buildings, parking areas, roadways, and sidewalks) as polygon features. | U.S. Army Garrison Fort Gordon. |
| U.S. Army Garrison Fort Gordon MS4 | Geodatabase of all MS4 components (inlets, ditches, pipes, culverts, nodes, and discharge points) as line and point features. | U.S. Army Garrison Fort Gordon. |
Drainage Area Analysis
All geospatial data were projected to the North American Datum of 1983 (NAD 83) Universal Transverse Mercator zone 17 north coordinate system. The 2011 4-foot DEM was modified to ensure flow paths, drainage areas, and catchment areas conformed with existing stormwater infrastructure. In this section and subsequent sections, the phrase “drainage area” refers to the full area that drains to an existing stormwater management structure and the phrase “catchment area” refers to subunits within a drainage area.
First, the MS4 network was hydroenforced into the DEM by converting linear features (ditches and pipes) into rasters and subtracting 10 feet (an arbitrary value) from all DEM cells with overlapping MS4 features. This process allowed for subsurface features to be properly represented in subsequent flow direction and flow accumulation analyses to be completed for this study. Second, flow barriers also were hydroenforced into the DEM by adding 10 feet (an arbitrary value) to all DEM cells containing roof ridges or curbs to ensure proper delineation of catchment areas.
Once all MS4 features and flow barriers were represented in the modified DEM, drainage and catchment areas were delineated using the hydrology toolset within the spatial analyst toolbox. First, flow directions of each cell in the modified DEM were determined using the flow direction tool. Second, sinks (cells representing local minima without a downstream flow direction value) were identified using the sink tool and inspected for validity. Some sinks were appropriately identified, such as the existing flood management structures, but other sinks were not appropriately identified because of random variation in the DEM (from the raw lidar data used to create the 4-foot DEM). Next, the fill tool was used to fill in sinks; the Z-limit, or sink filling threshold, was iteratively modified to ensure that sinks from random variations in the DEM were filled while true sink features were maintained. Once all sinks from random variations in the DEM were filled, the flow direction tool was reapplied using the modified and filled DEM, followed by reapplication of the flow accumulation tool. The inflow and outflow locations for each flood management structure were selected as pour points using the snap pour point tool. Lastly, the watershed tool was used to delineate rasterized catchment areas for each pour point that were then converted to polygon features. A map showing the delineated catchment areas is shown in figure 2, and catchment area attributes are summarized in table 2.
Table 2.
Catchment area attributes.[SWSC–03, storm water structural control 3; %, percent; SWSC–02, storm water structural control 2]
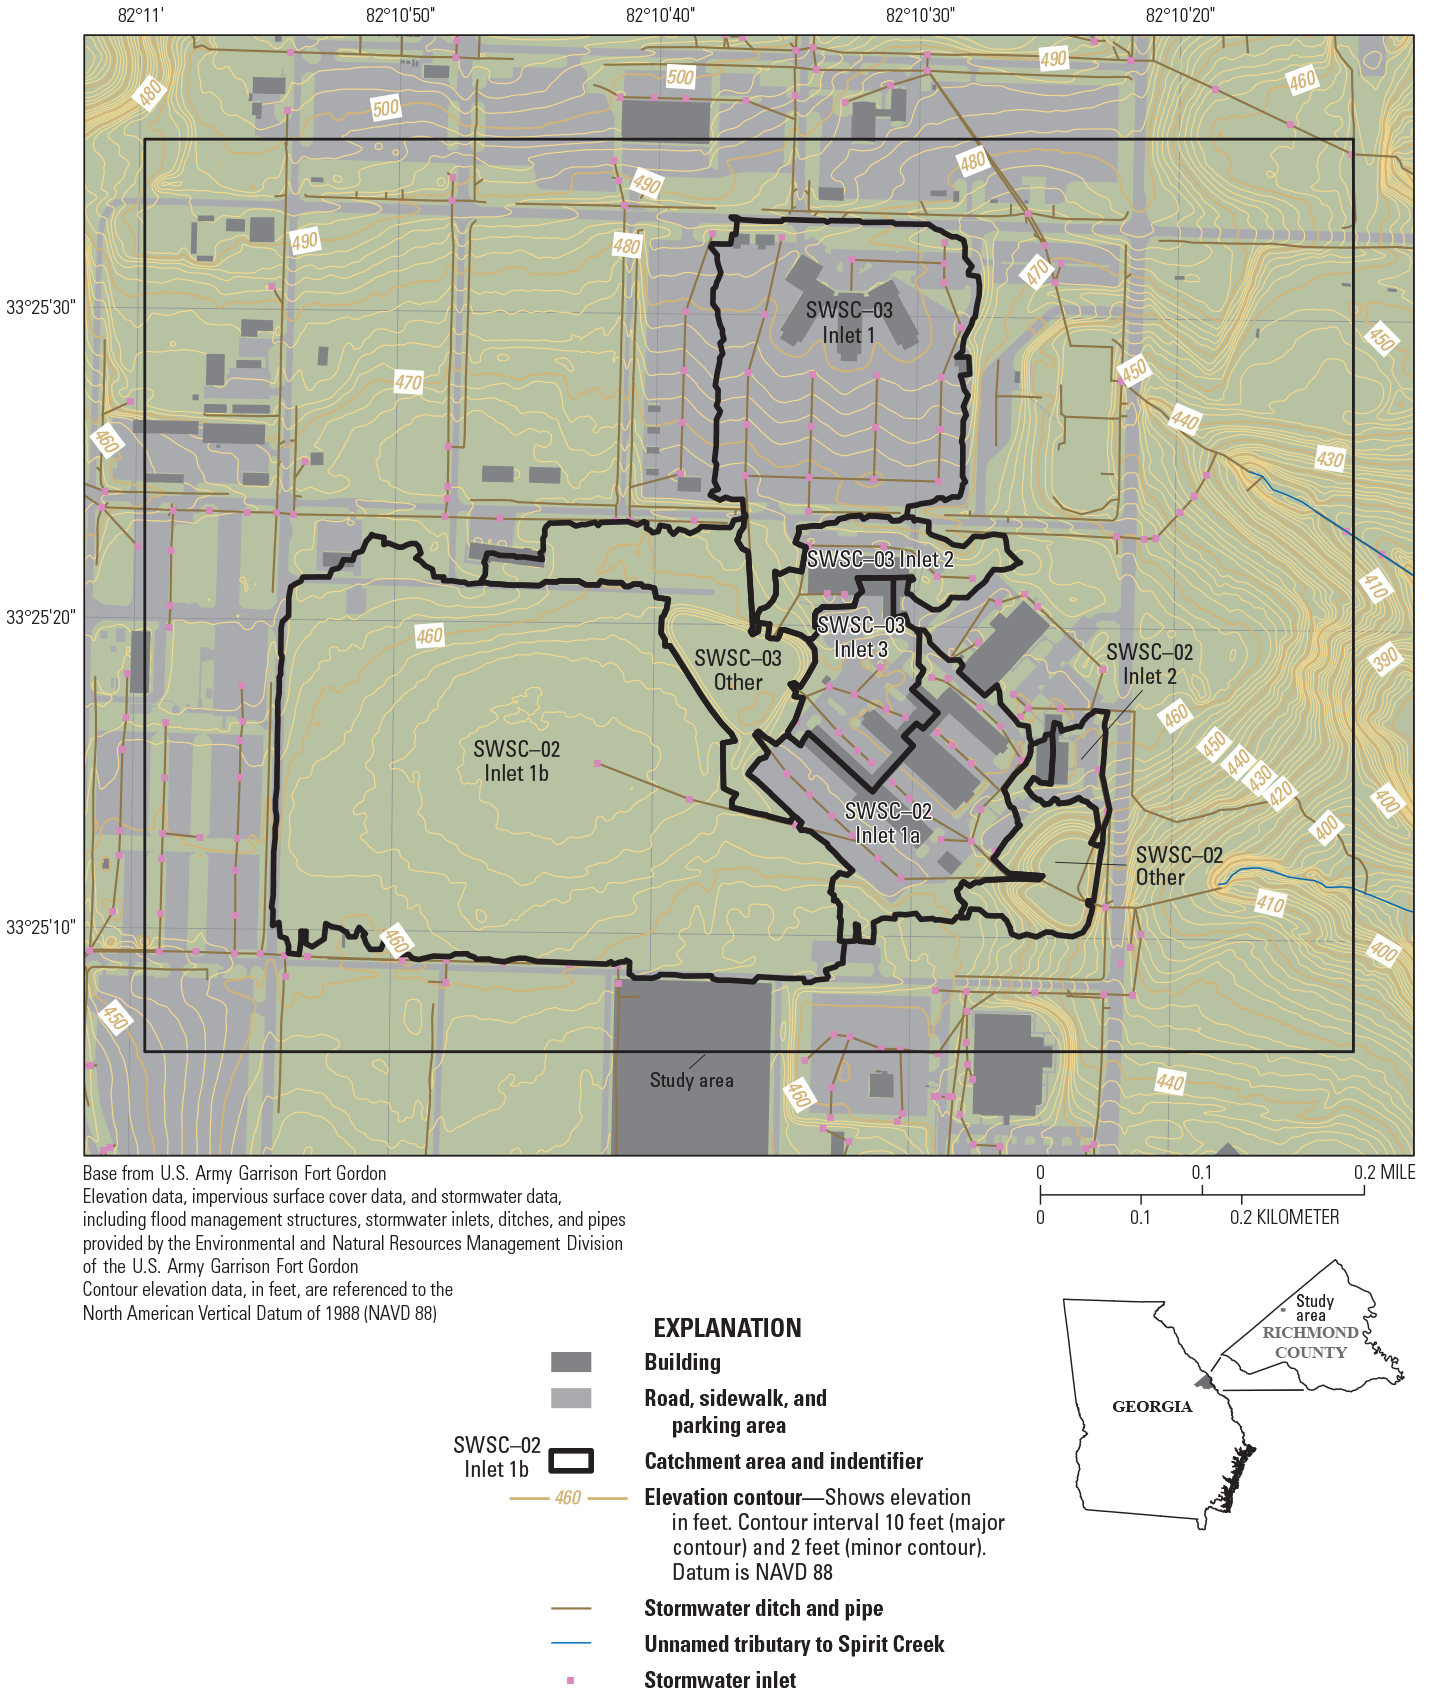
Map showing delineated catchment areas. The ‘SWSC–02’ and ‘SWSC–03’ prefix indicates the larger drainage area in which the catchment is contained. Discharge from storm water structural control 3 (SWSC–03) reenters the municipal separate storm sewer system (MS4) network and is conveyed to storm water structural control 2 (SWSC–02). Discharge from SWSC–02 is conveyed east to an unnamed tributary to Spirit Creek (not shown).
A review of historical satellite imagery indicated that the wooded tract in drainage area SWSC–02 Inlet1b was cleared between 2018 and 2019. In theory, tree clearing may have caused changes to elevations and local drainage patterns. However, catchment area SWSC–02 Inlet1b is bounded by roadways; therefore, the catchment area delineations likely represent current conditions. Tree clearing also is expected to change the rainfall-runoff response, most likely causing higher runoff volumes (Shepard, 1994; McBroom and others, 2008; Boggs and others, 2016). All subsequent runoff volume calculations computed for catchment area SWSC–02 Inlet1b were based on deforested conditions.
Design-Storm Inflow Calculations
Runoff volumes and inflow hydrographs were calculated for the water-quality (1.2 inches), channel protection (1-year, 24-hour storm), overbank flood (25-year, 24-hour storm), and extreme flood (100-year, 24-hour storm) design storms (Atlanta Regional Commission, 2016). Runoff volumes for each design storm were calculated for each catchment area and are summarized in table 3.
Table 3.
Runoff volumes from each catchment area for each design storm.[SWSC–03, storm water structural control 3; SWSC–02, storm water structural control 2]
Required storage volumes (from eqs. 6–8) are listed for the channel protection design storm rather than runoff volumes (from eqs. 3–5) (Atlanta Regional Commission, 2016).
Runoff volumes for the water-quality design storm were calculated using equations 1 and 2 as follows and as described in Atlanta Regional Commission (2016):
whereRv
is the runoff coefficient (unitless);
I
is the percent of impervious cover, in percent;
WQv
is the water-quality volume, in inches; and
P
is the precipitation depth, in inches.
The water-quality design-storm precipitation depth is the average 85th percentile annual rainfall depth across the State of Georgia, which is 1.2 inches (Atlanta Regional Commission, 2016).
Runoff volumes for the channel protection, overbank flood, and extreme flood design storms were calculated using the Soil Conservation Service Natural Resources Conservation Service (NRCS) Technical Release (TR–55) hydrologic method, as indicated in equations 3, 4, and 5 as follows and as described in Atlanta Regional Commission (2016):
whereQ
is the direct runoff depth, in inches;
P
is the precipitation depth, in inches;
Ia
is the initial abstraction, including surface storage, interception, evaporation, and infiltration before runoff, in inches;
S
is the potential maximum soil retention, in inches; and
CN
is the NRCS TR–55 curve number (unitless).
Precipitation depth estimates for the channel protection design storm (3.18 inches, the 1-year, 24-hour storm), overbank flood design storm (6.15 inches, the 25-year, 24-hour storm), and extreme flood design storm (8.10 inches, the 100-year, 24-hour storm) were obtained for the study area from the Precipitation Frequency Data Server (National Weather Service, 2017). Per guidance from the Georgia Stormwater Management Manual, a composite NRCS TR–55 curve number (CN) was determined for each catchment area (table 4) by computing the weighted average of impervious surfaces (CN=98) and pervious surfaces (CN=49, fair condition open space in hydrologic soil group A) as listed in table 3.1.5–1 in Atlanta Regional Commission (2016).
Table 4.
Composite Natural Resources Conservation Service Technical Release 55 curve numbers for each catchment area.[SWSC–03, storm water structural control 3; SWSC–02, storm water structural control 2]
For the channel protection design storm, additional steps were required to determine the required storage volume (which, for only the channel protection design storm and not the water-quality, overbank flood, or extreme flood design storms, does not equal the runoff volume; details in Atlanta Regional Commission [2016]). First, the longest flow path in each catchment area was determined, and the traveltime along each flow path was estimated using equations 6 and 7 as follows and as described in Atlanta Regional Commission (2016):
whereVpaved
is the average velocity of shallow concentrated flow over paved surfaces, in feet per second;
Vunpaved
is the average velocity of shallow concentrated flow over unpaved surfaces, in feet per second;
s
is the average slope along the longest flow path, in feet per foot;
Tt
is the traveltime, in hours; and
L
is the length of the longest flow path, in feet.
Next, the unit peak discharge was estimated using figure 3.1.5–6 Atlanta Regional Commission (2016) using the traveltime from equation 7, the Ia/P as calculated from equation 4, and the channel protection design-storm depth (3.18 inches). The ratio of outflow to inflow was estimated using figure 3.3.5–1 in Atlanta Regional Commission (2016) using an extended detention time of 24 hours (T=24) and the estimated unit peak discharges for each catchment area. The ratio of required storage volume to runoff volume was then calculated using equation 8 as follows and as described in Atlanta Regional Commission (2016):
whereis the ratio of required storage volume to runoff volume (unitless); and
is the ratio of outflow to inflow (unitless).
The ratio of required storage volume to runoff volume was multiplied by the runoff volume from the channel protection design storm to determine the required storage volume.
Inflow hydrographs were developed for each design storm in each catchment area using the NRCS TR–55 tabular hydrograph procedure, as described in Atlanta Regional Commission (2016). First, the traveltime for each catchment area was determined using equations 6 and 7. Then, the time to peak was calculated using equation 9 as follows:
whereIf the computed time to peak for any catchment area was less than 0.1 hour (6 minutes), the time to peak was changed to equal 0.1 hour. Then, the peak discharge was determined using equation 10 as follows:
wherequ
is the unit hydrograph peak discharge, in cubic feet per second;
PF
is the peaking factor (unit-conversion factor);
A
is the catchment area, in square miles;
Q
is the runoff depth, in inches; and
Tp
is the time to peak, in hours.
Per guidance in the Georgia Stormwater Management Manual Volume 2, the default peaking factor for rolling hills (484) was used for equation 10 (Atlanta Regional Commission, 2016). Lastly, the incremental discharge rate was determined in 1-minute intervals by computing the ratio of incremental discharge to peak discharge using equation 11 as follows:
whereis the ratio of incremental discharge to peak discharge;
t
is the time, in hours; and
Tp
is the time to peak, in hours.
For each 1-minute increment, the ratio of incremental discharge to peak discharge was multiplied by the catchment area’s peak discharge rate from equation 10. Inflow hydrographs were determined for each catchment area, and the total inflow hydrograph for each flood management structure was calculated as the sum of all the catchment area’s individual inflow hydrographs (fig. 3).
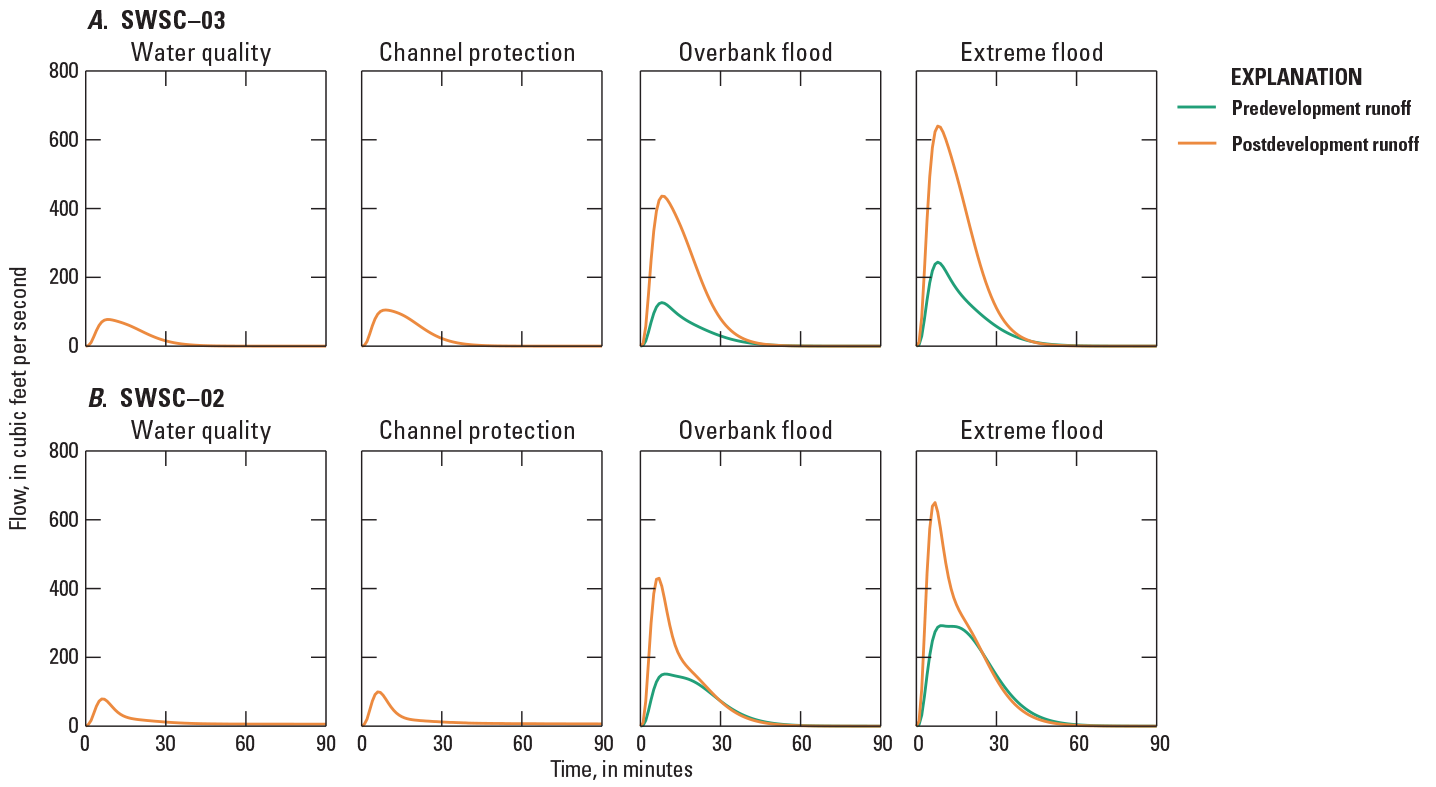
Predevelopment and postdevelopment inflow hydrographs. A, storm water control structure 3 (SWSC–03) and B, storm water structural control 2 (SWSC–02).
The predevelopment hydrographs shown in figure 3 were estimated by assuming all catchment areas represented fair condition open space land cover (CN=49, per table 3.1.5–1 in Atlanta Regional Commission [2016]). This predevelopment condition does not reflect pristine conditions (mature forests); instead, fair condition open space land cover was selected to acknowledge that the land had already been partially converted from mature forest before the construction of buildings, roads, and other impervious surfaces. Per guidance in Atlanta Regional Commission (2016), predevelopment hydrographs were generated only for the overbank flood and extreme flood design storms (fig. 3; the water-quality and channel protection design-storm evaluations are not dependent upon predevelopment conditions).
Stage-Storage Analysis
The storage capacity of each flood management structure was computed as a function of stage using the storage capacity tool within the spatial analyst supplemental toolbox. The storage capacity tool requires an elevation model as an input, with an optional polygon feature to identify a specific area, and outputs a tabular summary of storage volume and surface area at specified elevation intervals. Because the hydroenforced DEM that was used for watershed and catchment delineation had depressions smoothed and removed for routing purposes (by filling sinks), the original 2011 4-foot DEM was used to develop stage-storage relations. Elevation profiles also were drawn along the embankment of each flood management structure to identify the elevation at which the embankment would breach.
The elevations of key outlet structure features (for example, orifice invert and weir invert) could not be precisely determined because direct field measurements were not permissible under travel restrictions associated with the COVID–19 pandemic during the study. Instead, a simple procedure was developed to estimate elevations of each outlet structure feature. The base of each outlet structure was assigned as the relative reference datum (stage equal to zero foot), and each outlet feature’s height above the reference datum was measured by U.S. Army Garrison Fort Gordon personnel. Field observations and photographs were used to verify that the base of each outlet structure was about flush with the ground elevations. Because of the presence of depressions within the flood management structures, the base elevation of the outlet structure was not necessarily equal to the minimum elevation in the DEM. However, depressional areas were not determined to substantially change stage-storage relations. The stage-storage curves for each flood management structure are shown in figure 4 and the elevations of key outlet structure features are shown in figure 5.
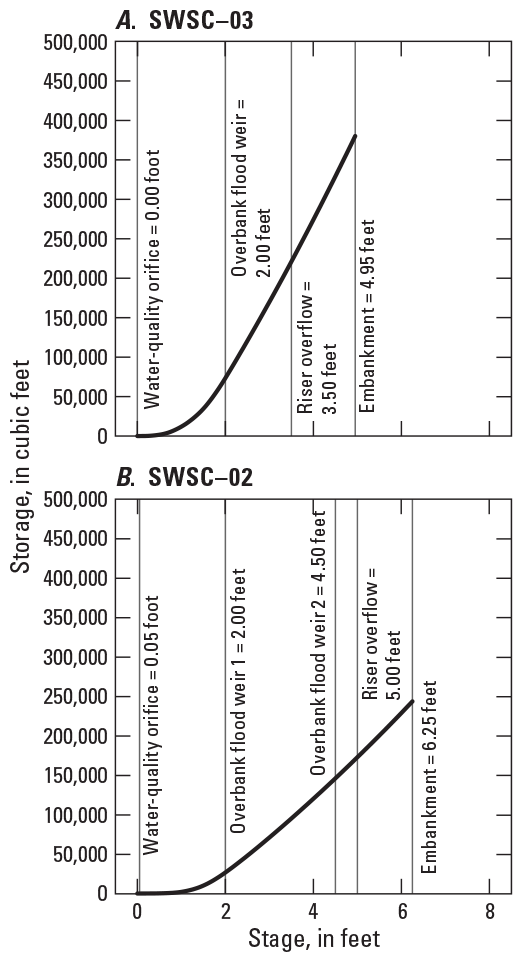
Stage-area and stage-storage curves for each flood management structure. A, storm water structural control 3 (SWSC–03), and B, storm water structural control 2 (SWSC–02).
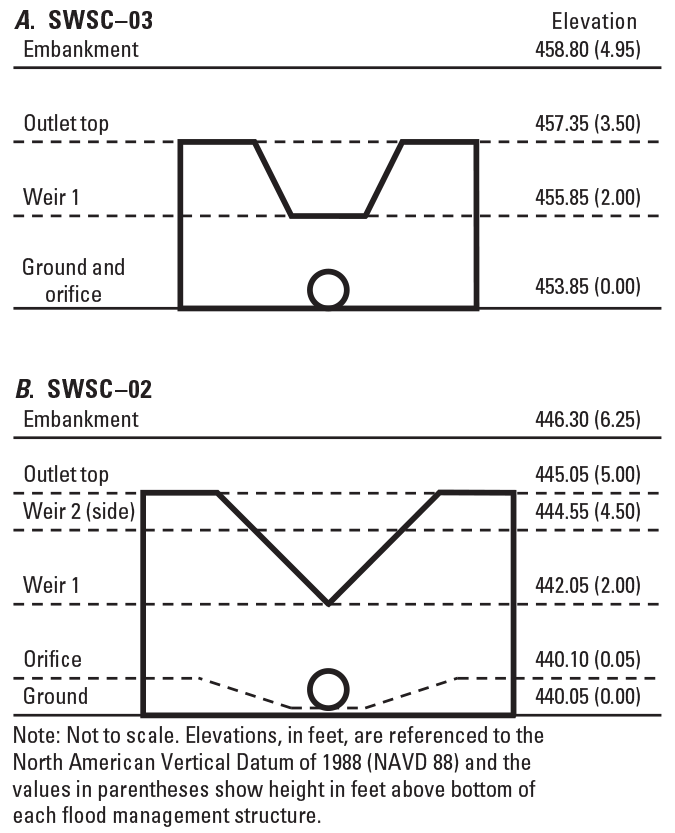
Front-view schematic of the outlet structures. A, storm water structural control 3 (SWSC–03) and B, storm water structural control 2 (SWSC–02).
To comply with COVID–19 safety protocols, the stage-storage analysis was completed remotely and was not supported with a field survey. One disadvantage of this approach was that key elevations could not be verified in the field. Although the procedure described in the previous paragraph provided reasonable estimates, the exact elevations could not be verified. A second disadvantage is the DEM represented 2011 conditions; therefore, elevations within the flood management structures could have changed, possibly from sediment accumulation or erosion.
A rough estimate of upland erosion from the drainage areas was calculated to gage the possibility of sediment infill reducing storage capacity within the flood management structures. Upland erosion rates from impervious surfaces and forests were assumed to be zero, whereas erosion rates from pervious open spaces (lawns in fair condition) were assumed to be 4.41 tons per acre per year, the average rate reported from the 2017 National Resources Inventory for cropland erosion in Georgia between 2012 and 2017 (U.S. Department of Agriculture, 2017). Cropland erosion rates generally are higher than erosion rates from unmanaged open space, so the estimates provided are regarded as being conservative. Erosion rates in tons per acre per year were converted to cubic feet using the soil’s reported bulk density of 1.5 grams per cubic centimeter (Natural Resources Conservation Service, 2021) then compared to the total storage capacities of the flood management structures. From 2011 through 2020, the estimated sediment infill into SWSC–03 was about 10,740 cubic feet, or 2.8 percent of the total storage capacity (see fig. 4). During the same time period, the estimated sediment infill into SWSC–02 was about 16,030 cubic feet, or 6.6 percent of the total storage capacity. These infill estimates did not account for potential sediment resuspension and discharge from the flood management structures, which would reduce sediment accumulation, or tree clearing that occurred between 2018 and 2019 in the SWSC–02 Inlet1b catchment area. Tree clearing can cause a substantial increase to soil erosion rates when erosion and sediment control measures are not used (Shepard, 1994; McBroom and others, 2008; Boggs and others, 2016). Because the tree-clearing efforts may have a substantial effect on runoff hydrology and sediment transport, the effects of these operations may be of substantial interest for the management and modification of these structures.
Design-Storm Outflow Calculations
The predevelopment inflow hydrographs from each design storm were used in conjunction with the stage-storage curves to simulate runoff accumulation within the flood management structures. Inflows, stage, and outflow were estimated in 1-minute time steps. Outflow was dependent upon the outlet structure dimensions (fig. 5) and stage (fig. 6). Readers should reference Atlanta Regional Commission (2016) for equations to estimate discharge through orifices and weirs of various geometries. The outlet pipe configuration was used to estimate maximum discharge through the outlet structure using equations 12 and 13 as follows and as described in Atlanta Regional Commission (2016):
whereQmax
is the maximum discharge from the outlet structure, in cubic feet per second;
A
is the cross sectional area of the outlet pipe, in square feet;
g
is the standard acceleration because of gravity, in feet per second squared;
H
is the height of water above the outlet pipe discharge point, in feet;
kp
is the pipe friction coefficient (1 per foot);
L
is the length of the outlet pipe, in feet;
5087
is a coefficient derived from an empirical regression;
n
is the Manning’s roughness coefficient (unitless); and
D
is the outlet pipe diameter, in inches.
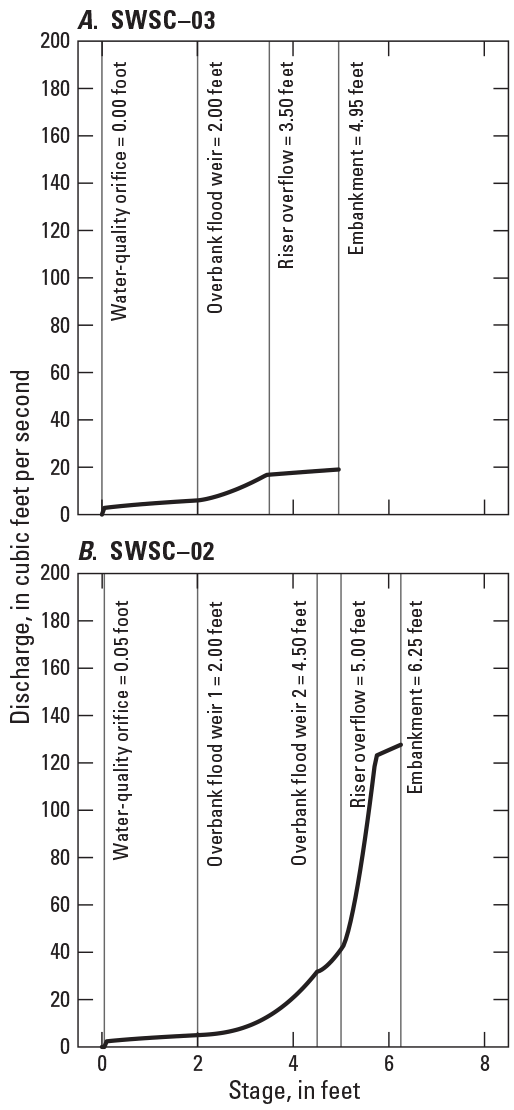
Stage-discharge curves for each flood management structure. A, storm water structural control 3 (SWSC–03) and B, storm water structural control 2 (SWSC–02).
The SWSC–03 outlet pipe is a 175-foot, 18-inch diameter concrete pipe. The SWSC–02 outlet pipe is a 70-foot, 36-inch diameter concrete pipe. The slopes of the outlet pipes were unknown and assumed to be 1-percent based on topography at the flood management structures. A sensitivity analysis was completed to test different outlet pipe slopes and results indicated that the maximum outlet discharge was not substantially affected by the slope of the outlet pipe. Outflows from SWSC–03 were conveyed to SWSC–02 via the MS4 network and were superimposed with the inflow runoff hydrographs from the SWSC–02 catchment areas to create the inflow hydrographs for SWSC–02 (see fig. 2).
If the modeled design storm stage breached the embankment, overflows were assumed to equal the inflow rate minus the discharge rate from the outlet structure; stage was assumed to remain constant at the breach elevation. Overflows from SWSC–03 were assumed to discharge overland and into SWSC–02 after about 9 minutes (based on eq. 7). Overflows from SWSC–02 were assumed to breach the roadway to the east of SWSC–02 and discharge offsite. The true timing and direction of overflows from these flood management structures is unknown and would require a process-based hydraulic model, which was outside the scope of this study.
The predevelopment inflow hydrograph, postdevelopment inflow hydrograph, and postdevelopment outflow hydrograph for each design storm are shown on figure 7. The drawdown times within the flood management structures for each design storm are listed in table 5. Drawdown times assume no clogging at the orifice structure and are dependent upon the inflow hydrograph for each design storm.
Table 5.
Drawdown times for each design storm.[SWSC–03, storm water structural control 3; SWSC–02, storm water structural control 2]
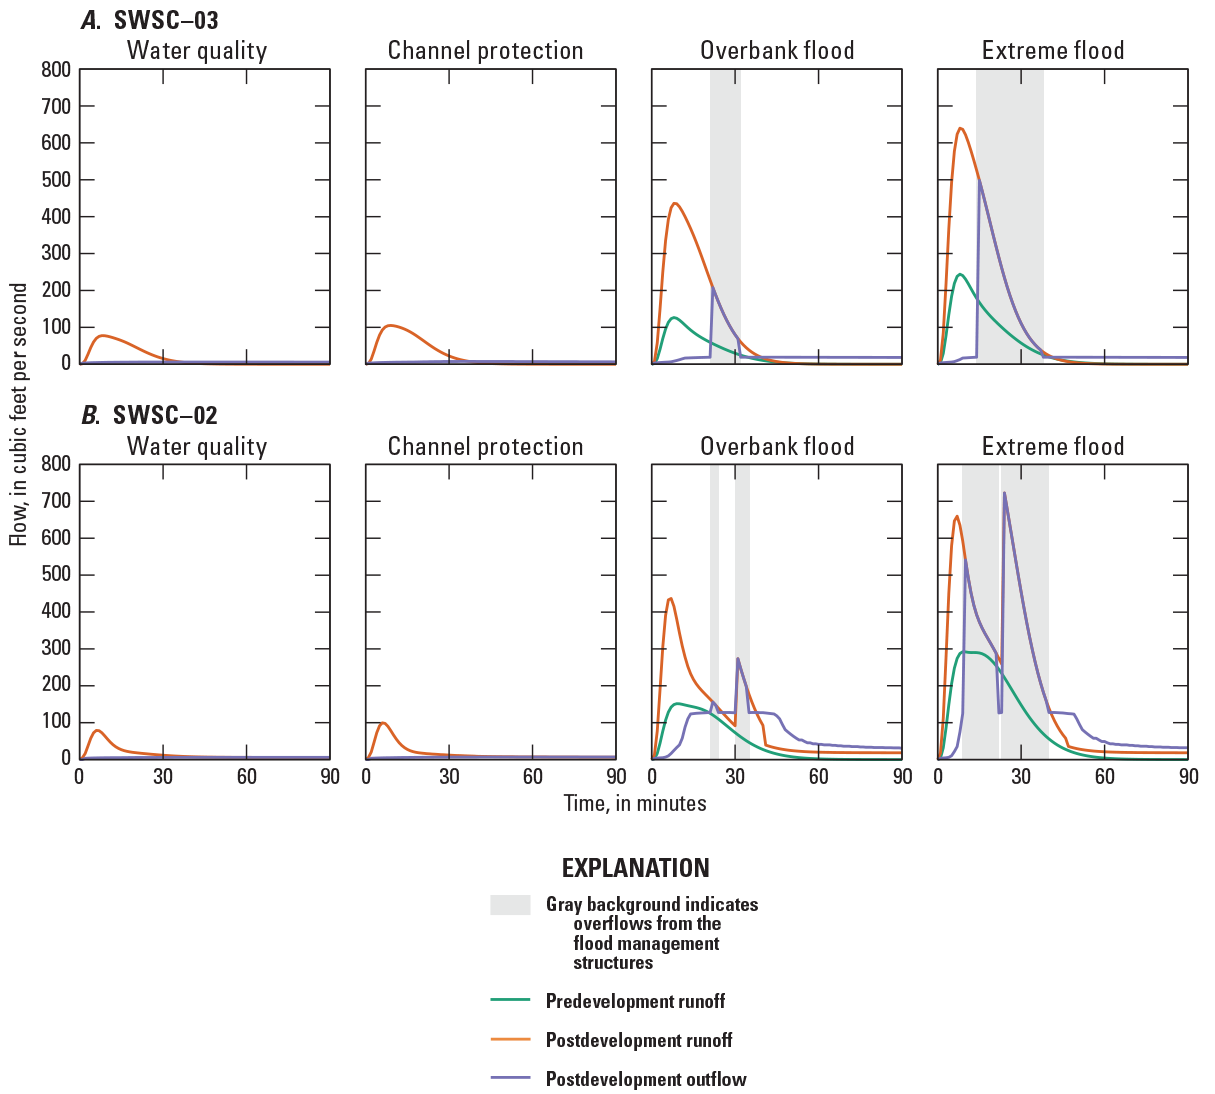
Predevelopment inflow, postdevelopment inflow, and postdevelopment outflow. A, storm water structural control 3 (SWSC–03) and B, storm water structural control 2 (SWSC–02).
Comparison of Existing Flood Management Structures to Dry Detention Basin Design Criteria
The Georgia Stormwater Management Manual describes a dry detention basin as “a surface storage basin or facility designed to provide water quality treatment and water quantity control through detention of stormwater runoff” (Atlanta Regional Commission, 2016). A dry “extended” detention basin performs all the same functions as a standard dry detention basin with the additional provision of 24-hour detention of the channel protection volume. The flood management structures (SWSC–03 and SWSC–02) do not provide 24-hour detention of the channel protection volume (table 5), so the flood management structures will be compared to the design criteria for dry detention basins (not dry “extended” detention basins). Refer to Atlanta Regional Commission (2016) for the full list of stormwater control measures. The design requirements and compliance for each existing flood management structure are summarized in table 6. Table 6 also lists design “requirements” but does not include “recommendations”; full details of the design requirements, as well as recommendations, for dry detention basins are in Atlanta Regional Commission (2016).
Table 6.
Summary of design compliance for each flood management structure.[SWSC–03, storm water structural control 3; SWSC–02, storm water structural control 2; --, noncompliance; ✓, compliance; ?, unknown compliance; NA, nonapplicable criterion]
Design-Storm Hydraulics
The following three hydraulic criteria are specified for an appropriately designed dry detention basin: (1) storage of the water-quality volume, (2) temporary storage of the overbank flood volume, and (3) control of the extreme flood volume (Atlanta Regional Commission, 2016). Neither SWSC–03 or SWSC–02 meet any of these three criteria. Per the Georgia Stormwater Management Manual, dry detention basins may provide partial water-quality treatment (Atlanta Regional Commission, 2016). Storage of the water-quality volume, while only partially applicable for dry detention basins, is listed in table 6 because the U.S. Army Garrison Fort Gordon storm water management plan aims to prevent or reduce pollutant runoff (S. Scott, U.S. Army Garrison Fort Gordon, written commun., 2019). Many other stormwater control measures are specifically designed to store and treat the water-quality volume.
Storage of the water-quality volume requires that the invert of the water-quality orifice is at the stage to store the water-quality volume. The water-quality orifices are at or near the bottom of the flood management structures (figs. 4–5); therefore, less than the required storage capacity is being provided for the water-quality design storm.
Temporary storage of the overbank flood volume requires the postdevelopment peak discharge of the overbank flood design storm to be reduced to the predevelopment rate. The peak of the postdevelopment outflow is greater than the peak of the predevelopment runoff for SWSC–03 and SWSC–02 (fig. 7). Both exceedances occur during overflows (gray background), indicating that the flood management structures are undersized and cannot fully store the overbank flood volume.
Control of the extreme flood volume requires that the dry detention basin can store the extreme flood volume within structure and must include an emergency spillway designed to convey flood volumes above the extreme flood (Atlanta Regional Commission, 2016). The existing flood management structures do not have adequate storage capacity for the extreme flood volume. Further, neither SWSC–03 nor SWSC–02 includes an emergency spillway.
Basin Geometry
Three main geometric criteria are specified for an appropriately designed dry detention basin—safe design of embankments, basin depth less than 10 feet, and grading within the basin sloped towards the outlet (for more details, see Atlanta Regional Commission [2016]). SWSC–03 and SWSC–02 meet each of these three criteria. Any retrofits or redesigns must ensure that the geometric criteria are maintained.
Inlet Features
Two inlet criteria are specified for an appropriately designed dry detention basin—stabilized inflow channels and appropriately designed pretreatment devices (Atlanta Regional Commission, 2016). SWSC–03 and SWSC–02 meet the first criterion but neither SWSC–03 nor SWSC–02 contain a pretreatment device. The most common and recommended pretreatment device is a sediment forebay, sized to 0.1-inch runoff per impervious acre of contributing drainage area (Atlanta Regional Commission, 2016). Alternative pretreatment devices include grass filter strips or grass channels.
Outlet Features
The following three outlet criteria are specified for an appropriately designed dry detention basin: (1) water-quality orifice designed to prevent clogging, (2) seepage control on outlet pipes, and (3) erosion control on outlet pipes (for more details, see Atlanta Regional Commission [2016]). None of the outlet structures for SWSC–03 or SWSC–02 contain devices to prevent clogging of the water-quality orifice, such as an external trash rack or similar device. The presence of seepage control measures on outlet pipes is unknown. Outlet pipe erosion controls are applicable only for SWSC–02 (because SWSC–03 discharge reenters the pipe network and is conveyed to SWSC-02) and may include riprap, plunge pools or pads, or other energy dissipators placed at the outlet pipe discharge point. The presence of outlet pipe erosion controls for SWSC–02 is unknown.
Potential Retrofits to Existing Flood Management Structures
Potential retrofit alternatives are provided only for planning purposes. Specific retrofits and designs that may be required by the U.S. Army Garrison Fort Gordon will need to be fully evaluated by a licensed engineer. This section presents three retrofit alternatives for potential consideration as part of U.S. Army Garrison Fort Gordon’s overall plans to evaluate and determine appropriate actions that may be needed to update or enhance the existing flood management structures. Potential advantages and disadvantages are provided for each alternative.
Modify Existing Flood Management Structures to Meet Dry Detention Basin Design Criteria
The existing flood management structures can be modified to meet the dry detention basin criteria in Atlanta Regional Commission (2016) (table 6). Design changes may include, but are not limited to, the following: (1) increasing the storage capacity of each flood management structure, (2) redesigning both outlet structures, and (3) adding pretreatment devices and emergency spillways. The flood management structures could be designed to store and release the extreme flood volume (and the volumes from smaller design storms). Depending on existing spatial constraints, the flood management structures might need to be deepened to account for additional storage requirements. The outlet structures could be redesigned in accordance with the water-quality orifice requirements, whereas outlet structures and pipes could be redesigned to allow controlled passage of the overbank flood and extreme flood design storms. Furthermore, pretreatment devices could be installed at all inlet features for each flood management structure, and emergency spillways could be designed to safely convey storm volumes that exceed the extreme flood.
One potential advantage of modifying the existing flood management structures to meet the dry detention basin design criteria is that it may be an efficient option to meet regulatory requirements considering that the existing flood management structures are most closely aligned with the Georgia Stormwater Management Manual definition of a dry detention basin. However, dry detention basins may not provide runoff reduction and may only provide partial water-quality treatment (Atlanta Regional Commission, 2016).
Convert Existing Flood Management Structures to Alternative Stormwater Control Measures
Rather than modifying the existing flood management structures to meet the dry detention basin criteria, SWSC–03 and SWSC–02 could be converted into different stormwater control measures, such as “extended” dry detention basins, sand filters, stormwater ponds, or stormwater wetlands. A discussion of the advantages and disadvantages of each of the stormwater control measures was beyond the scope of this study (see Atlanta Regional Commission [2016]). Each of these stormwater control measures also have specific maintenance requirements intended to ensure proper hydraulic performance and water-quality treatment throughout time.
One advantage of this retrofit alternative is that further water-quality treatment may be provided as compared to standard dry detention basins. However, “extended” dry detention basins, sand filters, stormwater ponds, or stormwater wetlands will not reduce inflow runoff volumes. Other potential disadvantages of this retrofit alternative include, but are not limited to, design complexity and maintenance considerations.
Install Stormwater Control Measures Upstream of Existing Flood Management Structures
Instead of increasing the storage capacities of the existing flood management structures, the design-storm inflow volumes could be reduced by using upstream stormwater control measures. The use of stormwater control measures in series is called a “treatment train” (Atlanta Regional Commission, 2016). Some stormwater control measures are specifically designed to reduce runoff volumes—bioretention basins, bioslopes, downspout disconnects, dry wells, enhanced dry swales, green roofs, infiltration trenches, permeable paver systems, pervious concrete, porous asphalt, rainwater harvesting, stormwater planters/tree boxes, and vegetated filter strips (Atlanta Regional Commission, 2016). A discussion of the advantages and disadvantages of each of these stormwater control measures was beyond the scope of this study, but these issues are documented in the literature (including, but not limited to, Leisenring and others, 2013; Taylor and others, 2014; and Granato and others, 2021). Generally, most stormwater control measures that are designed to reduce runoff volumes can be designed to fit within existing site constraints, but the cost and complexity of such designs will vary by selected stormwater control measure and site. Each of these stormwater control measures also have specific maintenance requirements intended to ensure proper hydraulic performance and water-quality treatment throughout time.
An advantage of this alternative is the potential for runoff reduction and water-quality treatment, none of which are fully realized when a dry detention basin is the only stormwater control measure installed at a site. Reducing runoff volumes from the upstream catchment areas may reduce, or potentially eliminate, the need to increase the storage capacities of the existing flood management structures to meet all required design criteria. Finally, volume control in the upstream drainage areas may reduce the risk that the dry ponds could fail from overtopping and threaten life or property downstream of the flood management structures. Potential disadvantages of this retrofit alternative include, but are not limited to, design complexity and maintenance considerations.
Summary
Two existing flood management structures, storm water control structure 3 (SWSC–03) and storm water control structure 2 (SWSC–02), in U.S. Army Garrison Fort Gordon, Georgia, were evaluated for potential retrofitting to address water-quality impacts, pursuant of U.S. Army Garrison Fort Gordon’s storm water management program. The evaluations were completed remotely using existing geospatial datasets to accommodate coronavirus disease 2019 (COVID–19) safety protocols. Drainage areas were delineated for each existing flood management structure to calculate runoff volumes, peak discharges, and inflow hydrographs from four design storms—the water-quality (1.2 inches), channel protection (1-year, 24-hour storm), overbank flood (25-year, 24-hour storm), and extreme flood (100-year, 24-hour storm) design storms. Stage-storage and stage-discharge curves were developed for each existing flood management structure and the inflow hydrographs of the four design storms were routed through the municipal separate storm sewer system (MS4) network to estimate outflow hydrographs.
The results of these analyses were compared to the regulatory requirements for dry detention basins. Neither SWSC–03 nor SWSC–02 met the requirement for a dry detention basin, and planning-level analyses for these basins indicated that the existing structures do not have adequate storage capacity for the overbank flood design-storm runoff volume (25-year, 24-hour storm) or the extreme flood design-storm runoff volume (100-year, 24-hour storm). Also, neither SWSC–03 nor SWSC–02 has the emergency spillway needed to properly handle an overflow event. Furthermore, land use changes (forest removal) and the risk for additional sediment loads to these structures may reduce available storage volume, increasing the risk for design failure.
Three potential retrofit alternatives were examined to provide preliminary information for planning purposes only and include: (1) modify the existing flood management structures to comply with the design requirements for a dry detention basin, (2) convert the existing flood management structures to alternative stormwater control measures, and (3) install stormwater control measures upstream of the existing flood management structures. Potential advantages and disadvantages of each retrofit alternative were briefly discussed.
References Cited
Atlanta Regional Commission, 2016, 2016 edition of the Georgia Stormwater Management Manual volumes 1 and 2: accessed January 26, 2021, at https://atlantaregional.org/natural-r.esources/water/georgia-stormwater-management-manual/.
Boggs, J., Sun, G., and McNulty, S., 2016, Effects of timber harvest on water quantity and quality in small watersheds in the Piedmont of North Carolina: Journal of Forestry, v. 114, no. 1, p. 27–40. [Also available at https://doi.org/10.5849/jof.14-102.]
Evenson, E.J., Orndorff, R.C., Blome, C.D., Böhlke, J.K., Hershberger, P.K., Langenheim, V.E., McCabe, G.J., Morlock, S.E., Reeves, H.W., Verdin, J.P., Weyers, H.W., and Wood, T.M., 2013, U.S. Geological Survey water science strategy—Observing, understanding, predicting, and delivering water science to the Nation: U.S. Geological Survey Circular 1383–G, 49 p. [Also available at https://doi.org/10.3133/cir1383G.]
Georgia Department of Natural Resources Environmental Protection Division, 2020, Water quality in Georgia 2018–19—Georgia 305b/303d Integrated Report)—2020 list of waters: Georgia Environmental Protection Division website, accessed January 26, 2021, at http://epd.georgia.gov/watershed-protection-branch/watershed-planning-and-monitoring-program/water-quality-georgia#toc-georgia-305-b-303-d-integrated-report.
Granato, G.E., Spaetzel, A.B., and Medalie, L., 2021, Statistical methods for simulating structural stormwater runoff best management practices (BMPs) with the stochastic empirical dilution and loading model (SELDM): U.S. Geological Survey Scientific Investigations Report 2020–5136, 41 p. [Also available at https://doi.org/10.3133/sir20205136.]
Leisenring, M., Hobson, P., Clary, J., and Krall, J., 2013, International stormwater best management practices (BMP) database advanced analysis—Influence of design parameters on achievable effluent concentrations: Geosyntec Consultants, Inc. and Wright Water Engineers, Inc., accessed January 26, 2021, at https://bmpdatabase.org/performance-summary-reports.
McBroom, M.W., Beasley, R.S., Chang, M., and Ice, G.G., 2008, Storm runoff and sediment losses from forest clearcutting and stand re-establishment with best management practices in East Texas, USA: Hydrological Processes, v. 22, no. 10, p. 1509–1522. [Also available at https://doi.org/10.1002/hyp.6703.]
National Weather Service, 2017, Precipitation Frequency Data Server: National Oceanic and Atmospheric Administration, accessed January 26, 2021, at https://hdsc.nws.noaa.gov/hdsc/pfds/.
Natural Resources Conservation Service, 2021, Web Soil Survey: U.S. Department of Agriculture, accessed January 26, 2021, at https://websoilsurvey.sc.egov.usda.gov/.
Office for Coastal Management, 2021, 2011 Georgia Lidar DEM—Burke Richmond Lincoln Columbia Counties from 2010–06–15 to 2010–08–15: National Oceanic and Atmospheric Administration National Centers for Environmental Information, accessed January 26, 2021, at https://www.fisheries.noaa.gov/inport/item/48375.
Shepard, J.P., 1994, Effects of forest management on surface water quality in wetland forests: Wetlands, v. 14, no. 1, p. 18–26. [Also available at https://doi.org/10.1007/BF03160618.]
Taylor, S., Barrett, M., Leisenring, M., Sahu, S., Pankani, D., Poresky, A., Questad, A., Strecker, E., Weinstein, N., and Venner, M., 2014, Long-term performance and life-cycle costs of stormwater best management practices: Transportation Research Board National Cooperative Highway Research Program Report, v. 792, 148 p. [Also available at https://doi.org/10.17226/22275.]
U.S. Army Garrison Fort Gordon, 2020, Visitor and access Information: accessed January 26, 2021, at https://home.army.mil/gordon/index.php/about/visitor-information.
U.S. Department of Agriculture, 2017, 2017 National resources inventory: accessed January 26, 2021, at https://www.nrcs.usda.gov/Internet/NRCS_RCA/reports/nri_eros_ga.html.
Conversion Factors
U.S. customary units to International System of Units
Datum
Vertical coordinate information is referenced to the North American Vertical Datum of 1988 (NAVD 88).
Horizontal coordinate information is referenced to the North American Datum of 1983 (NAD 83).
Elevation, as used in this report, refers to distance above the vertical datum.
Abbreviations
BMP
best management practice
COVID–19
coronavirus disease 2019
CN
curve number
DEM
digital elevation model
lidar
light detection and ranging
MS4
municipal separate storm sewer system
NRCS
Natural Resources Conservation Service
SWSC–02
Storm water structural control 2
SWSC–03
Storm water structural control 3
TR–55
Technical Release 55
USGS
U.S. Geological Survey
For more information about this publication, contact
Director, South Atlantic Water Science Center
U.S. Geological Survey
1770 Corporate Drive
Suite 500
Norcross, GA 30093
Find additional information at
https://www.usgs.gov/water/southatlantic
Publishing support provided by
Reston and Rolla Publishing Science Center
Suggested Citation
Stillwell, C.C., 2021, Evaluation of two existing flood management structures in U.S. Army Garrison Fort Gordon, Georgia, 2020: U.S. Geological Survey Open-File Report 2021–1121, 16 p., https://doi.org/10.3133/ofr20211121.
ISSN: 2331-1258 (online)
Study Area
| Publication type | Report |
|---|---|
| Publication Subtype | USGS Numbered Series |
| Title | Evaluation of two existing flood management structures in U.S. Army Garrison Fort Gordon, Georgia, 2020 |
| Series title | Open-File Report |
| Series number | 2021-1121 |
| DOI | 10.3133/ofr20211121 |
| Year Published | 2021 |
| Language | English |
| Publisher | U.S. Geological Survey |
| Publisher location | Reston, VA |
| Contributing office(s) | South Atlantic Water Science Center |
| Description | v, 16 p. |
| Country | United States |
| State | Georgia |
| Other Geospatial | Fort Gordon |
| Online Only (Y/N) | Y |
| Additional Online Files (Y/N) | N |
| Google Analytic Metrics | Metrics page |