

Characterization of the Bathymetry, Hydrodynamics, Water Quality, Infrastructure, and Channel Condition of the Old Erie Canal from DeWitt to its Junction with the Current Erie Canal in Verona, near Rome, New York, 2018–19
Links
- Document: Report (94.4 MB pdf) , HTML , XML
- Data Release: USGS data release - Geospatial dataset of the characterization of the bathymetry, hydrodynamics, water quality, infrastructure, and channel condition of the Old Erie Canal from DeWitt to Rome, New York 2018–2019
- Download citation as: RIS | Dublin Core
Acknowledgments
The author would like to thank Scott Ingmire, Director of Madison County Department of Planning and Workforce Development who helped organize the survey; Brent MacPherson of the New York State Parks helped provide access to stretches of the canal towpath for the survey; Meaghan Keefe, a former contractor of the U.S. Geological Survey, whose expert boat handling allowed access to hard-to-reach sections of the canal; and Jason Finkelstein, Benjamin Fisher, and Elizabeth Nystrom, U.S. Geological Survey, for their ArcGIS expertise: without their support, producing this report would not have been possible.
Abstract
The Old Erie Canal has undergone sedimentation and aquatic growth that have restricted flow and diminished the aesthetic quality of the canal during the nearly 200 years since its construction. During 2018–2019, the U.S. Geological Survey (USGS) in cooperation with the Madison County Planning Department and the New York State Canal Corporation conducted a study of the Old Erie Canal between the Town of DeWitt, New York, and its junction with the current Erie Canal of the New York State Canal System near Rome, N.Y. The study comprised bathymetric, velocity, and water-quality surveys and documentation of the canal infrastructure. The USGS established benchmarks and staff gages along the 30.8 miles of the canal study area to reference the water-surface level in the canal to the North American Vertical Datum of 1988 (NAVD 88). Bathymetric survey results indicated that during the time of the survey, the canal depths ranged from 1.26 feet (ft) to 7.33 ft between the Butternut and Durhamville aqueducts (with a mean depth of 3.52 ft). Shallow depths are located throughout the canal, but the section north of the Durhamville aqueduct was the shallowest, with depths ranging from 0.68 ft to 2.44 ft (and a mean depth of 1.36 ft). The reach-averaged water velocity was 0.28 feet per second. The system generally flows west to east from the Butternut aqueduct to the entrance to the Erie Canal.
Water-quality data (dissolved oxygen, water temperature, specific conductance, pH, and turbidity) were collected concurrently with the bathymetric survey (spring 2018) to characterize changes in water quality along the length of the canal. Specific-conductance values measured upstream from the hamlet of Kirkville, Manlius, N.Y. may reflect road salts being flushed into the canal through the Butternut and Limestone feeder system (designed to divert water from nearby creeks to supply water for the Old Erie Canal) from recent stormwater runoff. Increases in pH in the downstream direction are possibly caused by increasing amounts of aquatic vegetation. During the time of the survey, turbidity was highest near inflows from the canal feeder system and tributary inputs which were elevated by stormwater runoff that transported sediment into the canal.
The canal infrastructure was documented to provide a baseline assessment. The feeder system, designed to bring water into the canal, does not deliver flow when the creeks supplying water to those feeders are at base flow, but does bring water into the system when flows in the feeder creeks are elevated. A recent report provides an example of repair work completed on the Chittenango feeder to improve flow through the feeder into the canal (Welch and Madison County Planning Department, 1996). Two non-regulated tributaries, Meadow Brook and Pools Brook, consistently delivered flow to the canal. Outfalls where canal water discharges into nearby creeks were sealed in the Butternut and Limestone aqueducts. Outfalls in the Chittenango, Cowaselon, and Durhamville aqueducts were found with flashboards installed at an elevation that allows water to be discharged from the canal. These structures are designed to accept additional flashboards to raise the canal water surface with the potential to convey flow farther down the system. The general condition of the channel was open and navigable between Butternut aqueduct and Chittenago aqueduct. On the segment of the canal east of the Chittenango aqueduct, an increasing number of downed trees and tangled wads of vegetation affected flow and made navigation by boat difficult to the Durhamville aqueduct. North of the Durhamville aqueduct, numerous downed trees and an increased density of aquatic vegetation limited navigation by boat and reduced the flow rate.
Introduction
The objective of this study was to document the current hydrology and hydraulics of a 30.8-mile-long section of the Old Erie Canal to meet the needs of the Madison County Planning Department and the New York State Canal Corporation, and to provide data to water-resource managers and land-use planners to improve the water quality and aesthetics of the canal. This objective was implemented by the U.S. Geological Survey (USGS), which is committed to providing reliable scientific information to describe hydrologic systems and changes in hydrologic and geomorphic conditions over time. This project supports the USGS water mission area goal of contributing to the economic development of the Nation’s water resources for the benefit of present and future generations (Evenson and others, 2013).
Purpose and Scope
In 2018, the USGS, in cooperation with the Madison County Planning Department and New York State Canal Corporation, conducted a study of the Old Erie Canal between the Town of DeWitt, New York and its junction with the current Erie Canal of the New York State Canal System in Verona, N.Y, near Rome, N.Y. This study comprised bathymetric, velocity, and water-quality surveys, and documentation of the canal infrastructure. This study can be used to inform managers of the current state of the canal and provide necessary data for future studies, including the design of a hydraulic model of the canal.
The purpose of this report is to describe the bathymetry, hydraulics, water quality, and channel condition of the Old Erie Canal from DeWitt to Verona during base-flow conditions by using data collected during a five-day survey in April 2018 and collected during additional infrastructure inspections made during November 2019.
This report describes the following:
-
the establishment of a vertical datum and installation of staff gages to serve as elevation reference points for the bathymetric survey and future water-flow studies;
-
the collection of depth and stream-velocity data by an acoustic Doppler current profiler (ADCP), the processing of depth data, an accuracy assessment of the surveyed depths, creation of a bathymetric surface, and mapped flow velocities;
-
the measurement of water-quality parameters (dissolved oxygen, water temperature, specific conductance, pH, and turbidity), the processing of water-quality data; and
-
the documentation of the presence and general condition of canal infrastructure, including all in-flow and out-flow structures, which were designed to regulate the elevation of the water surface.
Study Area
Thirty-six miles of the Old Erie Canal pass through several communities in three New York Counties (Onondaga, Madison, and Oneida; fig. 1). When the canal opened in 1825, it was considered an engineering marvel that allowed a dramatic increase in trade between the interior of the country and Atlantic ports and thus increased prosperity in communities along the canal route. The Old Erie Canal had an original depth of 4 feet (ft), a width of 40 ft, and could accommodate vessels carrying 30 tons of freight. It was enlarged in the mid-19th century to a depth of 7 ft to accommodate vessels with 240 tons of freight and was replaced by the New York State Barge Canal in 1918 (Finch, 1925). The New York State Barge Canal was later renamed the New York State Canal System.
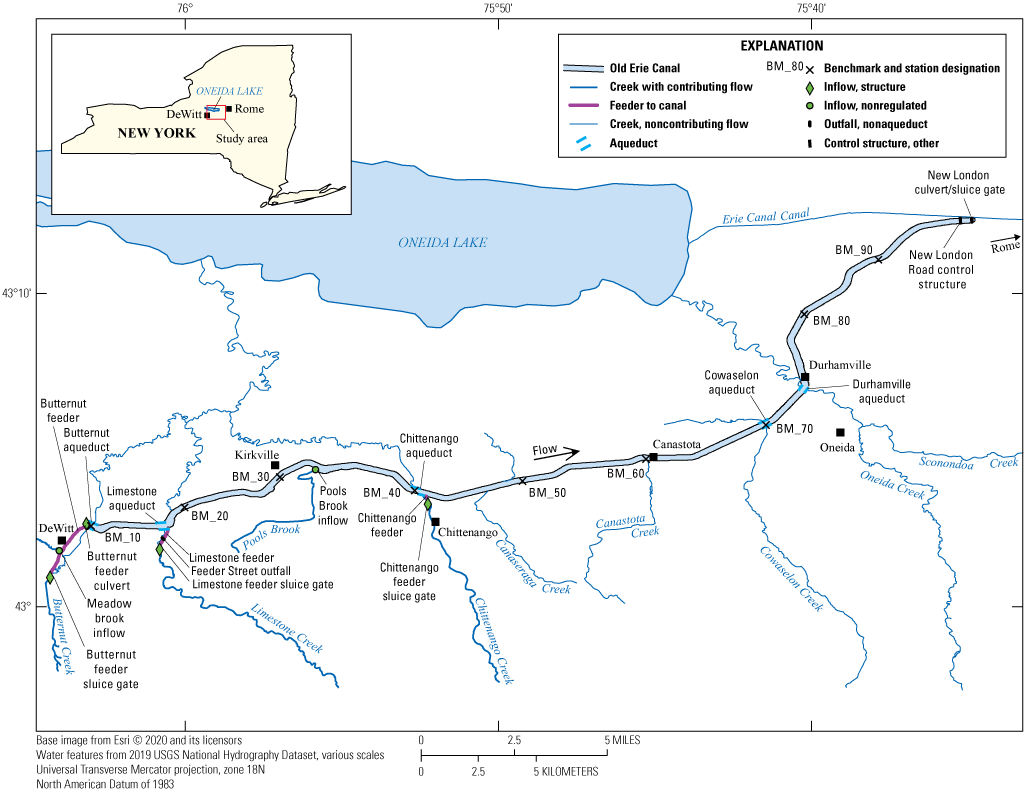
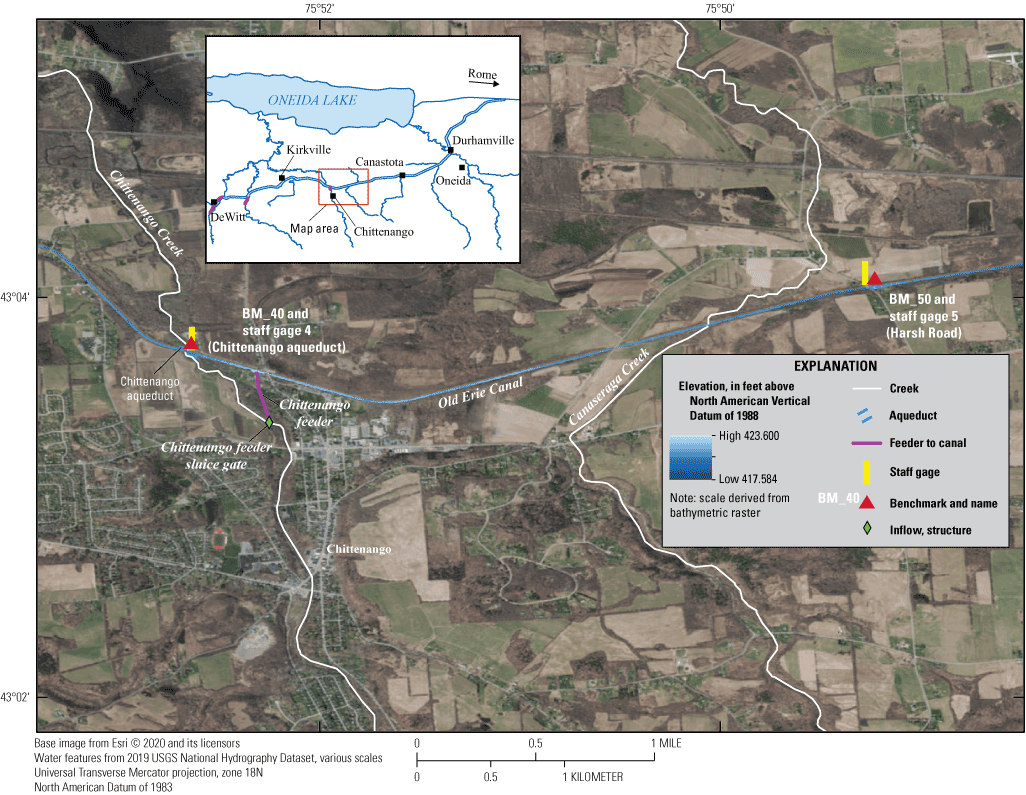
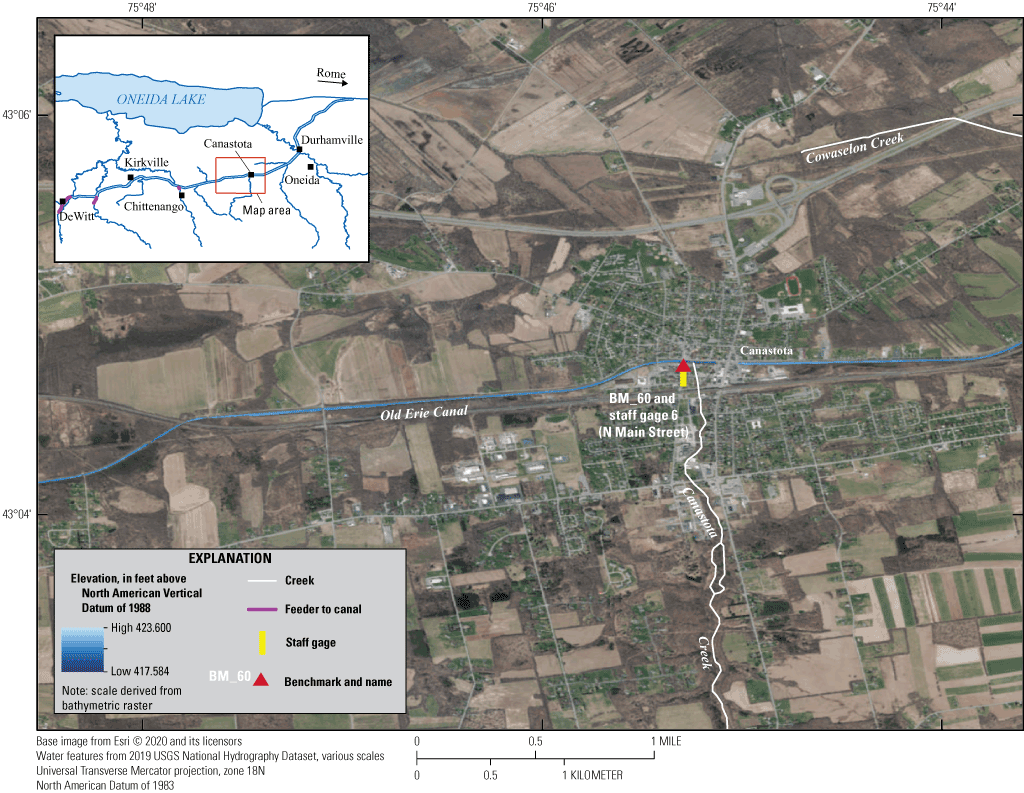
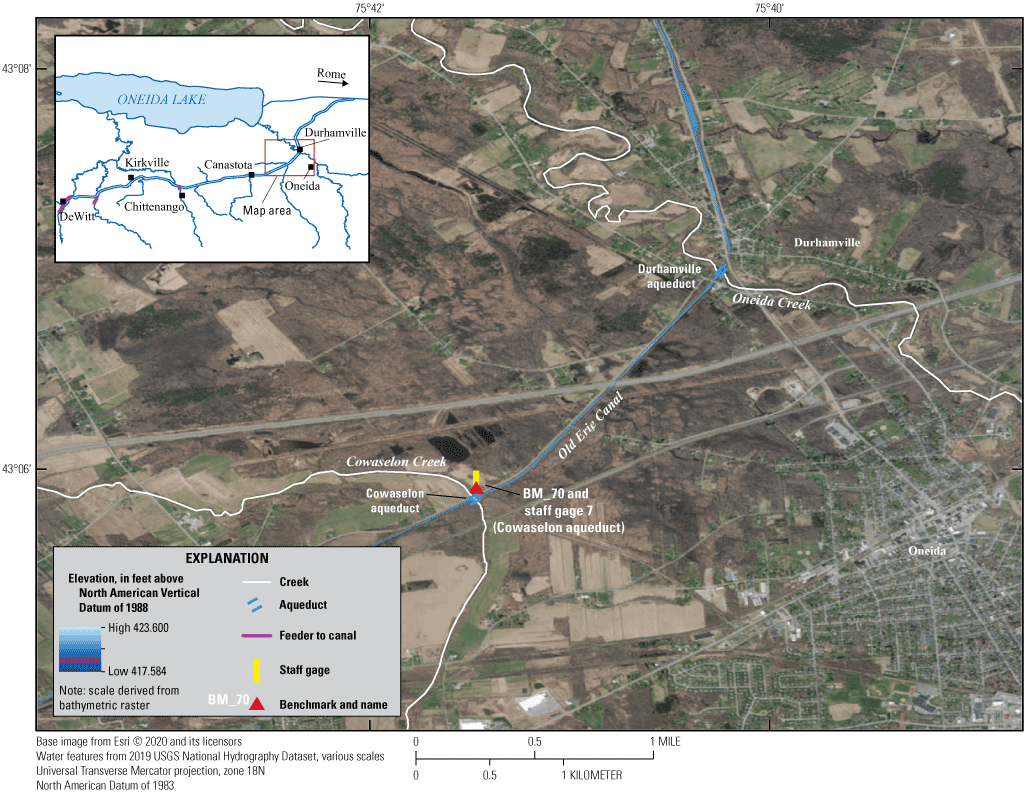
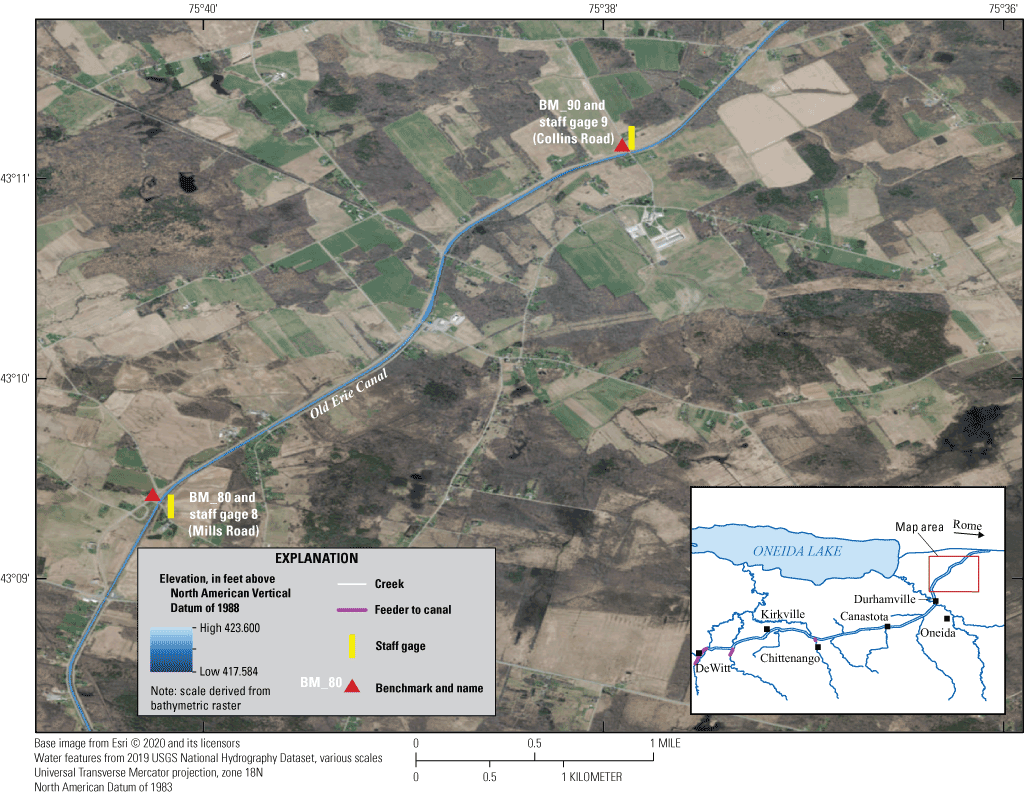
Map of Old Erie Canal and tributaries, including benchmark locations and documented infrastructure.
During the past century, hydraulic structures controlling water flow into and out of the Old Erie Canal have not been routinely maintained and thus have become damaged or otherwise inoperable, and knowledge of the canal hydrology has been lost. Sedimentation and aquatic-plant growth have restricted flow and diminished the aesthetic quality of the canal. The Madison County Planning Department and New York State Canal Corporation view the Old Erie Canal as a potential source of economic revitalization for the counties and communities along it; however, revitalization cannot occur without a better understanding of the hydrology and hydraulics of the Old Erie Canal in relation to its former functions.
From the Town of DeWitt to its junction with the current New York State Canal System in Verona near Rome, the Old Erie Canal spans 30.8 miles. Along most of that length, the canal is no wider than 60 ft across. There are a few larger embayments in the upstream-most 8.1 miles, but these end near the western border of Madison County.
Methods
To accomplish the study objectives of describing the bathymetry, hydraulics, water quality, and channel condition of the Old Erie Canal, established USGS methodology was utilized. The methods used are described in the following sections.
Common Datum
The North American Vertical Datum of 1988 (NAVD 88) served as the common elevation datum for the water-surface level in the canal during the bathymetric survey and for the resultant canal-bottom elevations (Rydlund and Densmore, 2012). Benchmarks and staff gages used to measure water-surface elevation (Sauer and Turnipseed, 2010) were installed at key locations in consultation with Madison County and the New York State Canal Corporation and referenced to the vertical datum.
Benchmark Establishment and Survey
Eight brass USGS benchmarks were installed in concrete near the edge of the canal. A ninth preexisting benchmark was found at Collins Road with the station designation Z 122 and Permanent Identifier OE0948. The National Geodetic Survey datasheet for this benchmark reports it as destroyed in 1991, but it was found in good condition (National Oceanic and Atmospheric Administration, 2022). For the purpose of this report, this ninth benchmark on Collins Road will hereinafter be referred to as BM_90.
The elevation of each of the nine benchmarks was determined by using a survey-grade global navigation satellite system (GNSS) as described by Rydlund and Densmore (2012). A survey-grade dual-frequency Global Positioning System (GPS) receiver (Trimble, Inc, 2019) collected GPS data at each benchmark location for a minimum of 1 hour to meet a level-II- quality GNSS survey. These GPS data were submitted to the National Geodetic Survey Online Positioning User Service (National Oceanic and Atmospheric Administration, 2019) for postprocessing and obtaining positional coordinates and elevations. An elevation uncertainty for each of the control points was estimated from data collected at three to nine Continuously Operating Reference Stations (CORS). A least-squares adjustment that utilized all CORS data simultaneously was computed for the final coordinate dimensions (Rydlund and Densmore, 2012). Benchmark elevations, in feet, were referenced to the NAVD 88 (defined by the geoid model GEOID12B). Benchmark elevations, positional coordinates, and estimated uncertainties are listed in table 1, and descriptions of the benchmarks are in appendix 1.
Table 1.
Benchmark positions, elevation, and estimated elevation measures of uncertainty on the Old Erie Canal, New York.Staff Gages
Because of the 30.8-mile length of the study area and the slope of the canal water surface as it flows from DeWitt to its junction with the current Erie Canal, a single water-level elevation would not be representative of the entire study reach. A total of nine locations along the study reach were selected to determine water-surface elevations. At each of these nine locations, vertical control benchmarks and staff gages referenced to the benchmark elevations were installed (fig. 1; Sauer and Turnipseed, 2010). The average distance between the nine benchmark and staff locations was 3.5 miles. The numbers of, and distances between, staff-gage locations were chosen to adequately balance the needs of determining an accurate water-surface elevation for the bathymetric survey with the time and cost of installation. Locations with existing infrastructure (bridge abutments, aqueducts) were selected to allow ease of installation and relatively high visibility to aid further water-level measurements and studies. The spacing between locations was as equidistant as the current infrastructure allowed.
Staff gages were installed on bridge wingwalls and aqueduct walls within approximately 100 ft of the benchmarks. Photographs of the staff gages and benchmark locations are in appendix 2. Each staff-gage location contains two staff gages, an upper and lower, to cover the full range of expected water levels. Elevations measured according to the NAVD 88 were transferred from the established benchmarks to the staff gages with differential-level surveys by using the techniques and methods described by Kenney (2010). An offset was derived by the transfer of elevations from the benchmark to the staff gage. This offset, which is unique to each staff gage, was added to convert the water level as read directly from the staff gage to an elevation referenced to the common datum (NAVD 88; table 2).
Table 2.
Staff-gage elevations and offsets for each Old Erie Canal benchmark, in New York.Water-Surface Elevation for the Bathymetric Survey
To determine the water-surface elevation during the bathymetric survey, the canal was divided into nine sections according to the distances between each pair of staff gages. The water-surface elevations used for the bathymetric survey reference the water-level readings from the nearest staff gage. For the purposes of this report, the water-level surface for each staff gage section was assumed to be flat.
Bathymetric-Data Collection Techniques and Approach
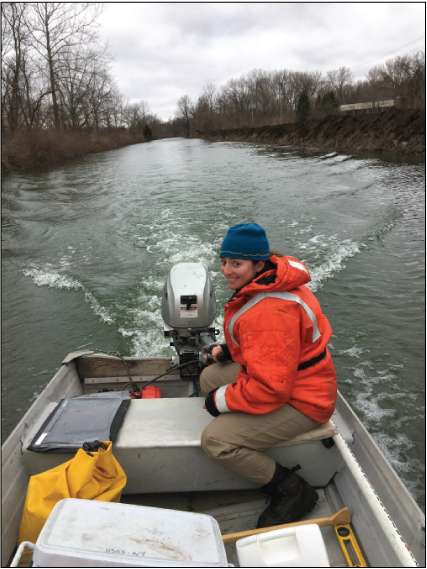
The bathymetric (and water-quality) survey was conducted from April 16 to April 20, 2018, using methods described by Wilson and Richards (2006). The survey was completed in early spring, when aquatic vegetation causes a minimal amount of interference with the ADCP depth measurement. Because of the long length of the canal and the minimal perceived benefit of a zig-zag transect in a narrow canal with a flat bottom, relative to a natural stream bed, the survey transect was run longitudinally down the centerline of the channel to measure water depth.
Bathymetric data were collected with an ADCP in the reaches of the canal navigable by boat. A SonTek RiverSurveyor M9 (SonTek, 2015b) ADCP was mounted to the side of a small boat propelled by an outboard motor. Depths were primarily measured by using the 0.5-megahertz (MHz) integral vertical-beam echo sounder of the ADCP. In the shallowest areas of the surveyed reach, data were collected by using the dual-frequency four-beam velocity-measurement transducers of the ADCP, with four beams at 3.0 MHz and four beams at 1.0 MHz, and with both in Janus configuration (SonTek, 2015b), and oriented at a 25-degree slant angle. The vertical-beam echo sounder on the ADCP measures water depth by measuring the time interval required for ultrasonic waves to travel, at a known velocity, from a known point (the transducer face) to a reflecting surface (canal bottom) and then back to the known point (Wilson and Richards, 2006). The dual-frequency four-beam transducers measure water depth by the same means, correcting for their slant angle. The transducers operate at either 1.0 MHz or 3.0 MHz and collect four depth measurements (one per beam). The reported depth value is the average of the four measured depths. A minimum-depth limitation applies if the reflecting surface is too close to the echo-sounder face. The minimum-depth limitation calculated by using the vertical-beam echo sounder was about 1.72 ft. With the dual four-beam transducers, however, it was possible to decrease the minimum-depth limitation to 1.26 ft. The decrease in the minimum measurable depth allowed the survey to be extended to shallower areas. Survey points were georeferenced by using the satellite-based augmentation system (SBAS) GPS receiver that is a component of the ADCP.
The velocity of sound in water is dependent on salinity, temperature, and depth. The low salinity values and shallow depths in freshwater bodies are not major factors that affect the sound velocity (U.S. Army Corps of Engineers, 2013). Nonetheless, salinity was measured at the surface: its measured value was low, with a maximum of 1.1 parts per thousand. An ADCP has built-in temperature sensors that measure water temperature at the transducer face and correct for the effects of temperature on sound velocity on the basis of an accurate measurement of depth. To confirm the accuracy of the sound-velocity calculation of the ADCP, surface-water temperature was measured independently by a thermistor and compared to the ADCP measurement at the beginning and end of the four survey days. Throughout the survey, the ADCP temperature sensor differed by no more than 0.7 degrees Fahrenheit (°F; 0.4 degrees Celsius, [°C]) from the independently measured surface-water temperatures, and a mean absolute difference of 0.4 °F (0.2 °C). Because of the shallow depth of the canal, no significant variation in sound velocity with depth as a function of change in temperature was assumed.
For quality assurance, a second set of transects was created to provide an independent dataset with which the vertical accuracies of the ADCP data could be assessed. These transects were oriented 90 degrees from the longitudinal transects, were spaced 0.19 miles apart from each other, and provided a cross-sectional view of the canal geometry. The quality-assurance transects were included with all other depth measurements to increase the data density for the calculation of the bathymetric surface.
In the reaches of the canal north of the Durhamville aqueduct, where dense aquatic vegetation interfered with the echo-sounder transmission, and numerous downed trees limited access by boat, depths were manually measured (by a surveyor who waded into the canal) approximately every 0.19 mile along the centerline of the canal with a fiberglass stadia rod incremented by tenths of a foot. A 6-inch steel circular pad affixed to the bottom of the rod minimized settling of the rod below the top of the soft bottom.
Horizontal and Vertical Control for Bathymetric Data
Horizontal-survey positions for the ADCP were determined by using a SBAS GPS receiver positioned directly above the ADCP. This unit provided a manufacturer-stated horizontal-survey accuracy of less than 1.0 meter (SonTek, 2015b).
Latency is the time difference (lag) between when positioning data are received and when the computed or processed position is recorded. Latency typically results in a negative along-track spatial displacement of depth measurements. This displacement was minimized by surveying at slow speeds and synchronizing the echo-sounder and GPS clocks. Boat speed was minimized and averaged 3.02 feet per second (ft/s) throughout the survey. The RiverSurveyor M9 ADCP minimizes latency by using the integrated GPS antenna located above the ADCP to directly connect the incoming GPS data stream to the ADCP. Unlike other echo-sounder systems, the RiverSurveyor M9 ADCP performs internal calculations with the GPS data, synchronized by the system with a 10-hertz update rate, before the data are stored in the computer (SonTek, 2015a). Latency was not quantified, but it was considered small enough, given the slow survey speed, the integrated GPS, and the generally flat bottom of the canal, that any potential errors in the data were negligible for the purposes of this survey.
Vertical control points for the survey were provided by the nine staff gages installed along the length of the canal. Water-level readings were taken at least once from the nearest staff gage during the bathymetric survey and converted to NAVD 88 elevations by using the offset described in the section “Staff Gages.” In three instances, water-surface elevations at a staff gage changed over the course of the survey. In two of those instances, the change between the first and second staff-gage readings were −0.01 ft (Manlius Center Road staff gage) and −0.02 ft (Main Street, Canastota staff gage) for the time periods between staff readings (63 and 217 minutes, respectively). These changes were small, and the average of the two readings was taken to determine the water-surface elevation. In one instance (April 16 at the Butternut aqueduct staff gage) after a significant rainfall, the water level rose 0.240 ft during the 291 minutes between staff-gage readings. To account for the rising water-surface conditions, the change in water-surface elevation was prorated linearly for every hour during the time of the survey. Linear proration of the increasing water-surface elevation over this time period was supported by four nearby USGS streamgages (U.S. Geological Survey, 2020a–d), which have water-level records showing nearly linear increases in gage height over the same time period: Onondaga Creek at Dorwin Avenue, Syracuse, N.Y. (station number 04239000; U.S. Geological Survey, 2020d), Chittenango Creek near Chittenango, N.Y. (station number 04244000; U.S. Geological Survey, 2020a), Cowaselon Creek at State Route 13 at Canastota, N.Y. (04243783; U.S. Geological Survey, 2020b), and Oneida Creek at Oneida, N.Y. (station number 04243500; U.S. Geological Survey, 2020c). During postprocessing of the data, water depths (adjusted for the transducer depth) were subtracted from the NAVD 88 water-surface elevations to obtain channel-bottom elevations. Water-surface elevations (NAVD 88) at the time of physical staff-gage readings, start and stop times for operation of the survey vessel within a designated staff-gage section, and the assigned water-surface elevations used to create the bathymetric dataset are listed in tables 3 and 4. Assigned water-surface-elevation values for each depth-point measurement are available in a USGS data release (Wernly and Welk, 2022).
Table 3.
Water-surface elevations at time of staff gage reading, survey times, and water-surface elevations for Butternut aqueduct staff gage to Harsh Road staff gage in the Old Erie Canal, New York.[Time is in Eastern Standard Time. Staff gage readings were used to convert acoustic Doppler current profiler (ADCP) depth in feet, to bottom elevation, in feet, North American Vertical Datum of 1988 (NAVD 88); —, no value]
Table 4.
Water-surface elevations at time of staff gage reading, survey times, and water-surface elevations for Main Street, Canastota staff gage to Collins Road staff gage in the Old Erie Canal, New York.[Time is in Eastern Standard Time. Staff gage readings were used to convert acoustic Doppler current profiler (ADCP) depth in feet, to bottom elevation, in feet, North American Vertical Datum of 1988 (NAVD 88); —, no value]
Horizontal- and Vertical-Control Accuracy and Quality Assurance
According to the manufacturer (SonTek, 2015b), the horizontal positional accuracy of the SBAS GPS receiver positioned directly above the ADCP is less than 1.00 meter (3.28 ft); however, horizontal accuracy is affected by the multipath environment (that is, proximity to trees, buildings, cliffs, and so on), the number of satellites in view, satellite geometry, and ionospheric activity (SonTek, 2015b). No independent testing was conducted to confirm the stated horizontal accuracy of the survey, but for the purposes of this study, the exact location of a given surveyed point in space was deemed to be less important than the relative locations among the surveyed points and the distances between adjacent points.
The vertical-beam and the dual four-beam transducers used in this study have a resolution of 1 millimeter (0.003 ft) and an accuracy of one percent of the measured depth, according to the manufacturer specifications (SonTek, 2015b). The vertical beam was the primary source of measured depth for this survey. The accuracy of the average depth measured by the four-beam transducers can decrease simply because the transducer beams are at a 25-degree slanted angle. In all but perfectly flat environments, each of the four beams will measure and record slightly different depths with the average of the four depths being the only reported value. As the depth of water increases, the areal footprint being measured by the four beams increases, which can potentially lead to greater differences in measured depths among the four individual beams. Additionally, as the depth of water increases, the horizontal distance from where the GPS receiver is mounted (directly over the ADCP) to where the depth is measured increases because of the slant angle of the four beams. For these reasons, the four-beam depths were generally used only where depths were shallower than the minimum depth limitation of the vertical beam (1.72 ft). In these situations, the combined areal footprint of the four-beam transducers and the potential errors in depths were smallest. Four-beam transducer depths consisted of only 714 survey points or about 1.7 percent of the total of 41,657 points measured.
Four-beam depth measurements provided data for the shallowest parts of the study area that otherwise would not have been mapped. These data more accurately defined the sedimentation within the canal in the areas downstream from the Butternut aqueduct, near the Limestone feeder, the Pools Brook inflow, and the Chittenango feeder; these depth measurements would not have been possible with only the vertical beam of the ADCP.
An assessment of the vertical accuracy of the measured depths and resultant canal-bottom elevations was possible by comparing results for coincident points measured in both the primary set of transects (longitudinal down the center of the canal) and in the quality-assurance survey (perpendicular to the center line of the canal and spaced every 1,000 ft). One hundred forty-three paired intersection points were used for comparison. The horizontal distances between the paired points averaged 0.95 ft and ranged from 0.00 to 1.64 ft. The differences in depths ranged from −0.54 ft to 0.39 ft; however, all except 21 paired points had depth differences equal to or less than 0.20 ft, and both the mean and median differences were a minimal −0.03 ft. The vertical root mean square error (RMSE) and the vertical accuracy of the elevations at the 95-percent confidence level were computed by using the following equations (Wilson and Richards, 2006):
where and where The RMSE of the ADCP-collected elevation data was 0.14 ft, and the vertical accuracy was 0.27 ft at the 95-percent confidence level.Postprocessing of Bathymetric Data
Raw transect data were reviewed in RiverSurveyor Live, the software associated with the RiverSurveyor M9 ADCP (SonTek, 2015a), for erroneous measurements caused by reflections from fish, aquatic vegetation, or other submerged objects. In addition, those data that did not meet the required GPS quality (for example, loss of the GPS signal near bridges or aqueducts) were also identified. Of a total of 42,937 data points, 1,280 erroneous data points (about 3.0 percent of the total) were removed. Most of these erroneous points were removed because of interference from aquatic vegetation, but a small number were removed because they did not meet GPS quality standards. The remaining bathymetric transect data (41,657 data points) were saved as edited transects. After water depths were converted to channel-bottom elevations, the resultant data were processed by using ArcGIS (version 10.7), which contains hydrographic software for data viewing and editing, data processing, generation of interpolated data, and creation of map products (Esri, 2019). These data are available in a USGS data release (Wernly and Welk, 2022).
Creation of Bathymetric Surface in ArcGIS
The bathymetric data were used to produce a 3-meter cell-size raster surface of the bottom elevation of the Old Erie Canal. Raster surfaces were created by using ArcGIS. Data were interpolated between point data collected along transects and the delineated shoreline of the canal by using the “Topo to Raster” tool (Esri, 2020) in the “3-D Analyst Toolbox.” Two separate approaches were tested to determine the most accurate and representative raster surface for the canal. Approach 1 blended below-the-water-surface bathymetric point data with surrounding above-the-water-surface light detection and ranging (lidar) elevation data. To create this seamless transition between the bathymetric and lidar data, it was necessary that the canal shoreline was assigned with elevation values. Within approach 1, two methods were tested to assign the canal shoreline elevations. The first method used lidar elevation data from where the canal banks meets the edge of water. These lidar elevations, however, were found to overestimate the shoreline elevation because of the very steep bank of the canal. Therefore, a second method was used within approach 1 to assign shoreline elevations. Rather than assigning the shoreline elevations using the lidar data, elevations for approach 1 were assigned every 10 feet along the delineated shoreline on the basis of measured elevations of the water surface, which were determined using staff gages during the survey. This was the method used to assign canal shoreline elevations in approach 1. An alternate approach, approach 2, interpolated the bathymetric point data but without assigned shoreline elevations. Approach 2 does not create a seamless transition between the bathymetric surface and surrounding lidar elevation data.
An error analysis of both approaches with (approach 1) and without (approach 2) assigned shoreline elevations was conducted by using the “Extract Values to Points” tool in the “Spatial Analyst Toolbox” of ArcGIS. The error analysis compared the measured channel-bottom elevations to the raster-interpolated bottom elevations and identified all points whose elevations were equal to or greater than the vertical accuracy calculated for the 95-percent confidence level (Az=0.27 ft). Approach 1 yielded 7,131 comparison points (17.1 percent) equal to or more than 0.27 ft from the measured point data. Approach 2 yielded 733 comparison points (1.76 percent) equal to or greater than 0.27 ft from the measured point data. Given that the longitudinal-survey transects measured primarily midchannel depths with few depth measurements near the shoreline, assigning the shoreline elevation in approach 1 artificially raised the elevation of the raster surface of the canal bottom and falsely produced a V-shaped canal bottom. Although data produced by approach 2 does not blend seamlessly with data measured by the LIDAR, the data from approach 2 produced a flatter canal-bottom shape that more closely resembled the actual wide U-shape geometry indicated by the perpendicular quality-assurance transects. Approach 2 results more accurately represent the canal capacity and geometry for future water-flow studies, and, for these reasons, was the approach used for the creation of bathymetric maps and figures.
Bathymetric figures (see “Bathymetric-Survey Results” section) were created by segmenting the study area into seven overlapping maps in west-to-east order to provide enough resolution to see the change in relief of the canal bottom elevation in the report figures. In four of these segments, zoomed-in bathymetric figures provide a better view in areas of interest near Limestone aqueduct, Pools Brook, Chittenango Landing Canal Boat Museum, and the village of Canastota in Lenox, New York.
Raster and bathymetric data are available in a USGS data release (Wernly and Welk, 2022). These data and the generated bathymetric surface are not intended for navigation, regulatory, permitting, or other legal purposes.
Hydrodynamic Data Collection and Quality Assurance
In addition to the use of the ADCP vertical beam to measure depth during the bathymetric survey, the dual four-beam velocity measurement transducers were used to measure flow direction and velocity. The collected hydrodynamic data were used to produce two datasets of depth-averaged velocities for the (1) longitudinal transects which run along the center of the canal and (2) the quality-assurance transects which run perpendicular to the canal length. These data were used to make general inferences about the canal hydrology. An example of mapped flow velocities from a single perpendicular transect near Limestone aqueduct is shown in figure 2.
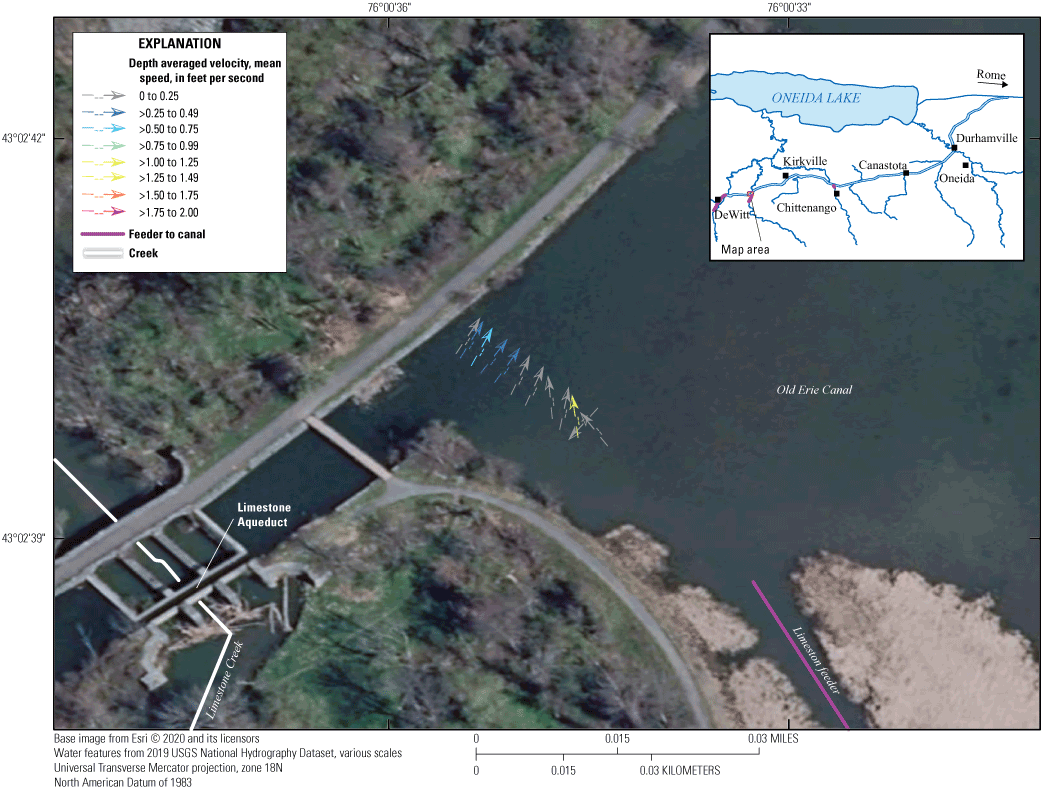
Map of flow velocities and the directions of flow near the Limestone aqueduct in New York.
The average water speed of the canal was 0.28 ft/s. By necessity, the boat speed during the survey was approximately 10 times the water speed. Mueller and others (2013) indicate that for the most accurate water velocity data, the speed of the boat should be kept less than or equal to the water speed being measured, therefore the measured flow direction and velocities should be considered an estimate. More accurate velocity measurements would require more controlled settings with the use of slower boat speeds and repeated data collecting along transects in the same location.
Velocity data were not screened in RiverSurveyor beyond the steps taken with the bathymetric dataset, except for the removal of all flow speeds greater than 2.00 ft/s, which were considered erroneous. Of a total of 41,656 velocity data points, 70 data points (about 0.2 percent of the total survey) at which a mean speed greater than 2.00 ft/s was calculated were removed. Of the 70 points removed, 63 came from the longitudinal transects and 7 from the perpendicular quality-assurance transects.
The dataset contains all measured velocities, but to minimize the appearance of vectors overlying each other in the created ArcGIS shapefile (Wernly and Welk, 2022), only every 5th and 10th vector were displayed for the perpendicular and longitudinal transects, respectively. The perpendicular quality- assurance dataset, where boat speeds were lower, and nearly the full width of the canal was measured, were used to determine how velocity changed down the length of the canal. Velocity data was grouped within the same designated staff gage sections which water surface elevations were assigned. To make a direct comparison between these different sections, velocity measurements from larger embayments were not included in this analysis. The embayments have larger cross-sectional areas that result in lower velocities relative to sections with no embayments.
Water-Quality-Data Collection
Water-quality data were collected concurrently with the bathymetric survey (from April 16 to April 20, 2018) by using a Yellow Springs Instruments 6920 V2 multiparameter water-quality monitor (Yellow Springs Instruments, Inc, 2012) mounted on the side of the boat at a depth of about 1.0 ft below the water surface. The multiparameter water-quality monitor measured dissolved oxygen, water temperature, specific conductance, pH, and turbidity at 60-second intervals. All sensors were calibrated prior to the survey according to published methods (U.S. Geological Survey, variously dated; Wagner and others, 2006).
The internal clock of the multiparameter water-quality monitor was synchronized with the official National Institute of Standards and Technology atomic clock at the beginning of each survey day (www.time.gov). The synchronized times for individual water-quality measurements were merged with the ADCP positional coordinates to create a combined dataset (Foster and others, 2016), that mapped the water-quality data.
Postprocessing of Water-Quality Data
Data from the multiparameter water-quality monitor was imported into Microsoft Excel and plotted with respect to time prior to review of the data for potential errors. Clearly erroneous data, most often seen as spikes in the data, were removed from the dataset on the basis of criteria in Wagner and others (2006) and when field notes indicated times when the boat motor struck the canal bottom and suspended sediment in the water column. This happened infrequently when the survey boat was being maneuvered in shallow areas, and mostly affected turbidity and specific-conductance values. During these time intervals, water-quality measurements were not representative of the canal conditions and were deleted. Of a total of 814 data points, 33 erroneous data points (about 4.1 percent of the total survey) were removed.
Creation of Water-Quality Maps
Maps of dissolved oxygen, water temperature, specific conductance, pH, and turbidity were created using ArcGIS methods described by Foster and others (2016). Data were interpolated between points by use of the “Topo to Raster” tool in the “Spatial Analyst Toolbox.” The canal shoreline was buffered to 150 meters for data interpolation between points to aid in visually representing the water-quality parameters along the entire length of the canal. The data were projected in a Universal Transverse Mercator (UTM) Zone 18 North coordinate system. The raster surfaces and the associated water-quality data are available as a USGS data release (Wernly and Welk, 2022).
Survey Results
Water-Surface-Elevation Results
Water-surface elevations in the canal ranged from a maximum elevation of 424.888 ft NAVD 88 at the Butternut aqueduct staff gage (table 3) to a minimum of 421.932 ft NAVD 88 at the Collins Road staff gage (table 4). Comparing staff-gage readings made on the same day, at all sites, show a downward slope of the canal water surface from west to east.
For the reaches of the canal surveyed by boat, the differences in water-surface elevation at the points equidistant between upstream and downstream staff-gages ranged from 0.012 ft to 0.298 ft with a mean difference of 0.185 ft. For the reach of the canal north of the Durhamville aqueduct, where manual depth measurements were made, the differences in water-surface elevations at points equidistant between upstream and downstream staff gages were larger and ranged from 0.759 ft to 1.024 ft with a mean difference between staff-gage sections of 0.892 ft. Differences at these equidistant points of more than 0.36 ft (the combined 95th percentile ADCP vertical accuracy and the average uncertainty of the benchmarks [table 1]) suggest potential bias in the depth measurements north of the Durhamville aqueduct. These differences are likely a result of the significant number of downed trees and aquatic vegetation, which can reduce flow rates and might create separate ponded areas of water with different water-surface elevations.
Bathymetric-Survey Results
The results of the bathymetric data are a raster surface of the bottom elevations of the Old Erie Canal. This raster surface is overlain on aerial imagery of the bathymetric-survey reaches, shown in figures 3–13. Midchannel depths in the reach of the canal surveyed with the ADCP (between DeWitt and the Durhamville aqueduct) ranged from 1.26 ft to 7.33 ft (the mean depth was 3.52 ft). The greatest depth surveyed with the ADCP (7.33 ft) was measured in the embayment directly west of Limestone aqueduct (fig. 10). The shallowest depth surveyed with the ADCP (1.26 ft) was measured in the shallow delta formed by Limestone feeder in the embayment directly east of Limestone aqueduct (fig. 10).
Midchannel depths in the reach of the canal manually measured with a stadia rod (from the Durhamville aqueduct to the junction with the Erie Canal) ranged from 0.68 ft to 2.44 ft (the mean depth was 1.36 ft). The greatest depth manually measured with the stadia rod (2.44 ft) was measured approximately 5,000 ft downstream from the Durhamville aqueduct (fig. 7). The shallowest depth manually measured with the stadia rod (0.68 ft) was measured at the very end of the canal near the New London culvert/sluice gate (fig. 9).
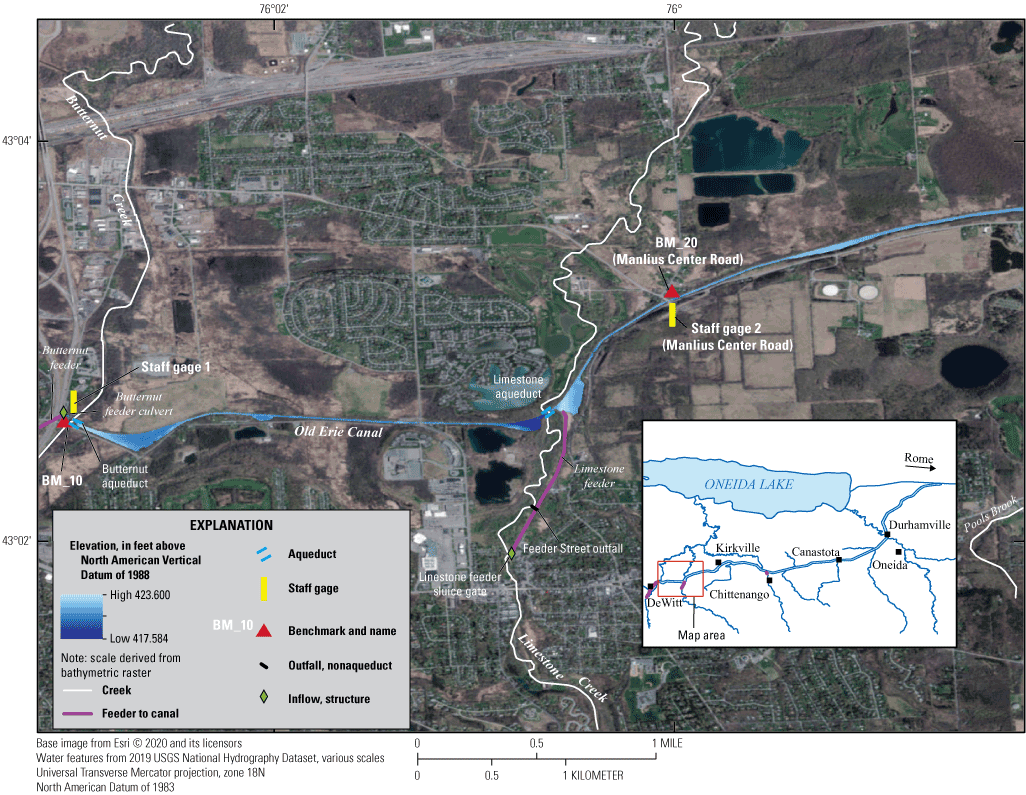
Map of Old Erie Canal bottom elevations near Butternut and Limestone Creeks, New York, including benchmark and staff-gage locations.
Map of Old Erie Canal bottom elevations near Pools Brook, New York, including benchmark and staff-gage locations.
Map of Old Erie Canal bottom elevations near Chittenango and Canaseraga Creeks, New York, including benchmark and staff-gage locations.
Map of Old Erie Canal bottom elevations near Canastota Creek, New York, including benchmark and staff-gage locations.
Map of Old Erie Canal bottom elevations near Cowaselon and Oneida Creeks, Oneida, New York including benchmark and staff-gage locations.
Map of Old Erie Canal bottom elevations near Mills Road and Collins Road in Verona, New York, including benchmark and staff-gage locations.
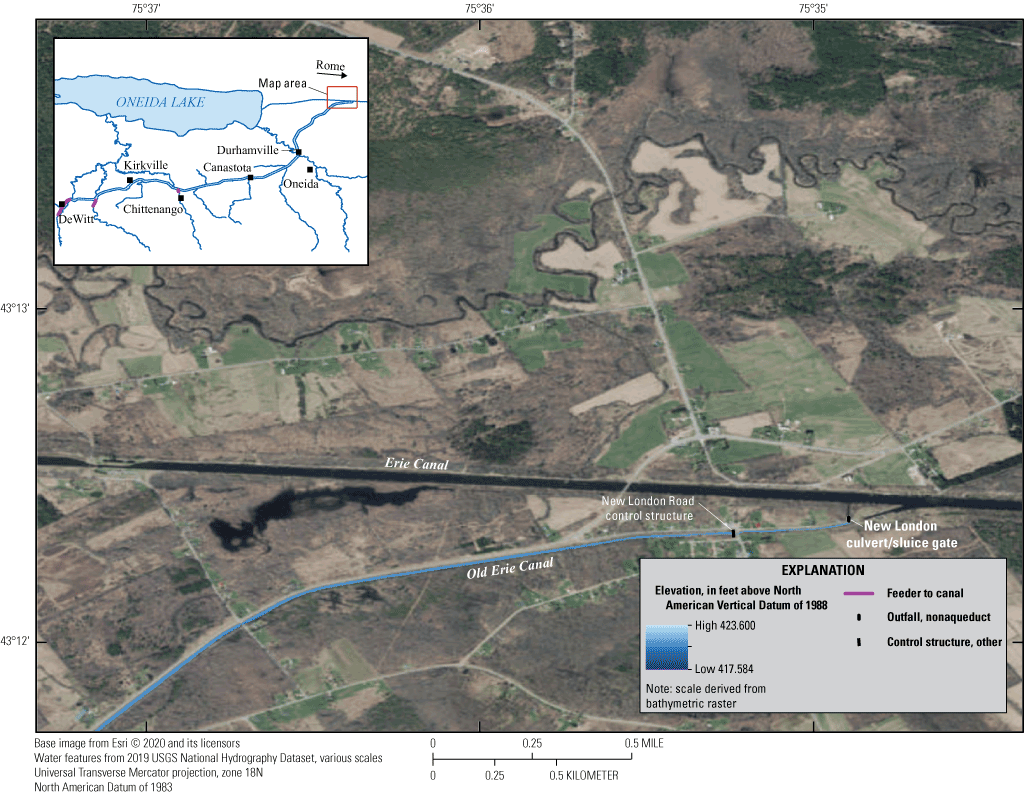
Map of Old Erie Canal bottom elevations near where the canal terminates into the Erie Canal at the New London culvert/sluice gate.
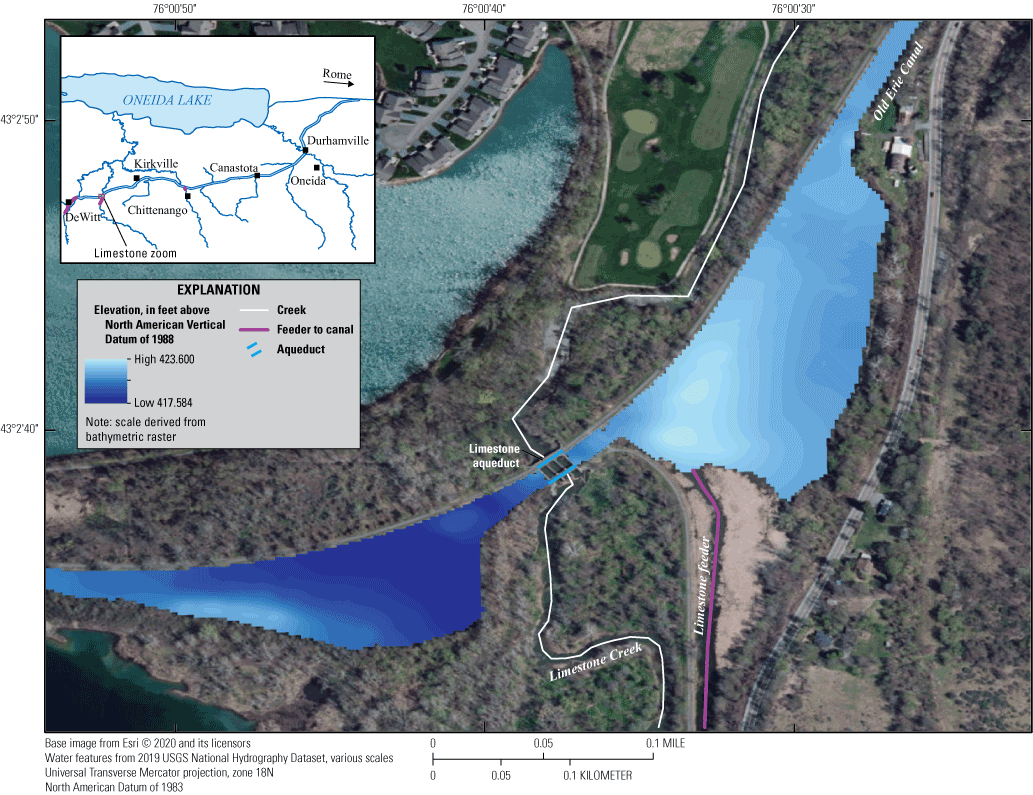
Map of Old Erie Canal bottom elevations at Limestone aqueduct, New York.
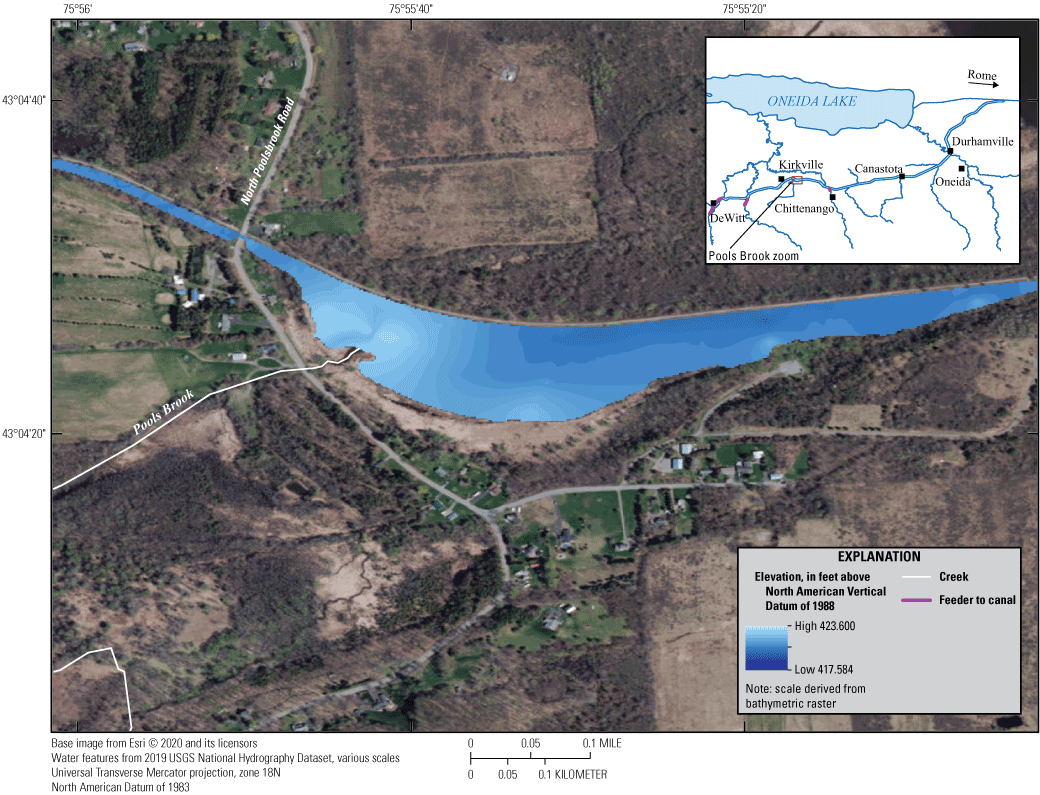
Map of Old Erie Canal bottom elevations at Pools Brook inflow, New York.
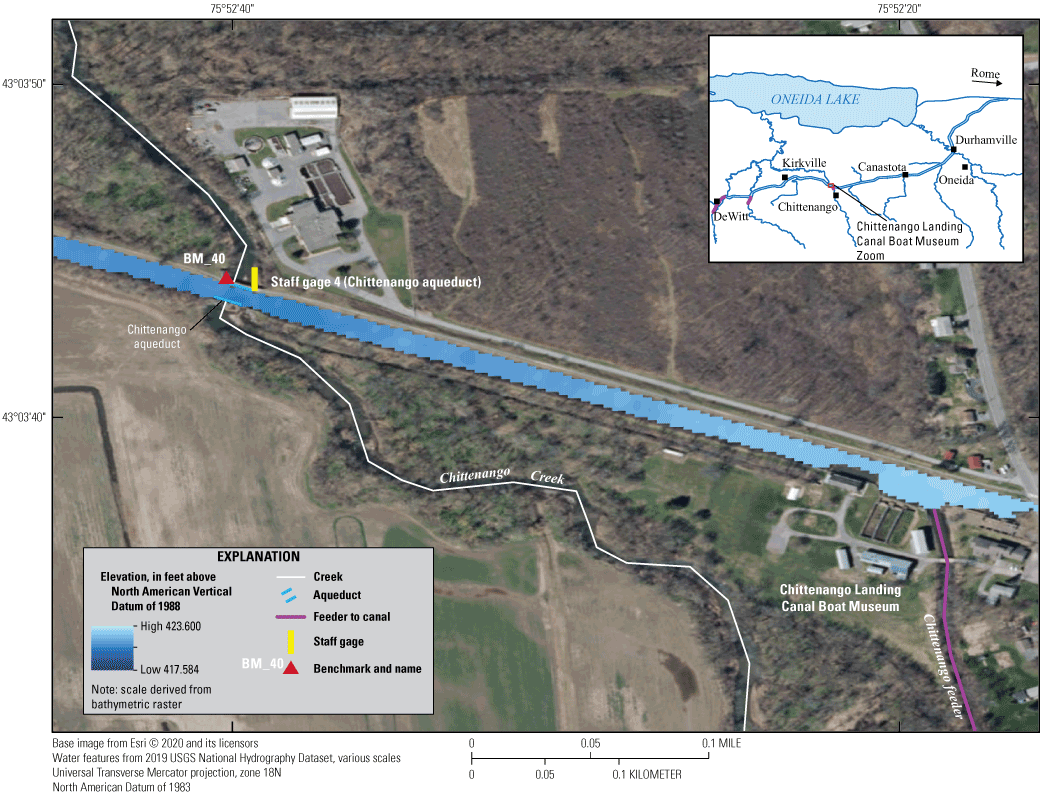
Map of Old Erie Canal bottom elevations at Chittenango Landing Canal Boat Museum, Sullivan, New York.

Map of Old Erie Canal Bottom elevations in Canastota, Lenox, New York, including benchmark and staff gage locations.
Hydrodynamic Results
Flow speed for the entire length of the canal averaged 0.28 ft/s. Water speeds measured at benchmark sections are listed in table 5. Water speed increased down the length of the canal; however, the increased velocities do not necessarily indicate increased volumetric flows. Water speeds likely increased because the canal is shallower downstream, resulting in a decreased cross-sectional area that might increase velocity but not necessarily flow (flow=velocity×area).
Table 5.
Flow velocities in each benchmark section of the Old Erie canal, New York.[Benchmark locations are identified on fig. 1]
The overall movement of water in the canal is to the east. Occasional flow vectors oriented in other directions can be attributed to many causes, both real and erroneous. In larger embayments, both eddies and wind are expected to alter flow direction; in the narrower sections of the canal, submerged trees will affect flow direction. Flow directions, especially in the longitudinal transects where boat speeds were greater than water velocity, were frequently not pointed parallel to the channel or eastward. The eastward-flow direction was confirmed with field notes and visual inspections at every benchmark location. The velocity data and shapefile are available in a USGS data release (Wernly and Welk, 2022).
Water-Quality Results
Water-quality measurements were taken simultaneously during the bathymetric survey over the duration of five days and therefore reflect conditions over distance and time. Survey dates with start and stop times are given on each water-quality figure.
Measured dissolved-oxygen concentrations ranged from 11.7 to 15.8 milligrams per liter (mg/L), with no clear pattern along the study reach (fig. 14). Dissolved oxygen was measured throughout the day. Without a stationary reference point, it is difficult to determine whether observed changes in measured dissolved oxygen concentrations are representative of changes in environmental conditions or are a result of diurnal fluctuations caused by changing temperatures and primary production (U.S. Geological Survey, 2019). The highest concentrations of dissolved oxygen (greater than 15.0 mg/L) were measured between Canastota and Cowaselon Creeks, where field notes and pictures also indicated the highest amounts of submerged aquatic vegetation. Because Madison County considers heavy aquatic-plant growth one of the adverse conditions affecting flow and water quality in the canal, this area of notably higher amounts of submerged aquatic vegetation is of particular interest. Because this was a single-survey event, however, the data are insufficient to provide an explanation of the spatial and temporal variability of dissolved oxygen along the study reach.
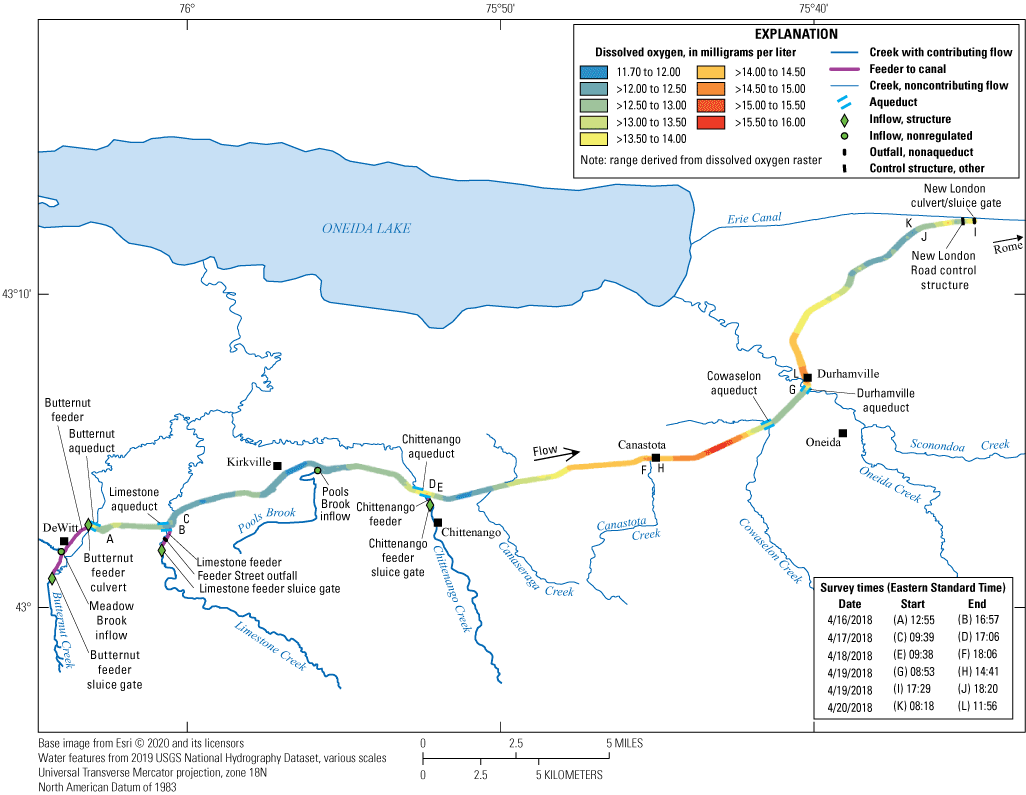
Map of sensor-measured dissolved oxygen in milligrams per liter along the study area of the Old Erie Canal, New York.
Water temperatures measured throughout the day ranged from 2.8 to 7.5 °C (fig. 15). Temperatures were consistently lowest in the morning and highest in the afternoon, likely the result of diurnal fluctuations in temperature (Sinokrot and Stefan, 1993). The lowest water temperatures (lower than 3.5 °C) and some of the highest (higher than 6.5 °C) were observed in the easternmost 4 miles of the canal near where it discharges to the Erie Canal.
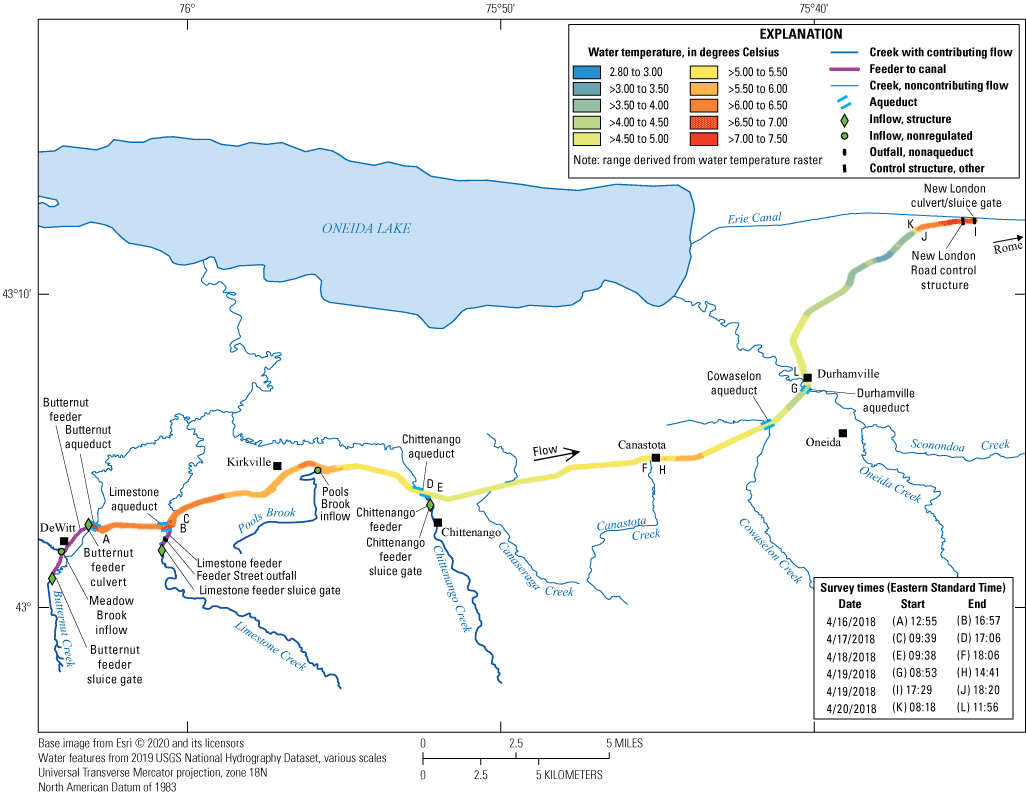
Map of sensor-measured water-temperature in degrees Celsius along the study area of the Old Erie Canal, New York.
Measured specific conductance ranged from 234 to 2,202 microsiemens per centimeter at 25 degrees Celsius (µS/cm; fig. 16). Specific conductance generally decreased in the downstream direction. The highest observed values (greater than 2,100 µS/cm) were measured upstream from the hamlet of Kirkville, in Manlius, N.Y, and the lowest observed values (less than 300 µS/cm) were measured in the last 0.76 miles of the Old Erie Canal before it discharges to the Erie Canal. The highest rates of change in specific conductance were measured in two locations. Where Pools Brook enters the canal, specific conductance decreased from 1,940 µS/cm to 1,364 µS/cm within a span of 0.08 miles. About 1.14 miles upstream from where the Old Erie Canal discharges to the Erie Canal, specific conductance decreased from 1,036 µS/cm to 286 µs/cm within a span of 0.38 miles. The high specific-conductance values upstream from Kirkville are likely due to the streams that supply water to the canal through the Butternut and Limestone feeders. It is likely that during a recent rainfall, salts from roadway runoff were being flushed into these streams, resulting in the observed specific conductance values through this reach.

Map of sensor-measured specific conductance, in microsiemens per centimeter at 25 degrees Celsius, along the study area of the Old Erie Canal, New York.
Measured pH ranged from 7.82 to 8.73 units and generally increased in the downstream direction with some variations along the length of the canal (fig. 17). The lowest pH values (less than 7.90) were measured in the first 0.47 miles downstream from the Butternut aqueduct. The highest pH values (higher than 8.40) were measured in the last 0.76 miles of the canal before it discharges to the Erie Canal. High pH values (greater than 8.30) also were measured near the Chittenango aqueduct and Chittenango feeder in addition to a 3-mile-long reach immediately downstream from the Durhamville aqueduct. Geology and the source of water determine the initial pH, but photosynthesis from aquatic plants is the greatest natural cause of increased pH (Michaud, 1991). Further study is needed, but the general increase in pH along the length of the canal may correlate with increasing amounts of aquatic vegetation, algal mass, and higher levels of dissolved oxygen.
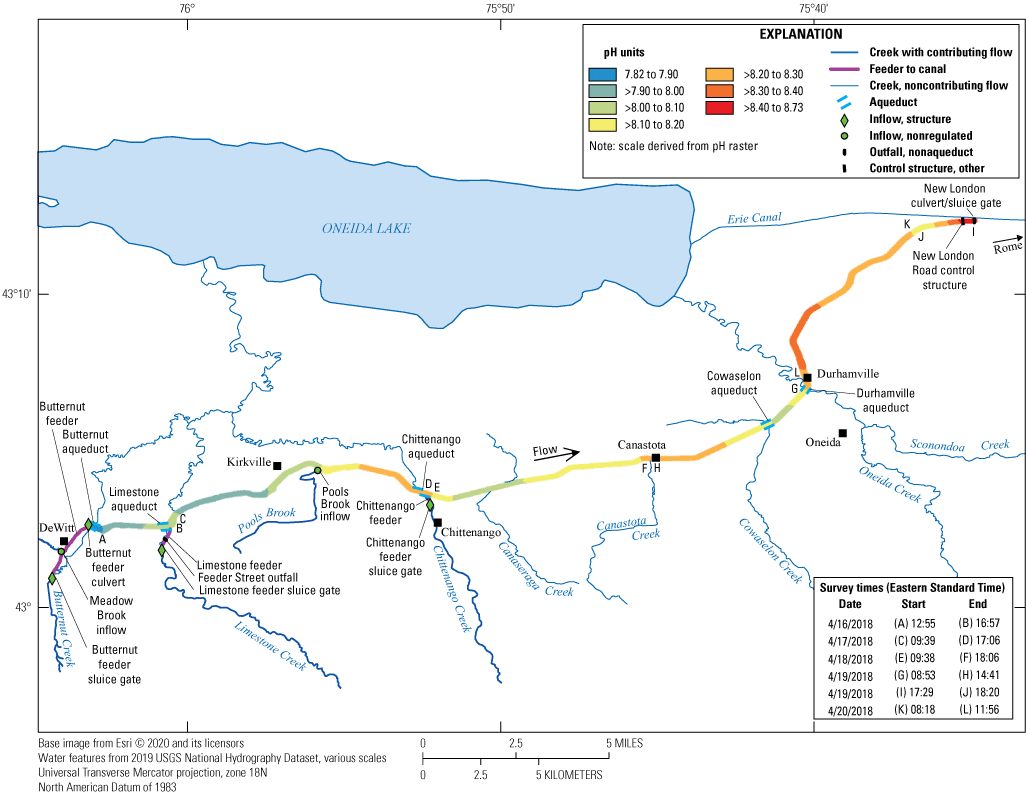
Map of measured pH values along the study area of the Old Erie Canal, New York.
Measured turbidity ranged from 0 to 9.5 formazin nephelometric units (FNU), with the highest turbidity typically measured near feeder and tributary inputs (fig. 18). The lowest turbidity (less than 1.00 FNU) was measured in a 0.09-mile reach just downstream from the Butternut aqueduct and in the last 4 miles of the canal before it discharges to the Erie Canal. Higher turbidity values (greater than 7.00 FNU) were measured in several areas and are mostly explained by the feeders and tributary inflows carrying higher concentrations of suspended sediment into the canal. These higher turbidity values were measured near the Butternut feeder, the Limestone feeder, and the Pools Brook inflow. One of the highest observed turbidity values (9.00 FNU) was measured just downstream from Butternut aqueduct near some of the lowest recorded turbidity values. This abrupt change was likely caused by rapidly changing flow conditions after a recent rainfall that brought stormwater inflows into the canal through the Butternut feeder. Field notes confirm that, between the first and final staff readings at the Butternut aqueduct, water conditions transitioned from clear to turbid as the water level rose 0.240 ft. Higher turbidity values were occasionally observed in other areas such as the embayment upstream from benchmark 30, upstream from benchmark 60, and near the Durhamville aqueduct (fig. 1). High turbidity upstream from benchmark 30 may have been caused by surface runoff from nearby low-lying farm fields.
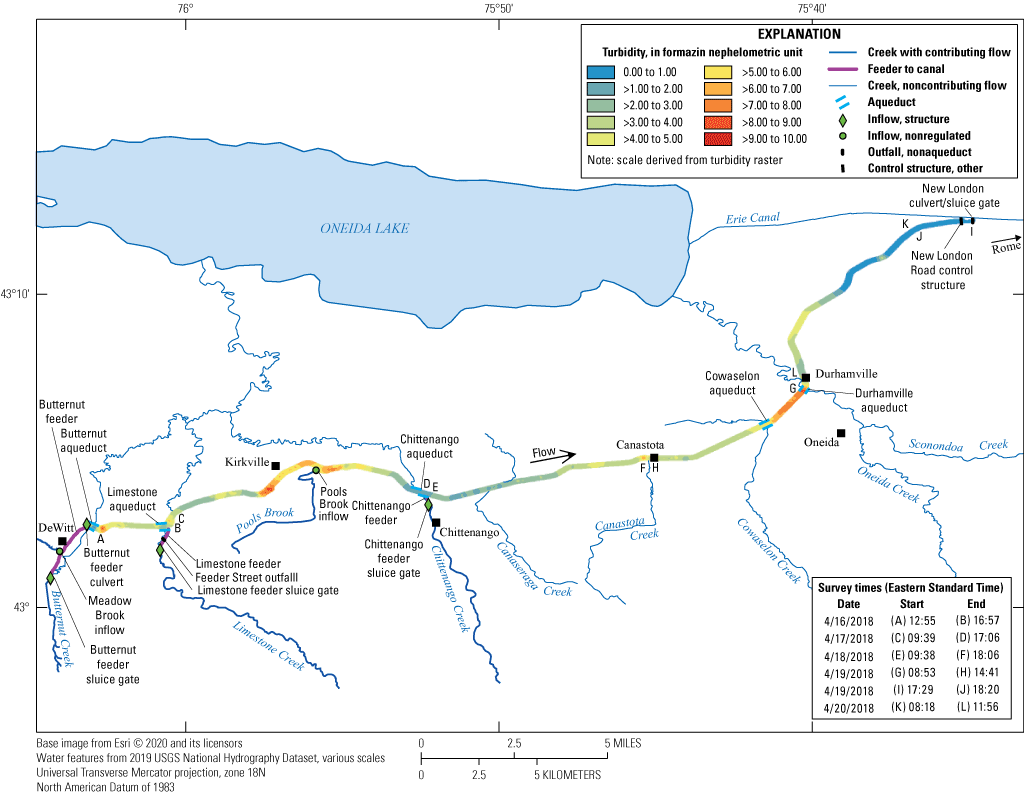
Map of sensor-measured turbidity, in formazin nephelometric units, along the study area of the Old Erie Canal, New York.
Observations of the General Condition of the Canal Infrastructure and Channel
During bathymetric and water-quality surveys, and again on November 21–22, 2019, field notes were taken on the general condition of the canal infrastructure and channel conditions. These inspections were descriptive, qualitative, and not meant to provide a technical or engineering assessment of the structures.
General Condition of the Canal Infrastructure
Three feeder canals that divert water from nearby creeks through sluice gates and two natural (nonregulated) streams are the main contributors of flow to the Old Erie Canal. Five aqueducts with outflow structures, an outflow structure in the Limestone feeder system, and a sluice gate at the end of the canal either release or are or were capable or releasing water to nearby waterways. Remnants of a flashboard (one or more boards used for increasing the depth of water behind a dam) structure to raise the water level are also visible near the end of the canal. All of these structures have or had the capability to control the water level in the canal.
The dimensions of all structures were measured to provide future water-flow studies with the necessary numerical inputs to model flow in and out of the system. Figure 1 identifies the locations and provides the names of the documented infrastructure of the canal.
Feeder System and Inflows
The Butternut feeder sluice gate (figs. 3.1A and 3.1B) was designed to divert water from Butternut Creek into the Butternut feeder (fig. 3.1C). A weir used to raise the water level in Butternut Creek to maintain flow into the Butternut feeder is visible 9 ft downstream from the sluice-gate opening (fig. 3.1D). The weir protrudes just above the stream bed and does not function as designed. It is not known whether the functionality of the weir was reduced by sedimentation over time, or if it has been partially demolished. Water should enter the sluice gate through two independently operated 3-foot-square concrete openings (table 6; fig. 3.1E). The amount of water coming through these openings is controlled by metal gates which can be raised and lowered by their affixed lifting bars (fig. 3.1F). The lifting bars are rusted, bent, and missing the hardware needed to lock them in position. The outer brackets supporting the sides of the metal gates are in fair condition. The metal gates were found in the closed position and were effective in sealing the sluice gate: no water was observed passing the sluice-gate openings despite water levels high enough for water to flow through these gates. Currently, no water enters the feeder through the sluice gate, but if serviced, the gate could potentially function as designed and regulate the water flow into the Old Erie Canal.
Butternut feeder (fig. 3.2A) currently receives no flow inputs from the sluice-gate openings, and yet flow visibly increased from zero flow at the sluice gate to a small stream by the time it passed under Andrews Road. The increase in flow likely is attributed to groundwater seepage into the feeder (fig. 3.2B). Evidence of flow overtopping the feeder levee walls during times of high flow in Butternut Creek was noted in two areas: a small area of backwater just to the west of the sluice gate, and a short distance downstream over the levee wall. Drift lines of leaves and debris in the feeder channel itself indicate that the water level can increase by several feet when it receives overbank flow from Butternut Creek over the levee walls. The feeder is narrow near the sluice gate (figs. 3.2A, 3.2B, and 3.2C) but widens downstream from Andrews Road (figs. 3.2D and 3.2E). The feeder has been affected by sedimentation over time but is also open along its entire length except for an area of dense phragmites, an aggressive wetland grass, immediately downstream from Andrews Road (fig. 3.2D). Meadow Brook (figs. 3.3A and 3.3B) is a natural stream that supplies additional unregulated flow through the Butternut feeder before it enters the canal through a culvert near DeWitt, N.Y.
Water from the Butternut feeder enters the Old Erie Canal through the Butternut culvert (fig. 3.4A). The oval-shaped concrete culvert measures 6.5 ft high and 9.4 ft wide at the entrance (upstream side; table 6; fig. 3.4B) and 5.5 ft high and 9.0 ft wide at the exit (table 6; fig. 3.4C). Both the entrance and exit were free of debris and were found in good condition.
The Limestone feeder sluice gate (fig. 3.5A) was designed to divert water from Limestone Creek into the Limestone feeder. Historically, a weir used to cross the Limestone Creek just downstream from the sluice gate to raise the water level in the creek enough to direct water into the Limestone feeder through the sluice-gate openings. The weir was breached in 2009 (Doran, 2009) and subsequently removed. Small sections of the weir are still visible but are no longer functional in raising the water level in Limestone Creek (fig. 3.5B). As designed, the sluice gate should receive water through four independently operated concrete rectangular openings that average 8.0 ft high and 5.4 ft wide (individual dimensions shown in table 6). Each opening is designed to accept three sets of flashboards to control the amount of water entering the feeder: two would be set upstream from the sluice gate openings structure between metal beams (fig. 3.5C), and one is integrated within the concrete sluice gate structure (fig. 3.5D). The two sets of beams upstream from the concrete sluice gate were found severely rusted and bent. The metal-reinforced grooves embedded in the concrete sluice gate structure are rusted and deteriorated but would accept flashboards (boards used for increasing the depth of water behind a constructed dam (fig. 3.5D); no flashboards, however, were observed. When Limestone Creek is at base flow, no water enters the feeder through the sluice gate openings; when Limestone Creek is at higher stages, flow will enter the feeder that supplies water to the Old Erie Canal.
Table 6.
Feeder system and inflows into the Old Erie Canal, New York.Limestone feeder (fig. 3.6A), which enters the canal in a marshy area just downstream from Limestone aqueduct (fig. 3.6B), was found generally clear of debris (fig. 3.6C) and in good condition to convey flow. At the time of inspection, water in the feeder consisted of backwater from the canal.
Pools Brook is a small stream (fig. 3.7A) whose full flow enters the canal naturally (unregulated) through a small steel culvert that passes underneath North Poolsbrook Road in a marshy area between Limestone and Chittenango aqueducts (fig. 3.7B). The circular culvert measures 4.9 ft high and 5.0 ft wide at the entrance (upstream side; fig. 3.7C) and 4.9 ft high and 4.8 ft wide at the exit (fig. 3.7D). Both the entrance and exit were found free of debris and in good condition.
The Chittenango sluice gate (fig. 3.8A) was designed to divert flow from Chittenango Creek into the Chittenango feeder. A weir (fig. 3.8B) that was used to maintain a minimum water level in Chittenango Creek to supply water into the feeder still functions but has been subject to heavy sedimentation over time. Sediment buildup on the upstream side of the weir has created a large vegetated bar directly upstream from the sluice gate (fig. 3.8C) and across much of the weir face (fig. 3.8B). The vegetated bar blocks water from reaching the sluice gate during base flow in Chittenango Creek. As designed, water should enter the sluice gate through three independently operated rectangular openings which measure 6.9 ft high and range in width from 3.8 ft to 4.6 ft (individual dimensions in table 6). All three openings have wood flashboards installed at various heights, partially closing the sluice gate. Gears mounted on top of the sluice gate were designed to raise and lower the flashboards with affixed lifting bars. Missing hardware for the gearing system and no lifting bars on the two outermost flashboards make the sluice gate nonoperational. The outer brackets supporting the sides of the flashboards are rusted but in fair condition and would allow flashboards to be individually installed and removed to alter flow into the feeder even without the operation of the gearing system. When Chittenango Creek is at base flow, no water enters the feeder through the sluice gate (except for a small amount of leakage between and around the flashboards), but at higher stages, water can overtop the partially closed openings and enter the feeder supplying water to the Old Erie Canal.
Water from the Chittenango feeder enters the canal at the Chittenango Landing Canal Boat Museum near the village of Chittenango in Sullivan, N.Y. (fig. 3.9A). The feeder is clear where it enters the canal, but the amount of tree debris in the feeder increases farther upstream (fig. 3.9B). Despite the debris, the feeder still conveys water into the Old Erie Canal.
Except for the two natural streams, Meadow Brook and Pools Brook, the Old Erie Canal does not receive a constant inflow of water from the feeder system when the feeder creeks are at base flow. As designed, all three sluice gates are capable of supplying water to the canal during base-flow conditions; however, in its current state of operation, the feeder system supplies water to the Old Erie Canal only during high flows in the feeder creeks.
The feeder system has the potential for increasing flow into the Old Erie Canal and possibly flushing the system more regularly if repairs were made to the sluice-gate mechanisms, sediments were removed near the sluice gates, weirs were replaced, and debris, vegetation, and sediment were removed from the feeder channels. Sluice-gate openings could be adjusted and locked for seasonal variations in flow in the creeks that supply water to the Old Erie Canal. A 1996 report on the New York State Canal System from Madison County (Welch and Madison County Planning Department, 1996) provides a contemporary history of the status of all three sluice gates and provides an example of recent repairs to improve the feeder system which support the idea that more water could be directed into the canal if repairs were made. The report states that Butternut Creek is no longer diverted into Butternut feeder, but it does not specify the date when that diversion ended. The report states that a small volume of water from Limestone Creek is diverted into the Old Erie Canal from the sluice gate into the Limestone feeder, but also that the sluice gate had not been adjusted within at least the past ten years. Finally, the report describes the diversion of some of the Chittenango Creek flow into the Old Erie Canal through the sluice gate. Although the gate had previously not been adjusted for many years, it had been rebuilt around the time of the report, the inlet channel had been cleaned, and the gates were opened, adjusted, and closed every year as needed.
Aqueducts and Outfalls
The Butternut aqueduct conveys the canal over Butternut Creek through a narrow concrete channel (fig. 4.1A), which is not original to the canal and is significantly smaller than the canal width both upstream and downstream from the aqueduct. This narrow channel was built sometime after canal navigation ceased to keep water moving. The aqueduct is no longer navigable by larger boats due to the narrow width. Remnants of the original aqueduct are still visible between the newer concrete channel and the towpath (fig. 4.1B). The narrow aqueduct measures 7.1 ft wide by 5.9 ft high at the entrance and 7.0 ft wide by 7.2 ft high at the exit. The aqueduct itself is in fair condition and conveys water very well when the entrance is open; the narrow width, however, can cause a buildup of debris that retards flow. There are two outfalls beneath the water surface located on the north side of the structure very near the bottom of the aqueduct. Both outfalls are capable of discharging water into Butternut Creek (fig. 4.1C). The outfalls are currently in the closed position with minimal leakage. Each outfall has an outfall gate recessed into the concrete with metal guides on either side (fig. 4.1D), each of which measures 1.6 ft by 1.6 ft. The downstream gate has a lifting bar with a bracket on top that can be locked closed. The upstream gate lacks both the lifting bar and locking bracket. The metal guides and lifting bar are in serviceable condition, the top bracket is in good condition except for the crumbling concrete into which it is set. More detailed conditions of the gates are unknown, except for the fact that they are leaking. Additionally, there are two sets of metal brackets on both the upstream and downstream sides of the aqueduct that can accept flashboards (fig. 4.1E). These flashboards were designed to hold water back so that the canal could be separated into different sections that allowed for individual dewatering of those sections (upstream, downstream, or in between the flashboards), and thus permit work to be done in the canal. These metal brackets were found in good condition and appeared to be functional.
Limestone aqueduct is similar to Butternut aqueduct: it also conveys water over Limestone Creek through a narrow, rectangular concrete channel that is not part of the original aqueduct (fig. 4.2A). Remnants of the structure that supported the original aqueduct are visible between the newer aqueduct and the towpath (fig. 4.2B). The narrow aqueduct measures 6.9 ft wide by 6.9 ft high at the entrance and 7.9 ft wide by 7.2 ft high at the exit. The aqueduct is in fair condition and conveys the flow well, but is prone to debris buildup that can retard the flow because of the narrow width of the channel. A single outfall beneath the water surface is located very close to the bottom of the aqueduct structure. This outfall is on the northwest side of the structure, and it can be used to discharge water into Limestone Creek (fig. 4.2C). The outfall was found in the closed position with minimal leakage into Limestone Creek. The outfall gate is recessed into the concrete with metal guides on either side (fig. 4.2D). A lifting bar that had been used to raise the outfall gate was found severely rusted and damaged. A bracket on top of the aqueduct used to lock the closed lifting bar was found in good condition. One set of metal brackets on either side of the concrete channel wall on the downstream end of the aqueduct is designed to accept flashboards (fig. 4.2E). When installed, these flashboards hold back water to separate the canal into different sections, permit water to be drained from those sections (upstream or downstream), and allow work to be done on the canal without affecting the water level in the separated section. The metal brackets were found in good condition and appeared to be functional.
There is an unnamed control structure underneath the bridge located on Feeder Street which parallels Limestone feeder (fig. 4.3A) with three 2.5 by 2.5 ft concrete outfalls (fig. 4.3B) that are capable of discharging into Limestone Creek. The outfall gates are made of metal and recessed into the concrete with metal guides on either side (fig. 4.3C). Metal lifting bars to raise and lower the gates are rusted but in fair condition. Two of the three gates are closed; one of them has been raised 4.5–5.0 inches by debris that is stuck underneath it. At the time of inspection, water in the Limestone feeder was backwater from the canal with flow moving slowly upstream from the mouth of the feeder to the control structure, where it was discharged into Limestone Creek (fig. 4.3D) from the partially raised metal outfall gate.
Chittenango aqueduct conveys water over Chittenango Creek in a 47-ft-wide channel (fig. 4.4A). The aqueduct itself is in fair condition and conveys water very well. Three concrete outfalls (fig. 4.4B) that average 3.0 ft wide and 4.0 ft high are located on the north side of the aqueduct and capable of discharging into Chittenango Creek (fig. 4.4C). The three outfalls are partially closed with a series of stacked flashboards in metal guides on either side, with metal lifting bars to raise and lower the flashboards (fig. 4.4D). The wood boards and metal infrastructure were found in good condition, and because they were partially open, allowed water to discharge into Chittenango Creek. Drift lines of leaves and debris on top of the aqueduct indicate that the water has flowed over the top of the aqueduct (426.47 ft elevation, NAVD 88). Tables 7 and 8 lists the dimensions for the individual outfall openings and their associated elevations. These dimensions include the elevations at the bottom of the openings; the point at which discharge would occur if no flashboards were in place; the elevations of the tops of the openings; and the elevations of the tops of the flashboards currently installed. These elevations are based on measurements from the top of the water surface at the time of inspection. The elevation of the water surface was determined using the closest installed staff gages with the appropriate offset (table 2).
Table 7.
Outfall dimensions in the Old Erie Canal, New York.[Openings ordered from upstream to downstream]
Table 8.
Outfall elevations in the Old Erie Canal, New York.[Openings ordered from upstream to downstream]
Cowaselon aqueduct conveys water over Cowaselon Creek in a 50-ft wide channel (fig. 4.5A). The aqueduct itself is in fair condition and conveys water very well. Two concrete outfalls that average 3.0 ft wide and 4.0 ft high are located on the north side of the aqueduct and capable of discharging into Cowaselon Creek (fig. 4.5B). The two outfalls are partially closed by a series of stacked flashboards (fig. 4.5C) with metal guides on either side and metal lifting bars to raise and lower them (fig. 4.5D). The wood boards and metal infrastructure were found in fair to poor condition, rusted and bent, but nonetheless functional. The outfalls were partially open with one discharging water into Cowaselon Creek and the other working as designed to prevent water from discharging out of the canal. Individual outfall dimensions, the elevations of the outfalls, and the elevation of the top of the aqueduct are listed in tables 7 and 8. These elevations are based on measurements from the top of the water surface at the time of inspection and conversions using the staff-gage offset.
The Durhamville aqueduct conveys water over Oneida Creek in a 52-ft-wide channel (fig. 4.6A). The aqueduct itself is in fair condition and conveys water very well. There are two concrete outfall structures of different types on the west side of the aqueduct: a spillway (fig. 4.6B) and one large rectangular opening (fig. 4.6C). The spillway opening measures 5.7 ft high and 5.3 ft wide and has a metal screen to block debris and two sets of metal guides that can hold flashboards to regulate the discharge of water into Oneida Creek (fig. 4.6D). One of the flashboard sets has a metal bar across the top to lock down the flashboards, but the other set is missing such a bar. The metal guides were found in good condition. Wooden flashboards installed in both sets of metal guides were partially closing the outfall. One of the sets of flashboards was found with the wood bowing and leaking water over the spillway; the other set of flashboards appeared to have been newly installed but not at a height sufficient to stop canal water from discharging into Oneida Creek. The other outfall, a large concrete rectangular opening 26.6 ft wide by 5.0 ft high discharges directly into Oneida Creek. No metal brackets or infrastructure in the opening were found to prevent water from discharging to the creek. The large rectangular opening has the potential for brackets to be affixed with flashboards to raise the canal water surface if an engineering assessment concluded the aqueduct could handle the additional weight of water.
Large flashboards could potentially be installed to raise the water level in the canal upstream from the New London Road Bridge (fig. 4.7A). Remnants of a concrete base and two I-beams on which the flashboards could rest are visible but crumbling (fig. 4.7B). The I-beam on the south side of the canal is intact and 3.4 ft high, whereas the northern I-beam is severely rusted and mostly deteriorated (fig. 4.7C). No flashboards were observed, and the water level in this most downstream reach of the canal was low.
The New London sluice gate and culvert (fig. 4.8A) mark the end of the surveyed reach of the canal. The remaining flow of the Old Erie Canal discharges through these structures into the Erie Canal (fig. 4.8B). The sluice gate is set in a concrete outfall measuring 2.5 ft wide and 3.5 ft high with a metal grate to block debris from entering (fig. 4.8C). The grate was found clogged with tree and trash debris. An access port cover on top of the culvert near the towpath is functional; at the bottom of the port is a set of metal guides that can accept flashboards to prevent water from discharging into the Erie Canal (fig. 4.8D). The culvert was found open, except for debris on the gate, with flow discharging into the Erie Canal (fig. 4.8E).
As designed, the outfall structures have the capacity to either raise or lower the water level in the canal depending on their set positions. A significant portion of water discharging from the canal into the surrounding creeks was found in the Chittenango, Cowaselon, and Durhamville aqueducts. The canal water surface could be raised with more flow conveyed to the downstream reaches if the outfall structures were repaired by stemming leaks, closing partially opened gates, and increasing the height of flashboards. Increased flow to the downstream reaches of the canal could flush the system more regularly. The flashboards could be locked at various heights to adjust for seasonally varying inflow from the feeder system.
General Condition of the Canal Channel
The canal condition changes greatly from an open navigable channel near DeWitt to a small ribbon of flow clogged with dense aquatic vegetation where it discharges to the New York State Canal System near Rome. Most of the needed information regarding the canal condition could be assessed through aerial imagery, but a better understanding was gained by transiting and observing the entire 30.8-mile length.
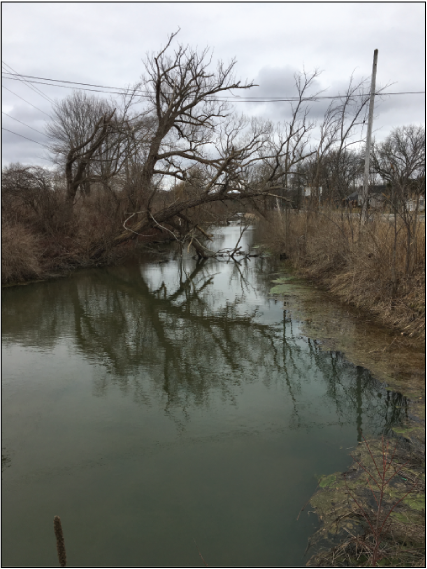
From DeWitt to Manlius Center Road, the channel is open and generally clear of trees or vegetation. Between Manlius Center Road and Kirkville Road there are a few downed trees, but navigation remained relatively easy. At the time of the survey (April 2018), a large beaver dam at Kirkville Road was obstructing the eastward flow. From Kirkville Road to Chittenango feeder, a few downed trees were also observed, but they were causing minimal disturbance to flow, and the channel was still open with navigation remaining relatively easy (fig. 19). From Chittenango feeder to Durhamville aqueduct, the number and size of trees increased, disturbing flow and making navigation particularly difficult in a section near Sullivan with a cluster of downed trees spanning the canal. Navigation by boat was nearly impossible east of the Cowaselon aqueduct because of the number and size of trees in the canal (fig. 20).
Photograph of an open channel on the Old Erie Canal, easily navigable by boat, near the Chittenango aqueduct, New York.
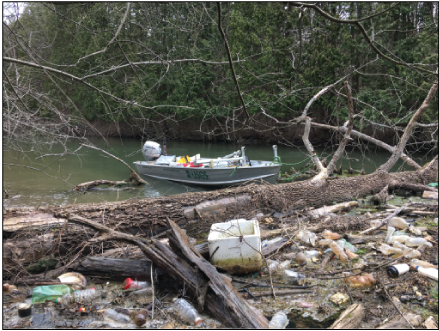
Photograph of a large, downed tree downstream from the Cowaselon aqueduct on the Old Erie Canal, New York.
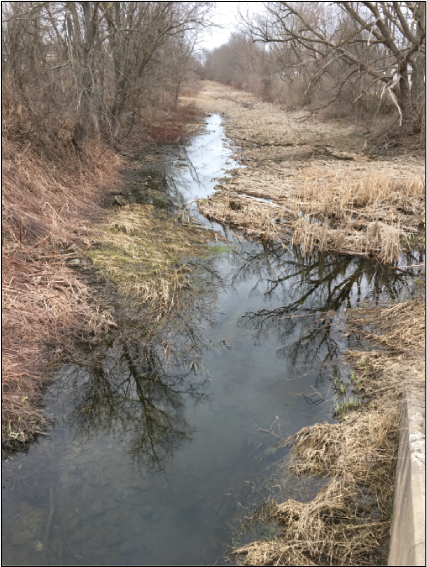
North of the Durhamville aqueduct, the number of downed trees (fig. 21), distance from the feeder canals, lost flow from outfalls, and increased aquatic vegetation made navigation impractical. Trees remained a disturbance to flow, but aquatic vegetation was the primary contributor impeding flow (fig. 22) from Durhamville until the canal becomes no longer recognizable near where it discharges to the Erie Canal.
Photograph of several downed trees in a row in a reach of the Old Erie Canal north of the Durhamville aqueduct, New York.
Photograph of the Old Erie Canal clogged with aquatic vegetation near where it enters the Erie Canal in Verona, New York.
The effect of downed trees on the canal system is difficult to quantify, but the obstruction by downed trees and vegetation throughout the canal will lead to a decrease in flow in the Old Erie Canal.
Summary
During 2018–2019, the U.S. Geological Survey, in cooperation with the Madison County Planning Department and New York State Canal Corporation, conducted a study of the Old Erie Canal between the Town of DeWitt, New York, and its junction with the current New York State Canal System in Verona, N.Y, near Rome, N.Y. The objective of this study was to document the current hydrology and hydraulics of a 30.8-mile-long section of the Old Erie Canal to meet the needs of the Madison County Planning Department and the New York State Canal Corporation and to provide data for use by water-resource managers and land-use planners to improve the water quality and aesthetics of the canal. The study comprised bathymetric, velocity, and water-quality surveys and documentation of the infrastructure of the canal. The results can be used to inform managers of the current condition of the canal and provide necessary data for future studies of water flow, including a hydraulic model of the canal.
The bathymetric survey was conducted from April 16 through April 20, 2018. Between DeWitt and the Durhamville aqueduct, the bathymetric data were collected with an acoustic Doppler current profiler (ADCP) mounted on a small boat. The boat was driven along a longitudinal transect down the centerline of the channel with the ADCP collecting water-depth, flow-direction, and flow-velocity data. Horizontal-survey positions for the ADCP were acquired using a satellite-based augmentation system Global Positioning System receiver positioned directly above the ADCP. For quality assurance, a second set of transects was created perpendicular to the longitudinal transects and spaced every 0.19 miles to provide an independent dataset with which the vertical accuracies of the ADCP data could be assessed. North of the Durhamville aqueduct, where dense aquatic vegetation interfered with the echo-sounder transmission, and numerous downed trees limited access by boat. Depths were manually measured (by a surveyor who waded into the canal) approximately every 0.19 miles along the centerline of the canal with a fiberglass stadia rod marked in tenths of a foot. Water-surface elevations, from which water depths were subtracted to obtain channel-bottom elevations, were established by the installation of eight benchmarks placed near the edge of the water and spaced on average 3.5 miles apart along the length of the study area. A ninth benchmark was found pre-existing. The elevations at each of the nine benchmarks were determined using survey-grade global navigation satellite systems and then transferred to a series of nine installed staff gages from which water-surface-elevation readings were taken during the transects. Geographic information system software was then used to calculate a bathymetric surface from the bottom elevations.
Bathymetric-survey results indicated that, during the time of the survey, the canal depths ranged from 1.26 feet (ft) to 7.33 ft between the Butternut and Durhamville aqueducts (mean depth was 3.52 ft). Shallow depths were measured throughout the canal, but the section north of Durhamville aqueduct was the shallowest with depths ranging from 0.68 ft to 2.44 ft (mean depth was 1.36 ft). The reach-averaged water velocity was 0.28 feet per second. The system generally flows east from the Butternut aqueduct to where it merges with the Erie Canal.
Water-quality data were collected concurrently with the bathymetric survey (during the spring of 2018) to characterize changes in water quality along the length of the canal. A Yellow Springs Instruments 6920 V2 multiparameter water-quality monitor was mounted on the side of the boat at a depth of about 1.0 ft below the water surface. The multiparameter water-quality monitor measured dissolved oxygen, water temperature, specific conductance, pH, and turbidity at 60-second intervals. Maps of dissolved oxygen, water temperature, specific conductance, pH, and turbidity were created using ArcGIS methods described in Foster and others (2016) to aid in visually representing the water-quality parameters throughout the length of the canal.
Measured dissolved-oxygen concentrations ranged from 11.7 to 15.8 milligrams per liter (mg/L), with no clear pattern along the study reach. The highest concentrations of dissolved oxygen (greater than 15.0 mg/L) were found between Canastota and Cowaselon Creeks, where field observations also noted the highest amounts of submerged aquatic vegetation. This reach of notably higher amounts of submerged aquatic vegetation is of particular interest considering that heavy aquatic-plant growth is one of the adverse conditions affecting flow and diminishing the water quality of the canal. Measured specific conductance ranged from 234 to 2,202 microsiemens per centimeter at 25 degrees Celsius. Specific conductance generally decreased downstream. High specific-conductance values measured upstream from the hamlet of Kirkville in Manlius, N.Y. may be caused by road salts being flushed into the canal through the Butternut and Limestone feeder system from recent stormwater runoff. Measured pH ranged from 7.82 to 8.73 and generally increased downstream with some variations along the length of the canal. Downstream increases in pH are possibly a result of increasing amounts of aquatic vegetation. Measured turbidity values ranged from 0 to 9.5 formazin nephelometric units. Canal turbidity was highest near inflows from feeder and tributary inputs transporting sediment in stormwater runoff into the canal during the time of survey.
The canal infrastructure was documented in a separate set of infrastructure-focused inspections on November 21–22, 2019. These descriptive and qualitative inspections were meant to provide a basic assessment of the presence and general condition of all in-flow and out-flow structures that determine the elevation of the water surface in the canal system. These inspections found that the feeder system, designed to bring water into the canal, does not deliver flow when the creeks supplying water to those feeders are at base flow, but do bring water into the system when flows in the feeder creeks are elevated. A recent report provides an example of repair work completed on the Chittenango feeder to improve flow through the feeder into the canal. Meadow Brook and Pools Brook, two nonregulated tributaries, consistently delivered flow to the canal. Outfalls where canal water discharges into nearby creeks were sealed in the Butternut and Limestone aqueducts. Outfalls in the Chittenango, Cowaselon, and Durhamville aqueducts were found with flashboards installed at an elevation where water was discharging from the canal. These structures could accept more flashboards to raise the canal water surface further with the potential to convey flow farther down the system.
The general condition of the canal channel was documented during the time of the bathymetric survey. The channel was found open and navigable between Butternut aqueduct and Chittenago aqueduct. Farther east, an increasing number of downed trees and vegetation affected flow and made navigation by boat difficult until the flow reached the Durhamville aqueduct. North of the Durhamville aqueduct, numerous downed trees and an increased density of aquatic vegetation limited navigation by boat and retarded flow.
The bathymetric, velocity, and water-quality survey data are publicly available. The data can be found online as a separate data release (Wernly and Welk, 2022).
References Cited
Doran, E., 2009, Historic dam in Fayetteville collapses: Syracuse.com, September 25, 2009, accessed December 3, 2019, at https://www.syracuse.com/news/2009/09/historic_dam_in_fayetteville_c.html.
Esri, 2019, ArcGIS: Esri website, accessed November 1, 2019, at https://www.esri.com/software/arcgis/.
Esri, 2020, How topo to raster works: Esri web page, accessed June 5, 2020, at https://pro.arcgis.com/en/pro-app/latest/tool-reference/3d-analyst/how-topo-to-raster-works.htm.
Evenson, E.J., Orndorff, R.C., Blome, C.D., Böhlke, J.K., Hershberger, P.K., Langenheim, V.E., McCabe, G.J., Morlock, S.E., Reeves, H.W., Verdin, J.P., Weyers, H.S., and Wood, T.M., 2013, U.S. Geological Survey water science strategy—Observing, understanding, predicting, and delivering water science to the Nation: U.S. Geological Survey Circular 1383–G, 49 p. [Also available at https://doi.org/10.3133/cir1383G.]
Finch, R.G., 1925, The story of the New York State canals—Historical and commercial information: Albany, N.Y, New York State Canal Corporation 27 p, accessed March 1, 2018, at https://canals.ny.gov/history/finch_history.pdf.
Foster, G.M., Graham, J.L., Williams, T.J., and King, L.R., 2016, Spatiotemporal variability of inorganic nutrients during wastewater effluent dominated streamflow conditions in Indian Creek, Johnson County, Kansas, 2012–15: U.S. Geological Survey Scientific Investigations Report 2016–5147, 37 p, 4 apps, accessed August 29, 2019, at https://doi.org/10.3133/sir20165147.
Kenney, T.A., 2010, Levels at gaging stations: U.S. Geological Survey Techniques and Methods, book 3, chap. A19, 60 p, accessed April 1, 2018, at https://doi.org/10.3133/tm3A19. [Supersedes U.S. Geological Survey Techniques of Water-Resources Investigations, book 3, chap. A19, released in 1990.]
Michaud, J.P., 1991, Lakes, chap. 2 of McAuliffe, M.B, ed, 1991, A citizen’s guide to understanding and monitoring lakes and streams: Washington State University, accessed April 9, 2021, at https://apps.ecology.wa.gov/publications/documents/94149.pdf.
Mueller, D.S., Wagner, C.R., Rehmel, M.S., Oberg, K.A., and Rainville, F., 2013, Measuring discharge with acoustic Doppler current profilers from a moving boat (ver. 2.0, December 2013): U.S. Geological Survey Techniques and Methods, book 3, chap. A22, 95 p, accessed April 1, 2018, at https://doi.org/10.3133/tm3A22. [Supersedes the previous version, revised in February, 2009.]
National Oceanic and Atmospheric Administration, 2019, OPUS—Online positioning user service: National Oceanic and Atmospheric Administration website, accessed November, 2019, at https://www.ngs.noaa.gov/OPUS/.
National Oceanic and Atmospheric Administration, 2022, Finding survey marks and datasheets: National Oceanic and Atmospheric Administration website, accessed April 25, 2019, at https://geodesy.noaa.gov/datasheets/index.shtml.
Rydlund, P.H., Jr., and Densmore, B.K., 2012, Methods of practice and guidelines for using survey-grade global navigation satellite systems (GNSS) to establish vertical datum in the United States Geological Survey: U.S. Geological Survey Techniques and Methods, book 11, chap. D1, 102 p, accessed April 1, 2018, at https://doi.org/10.3133/tm11D1.
Sauer, V.B., and Turnipseed, D.P., 2010, Stage measurement at gaging stations: U.S. Geological Survey Techniques and Methods, book 3, chap. A7, 45 p, accessed April 1, 2018, at https://doi.org/10.3133/tm3A7. [Supersedes U.S. Geological Survey Techniques of Water-Resources Investigations, book 3, chap. A7, released in 1968.]
Sinokrot, B.A., and Stefan, H.G., 1993, Stream temperature dynamics—Measurements and modeling: Water Resources Research, v. 29, no. 7, p. 2299–2312, accessed April 13, 2021, at https://doi.org/10.1029/93WR00540.
SonTek, 2015a, RiverSurveyor LIVE (RSL): SonTek web page, accessed November 1, 2019, at http://www.sontek.com/softwaredetail.php?RiverSurveyor-LIVE-RSL-34.
SonTek, 2015b, RiverSurveyor S5 and M9: SonTek web page, accessed November 1, 2019, at http://www.sontek.com/productsdetail.php?RiverSurveyor-S5-M9-14.
Trimble, Inc, 2019, Trimble R8s—Integrated GNSS system: Trimble, Inc. web page, accessed November 1, 2019, at https://geospatial.trimble.com/products-and-solutions/trimble-r8s.
U.S. Army Corps of Engineers, 2013, Engineering and design—Hydrographic surveying: U.S. Army Corps of Engineers, Engineer Manual 1110-2-1003, variously paginated, accessed April 9, 2021, at https://www.publications.usace.army.mil/Portals/76/Publications/EngineerManuals/EM_1110-2-1003.pdf?ver=-VR9ILCMojaogWSxI5AILA%3d%3d. [Supersedes the previous version, released in 2002.]
U.S. Geological Survey, [variously dated], The national field manual for the collection of water-quality data, section A of Handbooks for water-resources investigations: U.S. Geological Survey Techniques of Water-Resources Investigations, book 9, 11 chaps. (A0–10), accessed April 9, 2021, at https://www.usgs.gov/mission-areas/water-resources/science/national-field-manual-collection-water-quality-data-nfm?qt-science_center_objects=0#qt-science_center_objects.
U.S. Geological Survey, 2019, Dissolved oxygen and water: U.S. Geological Survey web page, accessed November 1, 2019, at https://www.usgs.gov/special-topic/water-science-school/science/dissolved-oxygen-and-water?qt-science_center_objects=0#qt-science_center_objects.
U.S. Geological Survey, 2020a, USGS 04244000 Chittenango Creek near Chittenango NY: U.S. Geological Survey National Water Information System, accessed March 24, 2020, at https://waterdata.usgs.gov/nwis/uv?site_no=04244000
U.S. Geological Survey, 2020b, USGS 04243783 Cowaselon Creek at State Route 13 at Canastota NY: U.S. Geological Survey National Water Information System database, accessed March 24, 2020, at https://waterdata.usgs.gov/ny/nwis/uv?site_no=04243783.
U.S. Geological Survey, 2020c, USGS 04243500 Oneida Creek at Oneida NY: U.S. Geological Survey National Water Information System database, accessed March 24, 2020, at https://waterdata.usgs.gov/ny/nwis/uv?site_no=04243500.
U.S. Geological Survey, 2020d, USGS 04239000 Onondaga Creek at Dorwin Avenue, Syracuse NY: U.S. Geological Survey National Water Information System database, accessed March 24, 2020, at https://waterdata.usgs.gov/nwis/uv?site_no=04239000.
Wagner, R.J., Boulger, R.W., Jr, Oblinger, C.J., and Smith, B.A., 2006, Guidelines and standard procedures for continuous water-quality monitors—Station operation, record computation, and data reporting: U.S. Geological Survey Techniques and Methods, book 1, chap. D3, 96 p.[Also available at https://doi.org/10.3133/tm1D3.]
Wernly, J.F., and Welk, R.J., 2022, Geospatial dataset of the characterization of the bathymetry, hydrodynamics, water quality, infrastructure, and channel condition of the Old Erie Canal from DeWitt to its junction with the current Erie Canal in Verona, near Rome, New York, 2018–19: U.S. Geological Survey data release, https://doi.org/10.5066/P9QRL294.
Wilson, G.L., and Richards, J.M., 2006, Procedural documentation and accuracy assessment of bathymetric maps and area/capacity tables for small reservoirs: U.S. Geological Survey Scientific Investigations Report 2006–5208, 24 p, accessed April 9, 2021, at https://doi.org/10.3133/sir20065208.
Yellow Springs Instruments, Inc, 2012, 6-series multiparameter water quality sondes—User manual: Yellow Springs Instruments, Inc, 379 p. [Also available at https://www.ysi.com/file%20library/documents/manuals/069300-ysi-6-series-manual-revj.pdf].
Appendix 1. Old Erie Canal Benchmark Establishment Forms
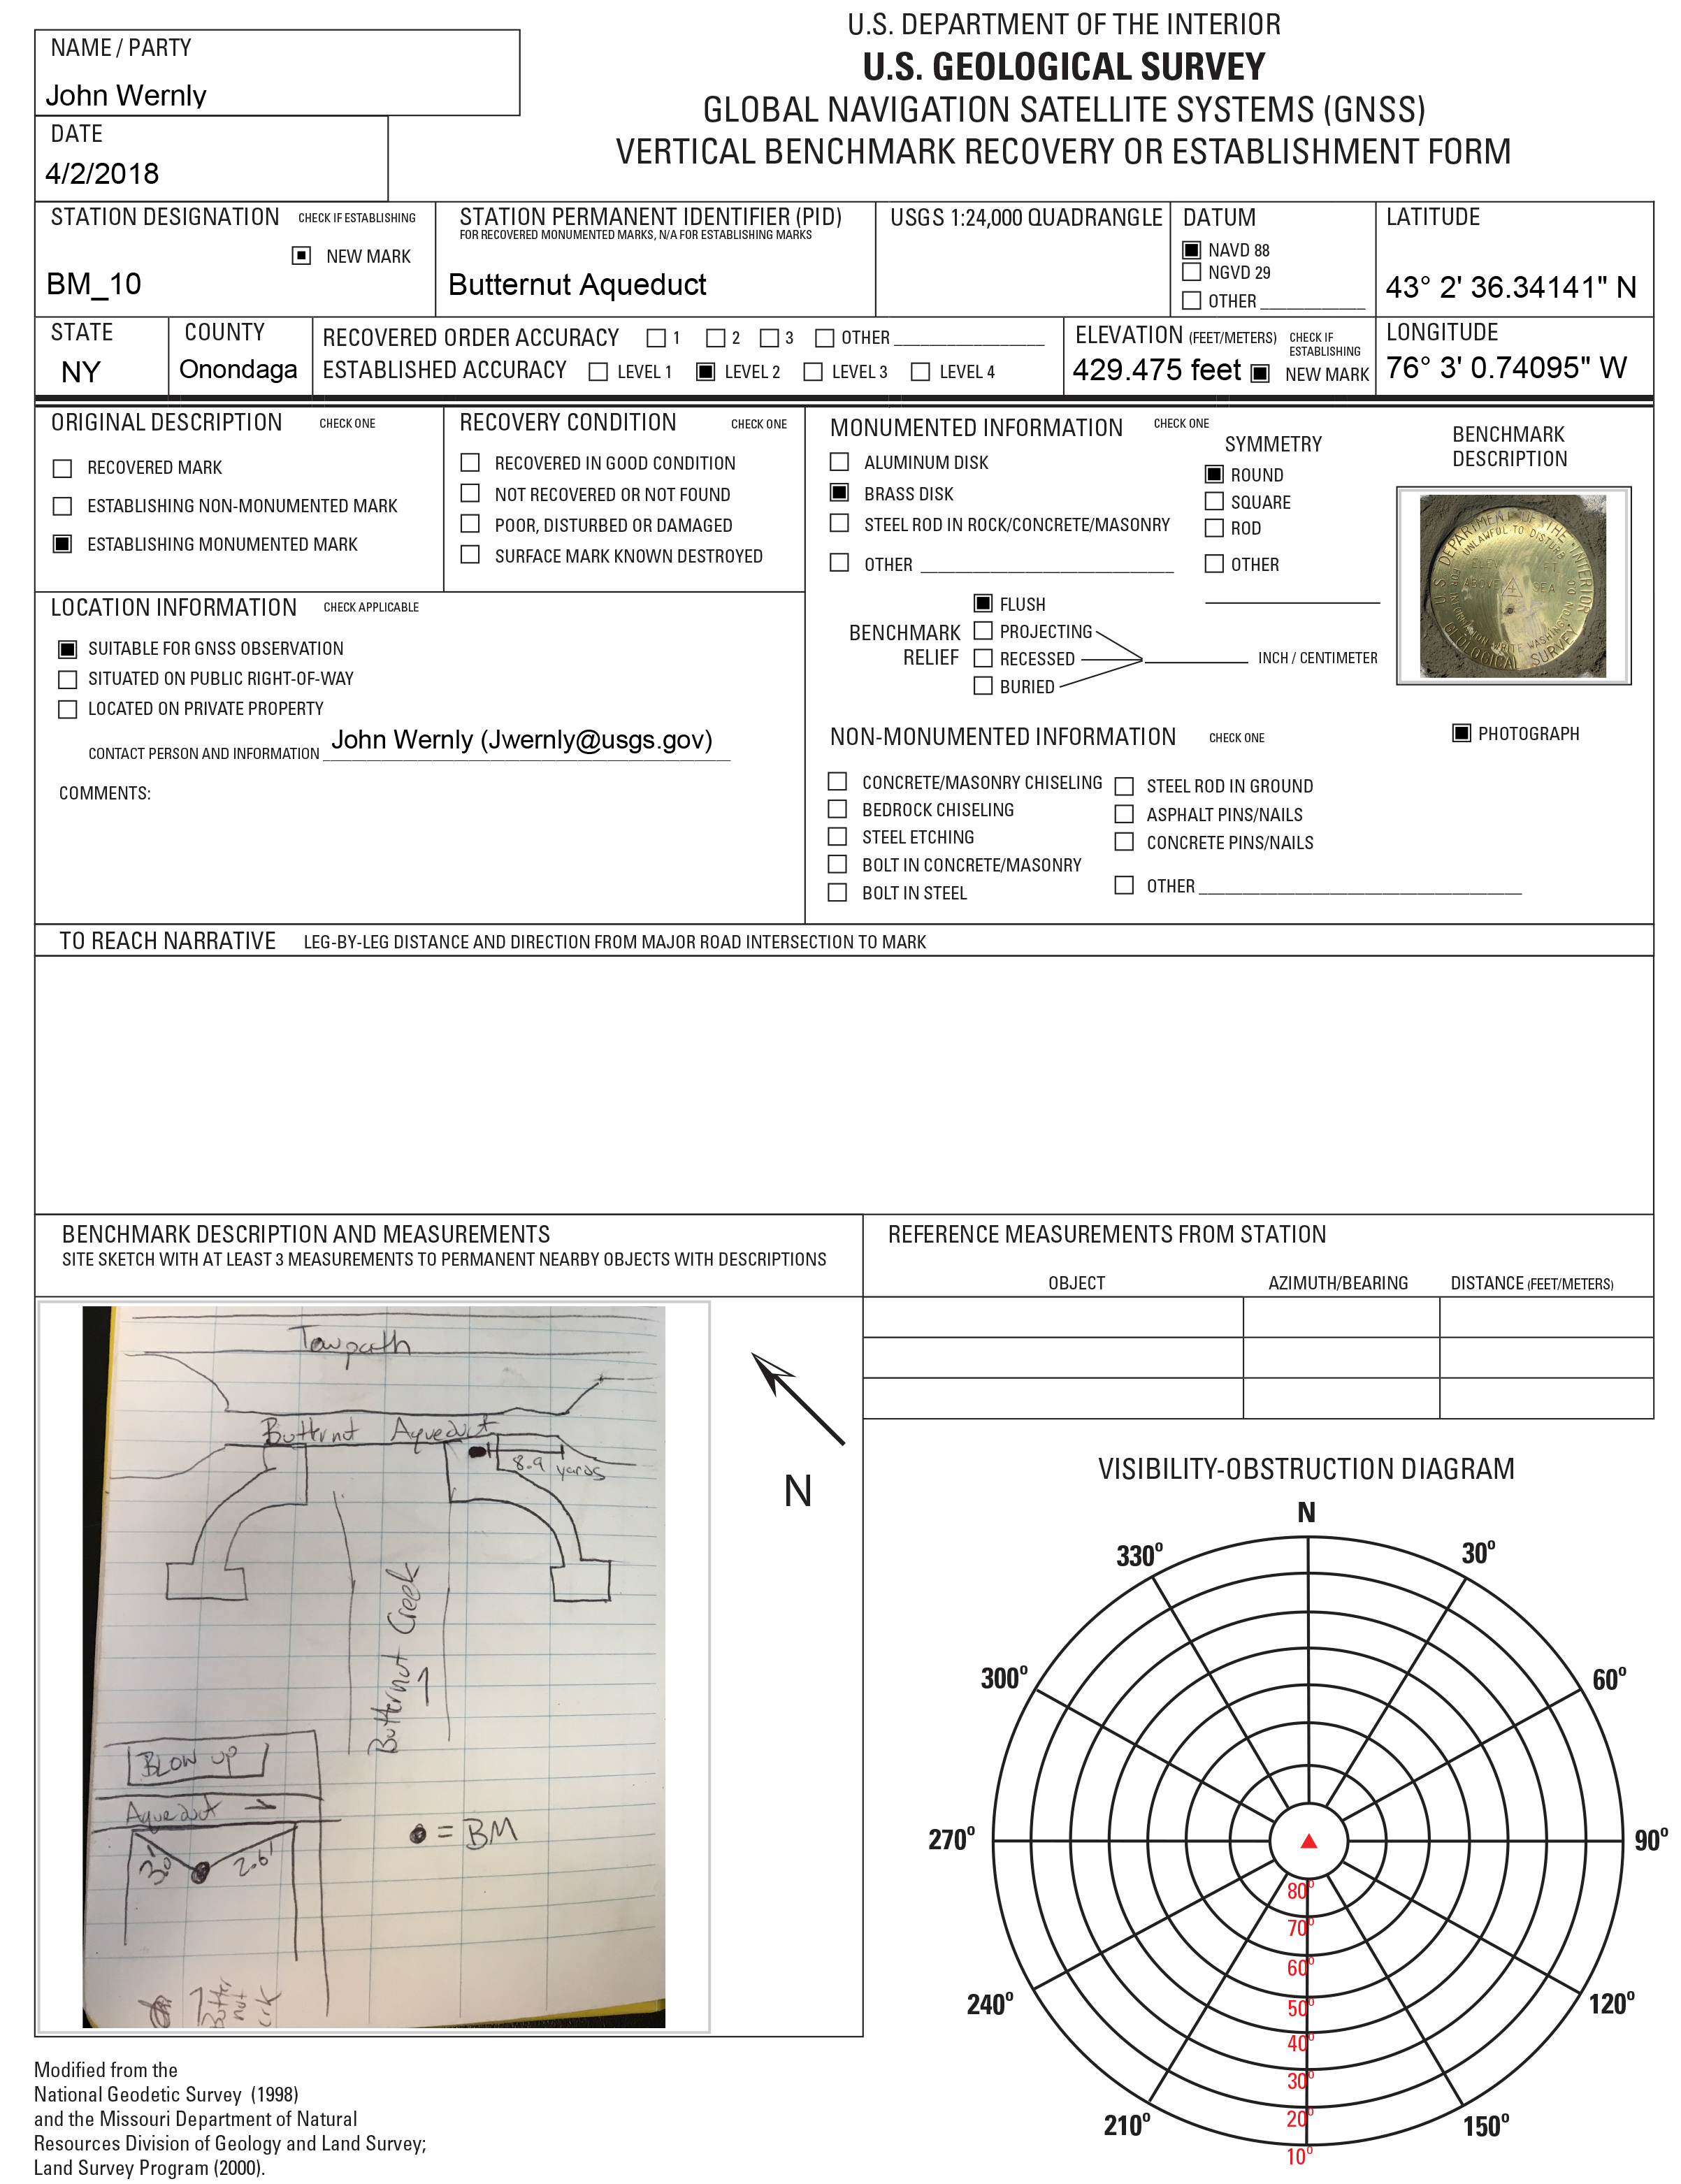
Vertical benchmark recovery or establishment form for BM_10, Butternut aqueduct.
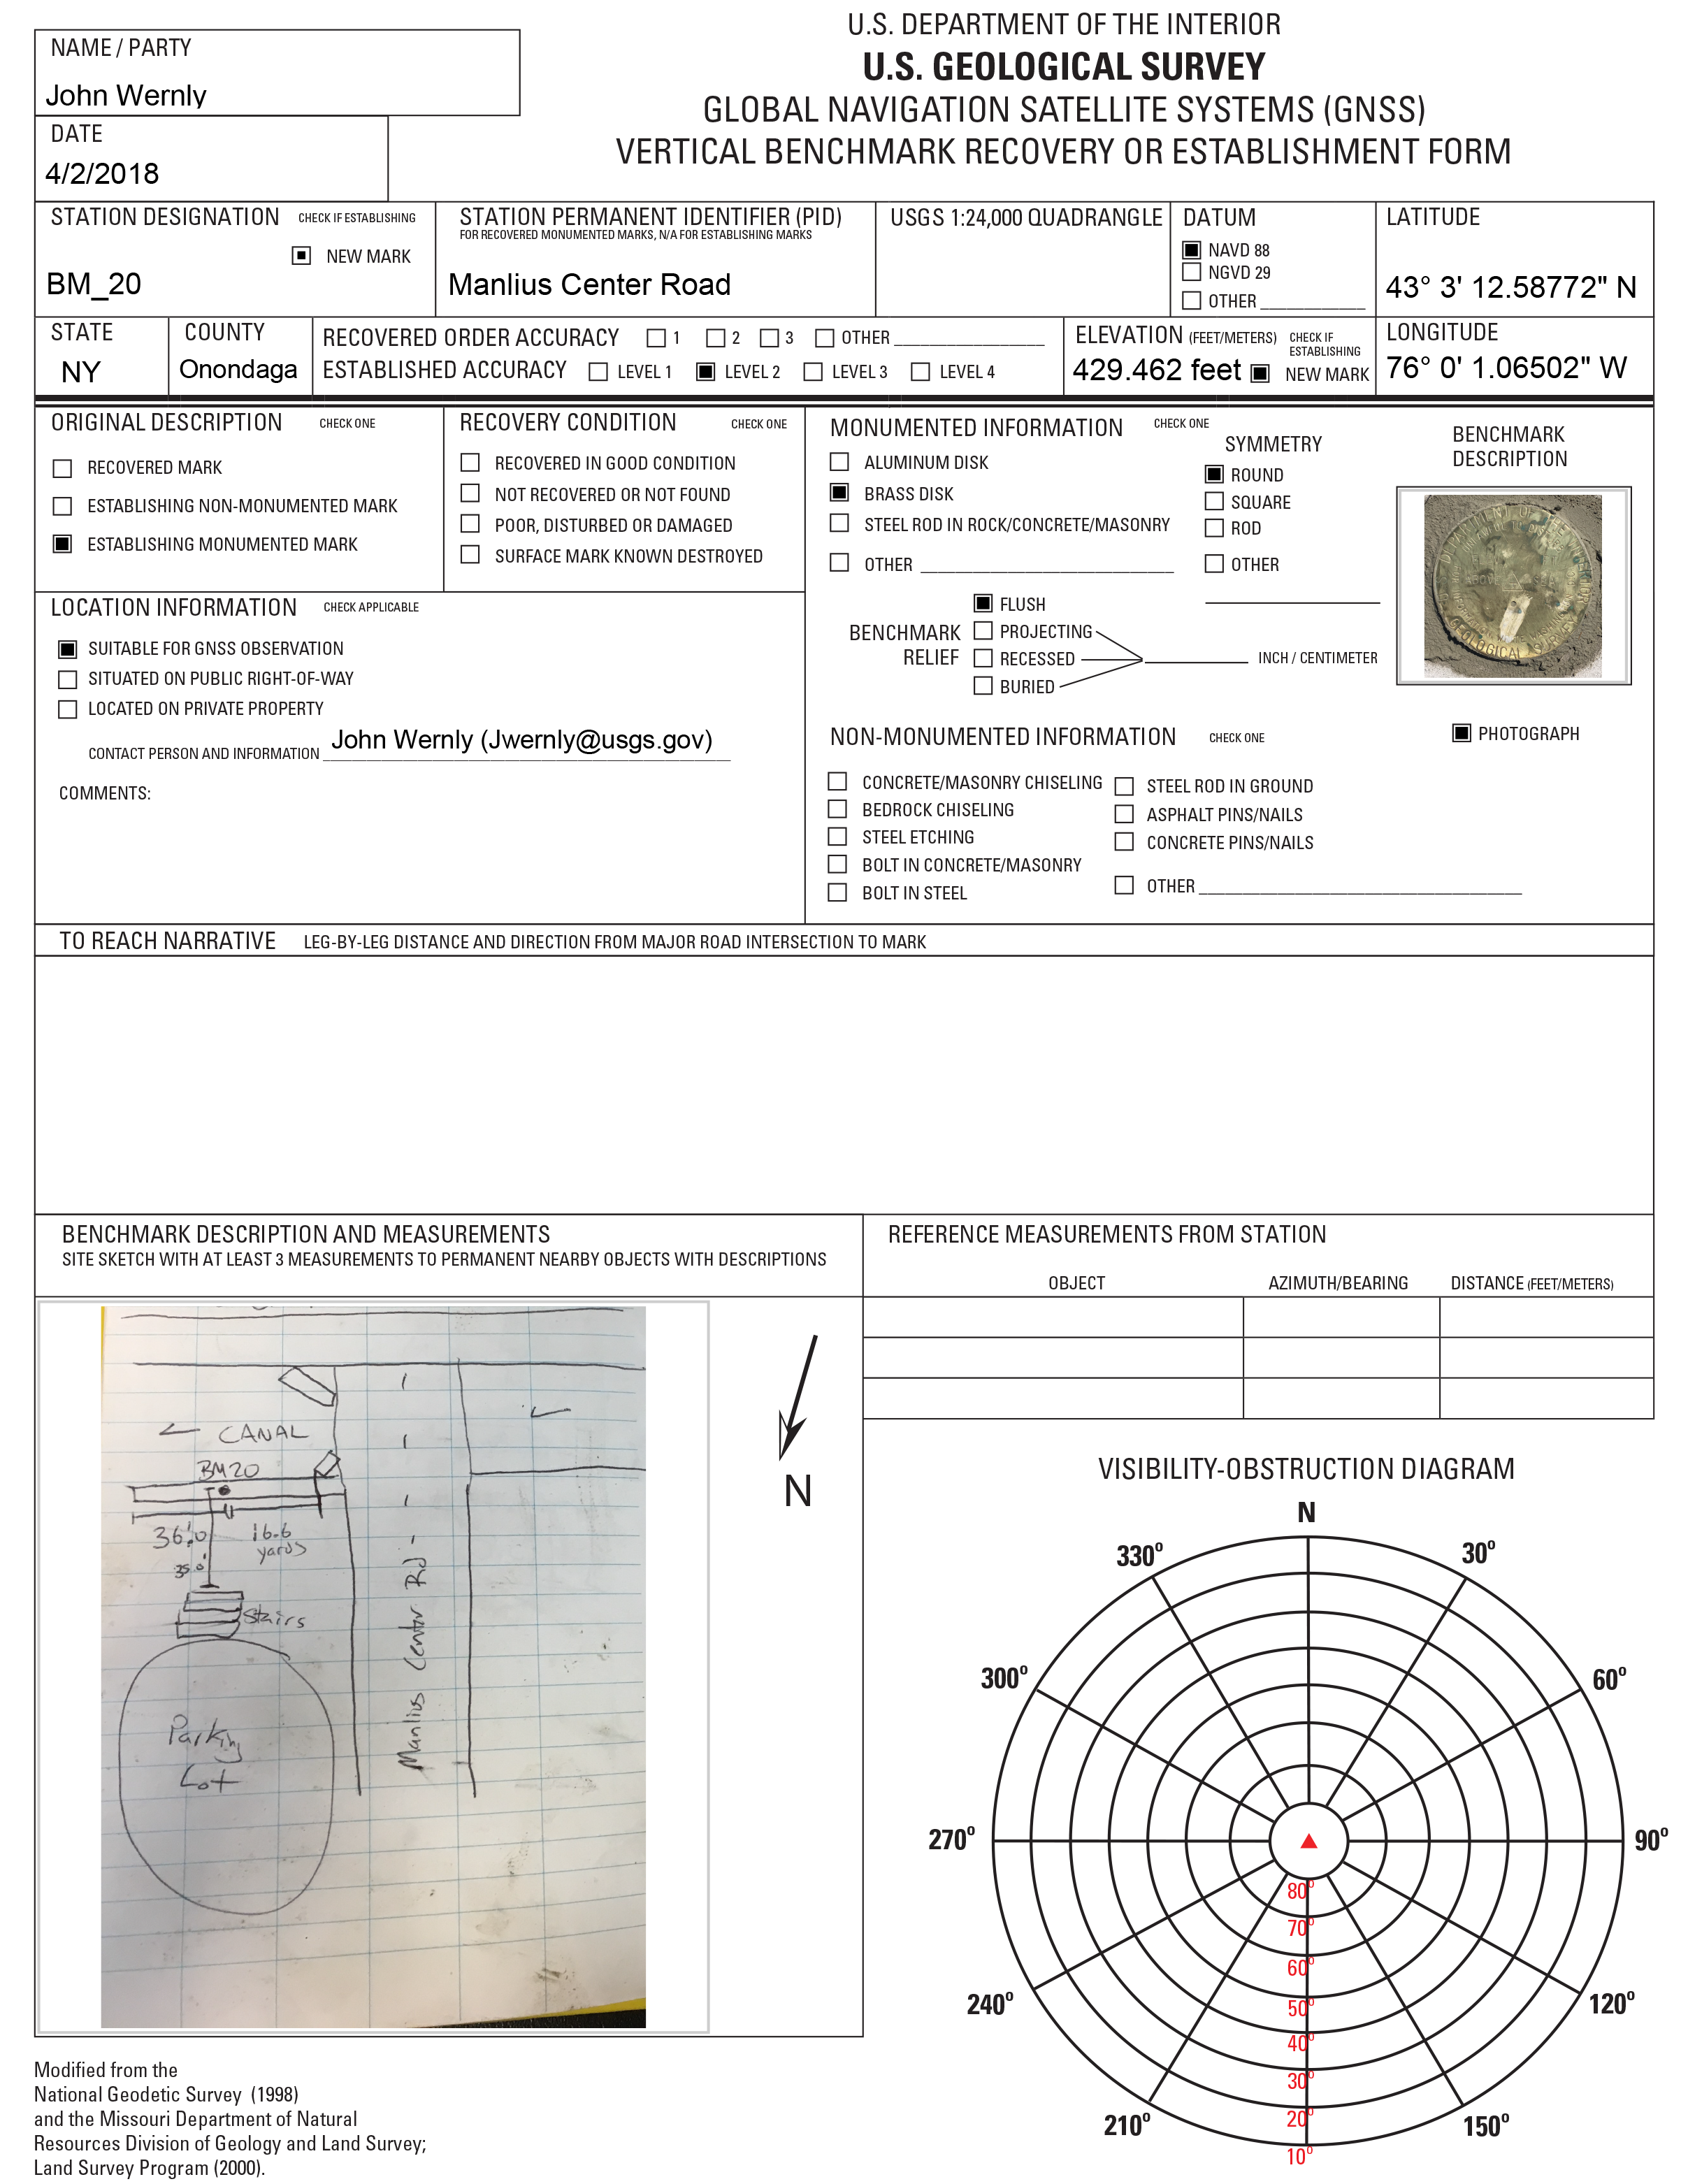
Vertical benchmark recovery or establishment form for BM_20, Manlius Center Road.
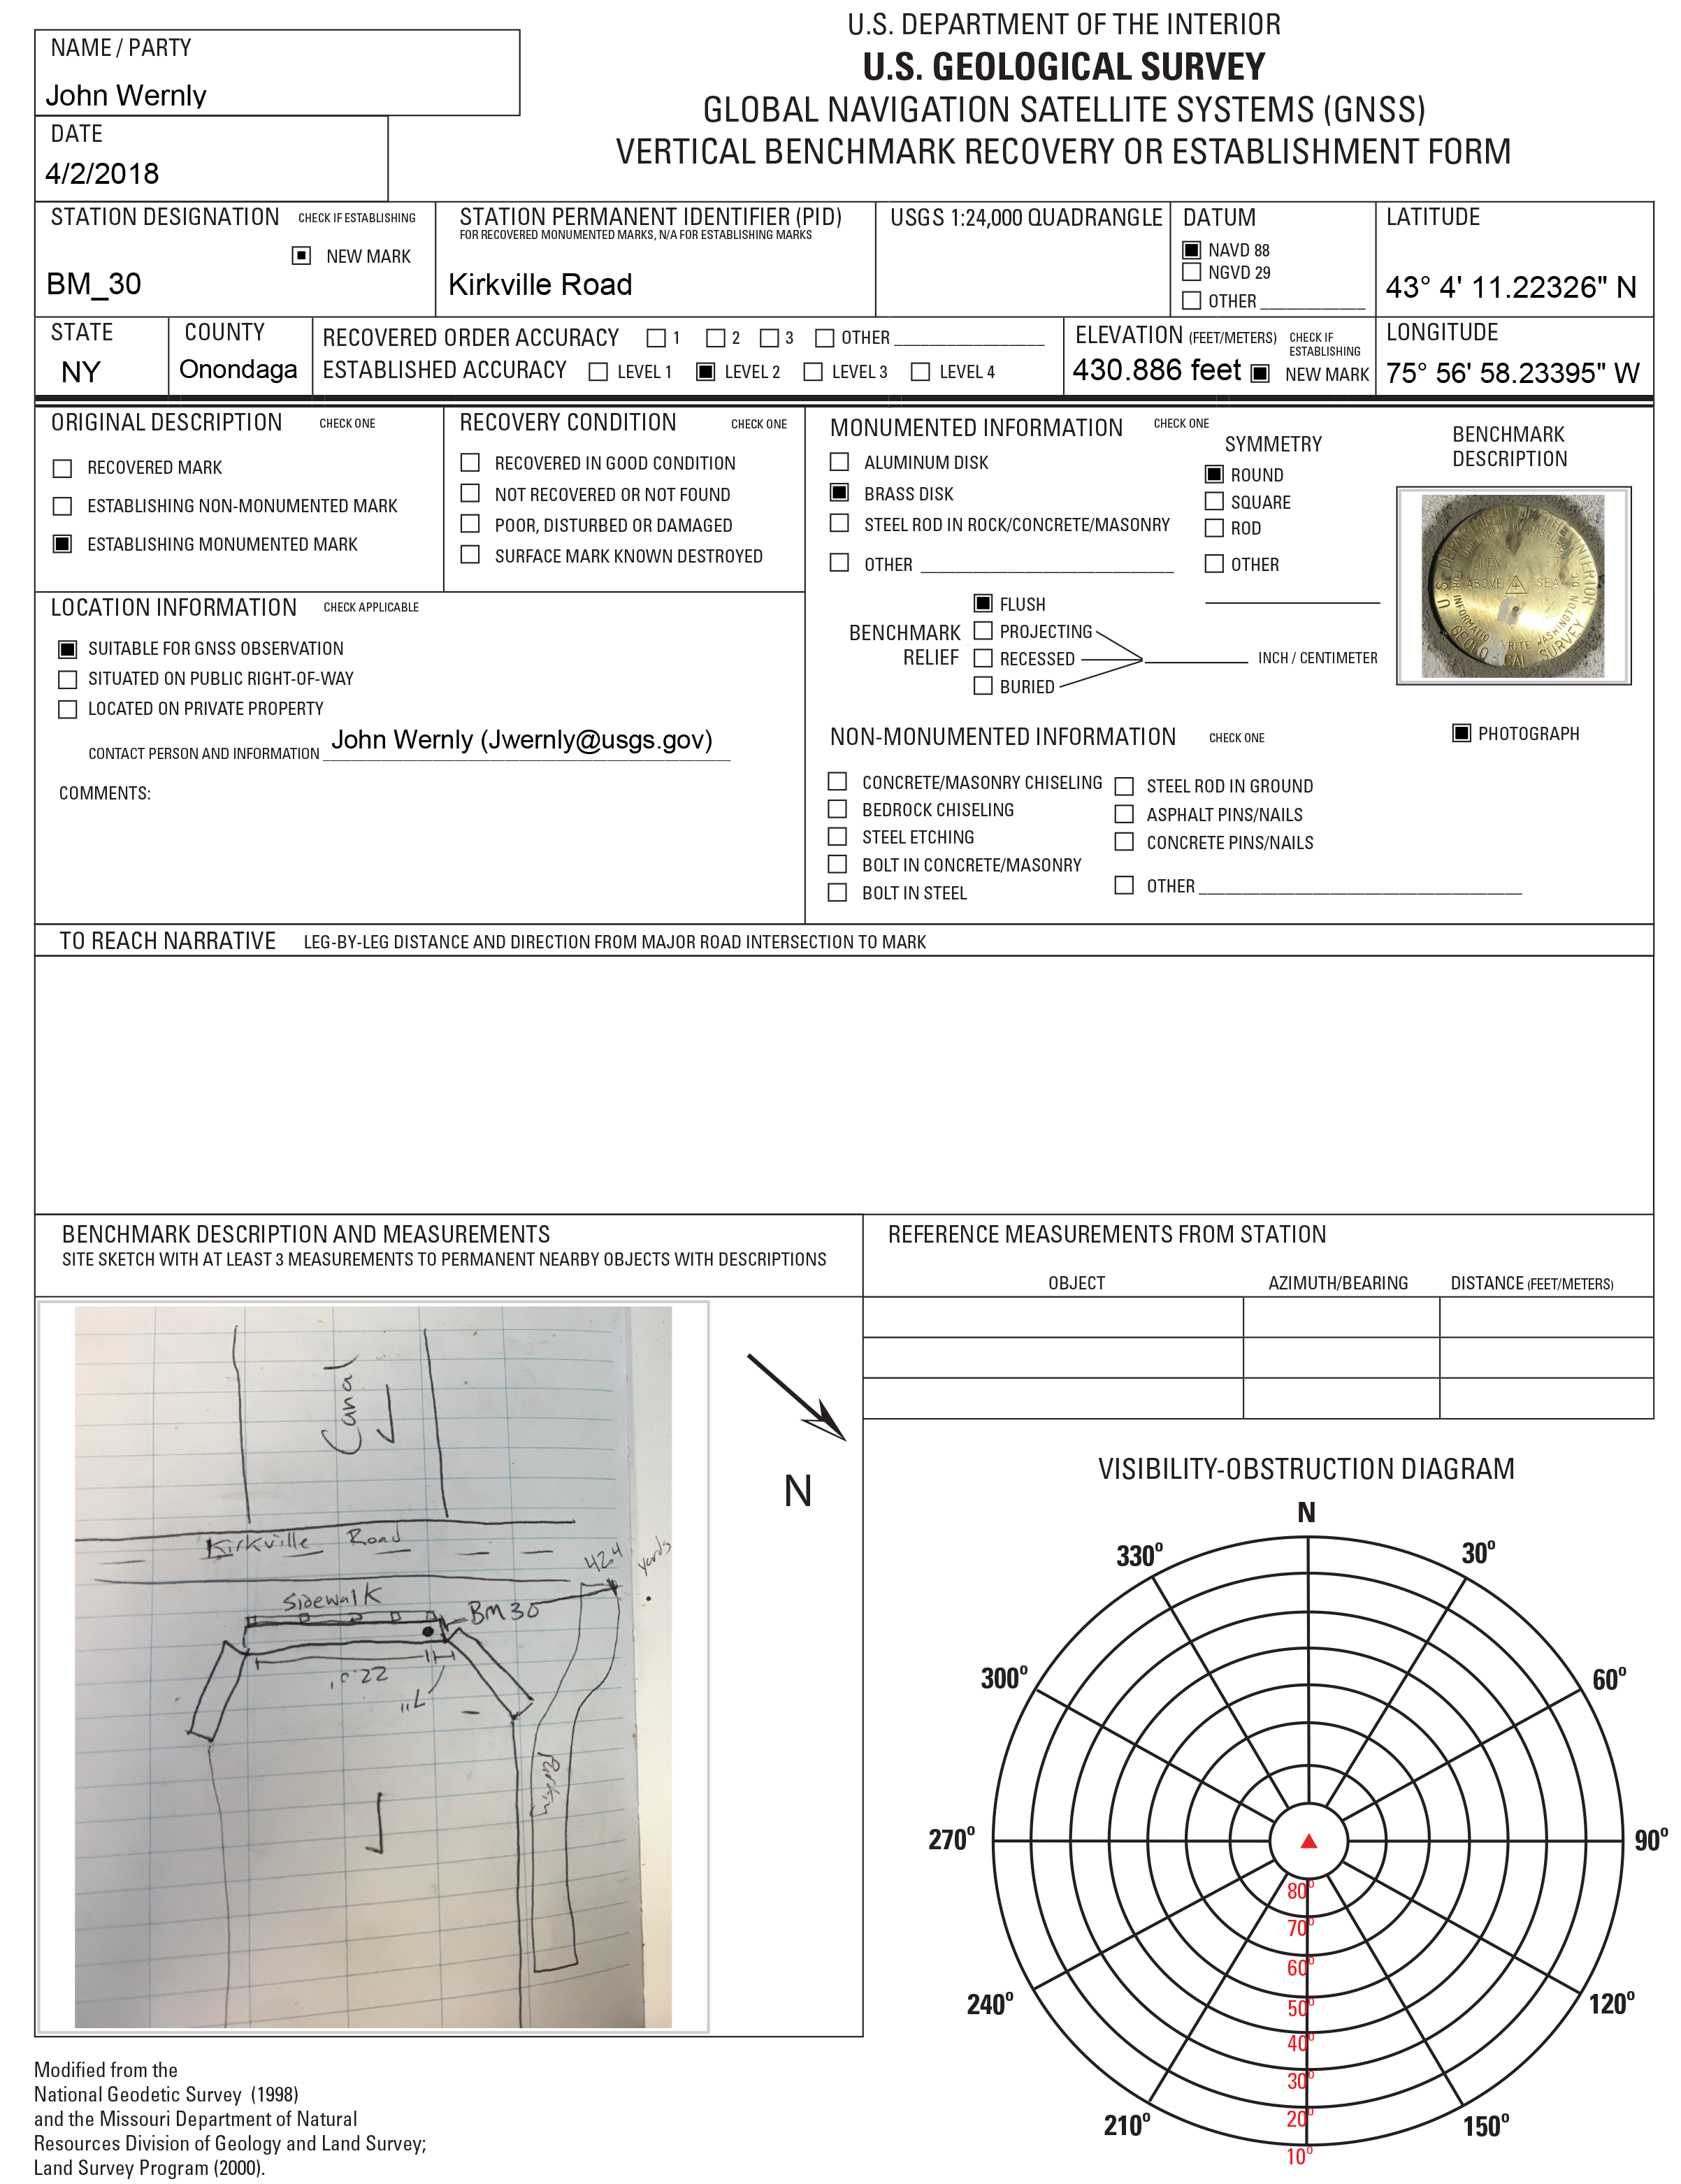
Vertical benchmark recovery or establishment form for BM_30, Kirkville Road.
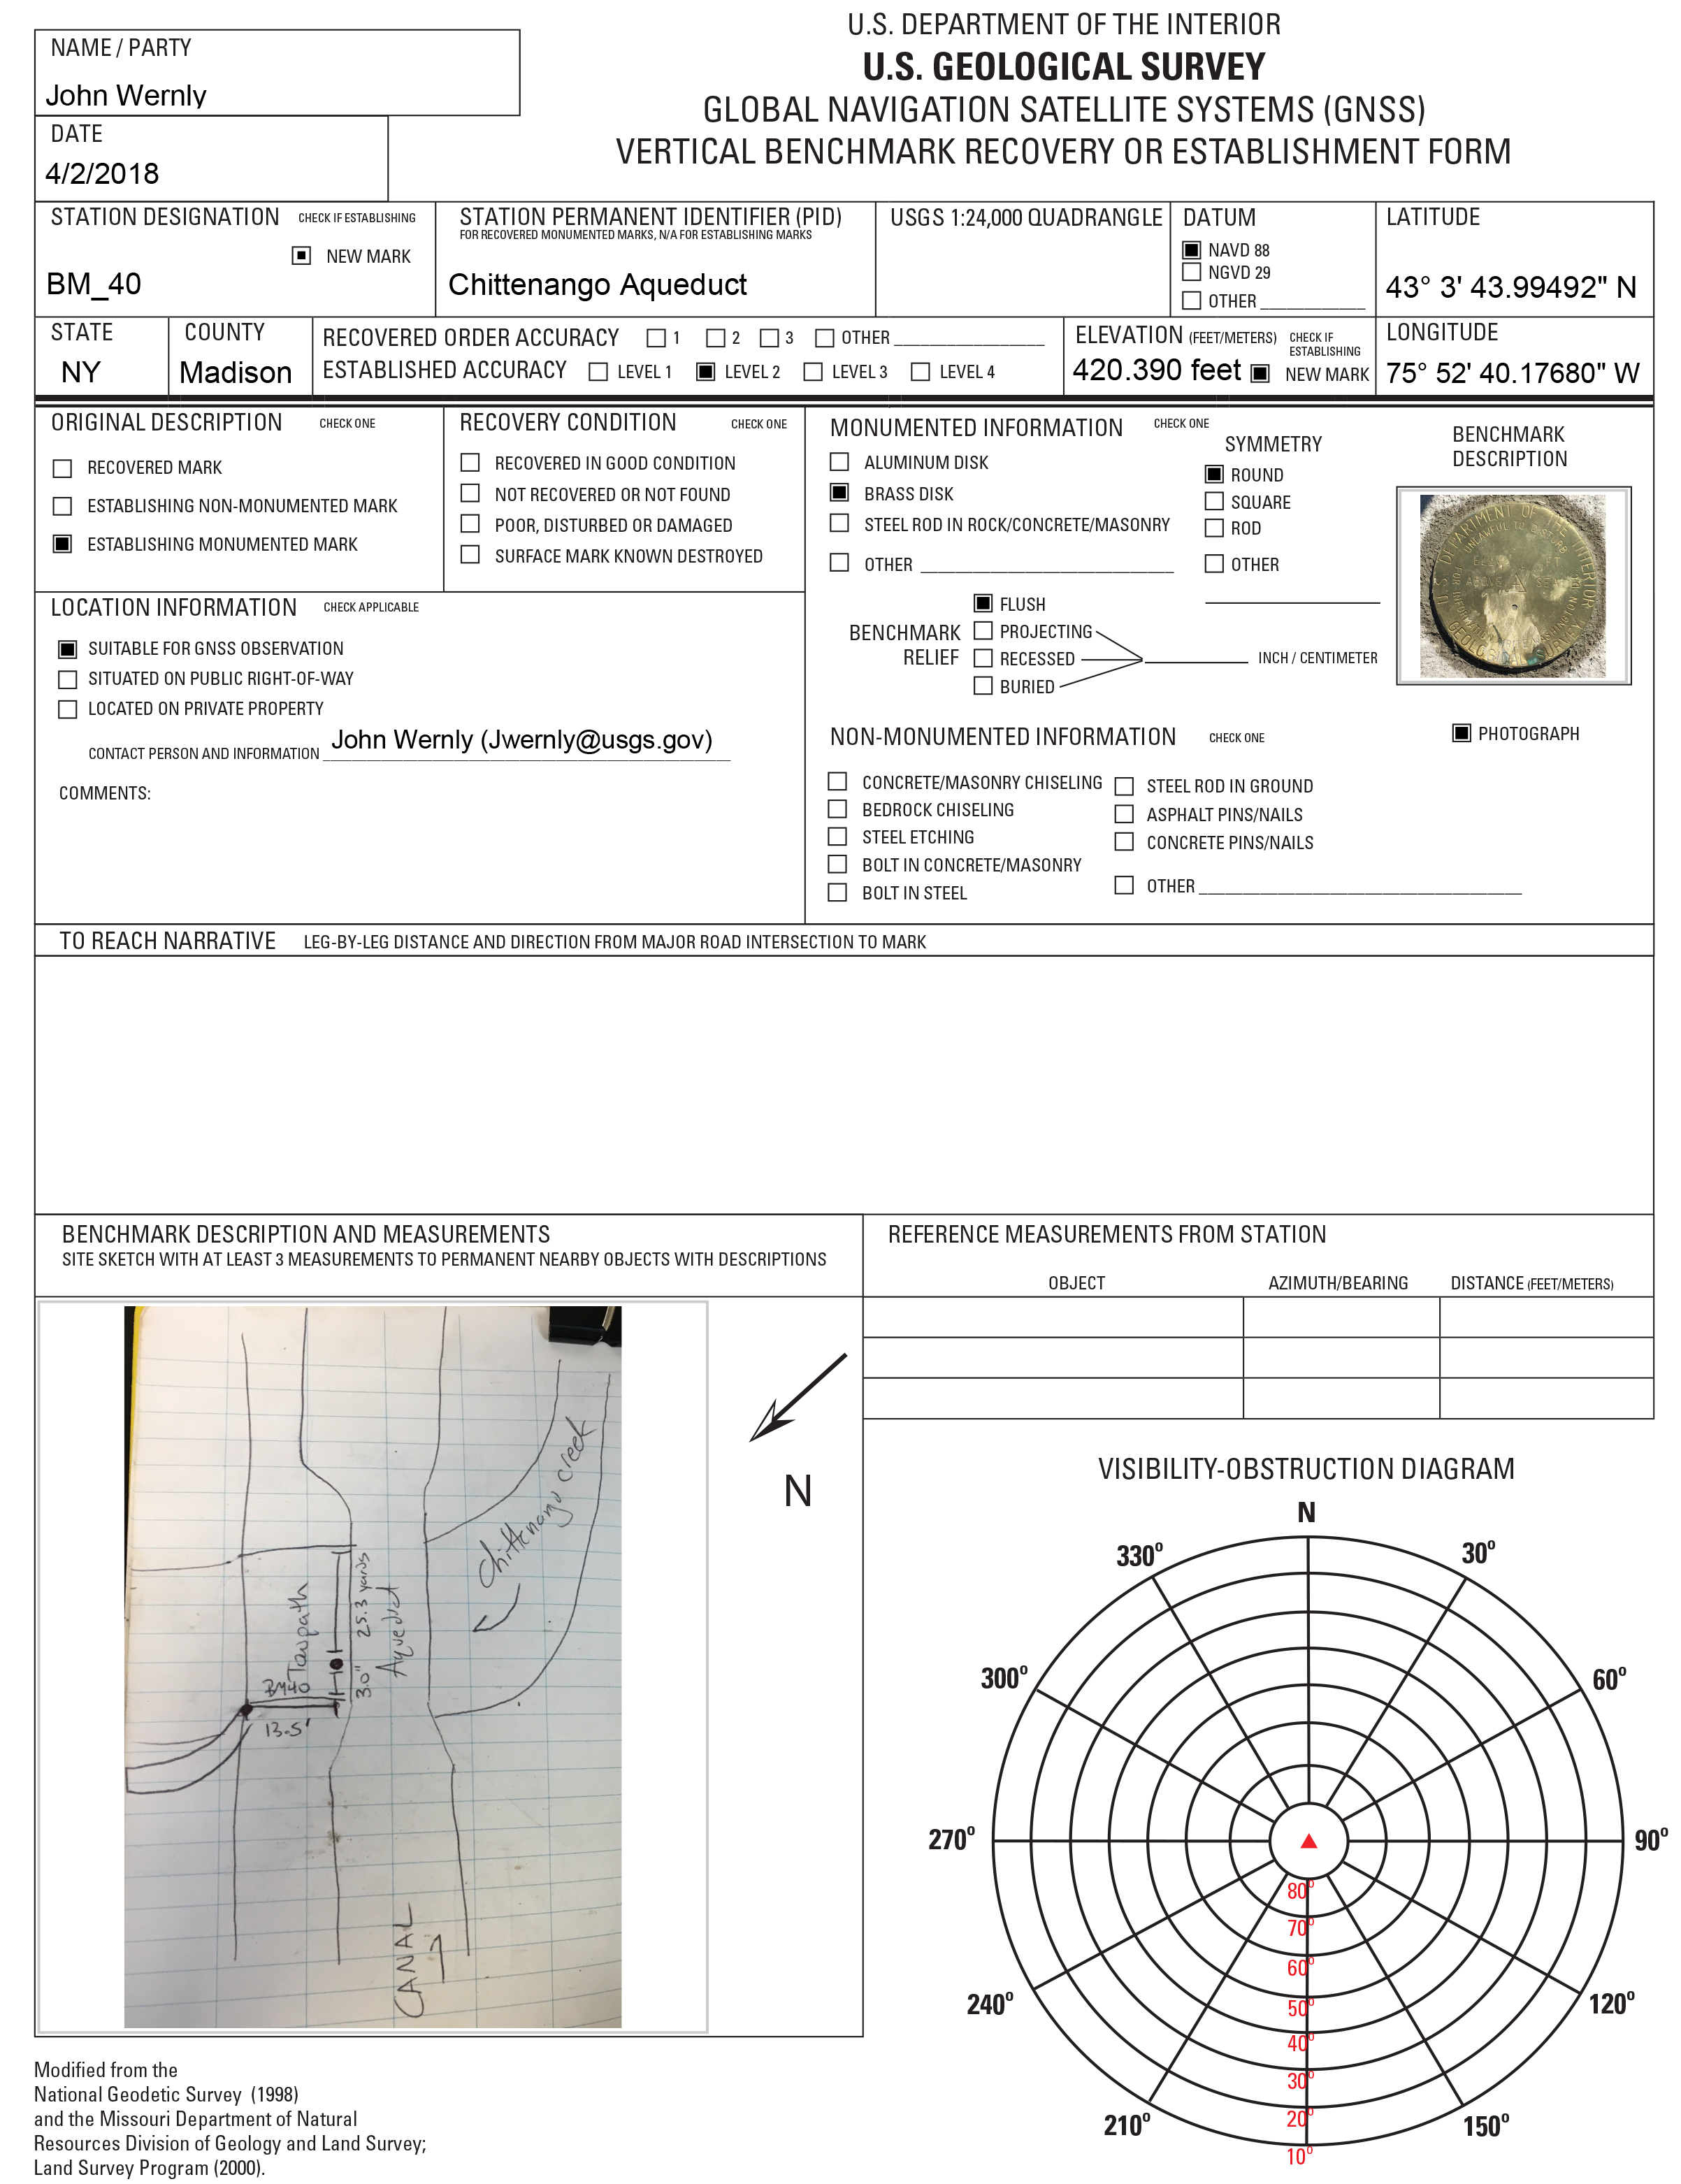
Vertical benchmark recovery or establishment form for BM_40, Chittenango aqueduct.
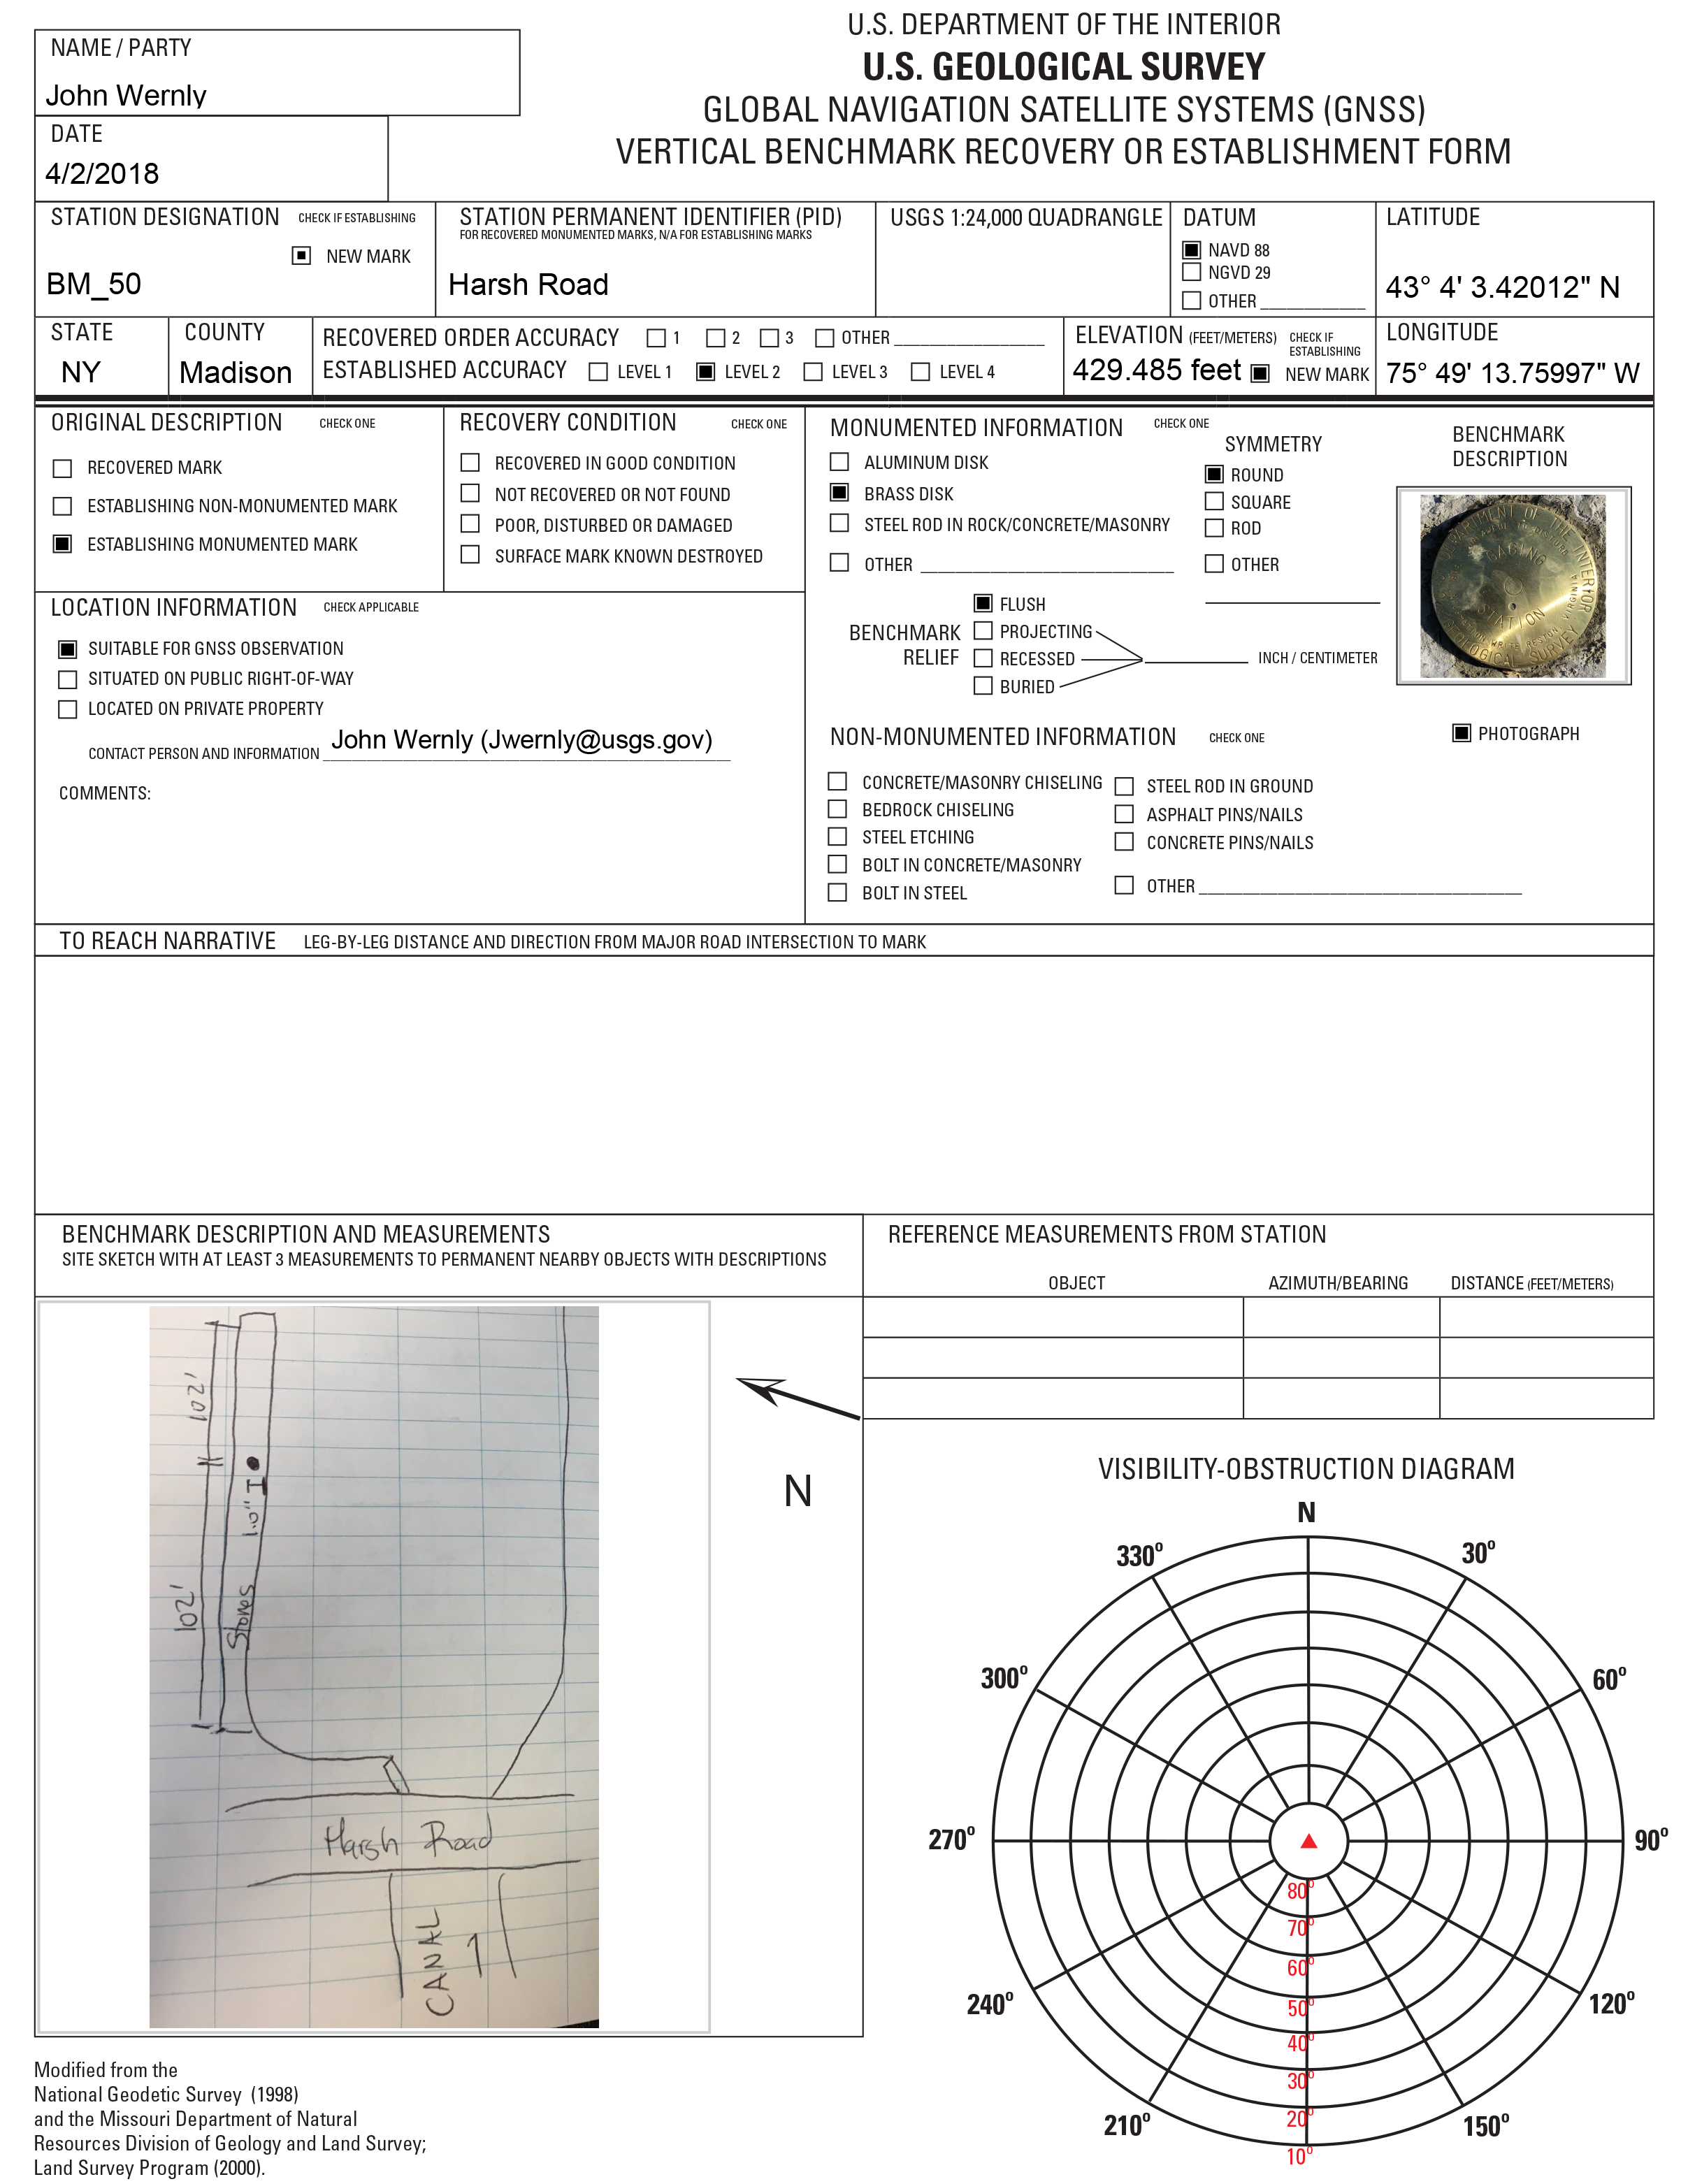
Vertical benchmark recovery or establishment form for BM_50, Harsh Road.
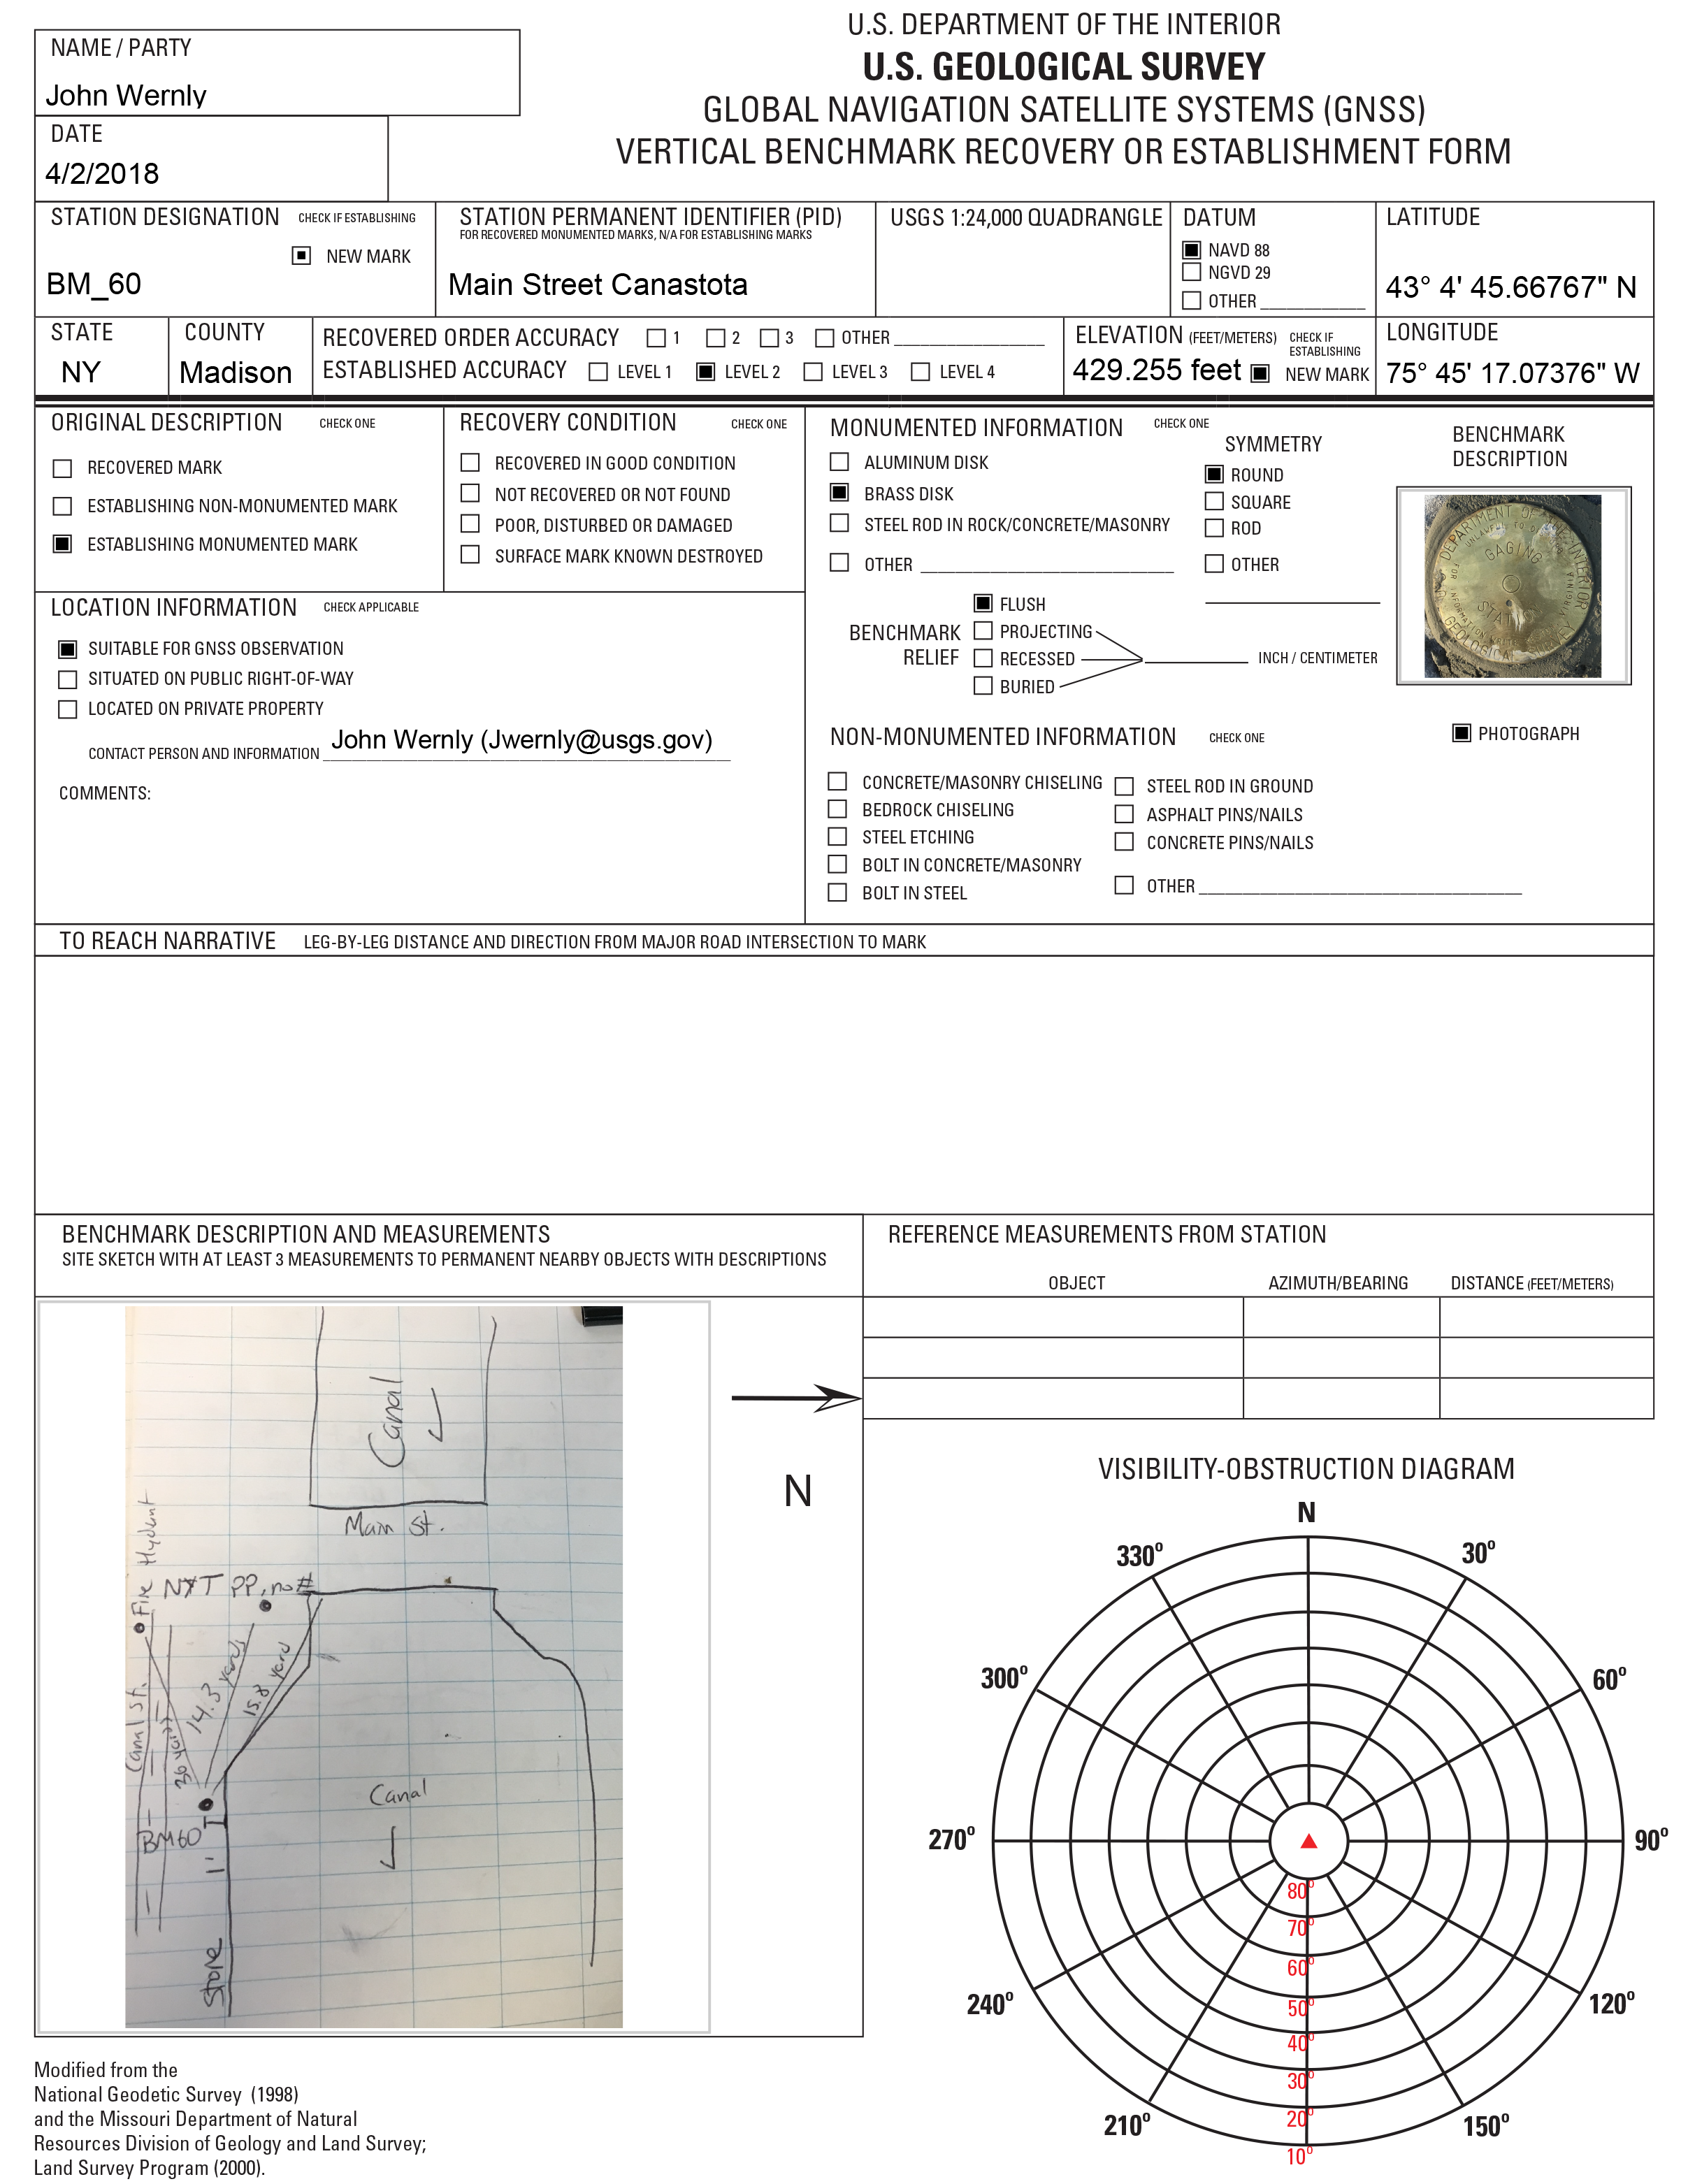
Vertical benchmark recovery or establishment form for BM_60, Main Street, Canastota.
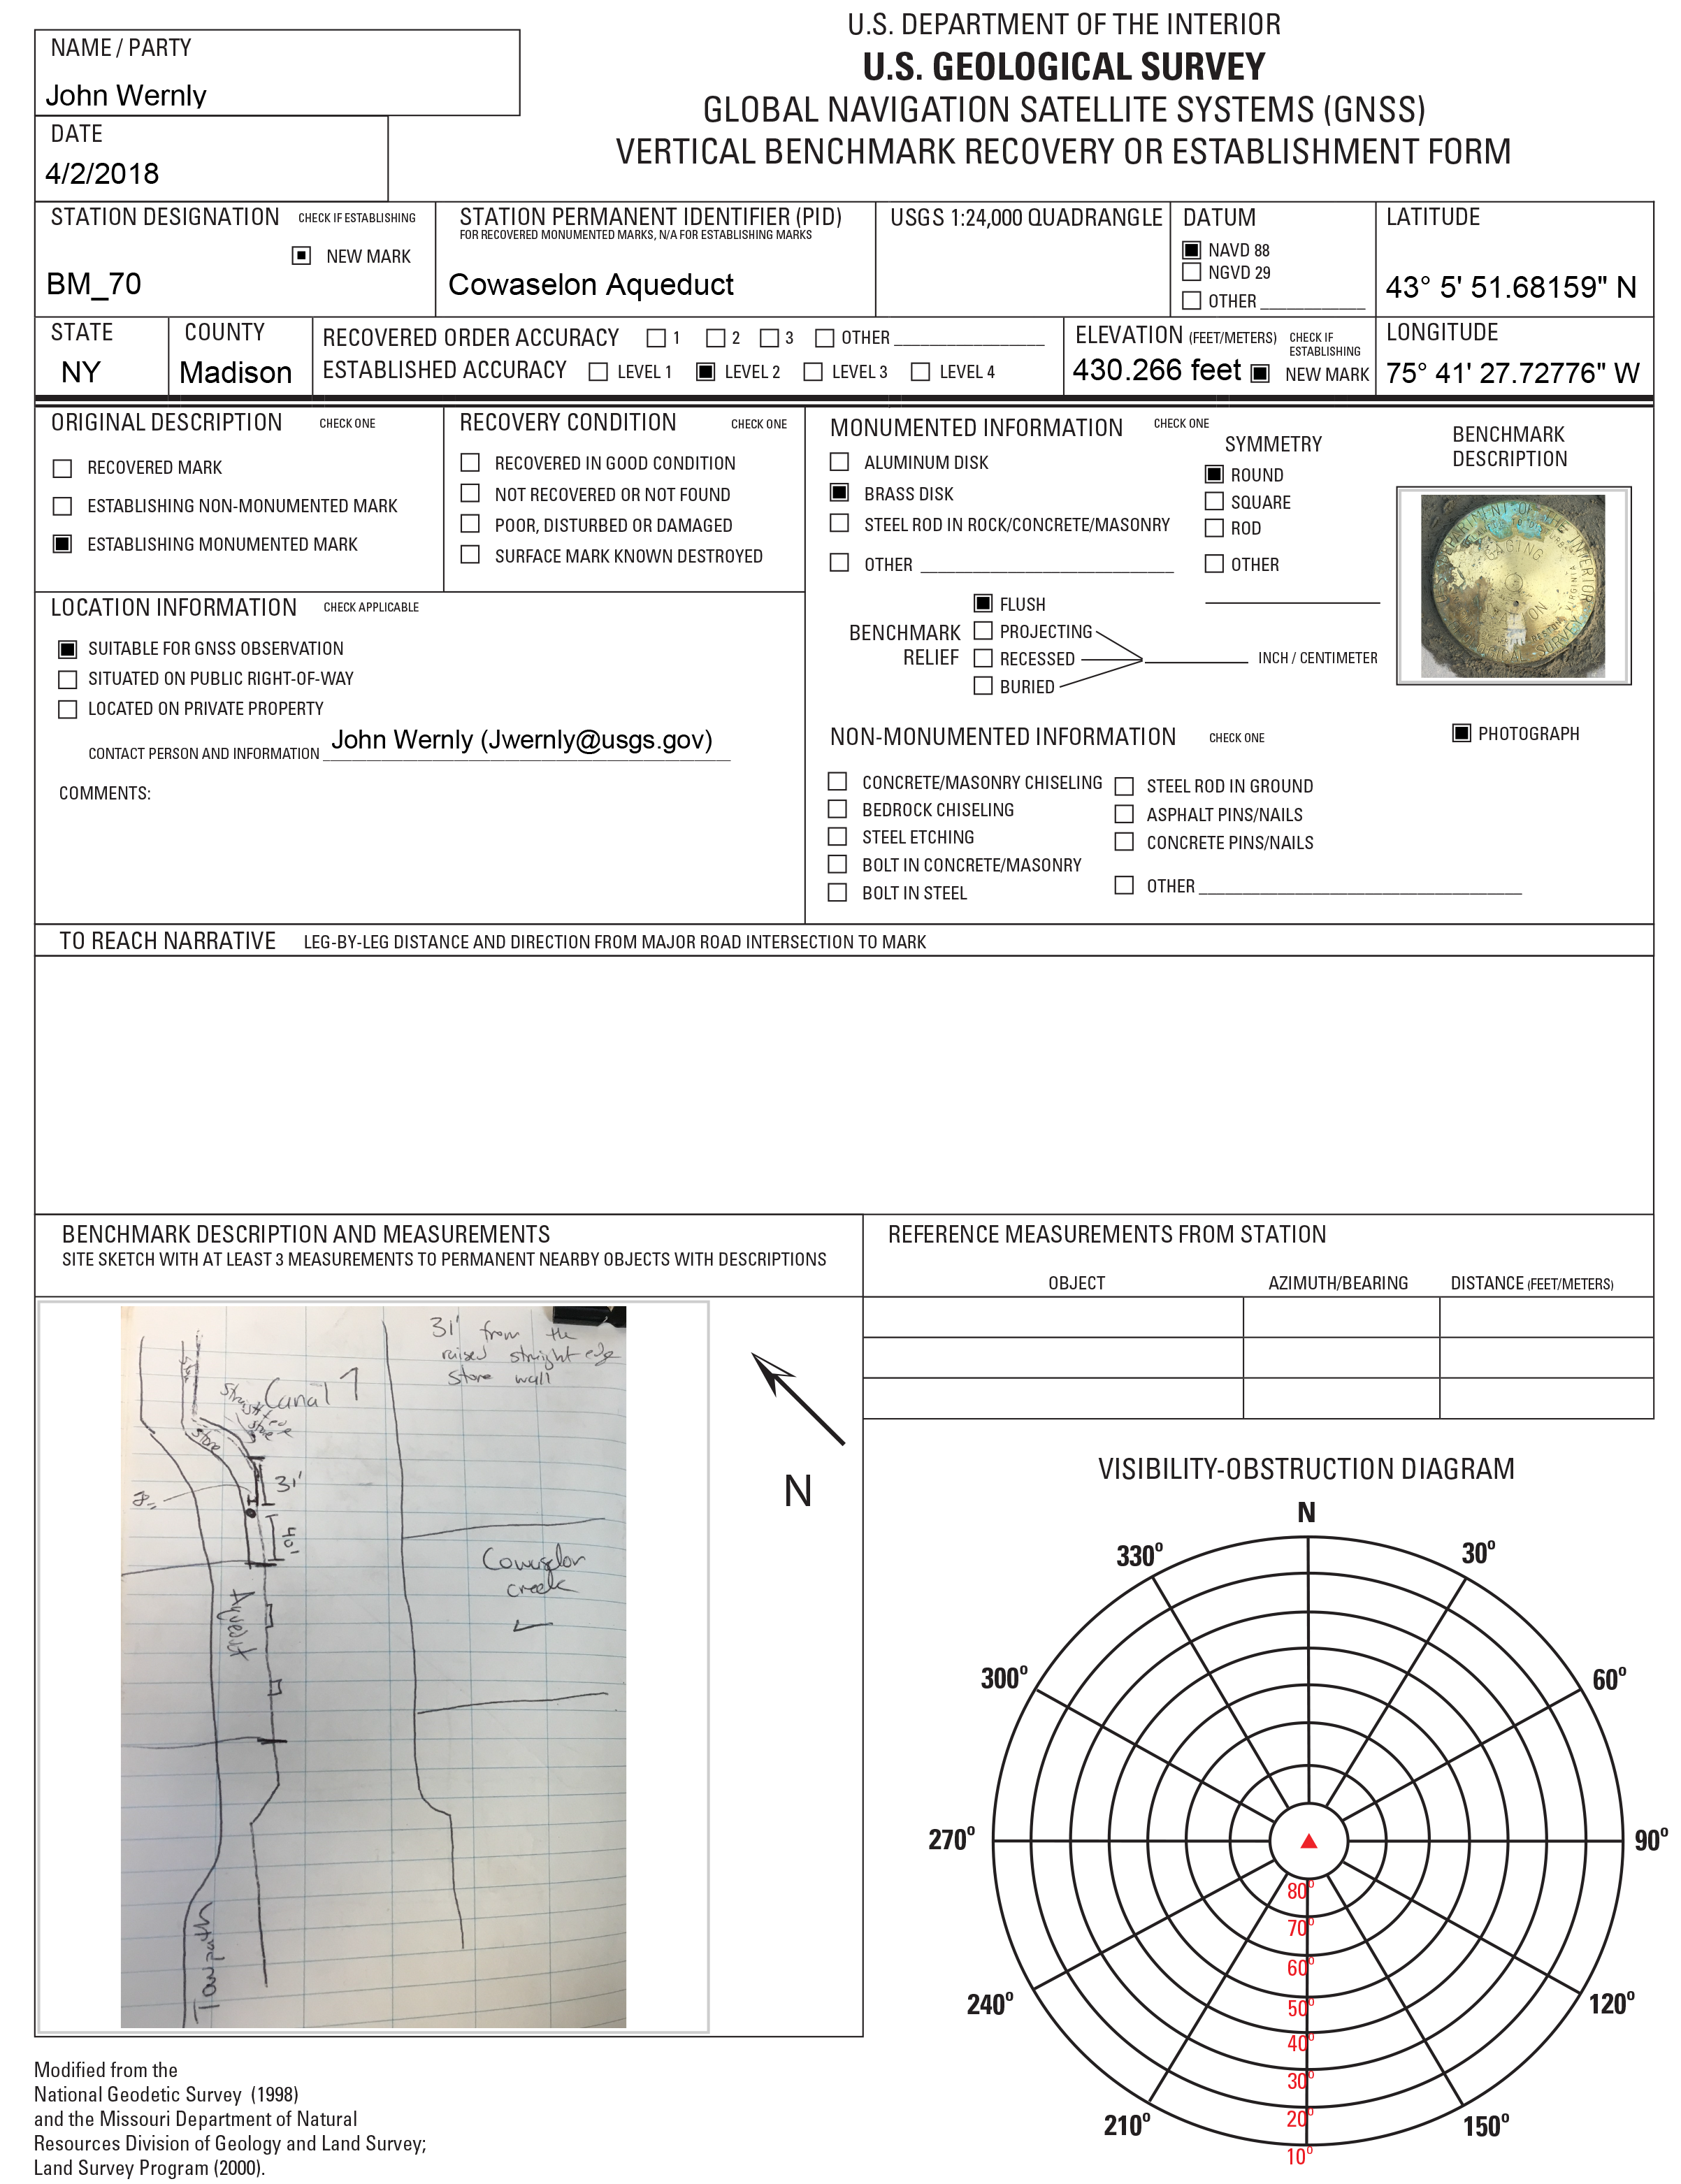
Vertical benchmark recovery or establishment form for BM_70, Cowaselon aqueduct.
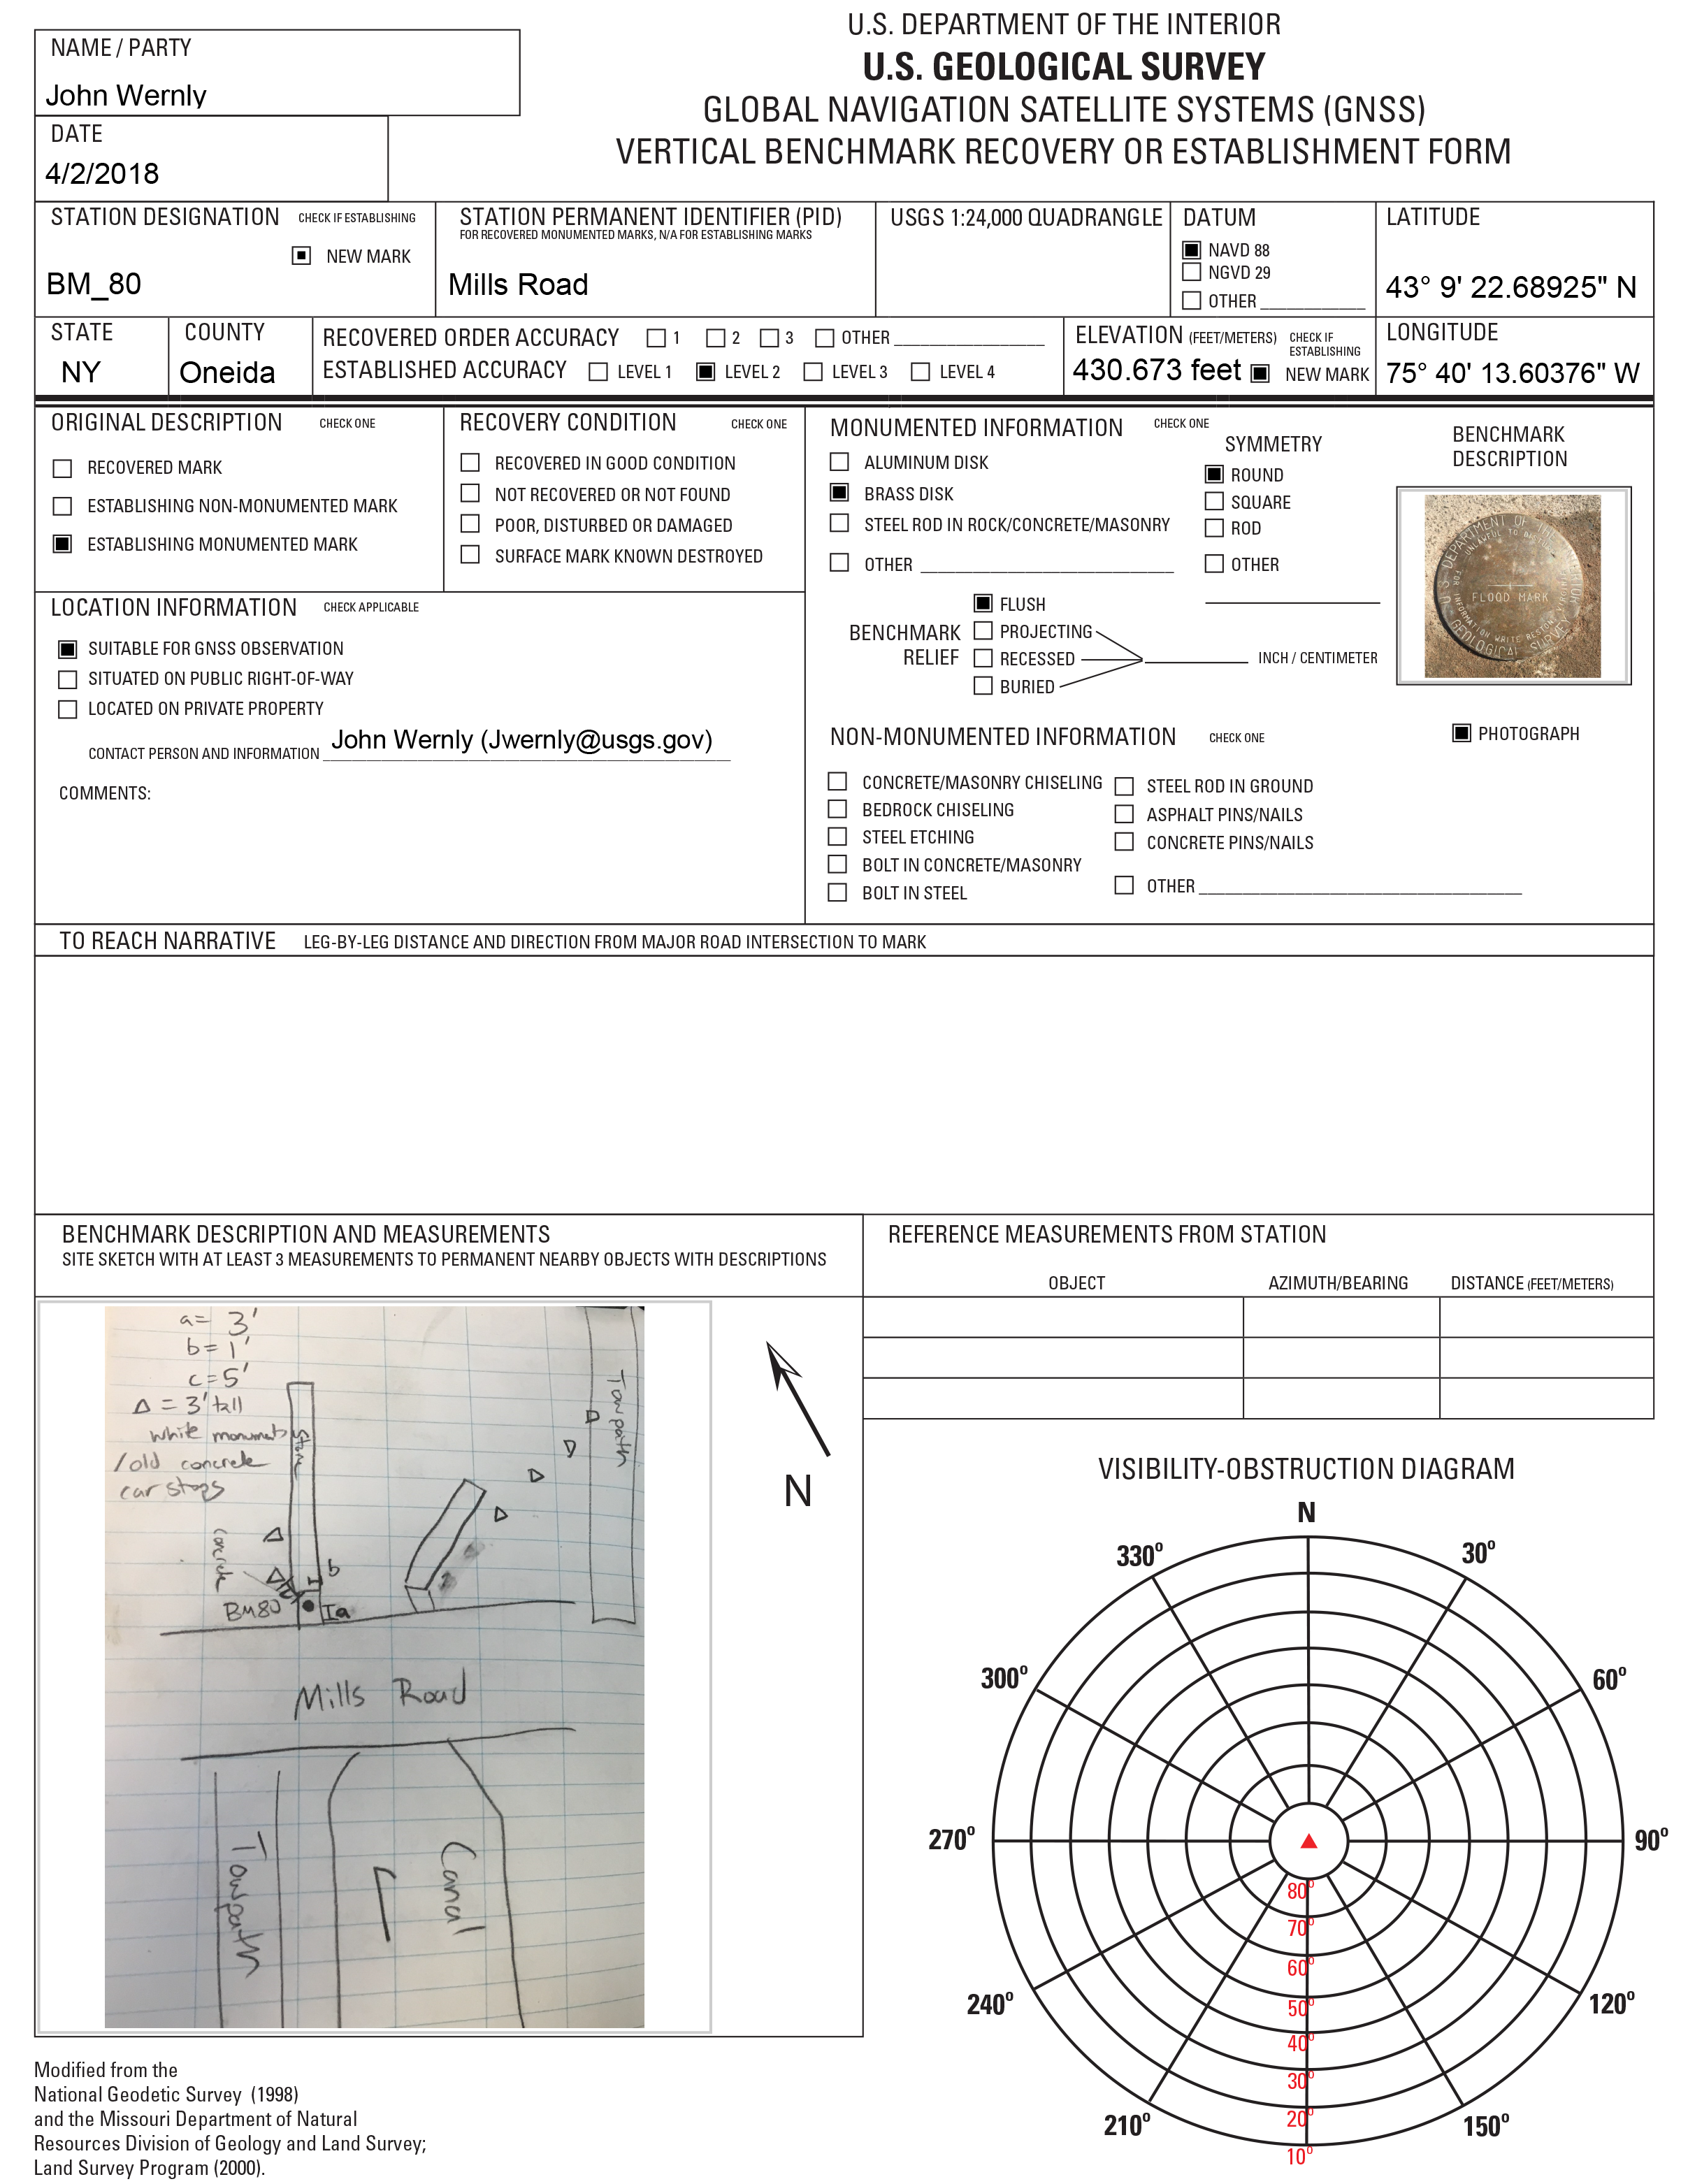
Vertical benchmark recovery or establishment form for BM_80, Mills Road.
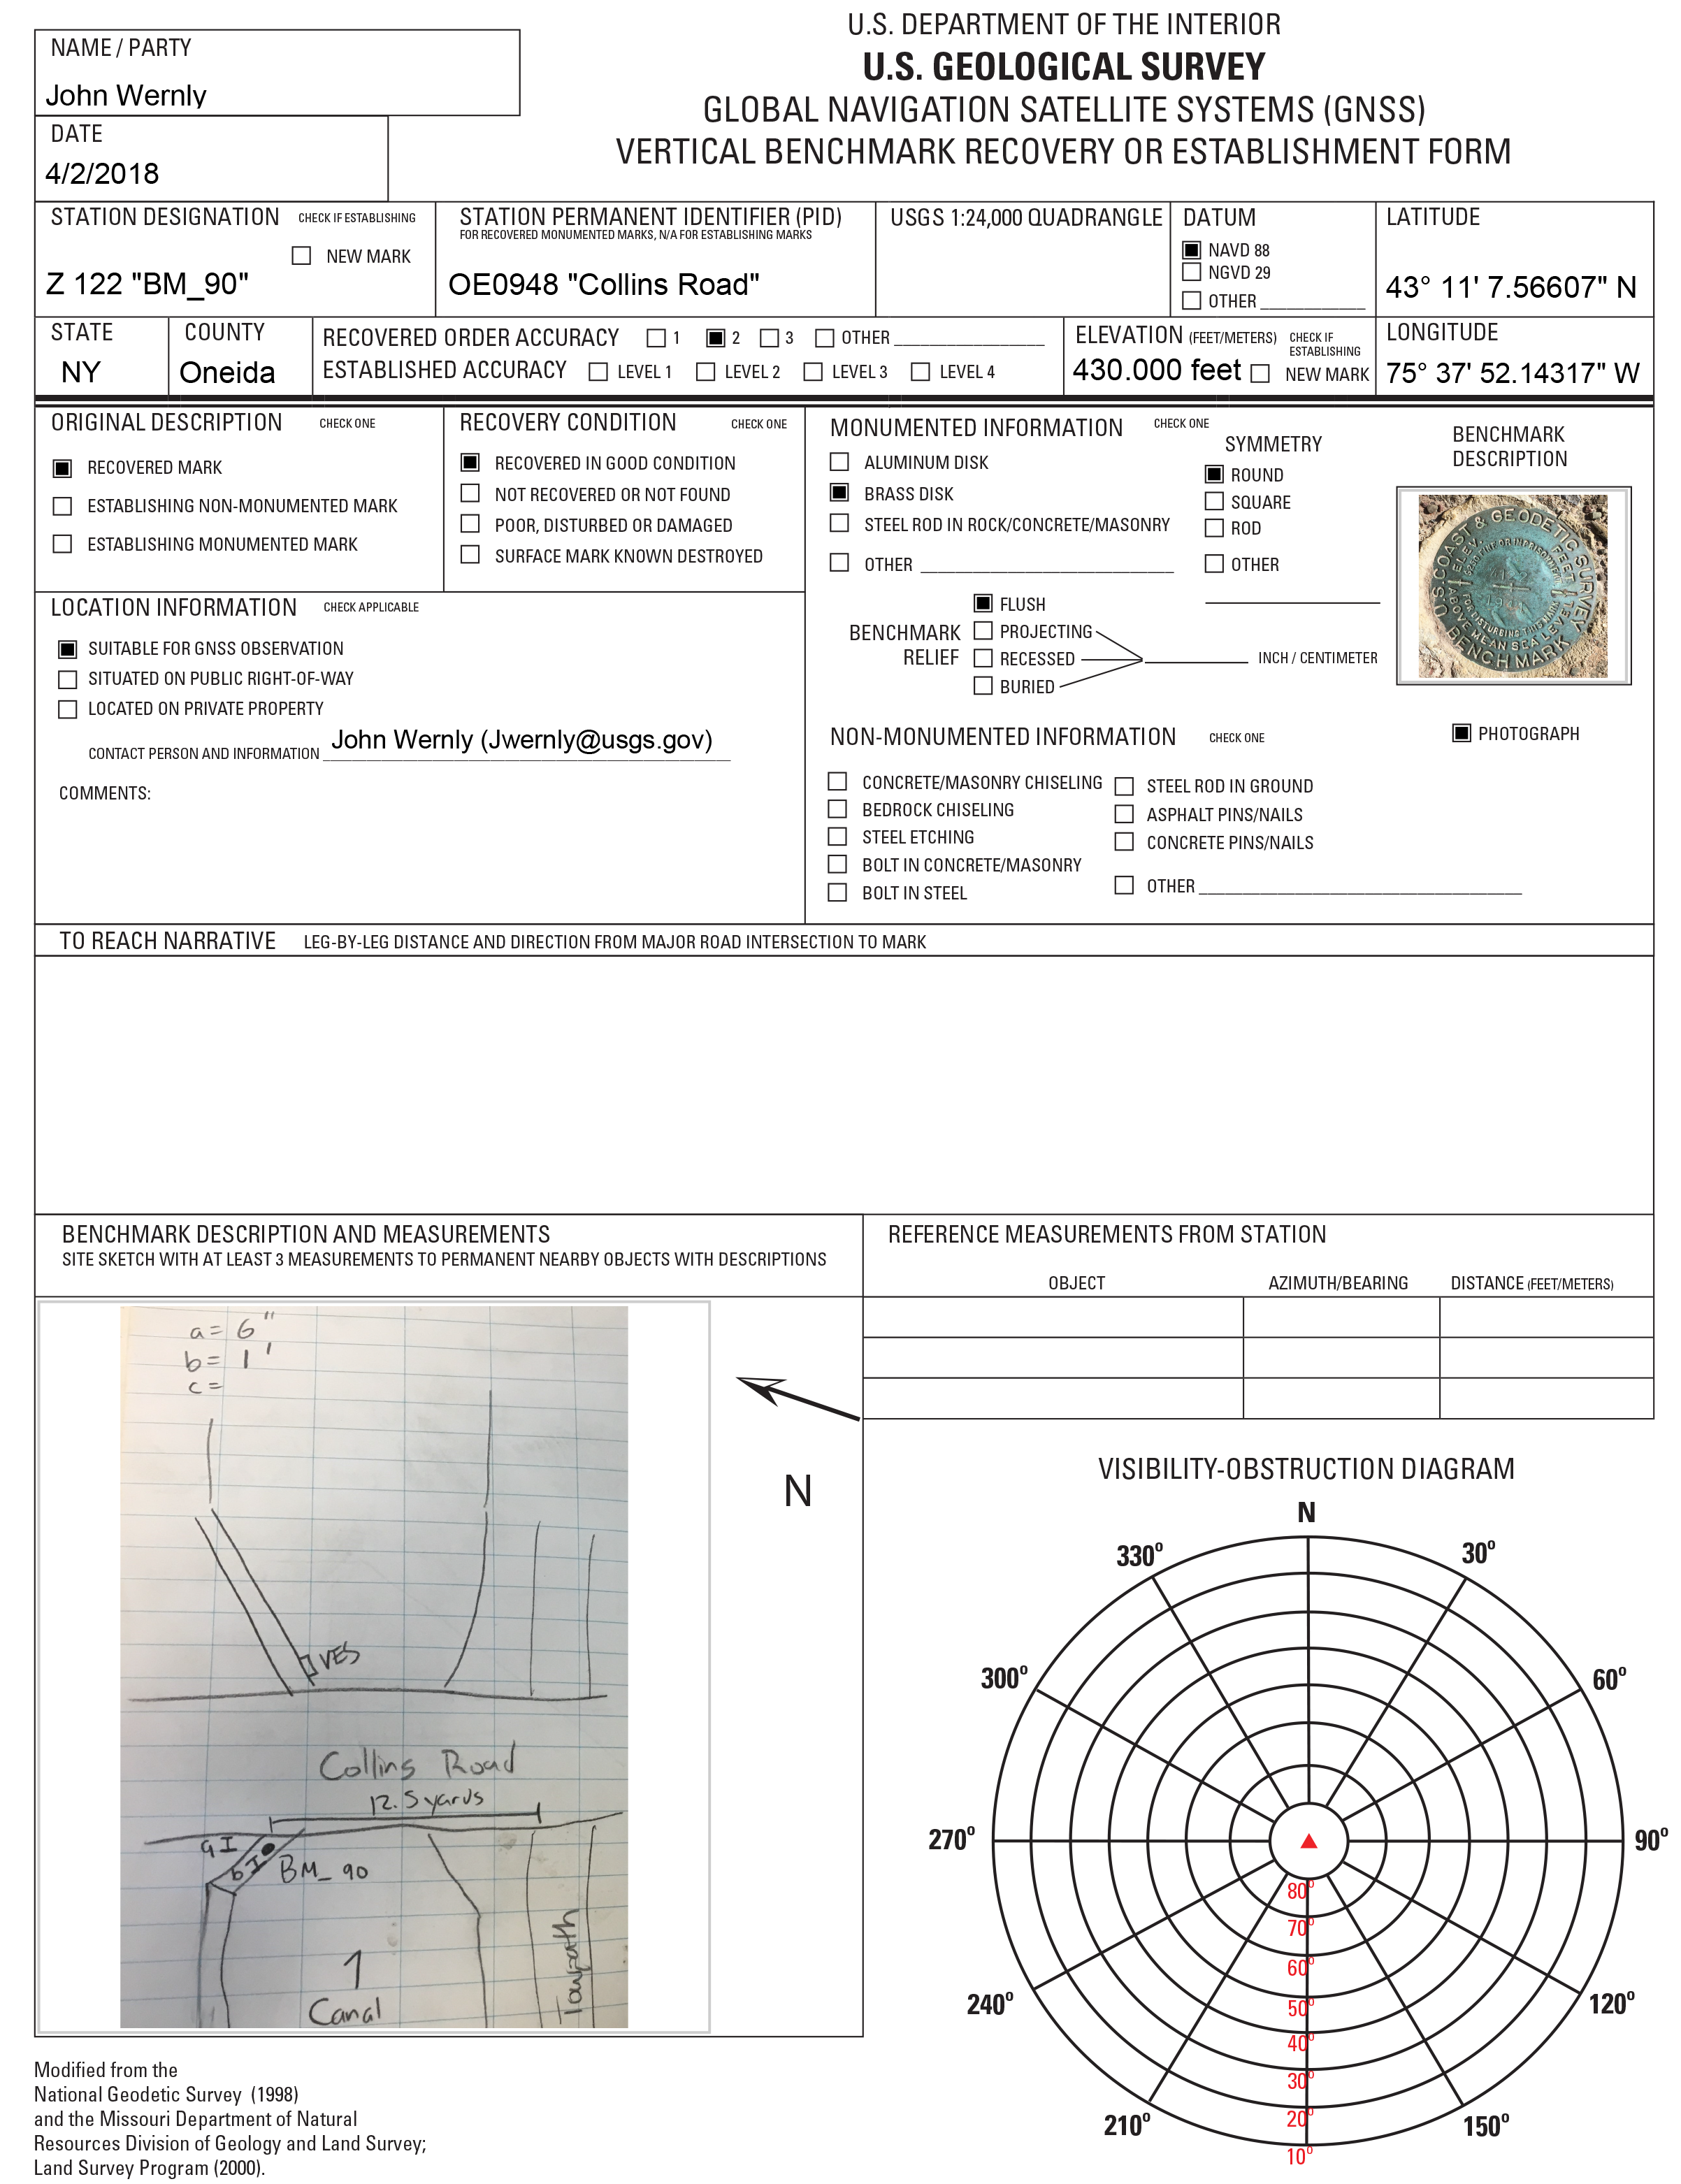
Vertical benchmark recovery or establishment form for BM_90, Collins Road.
Appendix 2. Old Erie Canal Staff Gage and Benchmark Locations
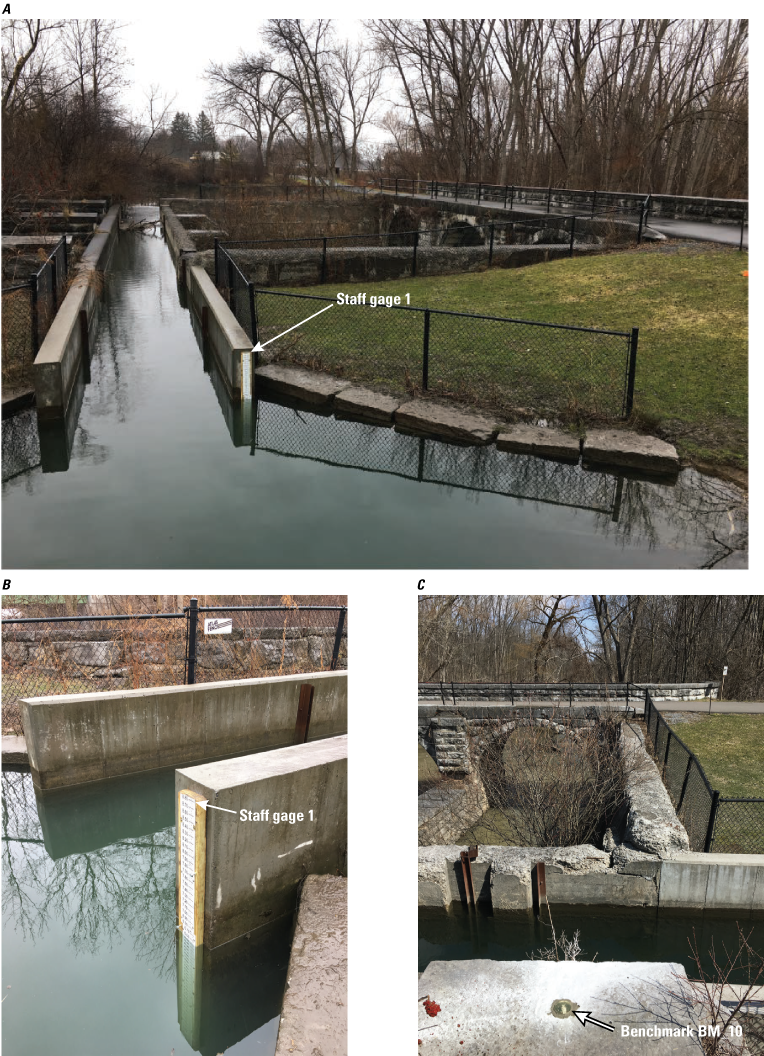
Photographs of the staff gage and benchmark at the Butternut aqueduct, New York. A, Butternut aqueduct staff gage on the aqueduct channel; B, Butternut aqueduct staff gage; and C, Butternut aqueduct benchmark (BM_10) location.
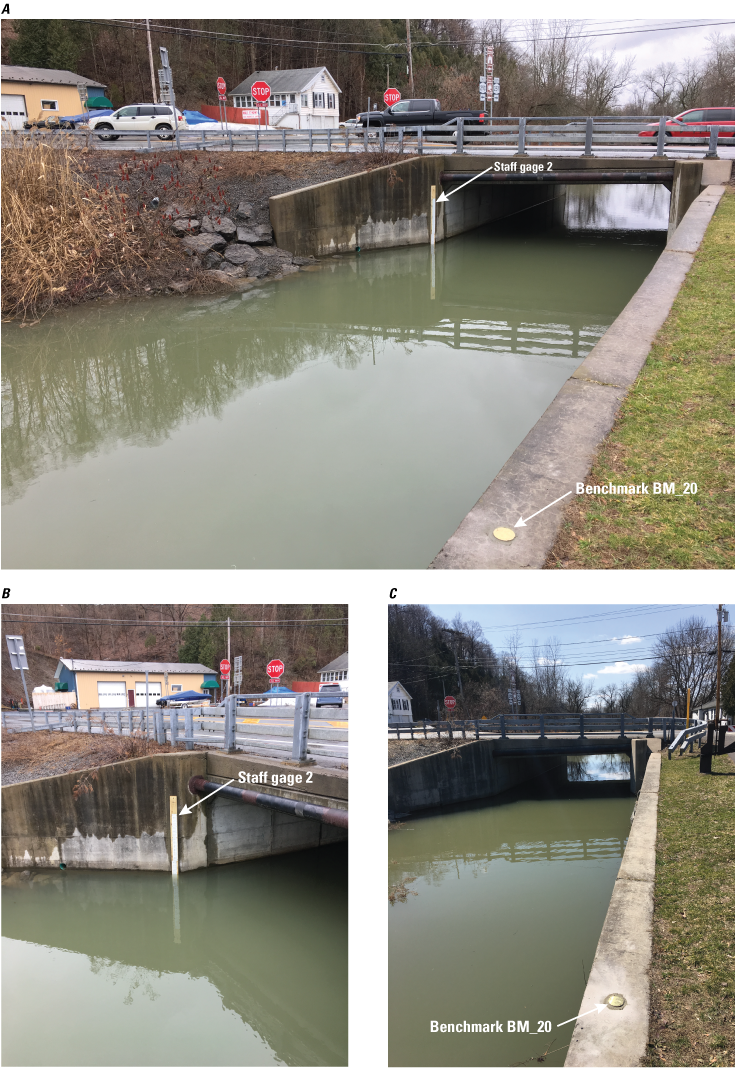
Photographs of the staff gage and benchmark at Manlius Center Road where it crosses the Old Erie Canal, New York. A, Manlius Center Road with staff gage and benchmark (BM_20); B, Manlius Center Road staff gage; and C, Manlius Center Road benchmark (BM_20) location.
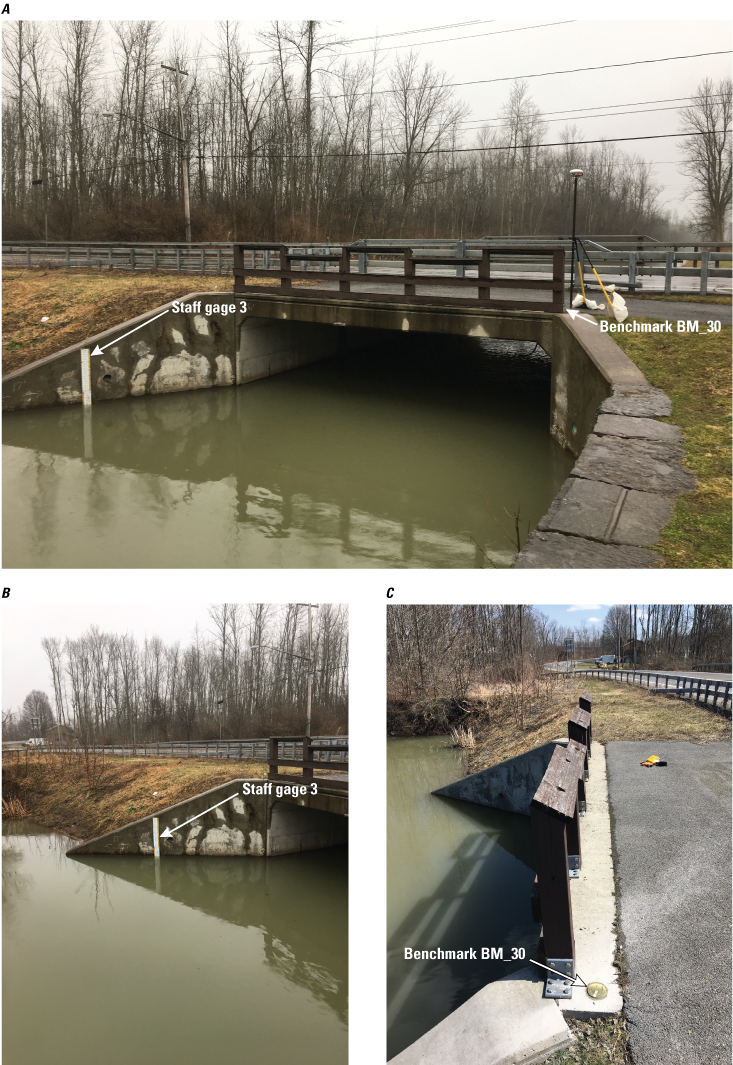
Photographs of the staff gage and benchmark at Kirkville Road where it crosses the Old Erie Canal, New York. A, Kirkville Road staff gage location; B, Kirkville Road staff gage; and C, Kirkville Road benchmark (BM_30) location.
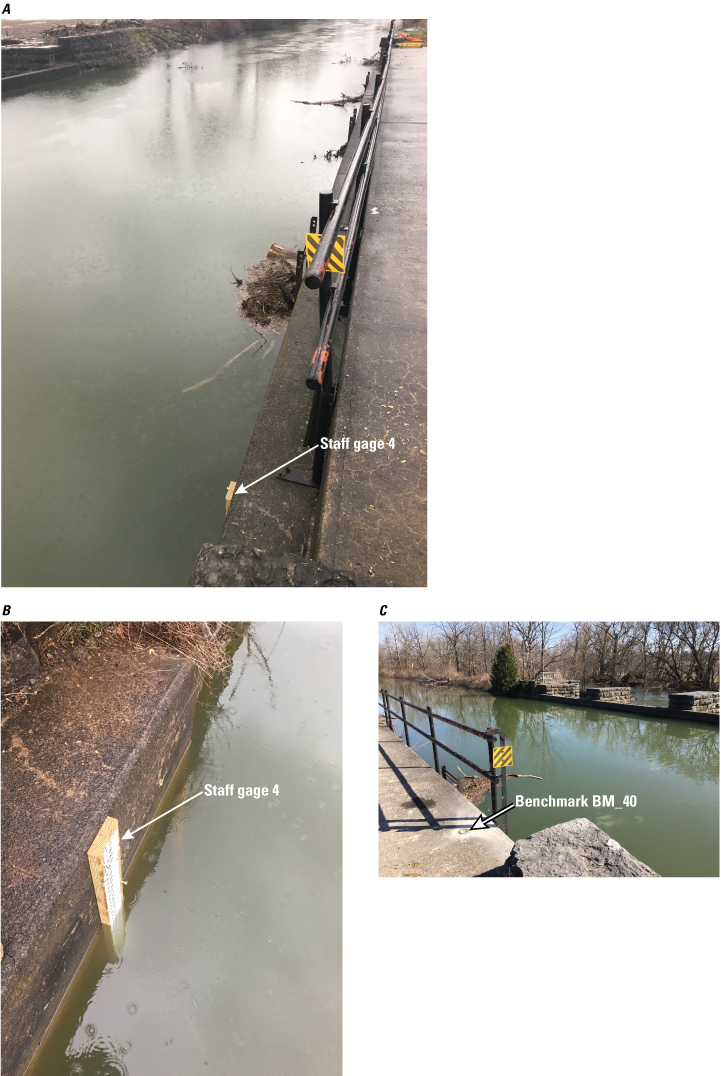
Photographs of the staff gage and benchmark at the Chittenango aqueduct, New York. A, Chittenango staff gage location (top of staff gage backing board visible in foreground); B, Chittenango aqueduct staff gage; and C, Chittenango aqueduct benchmark (BM_40) location.
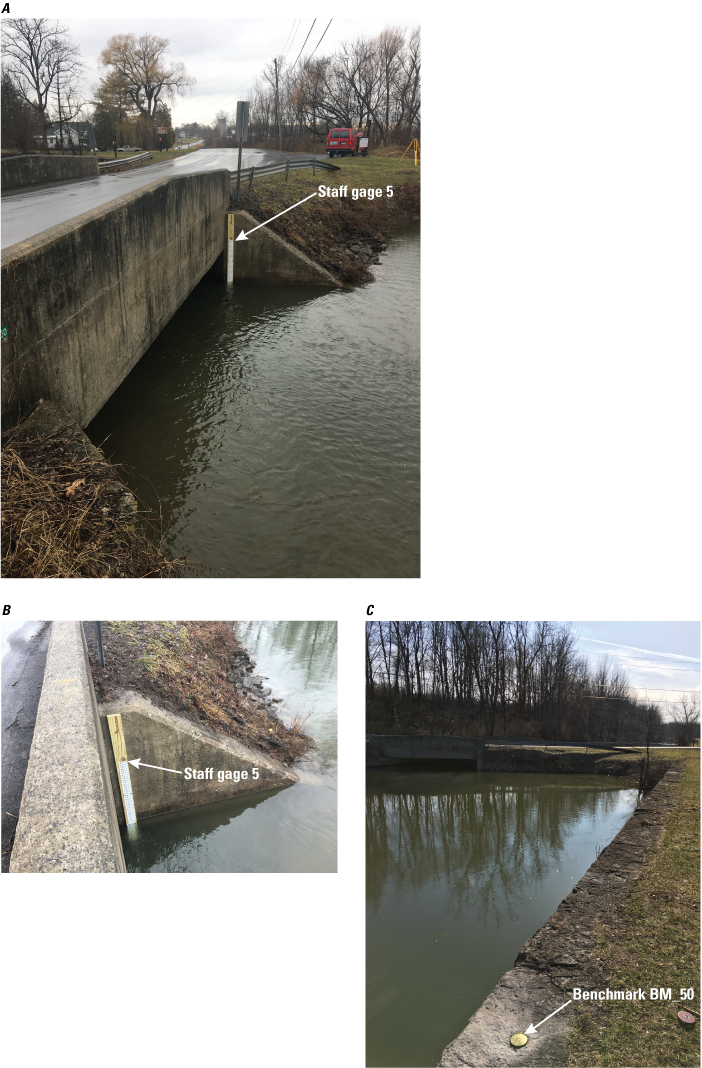
Photographs of the staff gage and benchmark at Harsh Road where it crosses the Old Erie Canal, New York. A, Harsh Road staff gage location; B, Harsh Road staff gage; and C, Harsh Road benchmark (BM_50) location.
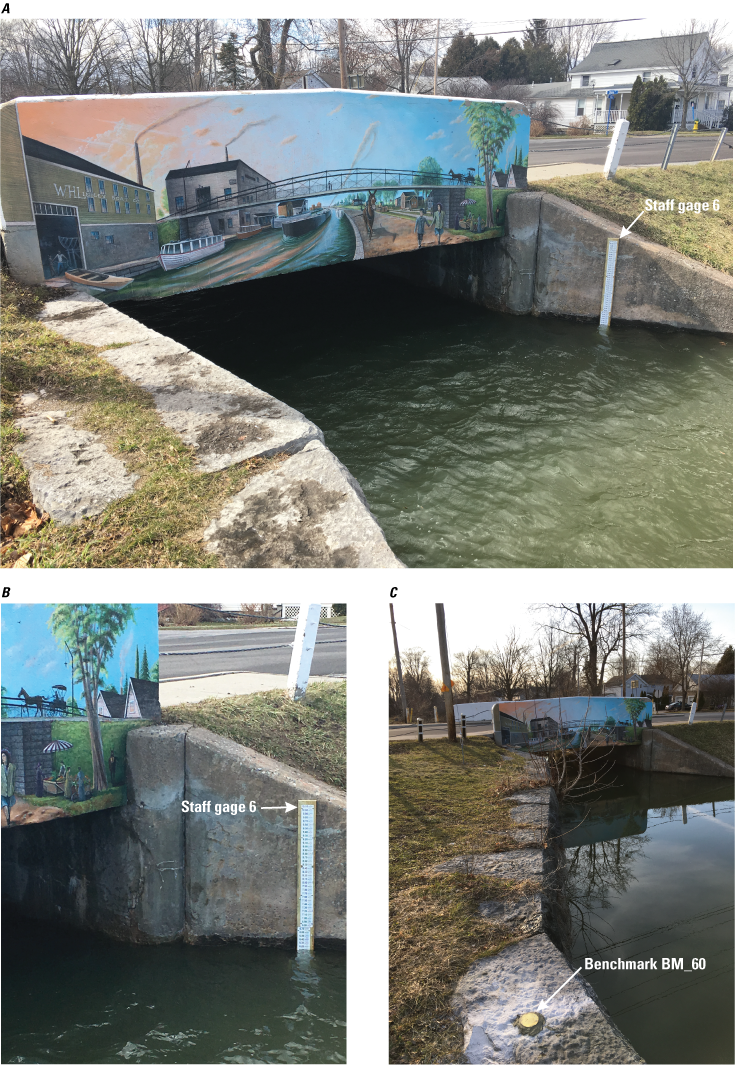
Photographs of the staff gage and benchmark at Main Street, Canastota, Lenox, New York, where it crosses the Old Erie Canal. A, Main Street, Canastota staff gage location; B, Main Street, Canastota staff gage; and C, Main Street, Canastota benchmark (BM_60) location.
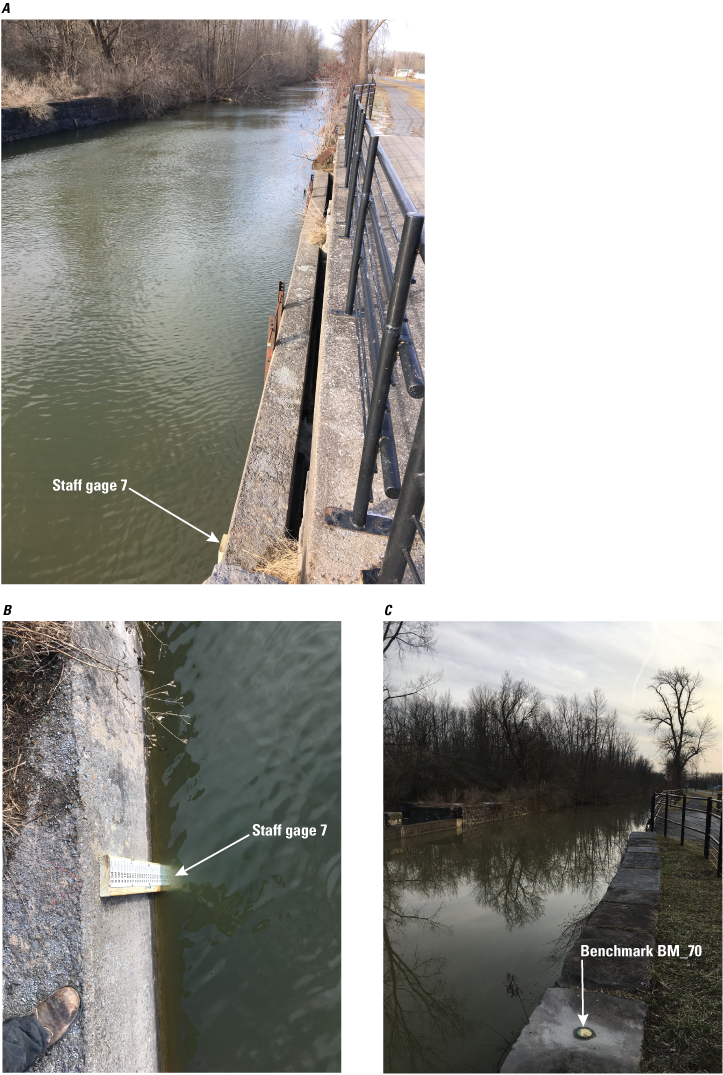
Photographs of the staff gage and benchmark at the Cowaselon aqueduct. A, Cowaselon aqueduct staff gage location (top of staff gage backing board is visible in the foreground); B, Cowaselon aqueduct staff gage; and C, Cowaselon aqueduct benchmark (BM_70) location.
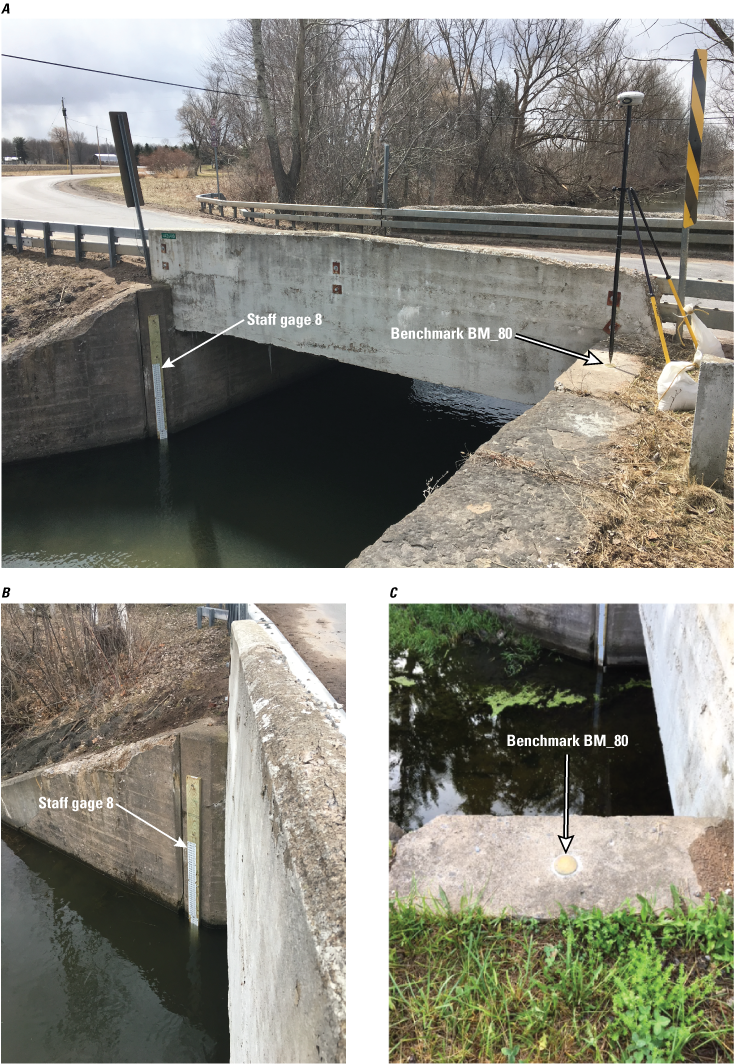
Photographs of the staff gage and benchmark at Mills Road where it crosses the Old Erie Canal, New York. A, Mills Road staff gage and benchmark location. A Global Positioning System receiver is positioned on the benchmark; B, Mills Road staff gage; and C, Mills Road benchmark (BM_80) location.
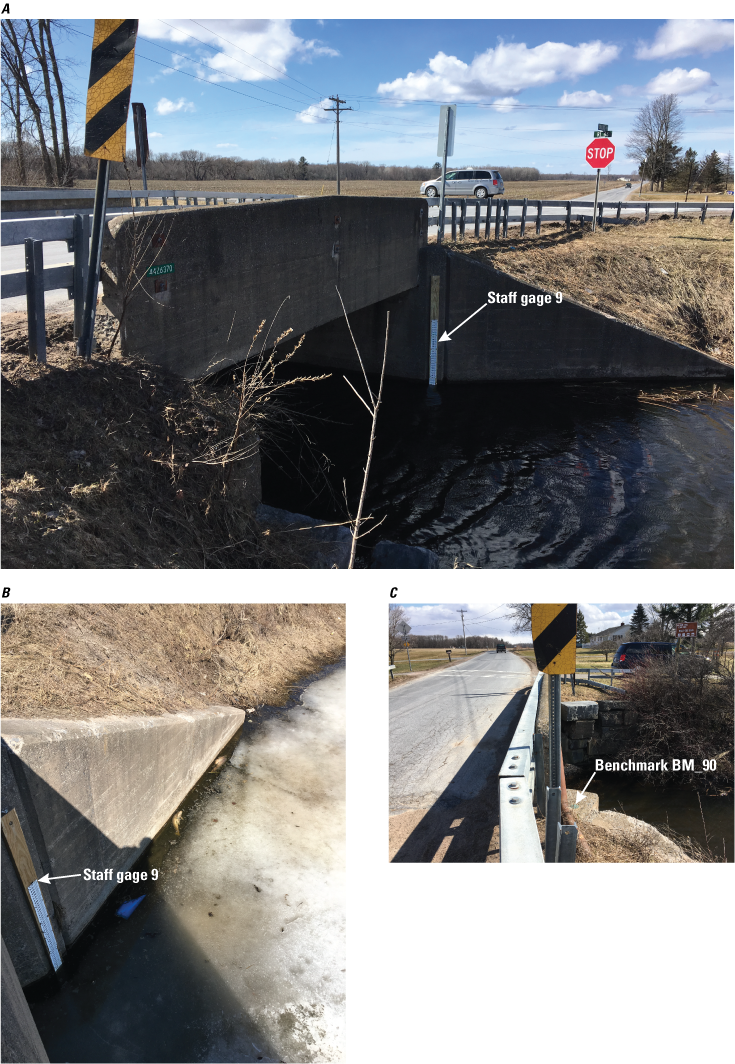
Photographs of the staff gage and benchmark at Collins Road where it crosses the Old Erie Canal, New York. A, Collins Road staff gage location; B, Collins Road staff gage; and C, Collins Road benchmark (BM_90) location visible on top of bridge abutment in the foreground.
Appendix 3. Feeder System and Inflows of Old Erie Canal
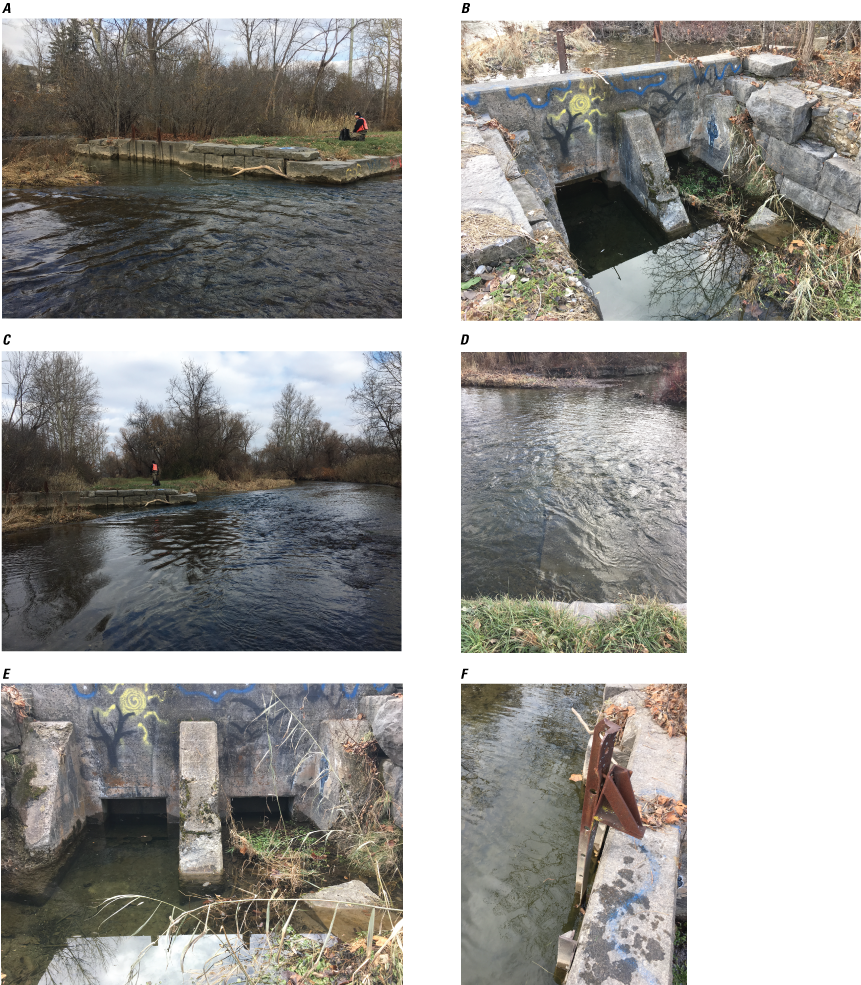
Photographs of the Butternut sluice gate at the junction of Butternut Creek and Butternut feeder. A, Upstream side of Butternut sluice gate; B, Downstream side of Butternut sluice gate; C, Butternut sluice gate with Butternut Creek on right; D, Top of weir in Butternut Creek visible in foreground; E, Butternut sluice gate openings; and F, Butternut sluice gate with metal lift bar, broken locking mechanism, and outer brackets shown.
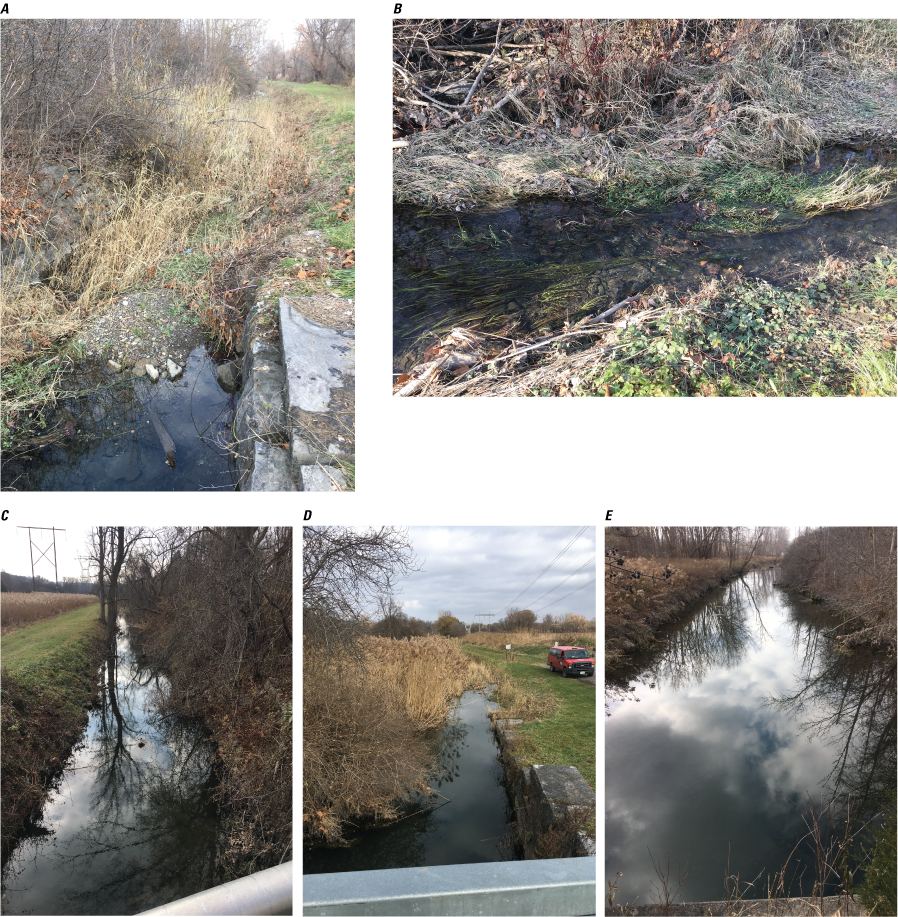
Photographs of Butternut feeder. A, Butternut feeder immediately downstream from sluice gates; B, Butternut feeder upstream from Andrews Road showing groundwater contribution to flow; C, Butternut feeder viewed from Andrews road looking upstream; D, Butternut feeder viewed from Andrews Road looking downstream, with dense phragmites; and E, Butternut feeder upstream from Butternut culvert looking upstream.
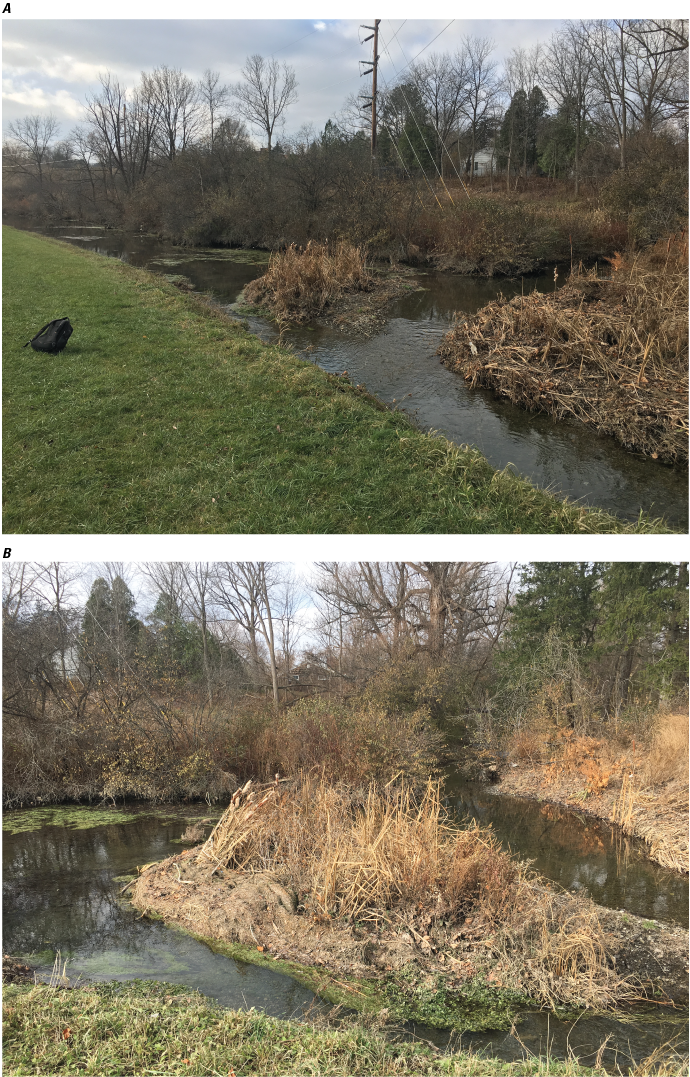
Photographs of the junction of Meadow Brook and Butternut feeder. A, Meadow Brook tributary to Butternut feeder seen entering middle-right of image; and B, Meadow Brook tributary entering Butternut feeder in middle-background of image.
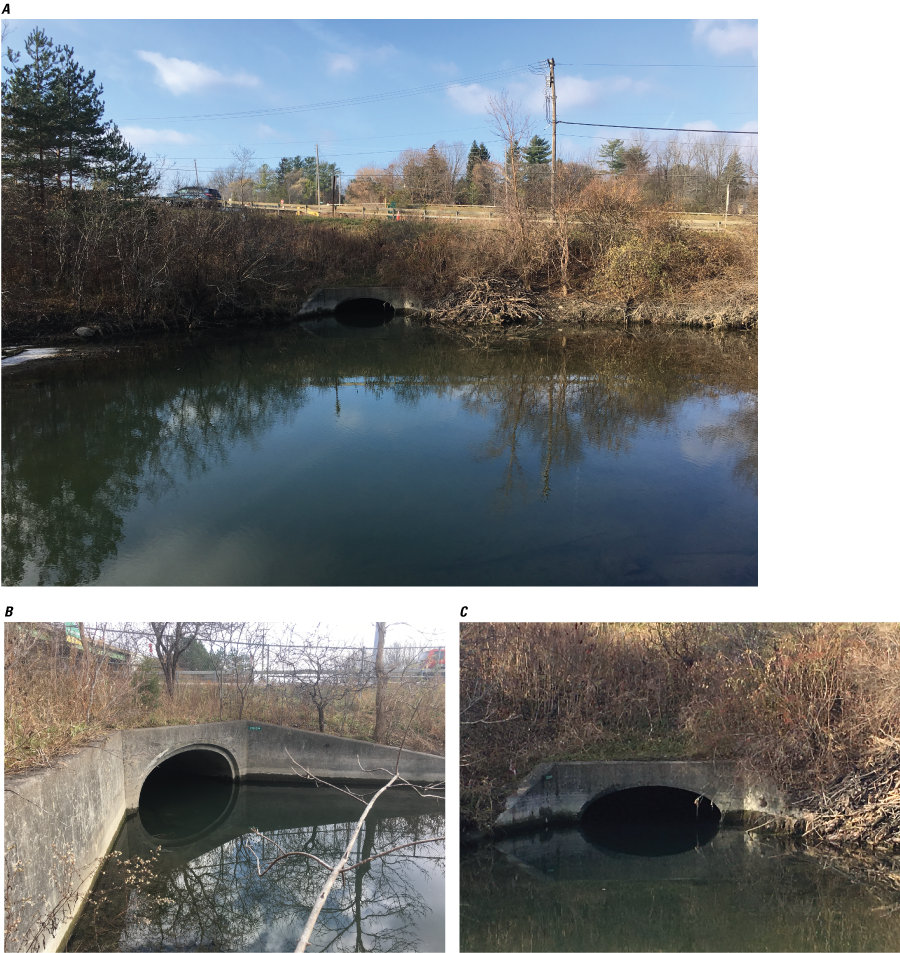
Photographs of Butternut feeder culvert. A, Butternut feeder culvert entering canal; B, Upstream face of Butternut feeder culvert before it enters canal; and C, Downstream face of Butternut feeder culvert as it enters canal.
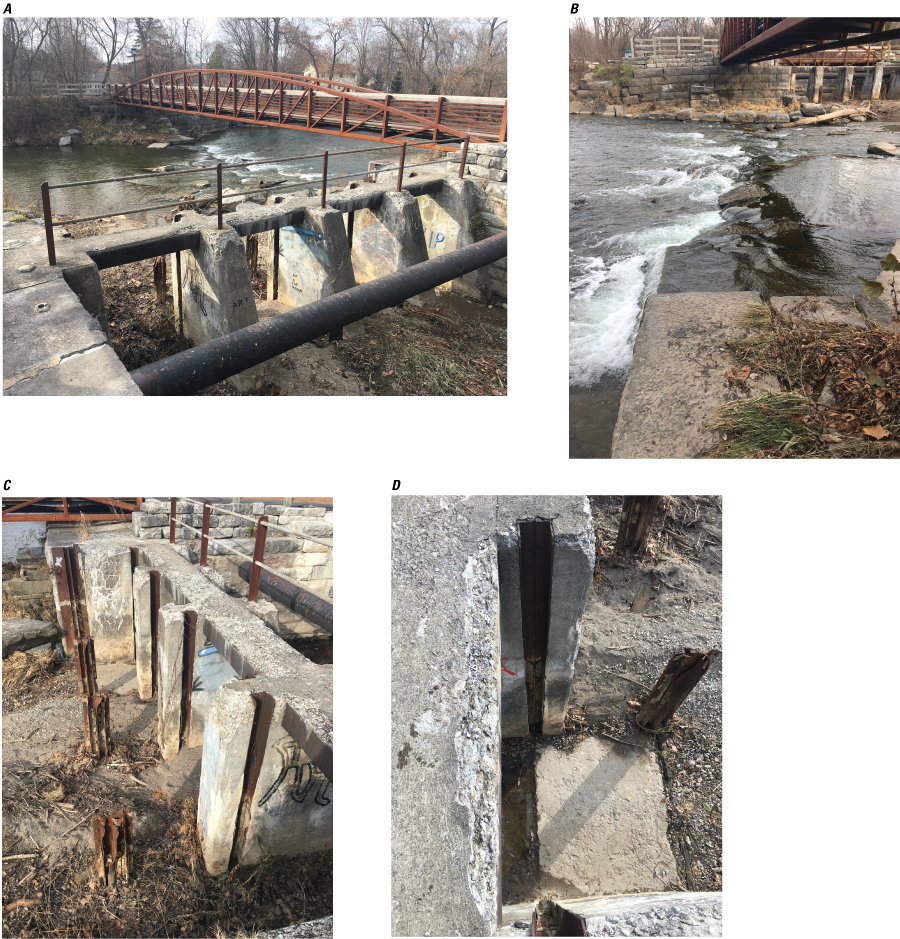
Photographs of the Limestone sluice gate at the junction of Limestone Creek with Limestone feeder. A, Limestone sluice gate with Limestone Creek in the background; B, Remnants of removed weir in Limestone Creek with sluice gate visible in background; C, I-beams set in front of sluice gate designed to accept flashboards; and D, I-beams set integral to sluice gate designed to accept flashboards.
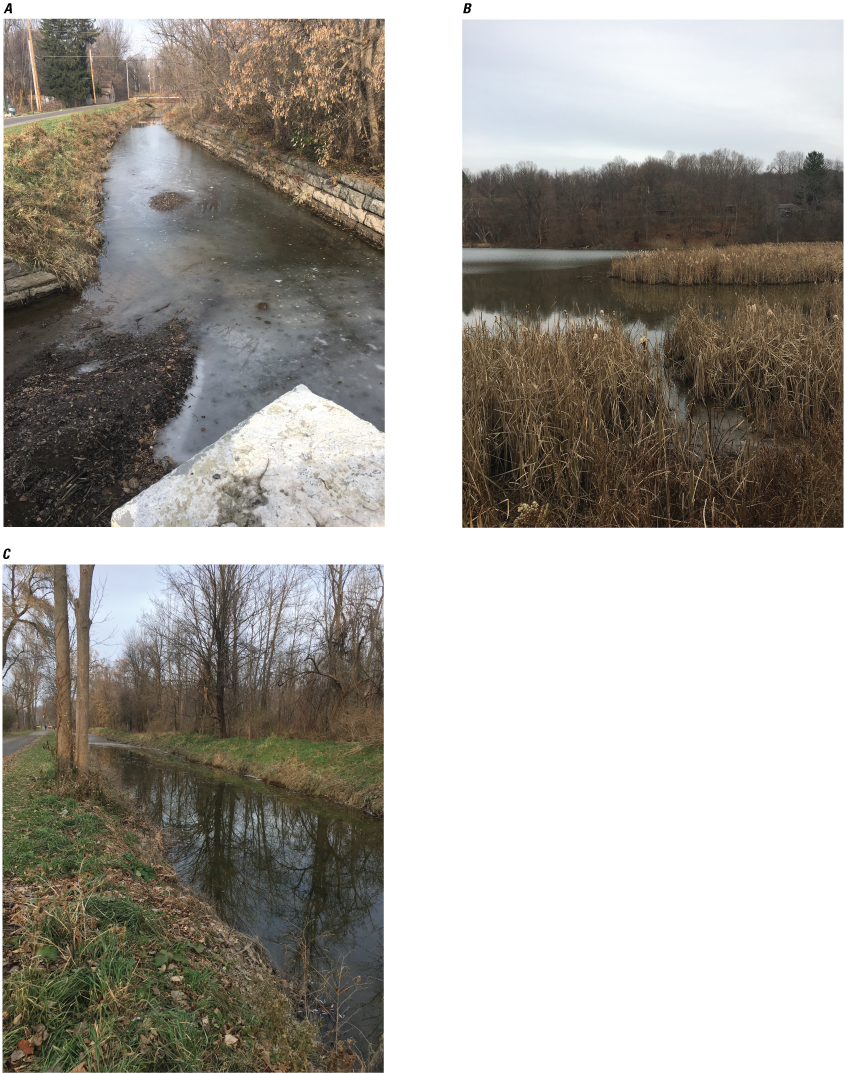
Photographs of Limestone feeder. A, Limestone feeder directly downstream from Limestone sluice gate; B, Limestone feeder where it enters the canal; and C, Limestone feeder channel.
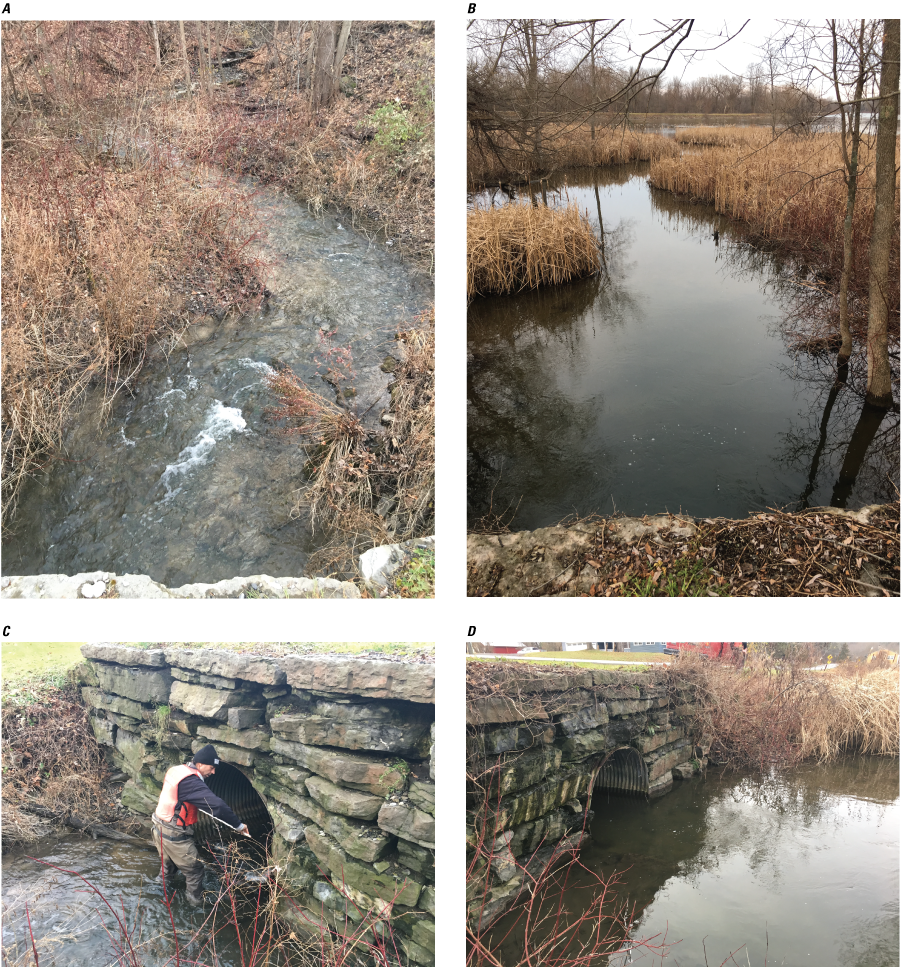
Photographs of Pools Brook where it crosses beneath North Poolsbrook Road and enters the Old Erie Canal. A, Pools Brook, pictured upstream from the road, is a nonregulated stream which directly enters the Old Erie Canal; B, Pools Brook, pictured downstream from the road, enters the Old Erie Canal in a marshy area between Limestone and Chittenango aqueducts; C, Upstream face of circular culvert, underneath North Poolsbrook Road, where Pools Brook enters the Old Erie Canal; and D, Downstream face of circular culvert, underneath North Poolsbrook Road, where Pools Brook enters the Old Erie Canal.
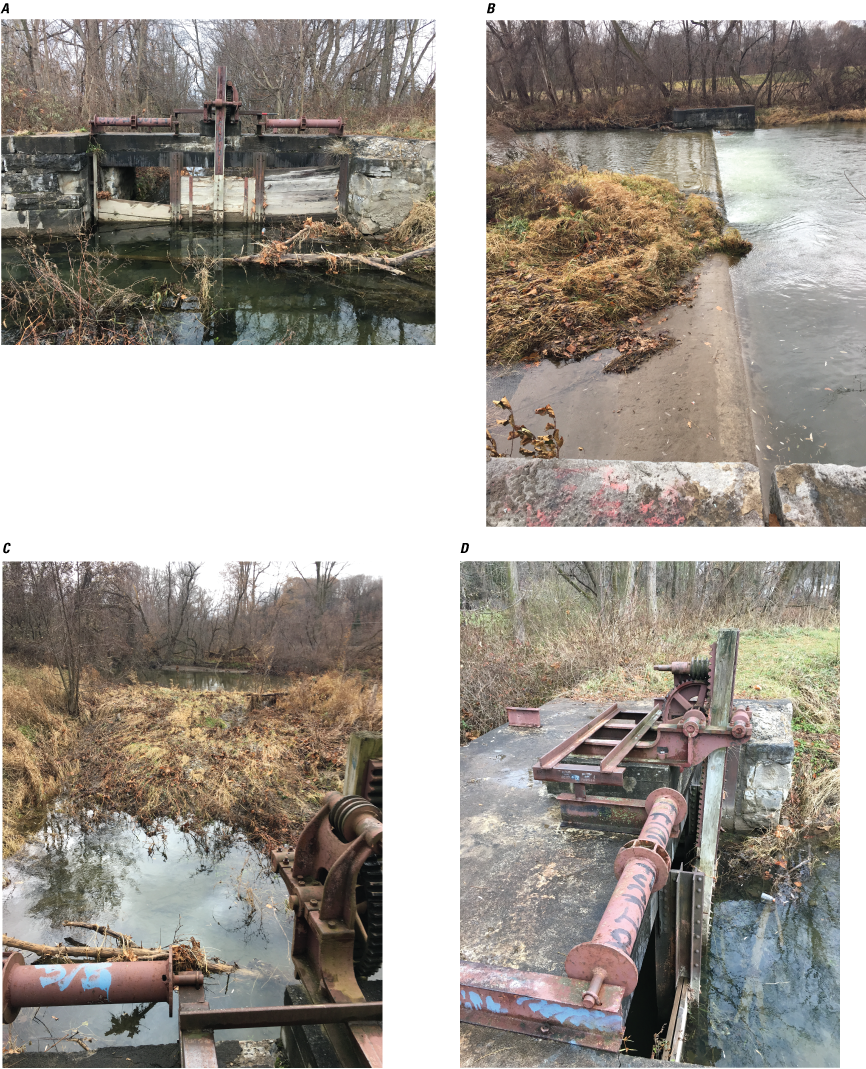
Photographs of the Chittenango sluice gate at the junction of Chittenango Creek and Chittenango feeder. A, Upstream face of Chittenango sluice gate as viewed from Chittenango Creek; B, Weir on Chittenango Creek; C, Vegetated bar seen blocking flow from Chittenango Creek, viewed from top of sluice gate; and D, Chittenango sluice gate gears, lifting bar, outer brackets and installed flashboards.
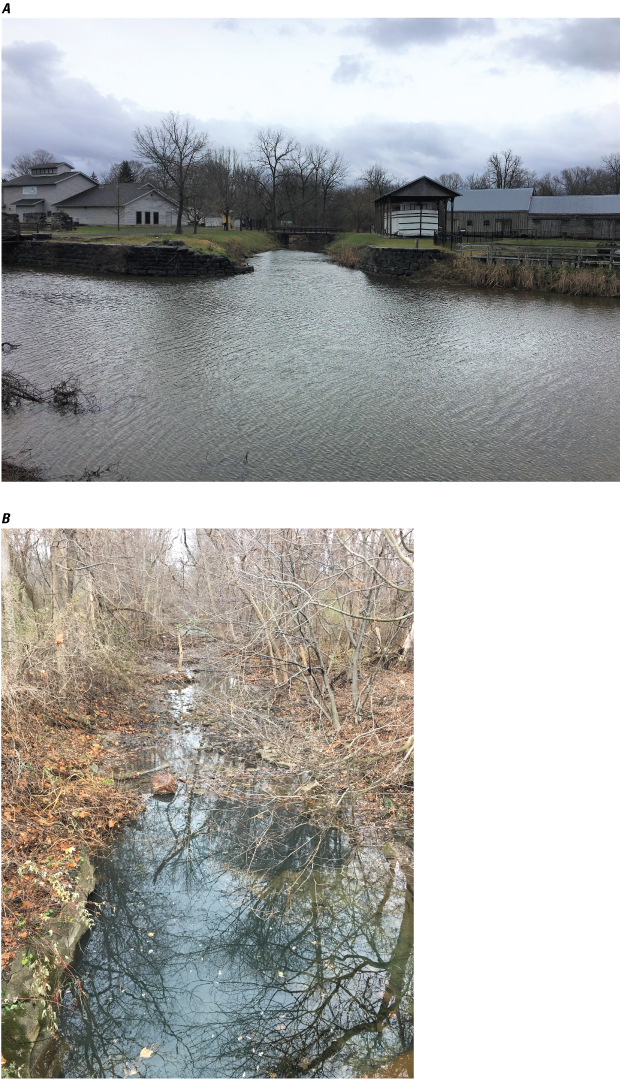
Photographs of the Chittenango feeder. A, Chittenango feeder where it enters the Old Erie Canal; and B, Chittenango feeder channel directly downstream from the Chittenango sluice gate.
Appendix 4. Aqueducts and Outfalls of Old Erie Canal
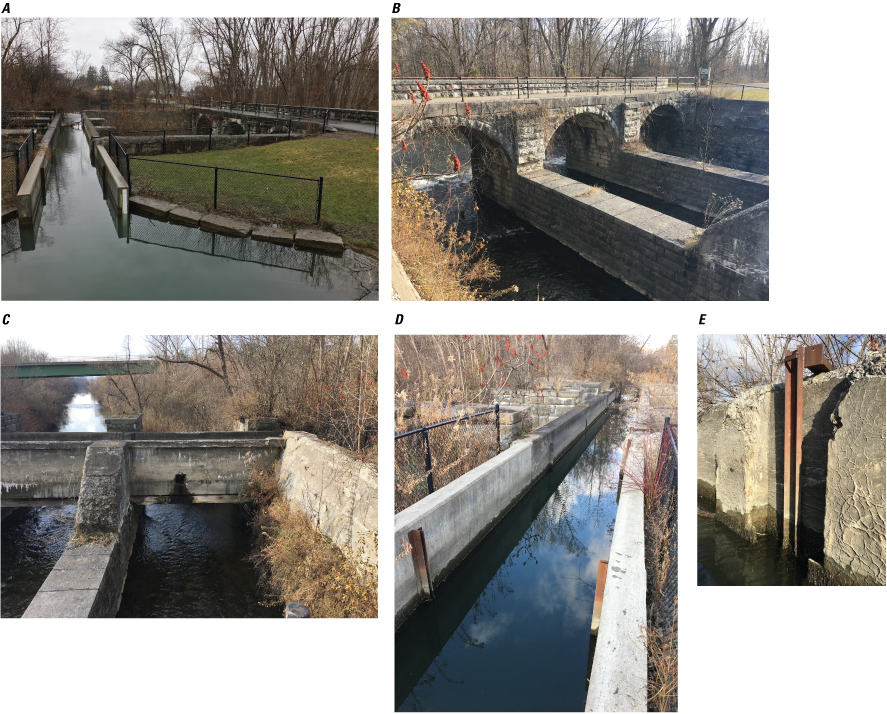
Photographs of structures at Butternut aqueduct. A, The narrow concrete channel of Butternut aqueduct conveys flow over Butternut Creek; B, Remnants of old structure that supported original aqueduct, towpath seen in background; C, One, of a total of two, small square outfall openings, seen in the center of the image, with the capability to discharge into Butternut Creek; D, One, of a total of two, metal brackets which accept flashboards to separate the canal into sections for dewatering; and E, Outfall gate structure recessed into concrete. Lifting bar, metal guides, and top bracket visible.
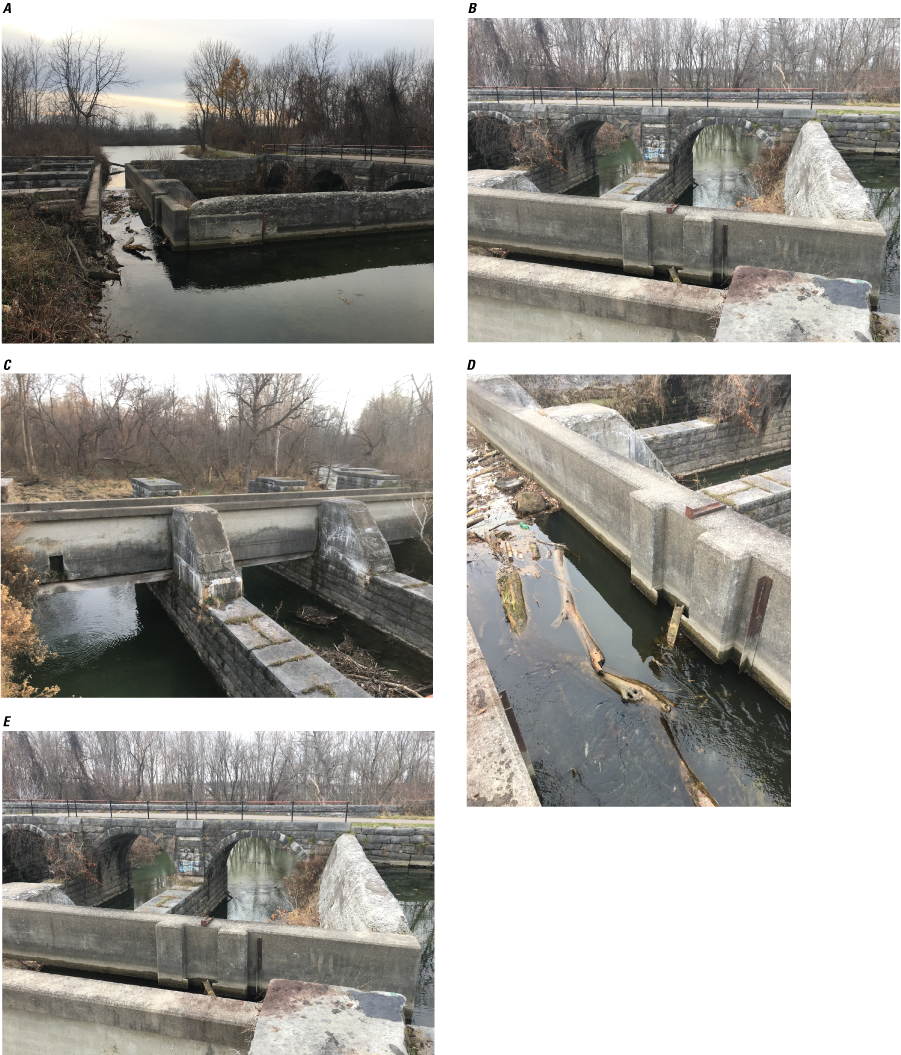
Photographs of structures at Limestone aqueduct. A, The narrow concrete channel of Limestone aqueduct conveys flow over Limestone Creek; B, Remnants of old structure that supported original aqueduct, towpath seen in background; C, Square outfall opening, seen on the left, with the capability to discharge into Limestone Creek; D, Outfall gate structure recessed into concrete. Broken lifting bar, metal guides, and top bracket visible; and E, Metal brackets, visible to the right of concrete gate structure, designed to accept flashboards to separate the canal into sections for dewatering.
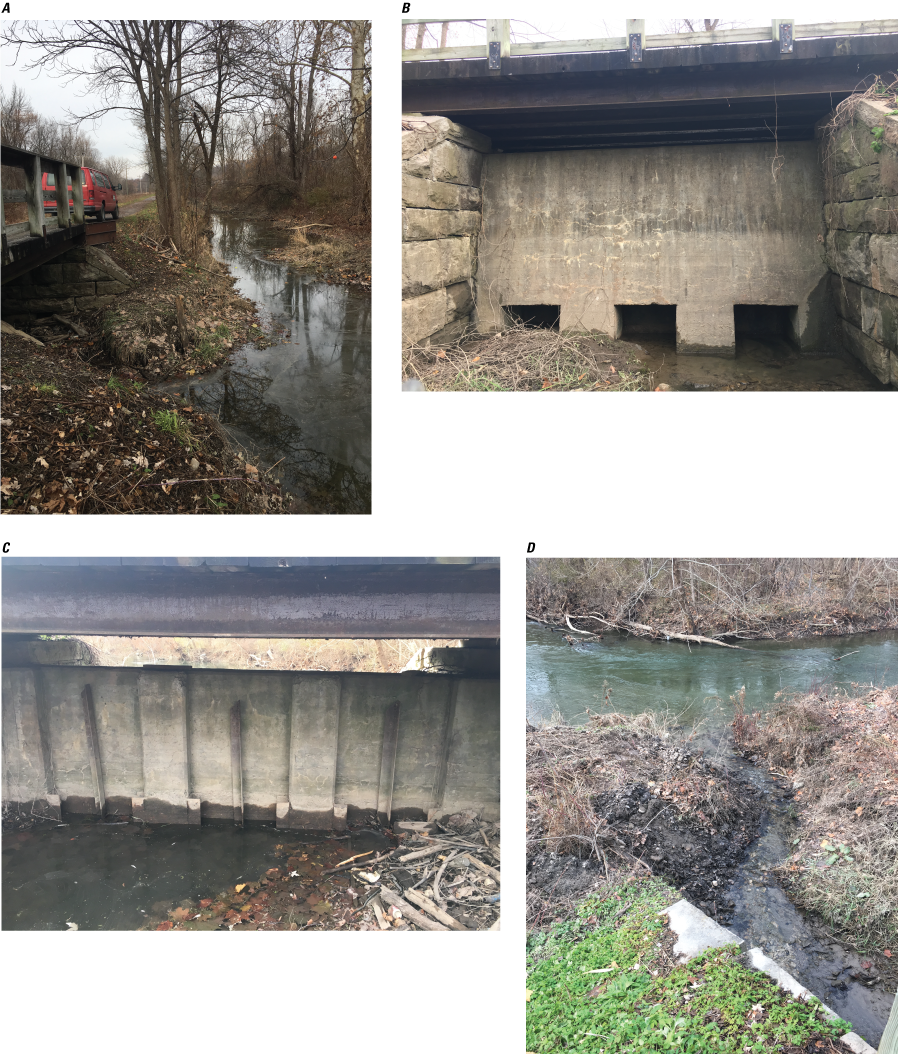
Photographs of an unnamed flow control structure underneath the bridge on Feeder Street. A, Limestone feeder on right. Unnamed control structure underneath the bridge on Feeder Street on left; B, Western face of the unnamed control structure, facing towards Limestone Creek, with three outfall openings; C, Eastern face of the unnamed control structure, facing towards the Limestone feeder, with three outfall gates with lifting bars recessed into concrete structure with metal guides; and D, Water discharging from the Limestone feeder into Limestone Creek from the partially opened outfall gate.
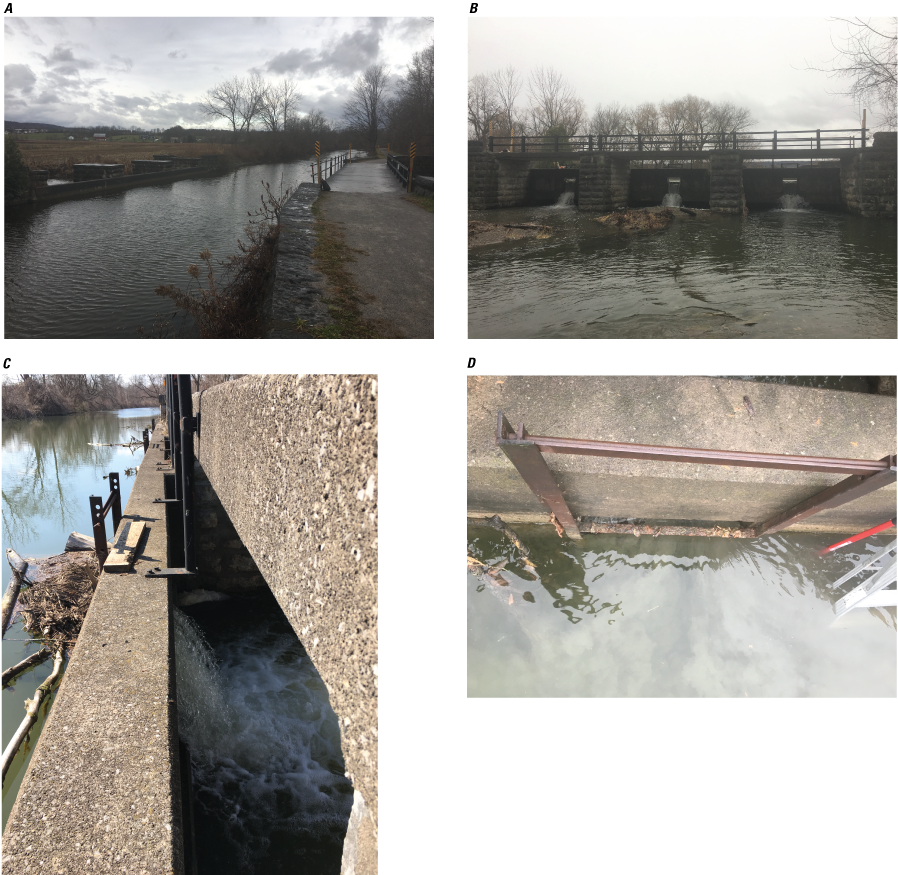
Photographs of structures at Chittenago aqueduct. A, The wide channel at the Chittenago aqueduct conveys the flow of the canal over Chittenango Creek; B, Downstream view of the three outfall openings of Chittenango aqueduct discharging into Chittenango Creek; C, Outfall gage partially closed with flashboards. Flow is seen discharging into Chittenango Creek; and D, Outfall gate with metal lifting bar and metal guides viewed from the canal side.
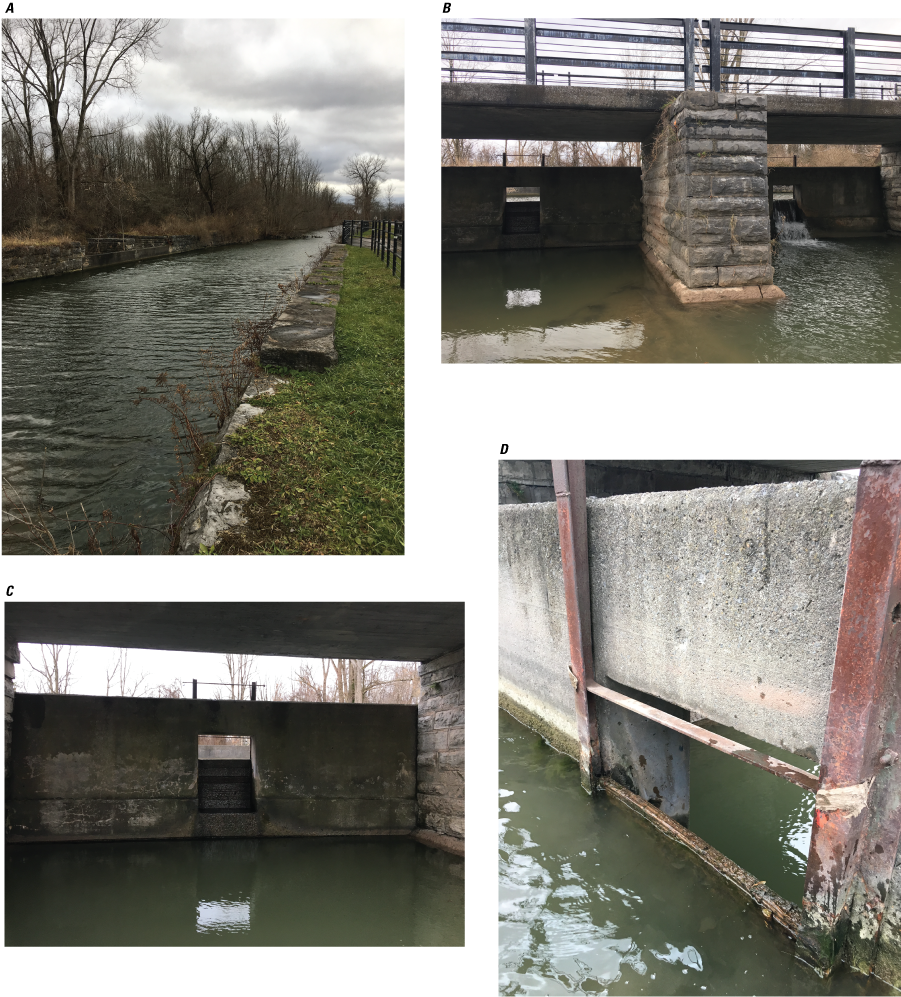
Photographs of structures at Cowaselon aqueduct. A, The wide channel at the Cowaselon aqueduct conveys flow of the canal over Cowaselon Creek; B, Downstream view of the two outfall openings of the Cowaselon aqueduct. Outfall on right shows flow discharging into Cowaselon Creek; C, Downstream view of outfall gate with installed wood flashboards functioning to hold back canal water from discharging into Cowaselon Creek (foreground); and D, Outfall gate with metal lifting bar and metal guides viewed from the canal side.
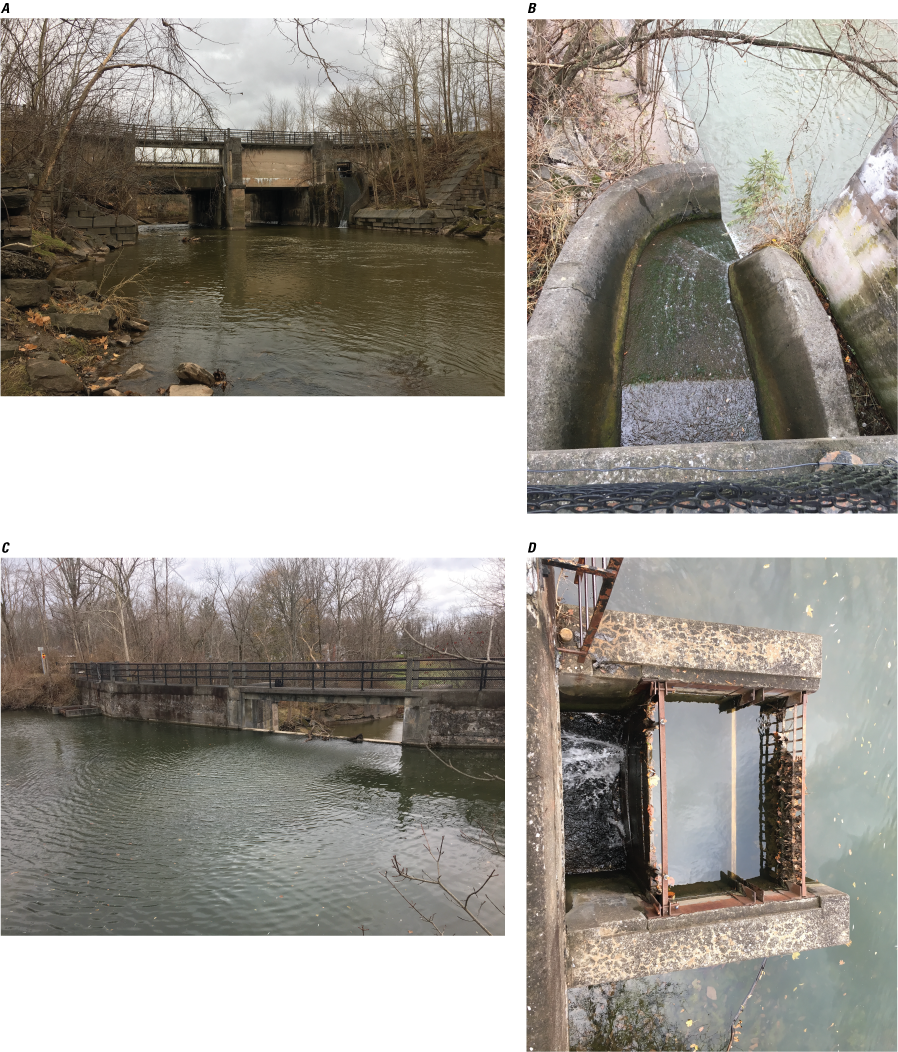
Photographs of structures at Durhamville aqueduct. A, Durhamville aqueduct conveys the canal over Oneida Creek (foreground); B, The spillway of Durhamville aqueduct discharging into Oneida Creek; C, The large rectangular outfall of Durhamville aqueduct is capable of discharging into Onieda Creek; and D, Spillway outfall structure with metal screen and two sets of flashboards installed. Flashboards are seen bowing and leaking water.
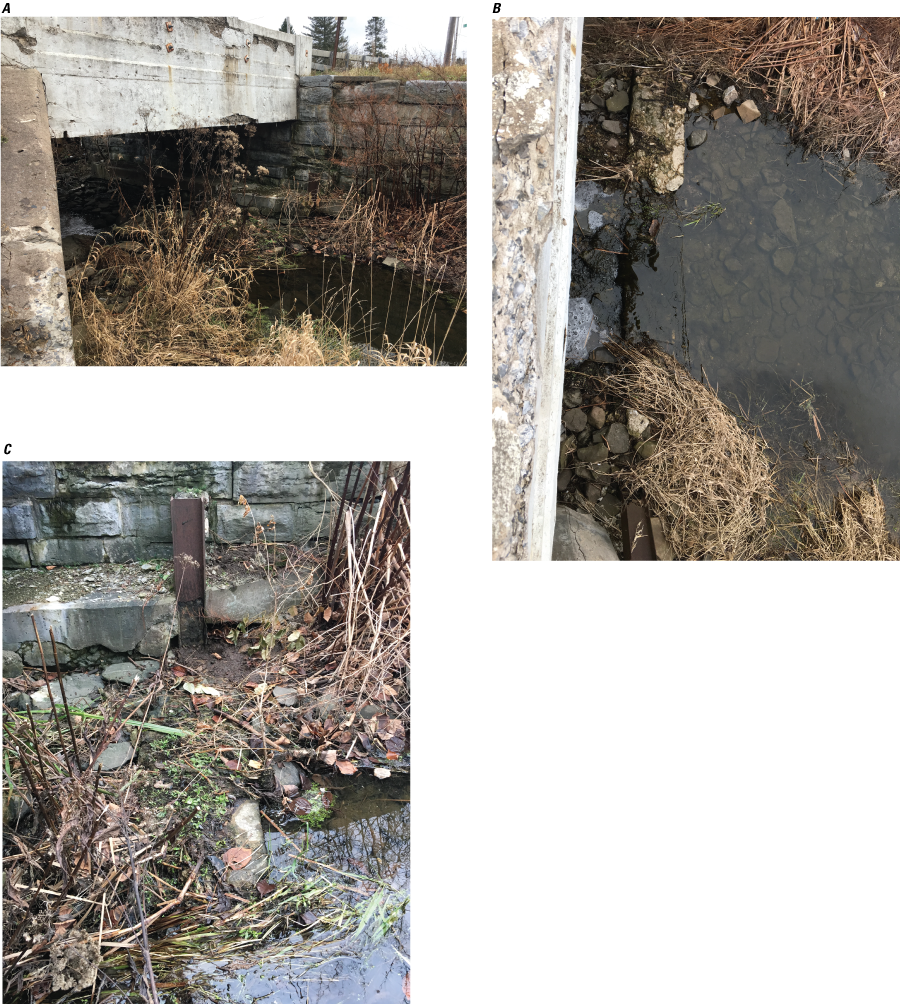
Photographs of structures in the Old Erie Canal near New London Road bridge. A, Structure found underneath New London Road Bridge could potentially be used to raise the water level in the Old Erie Canal; B, Remnants of a concrete base pad underneath New London Road to support flashboards; and C, Steel I-beam designed to accept flashboards to raise water level in the canal upstream from New London Road bridge.
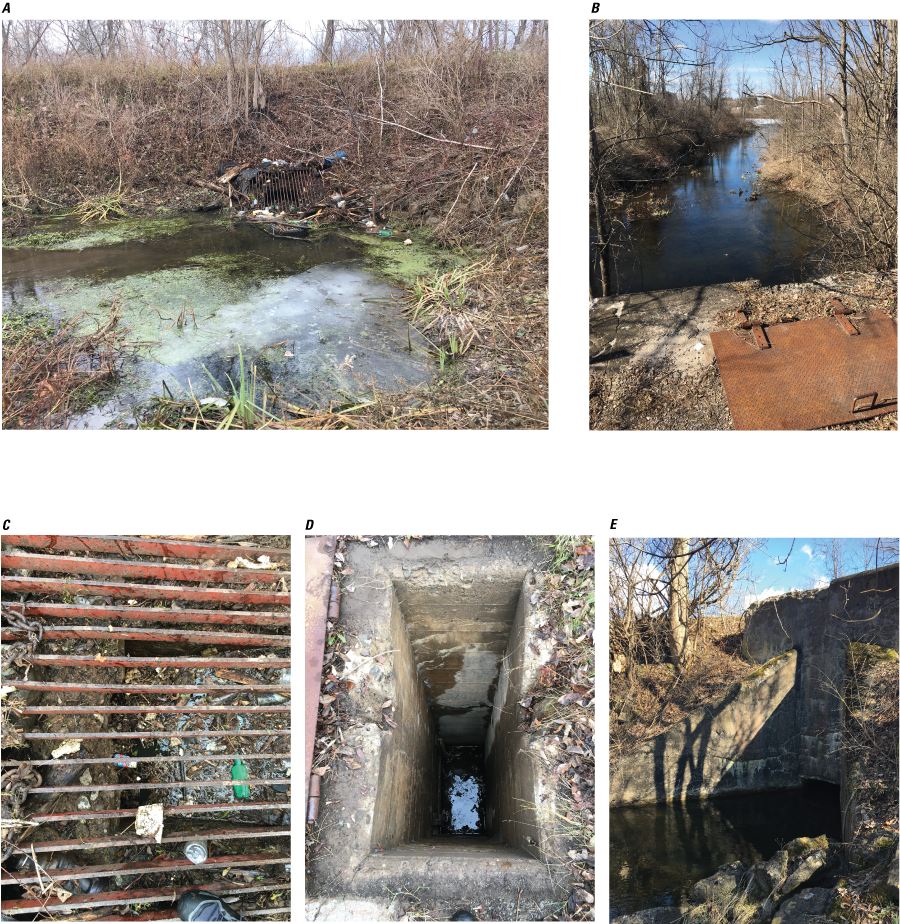
Photographs of structures at the New London sluice gate/culvert where the Old Erie Canal enters the Erie Canal. A, New London sluice gate/culvert viewed from the Old Erie Canal side; B, All flow remaining in the Old Erie Canal enters the Erie Canal; C, Concrete outfall opening and metal screen viewed from the canal side; D, View from access panel. Metal guides at the bottom allow for installation of flashboards; and E, New London sluice gate/culvert exit where all remining flow discharges into the Erie Canal.
Conversion Factors
Temperature in degrees Fahrenheit (°F) can be converted to degrees Celsius (°C) as follows:
°C = (°F – 32) / 1.8
Datums
Vertical coordinate information is referenced to the North American Vertical Datum of 1988 (NAVD 88).
Horizontal coordinate information is referenced to the North American Datum of 1983 (NAD 83).
Elevation, as used in this report, refers to distance above the North American Vertical Datum of 1988 (NAVD 88).
Supplemental Information
Specific conductance is given in microsiemens per centimeter at 25 degrees Celsius (µS/cm at 25 °C).
Concentrations of chemical constituents in water are given in milligrams per liter (mg/L).
Turbidity is given in formazin nephelometric units (FNU).
Frequency is given in hertz (Hz) or megahertz (MHz).
Abbreviations
ADCP
acoustic Doppler current profiler
CORS
Continuously Operating Reference Stations
GNSS
global navigation satellite system
GPS
Global Positioning System
lidar
light detection and ranging
RMSE
root mean square error
SBAS
satellite-based augmentation system
USGS
U.S. Geological Survey
UTM
Universal Transverse Mercator
For more information about this report, contact:
Director, New York Water Science Center
U.S. Geological Survey
425 Jordan Road
Troy, NY 12180–8349
dc_ny@usgs.gov
or visit our website at
https://www.usgs.gov/centers/ny-water
Publishing support provided by the Pembroke Publishing Service Center
Suggested Citation
Wernly, J.F., 2022, Characterization of the bathymetry, hydrodynamics, water quality, infrastructure, and channel condition of the Old Erie Canal from DeWitt to its junction with the current Erie Canal in Verona, near Rome, New York, 2018–19: U.S. Geological Survey Open-File Report 2021–1125, 75 p., https://doi.org/10.3133/ofr20211125.
ISSN: 2331-1258 (online)
Study Area
| Publication type | Report |
|---|---|
| Publication Subtype | USGS Numbered Series |
| Title | Characterization of the bathymetry, hydrodynamics, water quality, infrastructure, and channel condition of the Old Erie Canal from DeWitt to its junction with the current Erie Canal in Verona, near Rome, New York, 2018–19 |
| Series title | Open-File Report |
| Series number | 2021-1125 |
| DOI | 10.3133/ofr20211125 |
| Year Published | 2022 |
| Language | English |
| Publisher | U.S. Geological Survey |
| Publisher location | Reston, VA |
| Contributing office(s) | New York Water Science Center |
| Description | Report: viii, 75 p.; Data Release |
| Country | United States |
| State | New York |
| Other Geospatial | Old Erie Canal |
| Online Only (Y/N) | Y |
| Additional Online Files (Y/N) | N |
| Google Analytic Metrics | Metrics page |