

Spatial Extent of Seagrasses (Zostera marina and Ruppia maritima) along the Central Pacific Coast of Baja California, Mexico, 1999–2000
Links
- Document: Report (6.2 MB pdf) , HTML , XML
- Related Work: OFR 2022-1078 — Abundance of eelgrass (Zostera marina) at key Black Brant (Branta bernicla nigricans) wintering sites along the northern Pacific coast of Baja California, Mexico, 1998–2012
- Data Releases:
- USGS data release — Point sampling data for eelgrass (Zostera marina) and widgeongrass (Ruppia maritima) abundance in embayments of the north Pacific coast of Baja California, Mexico, 1998–2012
- USGS data release — Mapping data of eelgrass (Zostera marina) distribution, Alaska and Baja California, Mexico
- Download citation as: RIS | Dublin Core
Acknowledgments
Jim Bredy and Al Cilurso of U.S. Fish and Wildlife Service-Region 2 collected the aerial photography. Ocean Imaging Corporation acquired and processed the digital multispectral videography. Roxie Anderson of Ducks Unlimited Inc. registered the base maps. Special thanks go to Matthew Anderson, Jose Arturo, Adrian Gall, Tricia Gorby, James Hall, Danielle Mather, Ryan Mathis, Molly McAllaster, Daniel Rizzolo, Dina Roberts, and Marnie Shepherd for field support in the collections of training and ground-truthing data. Thanks also go to Alejandro Cabello-Pasini of the Instituto de Investigaciones Oceanológicas Universidad Autónoma de Baja California, the staff of Exportadora de Sal, S.A., Kuyima Inc., Dorothy and Richard Wheeler, and James White for providing logistical support and assistance.
Abstract
The seagrasses eelgrass (Zostera marina) and widgeongrass (Ruppia maritima) are prominent features of coastal lagoons along the Pacific coast of Baja California, Mexico, supporting a rich diversity of marine life. Yet little is known about their spatial distribution in this region. This is a concern because of declining trends in the abundance and distribution of seagrass in parts of northern Baja California and southern California. We used 7-band satellite imagery, 4-band digital multispectral videography, and 3-band color aerial photography to map the distribution of eelgrass and widgeongrass in six embayments along the central Pacific coast of Baja California. The total spatial extent of seagrass was estimated to be 42,697 hectares, of which about 70 percent was eelgrass. This seagrass was primarily lower in the intertidal than widgeongrass in all embayments. Eelgrass and widgeongrass composed the greatest proportion (47 percent) of the spatial extent in the two largest embayments, Lagunas Ojo de Liebre and San Ignacio, and these two embayments accounted for 85 percent of all seagrass in the study area. The native cordgrass (Spartina foliosa) and pickleweed (Salicornia spp.) were the predominate vegetation cover type of marshes in the three northern and three southern embayments, respectively. The three southern embayments contained mangrove (Rhizophora spp.) and the three northern embayments did not, thus marking the northern edge of mangroves along the Pacific coast of North America. This study establishes an embayment-wide baseline for continuing investigations and monitoring future changes in the spatial abundance of seagrasses in central Baja California.
Introduction
Seagrasses compose the most widespread coastal ecosystems in the world (Green and Short, 2003), providing important ecological services to the marine environment (Costanza and others, 1997) through their high productivity, stability and enrichment of sediments, and support of a complex trophic food web (Duarte and Cebrián, 1996; Hemminga and Duarte, 2000). Seagrass meadows may also reduce the load of disease-causing bacteria, including those that affect humans as well as marine fishes, invertebrates, and mammals, in seawater surrounding seagrass beds (Inaba and others, 2017; Lamb and others, 2017). As such, their distribution and aerial extent may be important indicators of water quality and overall health of a coastal ecosystem (Dennison and others, 1993; Short and Neckles, 1999). Therefore, it is important to inventory seagrass distribution to establish a baseline for future monitoring of trends in these critically important habitats.
Eelgrass (Zostera marina) and widgeongrass (Ruppia maritima) are important seagrasses of protected coastal embayments of the central Pacific coast of Baja California (26 to 28 degrees North; Ibarra-Obando and Rios, 1993; Wyllie-Echeverria and Ackerman, 2003, Ward and others, 2004, Ward 2022a). This region is within the southern edge of the range of eelgrass in the north Pacific (Wyllie-Echeverria and Ackerman, 2003). Here, seagrass meadows provide food and refuge for a variety of ecologically and commercially important fauna, such as bivalves (for examples, oysters [Crassostrea gigas] and scallops [Argopecten ventricosus]), lobsters (Panulirus interruptus), crabs, turtles (Chelonia mydas), juvenile fish, and hundreds of thousands of migrating and resident waterbirds, including greater than (>) 100 species and about 30 percent of the world’s population of black brant (Branta bernicla nigricans; Massey and Palacios, 1994; Page and others, 1997; Aguirre-Muñoz and others, 2001; Ibarra-Obando and others, 2001; Lewis and others, 2020). A significant portion of the economy (for example, commercial and sport fisheries, aquaculture, sport hunting, and tourism) of Baja California depends on the marine resources of these coastal embayments (Aguirre-Muñoz and others, 2001).
Despite the importance of seagrasses to the health of the coastal ecosystems of Baja California, quantifiable data on the spatial distribution of seagrasses are largely lacking. These data are particularly important because coastal areas of Baja California are under increasing threats, both direct and indirect, from human activity (for example, aquaculture, overfishing, and climate warming; Ibarra-Obando and Escofet 1987; Ortega and Castellanos, 1995; Aguirre-Muñoz and others, 2001). Moreover, these threats have been linked to declines in the abundance and spatial extent of seagrasses in northern Baja California (Cabello-Pasini 1984; Ward and others 2003) and in southern California (Johnson and others, 2003, Harenčár and others, 2018). Changes to the distribution and abundance of seagrasses may have major implications for migratory birds and mammals that forage in these habitats (Ward and others, 2005).
The objective of this study was to estimate the distribution and spatial extent of seagrasses in embayments of the central Pacific coast of Baja California, Mexico to acquire baseline data that can be used to monitor trends in this critically important habitat.
Methods
Study Area
The mapping of eelgrass and widgeongrass occurred in six shallow-water (average depth of less than [<] 6 meters, m), hypersaline embayments in or near the Vizcaino Biosphere Reserve, Mexico's largest protected area (fig. 1). The seagrass mapping occurred in two biologically distinct regions in the reserve, hereafter referred to as the northern and southern embayments. The northern embayments were Lagunas Ojo de Liebre (LOL), Guerrero Negro (LGN), and Manuela (LM; fig. 1). High intertidal areas of these embayments are characterized by expansive marshes dominated by cordgrass (Spartina foliosa), a native cordgrass to North America, and by pickleweed (Salicornia spp.), saltwort (Batis maritima), and sea-blite (Sueda spp.). The southern embayments were Laguna San Ignacio (LSI), and Estero Coyote (EC) and Estero San Juan (ESJ; fig. 1) and the high intertidal areas of these embayments are comprised of mangroves (Rhizophora spp.) and marshes dominated by pickleweed, salt-wort, and sea-blite. Upland habitat adjacent to all embayments is sparsely vegetated xeric shrublands, salt pannes, and sand dunes. The region experiences little annual precipitation (<11 centimeters per year) with most occurring between October and March, persistent northwesterly winds from March through November, and high evaporation rates (Phleger and Ewing, 1962; Cabello-Pasini and others 2003).
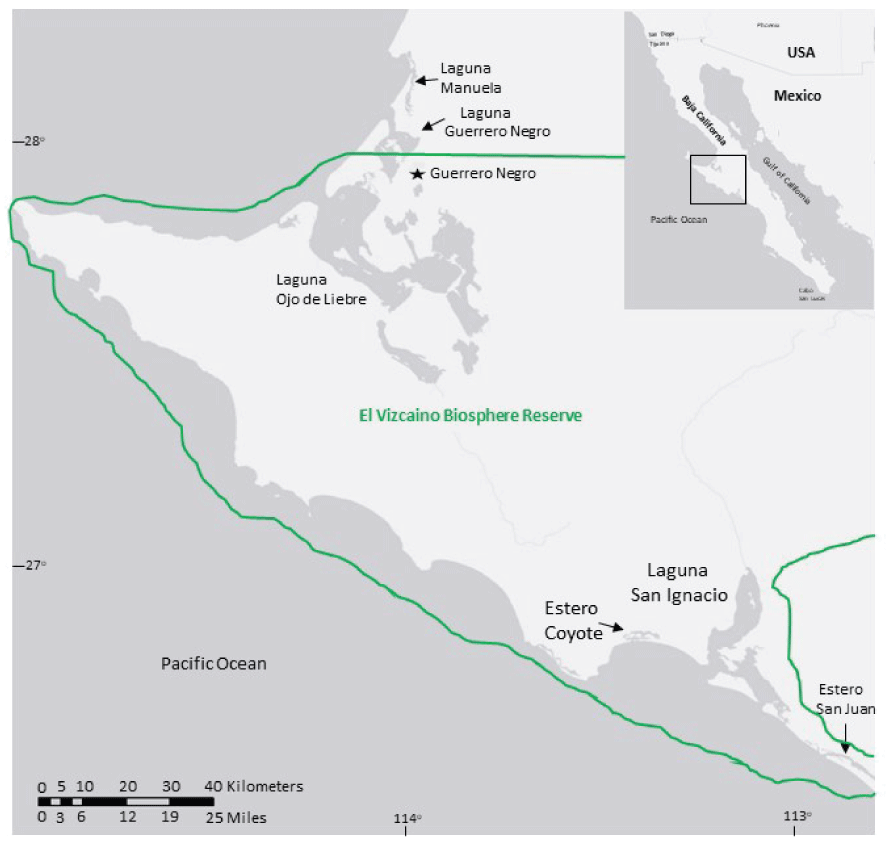
The locations of the six embayments that were assessed for seagrass distribution and spatial extent along the central Pacific coast of Baja California, Mexico. The solid line is the boundary of the Vizcaino Biosphere Reserve.
LOL and LSI are among the largest (59 and 25 square kilometers, respectively) along the Pacific coast of Baja California. These two lagoons have relatively deep (up to 25 m) and wide (1–3 kilometers, km) main tidal channels. LOL and LSI are also the principle calving and nursery areas for the northeastern Pacific population of gray whale (Eschrichtius robustus) and important nursery areas for harbor seals (Phoca vitulina), and California sea lions (Zalophus californianus; Rice and others, 1981).
All embayments, except LOL and LGN, are relatively pristine and undeveloped. LGN underwent considerable alteration in the 1950s and 1960s and LOL in later years in support of one the largest salt producing operations in the world (Eberhardt 1966). Large salt pannes and shrublands next to LOL and LGN were converted to evaporation ponds or filled to construct buildings and roads. Smaller areas inside the lagoon (channels, salt marshes) were dredged to enable passage of transport barges or filled to accommodate roads and a shipping dock. Human activity is relatively high in these two lagoons. The town of Guerrero Negro (approximately 14,000 residents) is located <2 km away from the two lagoons. Fishing occurs in LOL and LGN but is regulated during the breeding season of gray whales and island-nesting waterbirds (for example, egret, Egretta spp.) and raptors (for example, Osprey, Pandion haliaetus). The most frequent human activity in the lagoon is boating associated with barging salt, whale-watching (January–March), and commercial fishing and clamming (year-round).
The three southern embayments are farther from paved roads and major populated centers and have less human activity. About 100 people reside year-round at LSI and use the lagoon to commercially fish and farm oysters. Boat activity in this lagoon peaks during the whale-watching season. The nearest town to the three southern embayments is San Ignacio (approximately 500 residents), about 50 to 90 km to the east. There is little or no human activity in ESJ and EC.
Image Acquisition and Preparation
The distribution and spatial extent of seagrasses were assessed in the six embayments using aerial photography (3-band, color aerial photography and 4-band, color digital multispectral videography) or satellite (7-band Landsat TM, Thematic Mapper) imagery (Ward, 2022), following standard remotely sensed procedures for seagrass mapping (Dobson and others, 1995; Ward and others, 2003, 2004). Color aerial photographs were acquired in LOL, LGN, and LM during a low tide (0.0 to –0.4 m mean lower low water, MLLW) on January 17, 2000 and in LSI and ESJ during a low tide (0.0 to –0.3 m MLLW) on January 18, 2000. Photographs were taken by the U.S. Fish and Wildlife Service from a Partenavia twin-engine aircraft specially equipped for large format, vertical photography. The photographs were digitized, mosaicked together, radiometrically corrected, and georeferenced to Landsat TM imagery encompassing either the northern or southern embayments. The Landsat TM imagery for the northern embayments was taken on March 24, 1999 during an approximate 0.2 m MLLW tide height in LOL, LGN and LM. The closest cloud-free, low tide Landsat TM imagery to the date of aerial photography for the southern embayments was taken on September 5, 1992 during an approximate tide height of 0.9 MLLW in LSI, ESJ and EC. We spatially georeferenced the two satellite base images to ground control points. To improve spatial accuracy, we spread the control points around each of the embayments, except for the southern embayments where control points were concentrated near LSI because of the lack of quality identifiable landmarks near ESJ and EC. The resulting georeferenced imagery was then projected in the 1984 World Geodetic System datum, Universal Transverse Mercator Zone 12 North. The spatial resolutions of photomosaics and satellite imagery were 2 m and 30 m, respectively.
Digital multispectral videography was acquired at EC. This imagery was taken by Ocean Imaging Inc. on December 20, 1999, using a four-camera system (SpecTerra Systems, Ltd., Mark 1) mounted to the belly of a Partenavia twin-engine aircraft. Each video camera was fitted with a different wavelength color filter (450, 550, 650, or 750 nanometer) to optimize spectral delineation of seagrasses above and below the water surface. The aircraft maintained an altitude of 3,000 m and flew several flight lines to cover each of the embayments. The tide was low (0.0 to –0.3 m MLLW) and winds were light (<10 km per hour) during the image acquisition period (approximately 2 hours). The digital multispectral videography imagery was processed by Ocean Imaging Inc. and georeferenced to the 1992 Landsat TM imagery of the region resulting in a 2-m pixel spatial resolution image of EC.
Classification
The spectral quality of the higher spatial resolution photomosaic imagery for the three northern embayments was poor and could not be used reliably to map seagrasses in these embayments. The primary issue of the photomosaic was sun glare, which caused problems differentiating spectral signals among the vegetation types, particularly between eelgrass and cordgrass, a cover type that composed a large portion of high intertidal areas in these northern embayments. Therefore, we used the 30-m spatial resolution 1999 Landsat TM imagery to map eelgrass and widgeongrass in LOL, LGN, and LM.
Sun glare was less of an issue when classifying the aerial (photomosaic and digital multispectral videography) imagery of the southern embayments, where mangroves replaced cordgrass in intertidal areas. Vegetative spectral signatures were more distinguishable between mangroves and seagrasses, and the aerial imagery was used to map seagrass distribution in these three embayments.
We used an unsupervised isodata clustering algorithm to identify statistically separable spectral cover types and then classified all imagery into six primary cover types and six subcover types with a supervised maximum likelihood analysis (Ward and others, 1997; Ozesmi and Bauer, 2002; Hogrefe and others, 2014). The six primary cover types were: seagrass, unvegetated, salt marsh, mangrove, salt panne, and channel (submerged unvegetated; water depth <–2 m MLLW). Subcover types were identified for seagrasses (intertidal eelgrass, intertidal widgeongrass, intertidal mixed eelgrass and widgeongrass, and submerged mixed eelgrass and widgeongrass) and salt panne (unmodified and modified salt extraction pond). Macroalgae were not classified because these plants were commonly in seagrass meadows and could not be differentiated spatially or spectrally from the two types of seagrass.
Field surveys were conducted to choose isodata clusters that could provide the cleanest least ambiguous examples of the different cover types. This approach minimized classification errors resulting from variable light conditions and increasing water depths in substrate types across imagery. Training data to classify cover types in the three northern embayments were collected in LOL during November–December 1999 (n = 155) points. In southern embayments training data were collected in LSI during November–January 1998–1999 (n = 163) and November–December 1999 (n = 206). The LSI imagery was also resampled to a 20-m spatial resolution to improve classification accuracy of cover types. No training data were collected in the other northern (LGN, LM) and southern (EC, ESJ) embayments.
Mapping accuracy of the cover types was evaluated using the percent cover determinations made during January–February 1999 in LOL, and during December–January 2003 in EC, ESJ, and LSI. Field survey points were distributed across LOL and LSI embayments using a systematic random design (1-km spacing between points) and accessed by boat using a global positioning system unit. No survey points were placed in marshes in LOL, so classification accuracy was not evaluated for this cover type in northern embayments. Points were sampled by snorkeling in dry suits primarily during high tide. At each point, water depth and percent cover of the cover types was estimated within four 0.25 square meter quadrats. In EC and ESJ field survey points were made along line transects placed across different cover types and locations in each of these embayments. Water depth (m) measurements were standardized to MLLW by subtracting the measured depth from the predicted tide depth for San Carlos, Baja California.
Estimates of seagrass percent cover were simplified to present (>5 percent seagrass cover) or absent (<5 percent seagrass cover) categories to approximate the cover required to produce a spectral signal of seagrass (Valta-Hulkkonen and others, 2003). Accuracy was then estimated using a confusion matrix comparing classified cover types to field survey data cover types and estimating errors of omission and commission, and overall accuracy of the image classification. Omission accuracy assessed the percentage of the map data that agreed with the field survey data assuming that the survey data were correct, whereas commission accuracy evaluated the percentage of the field survey data that agreed with the map data assuming that the map was correct. Overall accuracy of the classified imagery was calculated as the number of correctly classified points divided by total number of points. The amount (hectares, ha) of each habitat class was determined using GIS software ARC/INFO (Morehouse, 1992).
Results and Discussion
Seagrasses composed a significant portion of the spatial extent in five of the six embayments (table 1). In the three largest (>12,000 ha; LOL, LGN and LSI) embayments, seagrasses covered between 34 percent and 47 percent of the total area (table 1). Salt marshes or mangroves (35–67 percent) dominated cover types in the other, much smaller (<4,000 ha; LM, EC, ESJ), embayments. Eelgrass was the most spatially abundant seagrass in all embayments, dominating the low intertidal and shallow subtidal (0.0 to –2.5 m) areas (Ward 2022a, b). Monotypic stands of widgeongrass were predominately in the mid-intertidal (approximately 0.3–1.0 m) whereas mixed stands of eelgrass and widgeongrass were in slightly lower intertidal (approximately 0.0–0.3 m) areas.
Table 1.
Spatial extent and percentage of total cover of seagrasses and other cover types in six embayments along the central Pacific coast of Baja California, Mexico.[—, not applicable]
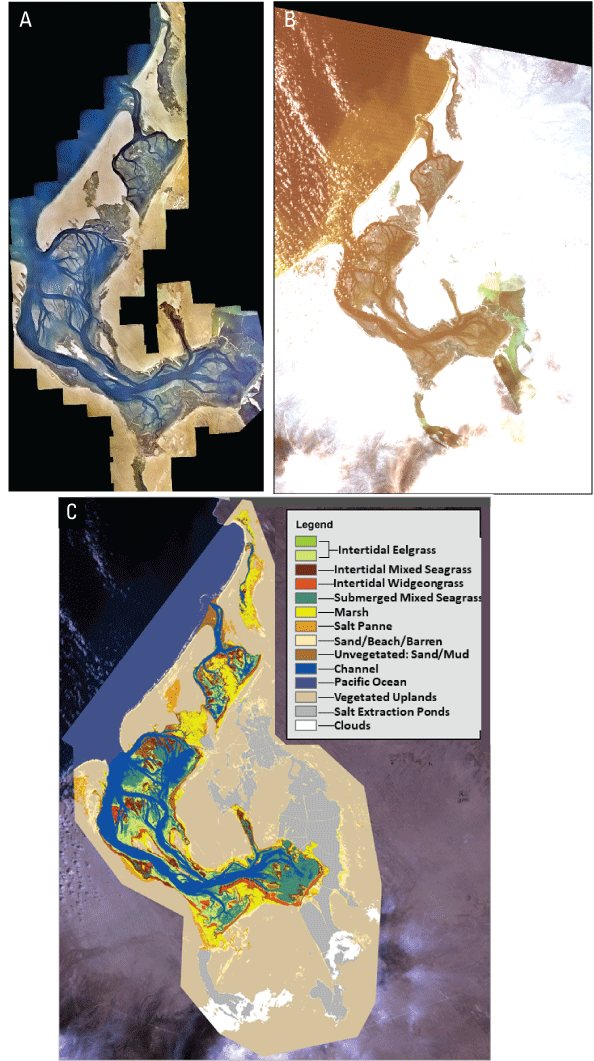
The spatial extent of seagrasses and other cover types in Lagunas Ojo de Liebre, Guerrero Negro, and Manuela, Baja California, Mexico. 3-band color photomosaic imagery (A), 7-band 1999 Landsat TM satellite imagery (B), and 7-band 1999 Landsat TM satellite imagery showing cover type classification (C).
In northern embayments, particularly LOL, continuous stands (density >50 percent) of intertidal eelgrass were found in the front half of the lagoon, mainly on the backside of the sandflats at the mouth of the lagoon or mid-lagoon (fig. 2). In the back half of LOL, eelgrass occurred primarily in the subtidal, probably because of the higher water temperatures, reduced turnover of seawater during tidal exchanges, and higher salinities than in the front half of the lagoon (Phleger and Ewing, 1962). Widgeongrass, which tolerates high temperature and salinities (Mayer and Low, 1970), was more abundant in this part of the lagoon than in the front half of the lagoon.
Salt marshes (13–67 percent) and channels (11–33 percent) were the next most abundant cover type in northern embayments (table 1). In LM, the cordgrass-dominated salt marshes composed over half (67 percent) of the overall spatial extent of this lagoon (table 1). The cordgrass-dominated salt marshes of these northern embayments are the largest in Mexico and among the largest stands of this native cordgrass (Spartina foliosa) across its range which extends from northern California to the central Pacific coast of Baja California (Spicher and Josselyn, 1985; Ward and others, 2004). Channels were most significant in LOL with water depths reaching >20 m near the mouth of the lagoon. Because of the overall length (51 km) and width (6–13 km) of LOL, timing of tides can vary by up to 3 hours between the mouth and back of the lagoon (this study).
The overall classification accuracy of the 1999 satellite imagery was good at 79 percent (table 2). The accuracy of all seagrass species combined was also good at 95 percent (table 2); however, when seagrass was split into separate specie categories accuracy declined considerably (accuracy of intertidal eelgrass: 41 percent; intertidal widgeongrass: 23 percent; intertidal seagrass mixed: 67 percent). This drop in accuracy was expected because of the overlap in spectral characteristics and spatial extent of eelgrass and widgeongrass and the difficulty to distinguish spectral signals between these species (Mumby and others, 1997; Ward and others, 2004). This problem of subcover type accuracy was also intensified by the low densities of the seagrasses in these embayments (eelgrass: mean = 20 percent; widgeongrass: mean = 10 percent; Ward, 2022a).
Table 2.
Diagonal matrix of field survey reference data from 1999 showing cover type classification accuracy of the 1999 Landsat TM imagery of Lagunas Ojo de Liebre, Guerrero Negro, and Manuela, Baja California, Mexico.[—, not applicable]
In the southern embayments, widgeongrass dominated high intertidal areas and eelgrass dominated low intertidal and subtidal areas. Eelgrass was more abundant at deeper depths in the southern embayments than in the northern embayments (table 1), possibly due to the increased irradiance and warmer temperatures that plants experience in southern than in northern embayments (Cabello-Pasini and others, 2003). Future research into the influence of warmer temperatures is needed to address this possibility. Overall, however, eelgrass populations of the central Pacific coast of Baja California are exposed to twice the irradiance levels and 18–32 percent higher average maximum water temperatures as eelgrass populations further north along the Pacific coast of Baja California (for example, Bahia San Quintin; Cabello-Pasini and others, 2003).
In LSI, seagrass composed about 34 percent of the total area of the lagoon (table 1; fig. 3). Eelgrass was the dominant seagrass in the lagoon with continuous stands of eelgrass occurring primarily in subtidal areas of the mid to back half of LSI (fig. 3). Overall, eelgrass composed about 63 percent (5,301 ha) of the spatial extent of seagrasses in the lagoon, of which 59 percent were in subtidal areas (table 1). The maximum depth limit of eelgrass in LSI was about –6 m MLLW. In contrast, monotypic stands of widgeongrass composed about 33 percent of the spatial extent of seagrasses and nearly all its coverage occurred in intertidal areas (table 1; fig. 3). Mixed beds of intertidal eelgrass and widgeongrass composed a small portion (4 percent) of the seagrass coverage in LSI. Channels (31 percent) and unvegetated sand and mudflats (23 percent) were the next most abundant cover type in LSI. Salt marshes, which were dominated by pickleweed, and mangroves were of similar size, composing about 6 percent of the overall extent of the lagoon.
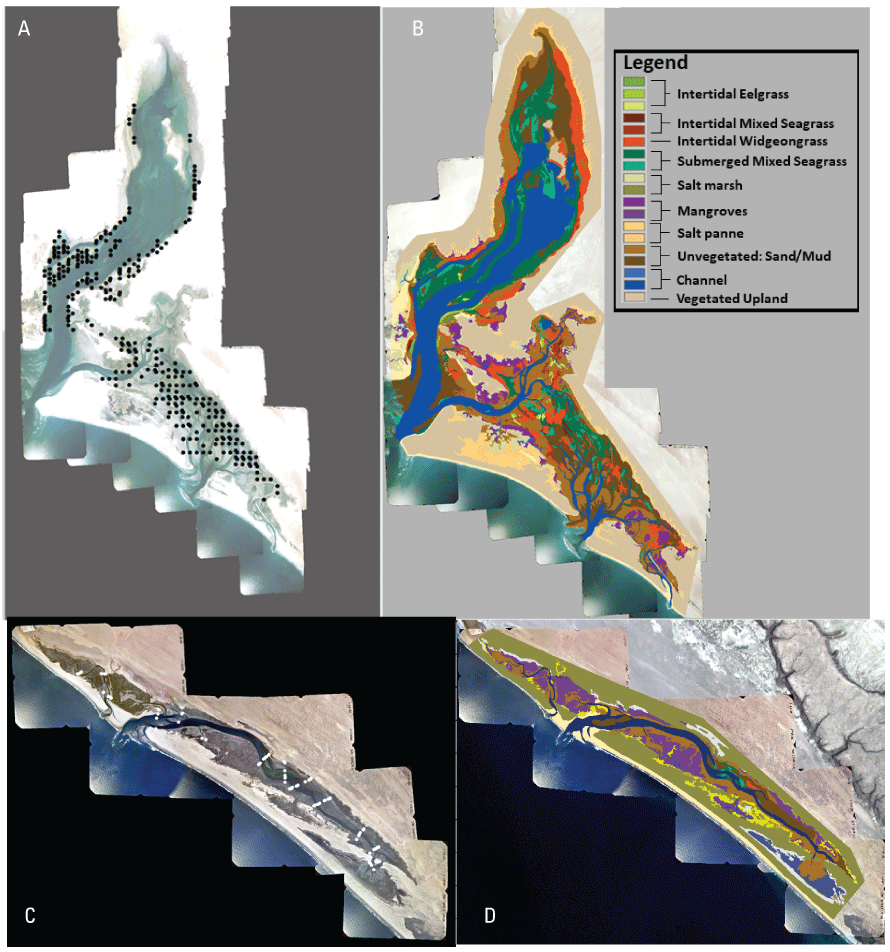
Ground-truthing sample points and vegetation coverage types in Laguna San Ignacio and Estero San Juan, Baja California, Mexico. Ground-truthing sample points (dots) in Laguna San Ignacio (A), vegetation coverage classification in Laguna San Ignacio (B), ground-truthing sample points (dots) in Estero San Juan (C), and vegetation coverage classification in Estero San Juan (D).
Whereas the overall classification accuracy of the photomosaic imagery of LSI was good at 70 percent (table 3), the classification accuracy of the subcover types ranged from poor (intertidal eelgrass; 35 percent; intertidal mixed seagrasses: 36 percent) to good (intertidal widgeongrass: 67 percent; submerged mixed seagrasses: 79 percent). Reasons for the low classification accuracy of the seagrass subcover types in the photomosaic were like those for the satellite imagery of the northern embayments (in other words, spectral wavelength overlap of the two seagrass species combined with their low-density coverage of the seagrass species).
Spatial coverage estimates for ESJ should be considered preliminary because the overall classification accuracy of this imagery was poor at 40 percent (table 4). The main reason for the low classification accuracy for this embayment was due to the lack of identifiable landmarks to obtain quality control points to register this image. There were a high number of locational mismatches between ground-truthing and classified map points, suggesting a registration issue. This issue was emphasized by the poor accuracy estimates for mangroves, which were highly identifiable in the LSI imagery (>90 percent accuracy).
Table 3.
Diagonal matrix of field survey reference data from 1998–99 showing land cover classification accuracy of 2000 aerial photographic imagery of Laguna San Ignacio, Baja California, Mexico.[—, not applicable]
Table 4.
Diagonal matrix of field survey reference data from 1998–99 showing land cover classification accuracy of 2000 aerial photographic imagery of Estero San Juan, Baja California, Mexico.[—, not applicable]

Estero Coyote, Baja California Mexico. Ground-truthing sample points (A; dots) and vegetation coverage classification (B).
Table 5.
Diagonal matrix of field survey reference data from 1998–99 showing land cover classification accuracy of 2000 aerial photographic imagery of Estero Coyote, Baja California, Mexico.[—, not applicable]
The 4-band, digital multispectral videography of EC was robust at differentiating primary cover types in this embayment (fig. 4); however, the overall classification accuracy of this imagery was poor at 35 percent (table 5). The poor classification accuracy is also likely related to the same registration problems experienced for the ESJ imagery. EC and ESJ are remotely located with no permanent structures or other landmarks near the embayments to obtain quality control points. As with ESJ, estimates of spatial extent of the cover types of EC should be considered preliminary. A reassessment of seagrasses in EC and ESJ could be made after the EC and ESJ images are re-registered with higher quality control points.
This study provides a baseline assessment for the distribution of seagrasses in embayments of the central Pacific coast of Baja California. We provide the first estimates of the spatial extent of eelgrass and widgeongrass in LOL, LGN, LM, and LSI and preliminary estimates for ESJ and EC that can be used to monitor future changes in the distribution of these seagrass species in these embayments. These six embayments contain a significant portion of seagrasses along the Pacific coast of Baja California (Wyllie-Echeverria and Ackerman, 2003; Ward and others, 2004). Eelgrass monitoring is encouraged in Baja California because of declining trends in eelgrass abundance and distribution in some of its west coast embayments (Ward and others, 2003; Rodríguez-Salinas and others, 2010). Northern Mexico is the southern limit of the range of eelgrass in northeastern Pacific (Wyllie-Echeverria and Ackerman, 2003). Eelgrass populations of this region are already under maximal thermal stress and may be at higher risk from impacts of climate change (Short and Neckles, 1999), such as increased risks of sedimentation from coastal flood events, El Niño storm events, disease, and rising sea temperatures and sea level (Harvell and others, 2002; Ward and others, 2003; Muñiz-Salazar and others, 2006; Cai and others, 2014).
References Cited
Cai, W., Borlace, S., Lengaigne, M., Van Rensch, P., Collins, M., Vecchi, G., Timmermann, A., Santoso, A., McPhaden, M.J., Wu, L., England, M.H., Wang, G., Guilyardi, E., and Jin, F.F., 2014, Increasing frequency of extreme El Niño events due to greenhouse warming: Nature Climate Change, v. 4, no. 2, p. 111–116.
Dobson, J.E., Bright, E.A., Ferguson, R.L., Field, D.W., Wood, L.L., Haddad, K.D., Iredale, H., Jensen, J.R., Klemas, V.V., Orth, R.J., and Thomass, J.P., 1995, NOAA coastal change analysis program (C-CAP)—Guidance for regional implementation: Seattle, Washington, National Oceanic and Atmospheric Administration, Technical Report 123.
Lewis, T.L., Ward, D.H., Sedinger, J.S., Reed, A., Derksen, D.V., Carboneras, C., Christie, D.A., and Kirwan, G.M., 2020, Brant (Branta bernicla), version 1.0, in Billerman, S.M., ed., Birds of the World: Ithaca, New York, Cornell Lab of Ornithology, accessed July 14, 2021, at https://doi.org/10.2173/bow.brant.01.
Ward, D.H., 2022a, Abundance of eelgrass (Zostera marina) at key Black Brant (Branta bernicla nigricans) wintering sites along the northern Pacific coast of Baja California, Mexico, 1998–2012: U.S. Geological Survey Open-File Report 2022–1078, 15 p., https://doi.org/10.3133/ofr20221078.
Ward, D.H., 2022b, Point sampling data for eelgrass (Zostera marina) and widgeongrass (Ruppia maritima) abundance in coastal embayments of northern Baja California, Mexico, , 1998–2012: U.S. Geological Survey data release, https://doi.org/10.5066/P9H4LBP3.
Ward, D.H., and Hogrefe, K.R., 2022, Mapping data of eelgrass (Zostera marina) distribution, Alaska and Baja California, Mexico: U.S. Geological Survey data release, https://doi.org/10.5066/P9WEK4JI.
Conversion Factors
For information about the research in this report, contact
Director, Alaska Science Center
U.S. Geological Survey
4210 University Drive
Anchorage, Alaska 99508
https://www.usgs.gov/centers/asc/
Manuscript approved on January 5, 2022
Publishing support provided by the U.S. Geological Survey
Science Publishing Network, Tacoma Publishing Service Center
Suggested Citation
Ward, D.H., Morton, A., Markon, C.J., and Hogrefe, K.R., 2022, Spatial extent of seagrasses (Zostera marina and Ruppia maritima) along the central Pacific coast of Baja California, Mexico, 1999–2000: U.S. Geological Survey Open-File Report 2022–1004, 13 p., https://doi.org/10.3133/ofr20221004.
ISSN: 2331-1258 (online)
Study Area
| Publication type | Report |
|---|---|
| Publication Subtype | USGS Numbered Series |
| Title | Spatial extent of seagrasses (Zostera marina and Ruppia maritima) along the central Pacific coast of Baja California, Mexico, 1999–2000 |
| Series title | Open-File Report |
| Series number | 2022-1004 |
| DOI | 10.3133/ofr20221004 |
| Year Published | 2022 |
| Language | English |
| Publisher | U.S. Geological Survey |
| Publisher location | Reston, VA |
| Contributing office(s) | Alaska Science Center Biology WTEB |
| Description | Report: vi, 13 p.; Data Release |
| Country | Mexico |
| Other Geospatial | Baja California |
| Online Only (Y/N) | Y |
| Google Analytic Metrics | Metrics page |