

Chenier Plain Region Bathymetric and Topographic Datasets: Methodology Report
Links
- Document: Report (6.62 MB pdf) , HTML , XML
- Download citation as: RIS | Dublin Core
Acknowledgments
This study is part of the Coastal Protection and Restoration Authority (CPRA) Barrier Island Comprehensive Monitoring (BICM) program (and was carried out under CPRA contract number 2000339324, BICM2—Chenier TopoBathy DEM). The authors thank project managers Darin Lee and Dr. Syed Khalil for their collaboration on this study and valuable review of the report. The authors acknowledge the U.S. Geological Survey (USGS) field teams for years of data collection and processing, Betsy Boynton for assistance in the graphics, and USGS scientists Nancy DeWitt and Chelsea Stalk for their valuable review.
Introduction
The Chenier Plain region of coastal Louisiana (La.) consists of a broad, very shallow, muddy, microtidal shelf with a low-elevation shoreline. For this study, the region is divided into an eastern study area that extends from Marsh Island, La., to the Mermentau River inlet (fig. 1) and a western study area that extends from the Mermentau River inlet to Sabine Pass. The coast of the eastern study area is characterized by isolated sandy beach ridges (cheniers) surrounded by broad mudflats and lakes (Gould and McFarlan, 1959). The shoreline in this section of the study area consists largely of marsh deposits outcropping directly into the Gulf of Mexico (fig. 2), and there is little sand in the system. Progradational cheniers are better preserved in the western study area, and the shoreface becomes sandier and steeper between Calacasieu and Sabine passes (fig. 3), although the offshore sediments predominantly consist of mud. There is little human development along the coast of Chenier Plain region, with a large portion of the eastern study area consisting of the Rockefeller Wildlife Refuge (RWR), the State Wildlife Refuge, and the Marsh Island Wildlife Refuge.
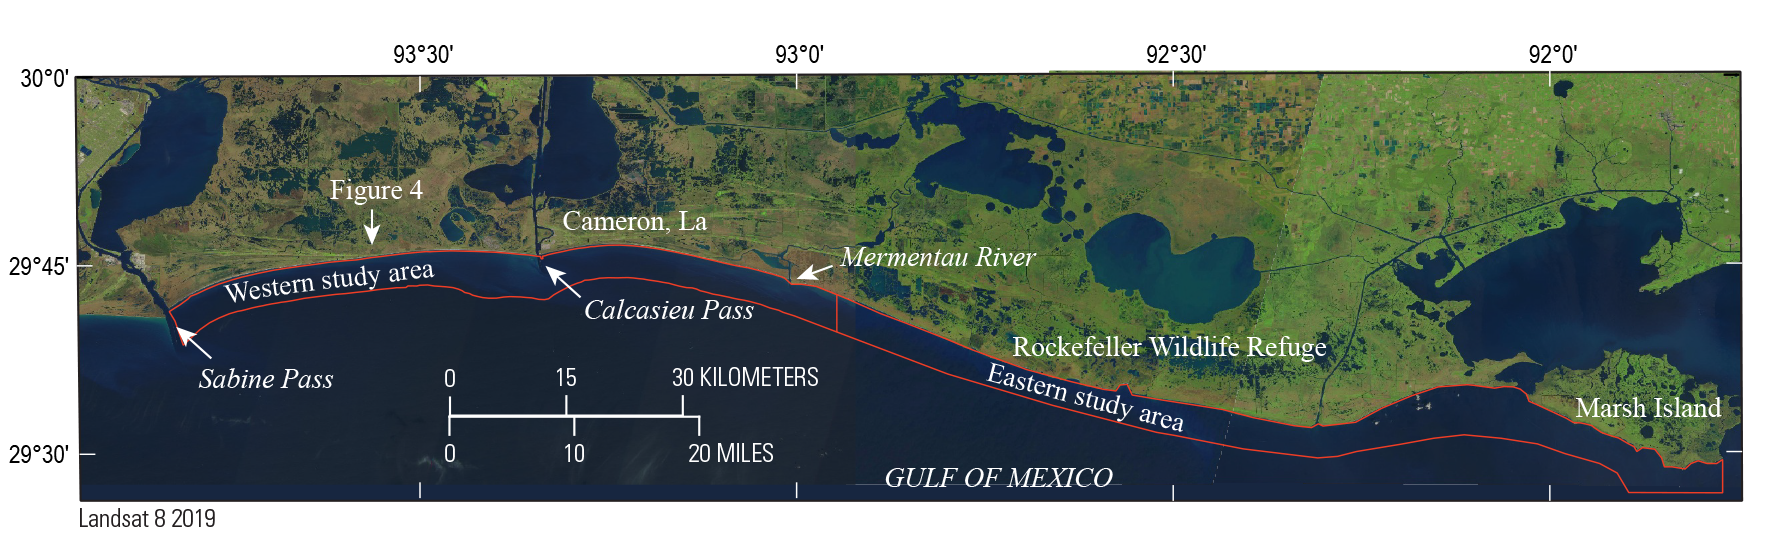
U.S. Geological Survey Landsat 8 imagery showing the Chenier Plain region of the Louisiana (La.) coast, which is divided into a western study area (Sabine Pass to Mermentau River inlet) and an eastern study area (Mermentau River inlet to Marsh Island, La.). The study areas are outlined in red.
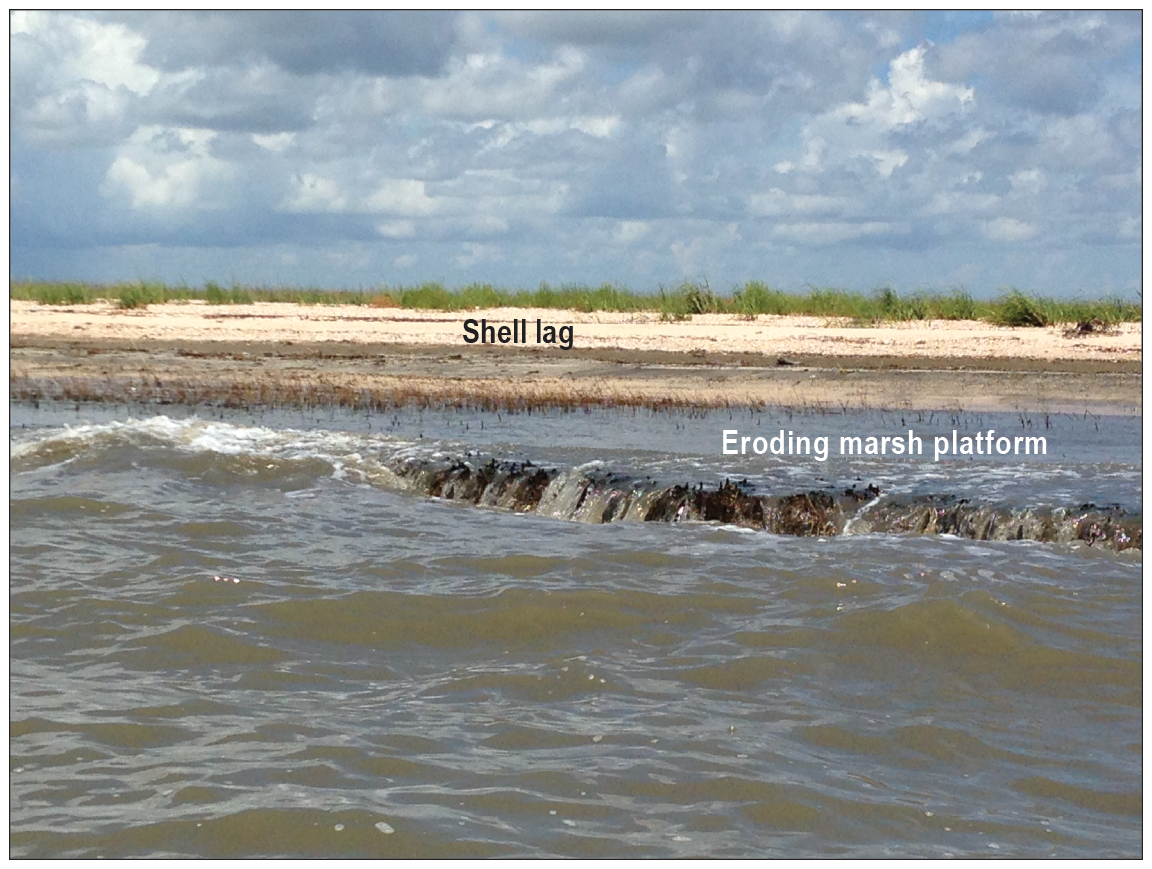
Photograph of the shoreline viewed from the Gulf of Mexico at Rockefeller National Wildlife Refuge. Due to shoreline erosion and retreat, former marsh deposits are exposed directly to the Gulf. An erosive lag of shells rests on top of the deposits and represents the retreating shoreline. Photograph taken by the U.S. Geological Survey (USGS), July 24, 2017.
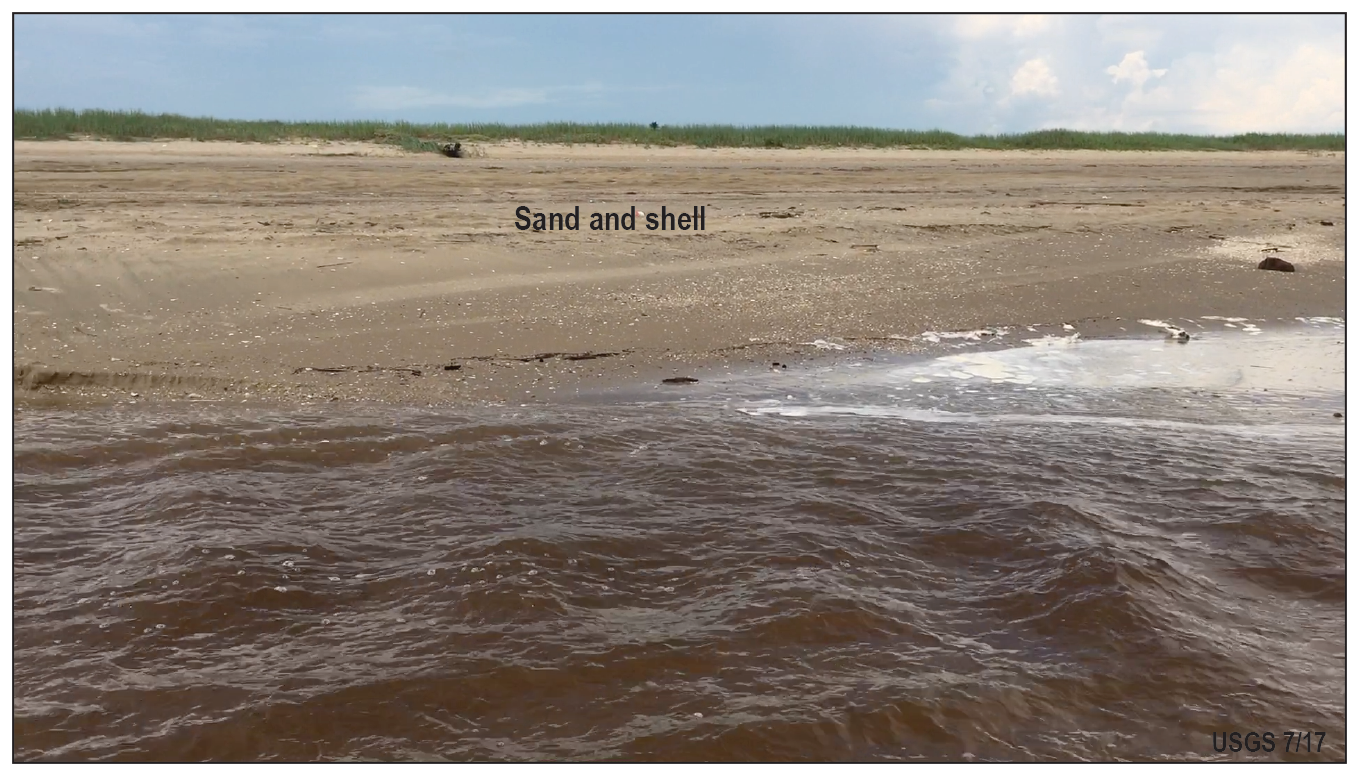
Photograph of the shoreline viewed from the Gulf of Mexico, west of Calcasieu Pass. The western study area has a sandier shoreline than the eastern study area. Photograph taken by the U.S. Geological Survey (USGS) in 2017.
Land subsidence and coastal erosion in the Chenier Plain region contribute to some of the highest shoreline-retreat rates in the Nation: long term (1930–2005) shoreline-change rates of 2.9–4.1 meters per year (m/yr) were measured along the Louisiana coast by Byrnes and others (2018). A study by Martinez and others (2009) measured retreat rates of over 8 m/yr along the RWR. Rapid shoreline loss was observed by the U.S. Geological Survey (USGS) during this study.
As a means for observing shoreline loss, a temporary survey benchmark was installed on a beach ridge facing the Gulf of Mexico at RWR in June 2016 (fig. 4). The ridge consisted of shell lag interspersed with rocks transported by wave action from structures constructed offshore. The benchmark consists of a 7.6-centimeter (cm) diameter aluminum cap attached to 12 meters (m) of aluminum rods driven into the ground. At the time of installation, the aluminum cap was 11 cm above the ground (fig.4A). Over the span of 1 year, the beach ridge completely eroded. By July 2017, the benchmark was found in the water with the aluminum cap approximately 1.0 m above the water surface (fig. 4B). Similar amounts of erosion were observed throughout the eastern study area.
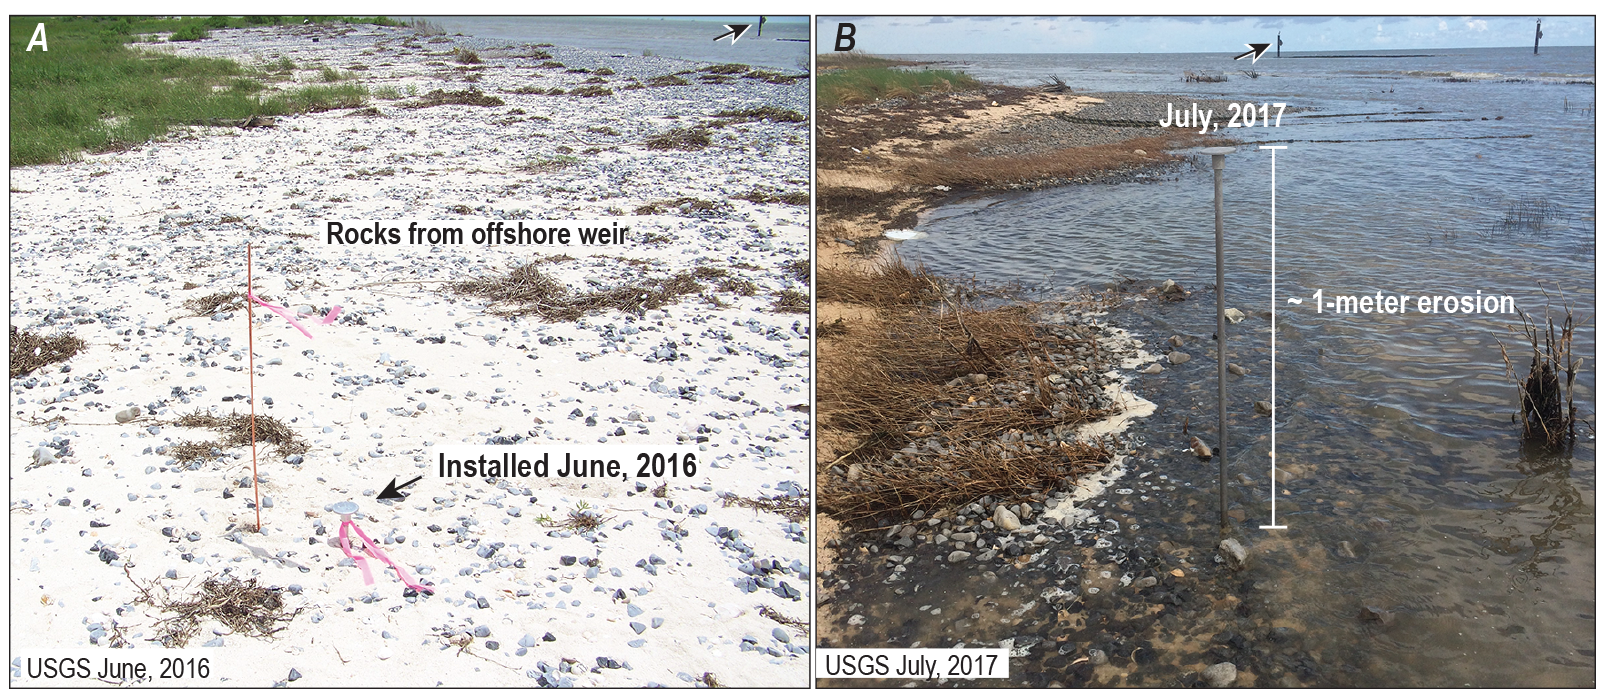
Two photographs (A, B), taken 1 year apart, of a benchmark installed on the shoreline at Rockefeller National Wildlife Refuge. For reference, the arrows in both photographs point to the same feature offshore. At the time of installation (A), the benchmark was situated on a shell and rock lag midway up the beach from the shoreline with approximately 11 centimeters of the benchmark rod exposed. The benchmark (B) was revisited 1 year later. Beach erosion and shoreline retreat was so extensive that the benchmark was in the water, with the benchmark rods protruding approximately 1 meter above the water surface. There were no storms of category strength in this region of coastline over this period. Photographs taken by the U.S. Geological Survey in (A) June 2016 and (B) July 2017.
The Chenier Plain region experiences moderately frequent storms, with a return period of 13 years for hurricanes and 33 years for major hurricanes (Category 3 and over) (National Hurricane Center and Central Pacific Hurricane Center, 2020). In September 2005, Hurricane Rita, which attained Category 5 strength in the Gulf of Mexico, made landfall along the western edge of the study area, causing significant flooding and erosion (fig. 5). The Louisiana Coastal Protection and Restoration Authority (CPRA) Barrier Island Comprehensive Monitoring (BICM) program uses historical and newly collected data to map and monitor shoreline positions, topography, bathymetry, and habitat (Kindinger and others, 2013).
The goal of the BICM program is to provide long-term data on coastal Louisiana for monitoring change and assisting in coastal management. This study (carried out under CPRA contract number 2000339324, BICM2—Chenier TopoBathy DEM) builds upon the previous BICM physical assessment of the Chenier Plain region (outlined in Kindinger and others [2013]) using bathymetric data from three periods (1930, 2007, and 2017) to develop digital elevation models (DEMs) for historical and current periods. In addition to bathymetric datasets, the study includes light detection and ranging (lidar) elevation measurements along the coastline to produce elevation datasets for the 2007 and 2017 periods. This report describes the methods used to acquire, process, and produce these products.
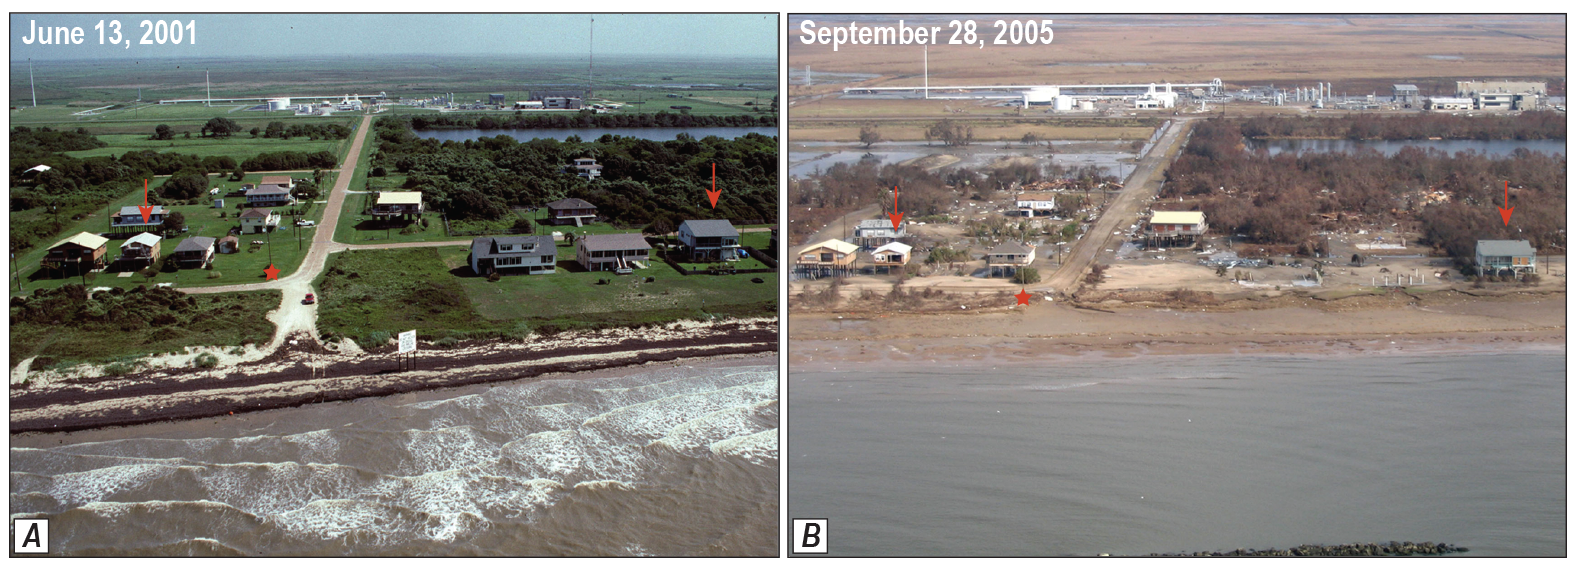
Barrier Island Comprehensive Monitoring program oblique aerial photographs on the western study area coastline of the Chenier Plain region (A) on June 13, 2001, and (B) after Hurricane Rita, which made landfall September 24, 2005. For reference, the red arrows point to the same houses in each photograph, and the red star marks a telephone pole. Significant beach erosion and sediment overwash are evident after Hurricane Rita. Extensive flooding from storm surge also occurred. See Westphal (2008) for imagery methodology.
Data Sources and Preprocessing
1930s Bathymetry Data
The bathymetric data representing the 1930s are from a collection of lead-line measurements and soundings transcribed onto hydrographic sheets (H-sheets) (fig. 6) and subsequently digitized and archived by the National Oceanic and Atmospheric Administration (NOAA) National Centers for Environmental Information (NCEI). The digitized data are available for download as American Standard Code for Information Interchange (ASCII) data files with the H-sheet number, latitude, longitude, and water depth from the NOAA NCEI Bathymetric Data Viewer (https://www.ncei.noaa.gov/maps/bathymetry/).The description of the methods used to acquire the data can be found in the survey reports provided online with the datasets (for example, NCEI [1933c]). Additional information, such as acquisition and digitizing dates, horizontal and vertical datums, and sampling methods, are available in the metadata files provided with each H-sheet.
Ten H-sheets were used in this study to cover the nearshore area from Sabine Pass to Marsh Island (table 1). The 1930s hydrographic data archived online are horizontally referenced to the North American Datum of 1983 (NAD 83), with water depths measured relative to mean low water (MLW) in meters. For this study, geographic coordinates were projected to the Universal Transverse Mercator (UTM) zone 15 north (15N) reference frame (table 2), in meters, and water depths were transformed to North American Vertical Datum of 1988 (NAVD 88) orthometric elevations using the National Geodetic Survey (NGS) geoid model 12B (GEOID12B). These geospatial transformations were performed using NOAA VDatum (ver. 3.9) software (https://vdatum.noaa.gov).
The 1930s surveys used a lead line or a combination of lead line and fathometer (surveys H–05765 [NCEI, 1935a] and H–05766 [NCEI, 1935b] used both). The hydrographers note that where lead-line soundings cross fathometer soundings, the former almost always records deeper depths by 0.3–1.0 meter (m) (NCEI, 1933c). This discrepancy not only produces errors between surveys from the same period but can also manifest when comparing elevation change between two periods.
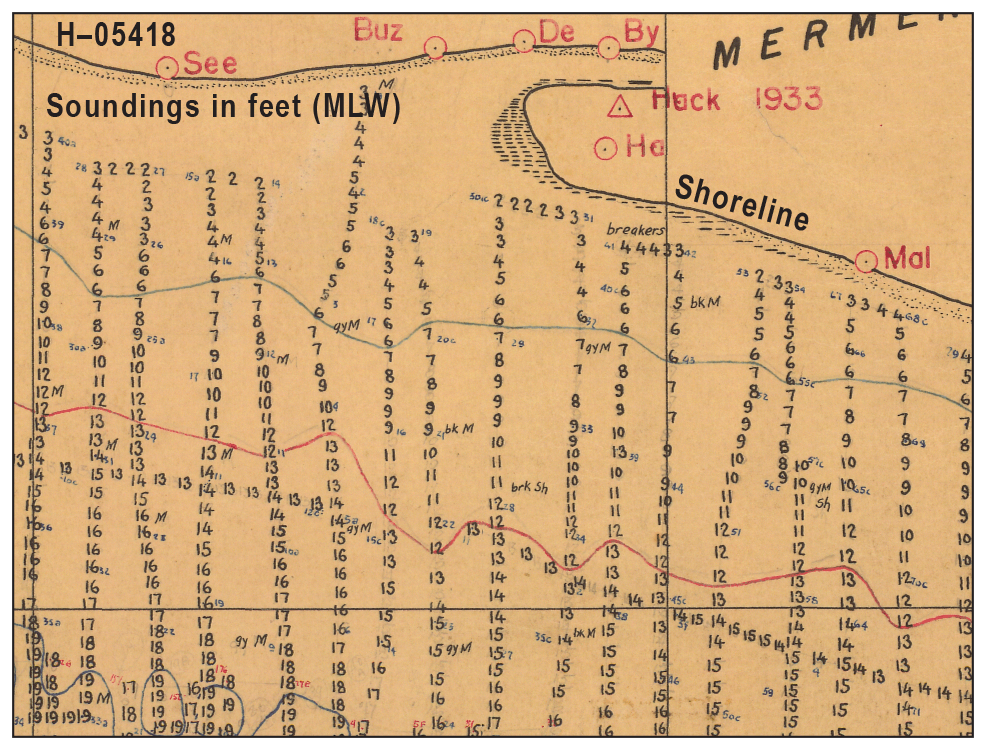
Scanned hydrographic sheet H–05418 (National Centers for Environmental Information [NCEI], 1933c), shown here as an example, created in 1933 by the U.S. Coast and Geodetic Survey that includes the waters offshore of the Mermentau River. Water-depth values are in feet at mean low water (MLW). Georeferenced water-depth values are provided online as digital data files by the National Oceanic and Atmospheric Administration, National Centers for Environmental Information.
Table 1.
Hydrographic sheets, topographic sheets, and other data sources used to generate the 1930 digital elevation model used in this study.[La., Louisiana; m, meter; NAVD 88, North American Vertical Datum of 1988; NAD 83, North American Datum of 1983; NCEI, National Centers for Environmental Information; NOAA, National Oceanic and Atmospheric Administration; RWR, Rockefeller Wildlife Refuge; T-sheet, topographic sheet; USGS, U.S. Geological Survey; UTM15N, Universal Transverse Mercator zone 15 north]
| Source map or survey | Source citation | Survey location and date | Elevation range (m NAVD 88) |
Geographic range (m NAD 83 UTM15N) |
|---|---|---|---|---|
| H–05334 | NCEI (1933a) | Calcasieu Pass, 1933 | −16.21 to −0.10 | 466097/468797 3289501/3301473 |
| H–05361 | NCEI (1933b) | Mermentau River inlet, 1933 | −5.80 to −0.21 | 487996/512263 3290460/3296937 |
| H–05410 | NCEI (1934a) | Central Chenier Plain region, 1934 | −20.10 to −0.23 | 507611/547694 3228065/3284452 |
| H–05418 | NCEI (1933c) | Central Chenier Plain region, 1933 | −20.10 to −0.23 | 480003/517385 3230472/3293483 |
| H–05764 | NCEI (1934b) | Eastern RWR, 1934 | −20.93 to −0.09 | 539618/577469 3217865/3270983 |
| H–05765 | NCEI (1935a) | Western Marsh Island, La., and eastern Chenier Plain region, 1935 | −21.00 to −0.09 | 565007/600188 3206510/3272918 |
| H–05766 | NCEI (1935b) | Central Marsh Island, La., 1935 | −22.6 to −0.19 | 592854/617321 3203980/3266814 |
| H–05837 | NCEI (1935c) | Eastern Marsh Island, La., 1935 | −3.93 to −0.07 | 609645/625653 3252330/3262759 |
| H–08795 | NCEI (1964a) | Offshore, Sabine Pass, 1964 | −14.23 to −0.25 | 377511/430306 3257471/3289561 |
| H–08796 | NCEI (1964b) | Offshore, Calcasieu Pass, 1964 | −13.90 to −0.12 | 428974/481643 3257365/3293894 |
| NOAA T-sheet data | Martinez and others (2009) | Sabine Pass to Southwest Pass, 1933–1934 | +0.25 | 476106/568592 3272496/3286110 |
| Topographic maps1 | 2(1946, 1952a, b) | Marsh Island, La., 1946, 1951 | +0.25 | 593232/614610 3262482/3272946 |
| Topographic maps3 | USGS (1952a, b) | Offshore, Marsh Island, La., 1951 | –0.25 | 595739/612720 3259658/3269966 |
Table 2.
Example input-output conversions of data points from the 1933 hydrographic sheet H–05334 (National Centers for Environmental Information [NCEI], 1933a).[cm, centimeter; GEOID12B, geoid model 12B; MLW, mean low water; NA, not applicable; NAD83, North American Datum of 1983; NAVD88, North American Vertical Datum of 1988; TSS, topography of the sea surface; UTM, Universal Transverse Mercator]
Additional data sources supplemented gaps in the bathymetric point coverage. The 1933–1934 shoreline between Sabine Pass and Marsh Island was digitized from NOAA topographic sheets (T-sheets) by Martinez and others (2009) to produce Esri ArcGIS vector shapefiles. For this study, the shoreline vectors were reduced to points, and each point was assigned an elevation of +0.25 m referenced to the orthometric NAVD 88 elevations, with the assumption that they represent the island shoreface. This elevation is a nominal height above sea level to assist in resolving the shoreline in grid generation and is used in other elevation studies in the Gulf of Mexico (for example, Buster and Morton [2011]). The shorelines digitized by Martinez and others (2009) did not provide coverage of Marsh Island. To supplement area shoreline data for this report, U.S. Coast and Geodetic Survey topographic maps for 1946 and 1951 were digitized, the vector shorelines were reduced to points, and each point was assigned an elevation of +0.25 m (fig. 7).
Areas nearshore of Marsh Island were not surveyed in the 1930s due to the shallow water and presence of oyster reefs; these areas are outlined on the maps and marked as “shell reef points” (fig. 7). Polygon vectors were created from the reef outlines to supplement bathymetric points for these areas during the earlier period. A distribution of points was generated within the polygons using QGIS (ver. 3.6) software (https://www.qgis.org/). These points were assigned depth values of −0.25 m, assuming they are tidally submerged. The points from the H-sheets were combined with the shoreline points and the reef points (table 1) to create the 1930s dataset used in this study (fig. 8).
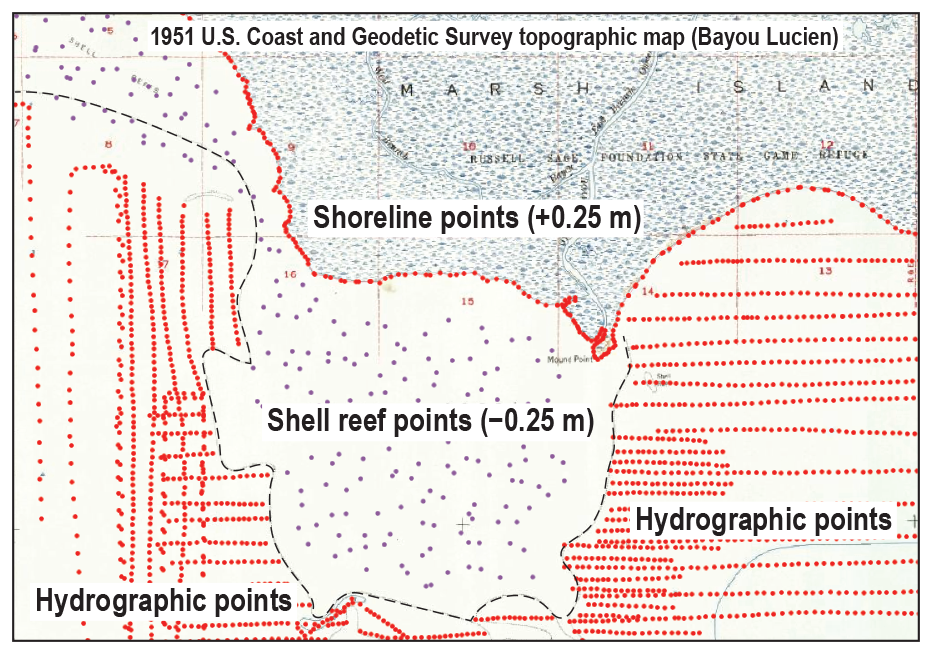
Image of a georectified topographic sheet—Bayou Lucien quadrangle (U.S. Geological Survey, 1952a)—overlain by hydrographic soundings and points digitized along the shoreline. Additional points were generated in areas without hydrographic soundings (shell reef points) and assigned an elevation of −0.25 meters (m). Shoreline points are shown as +0.25 m.
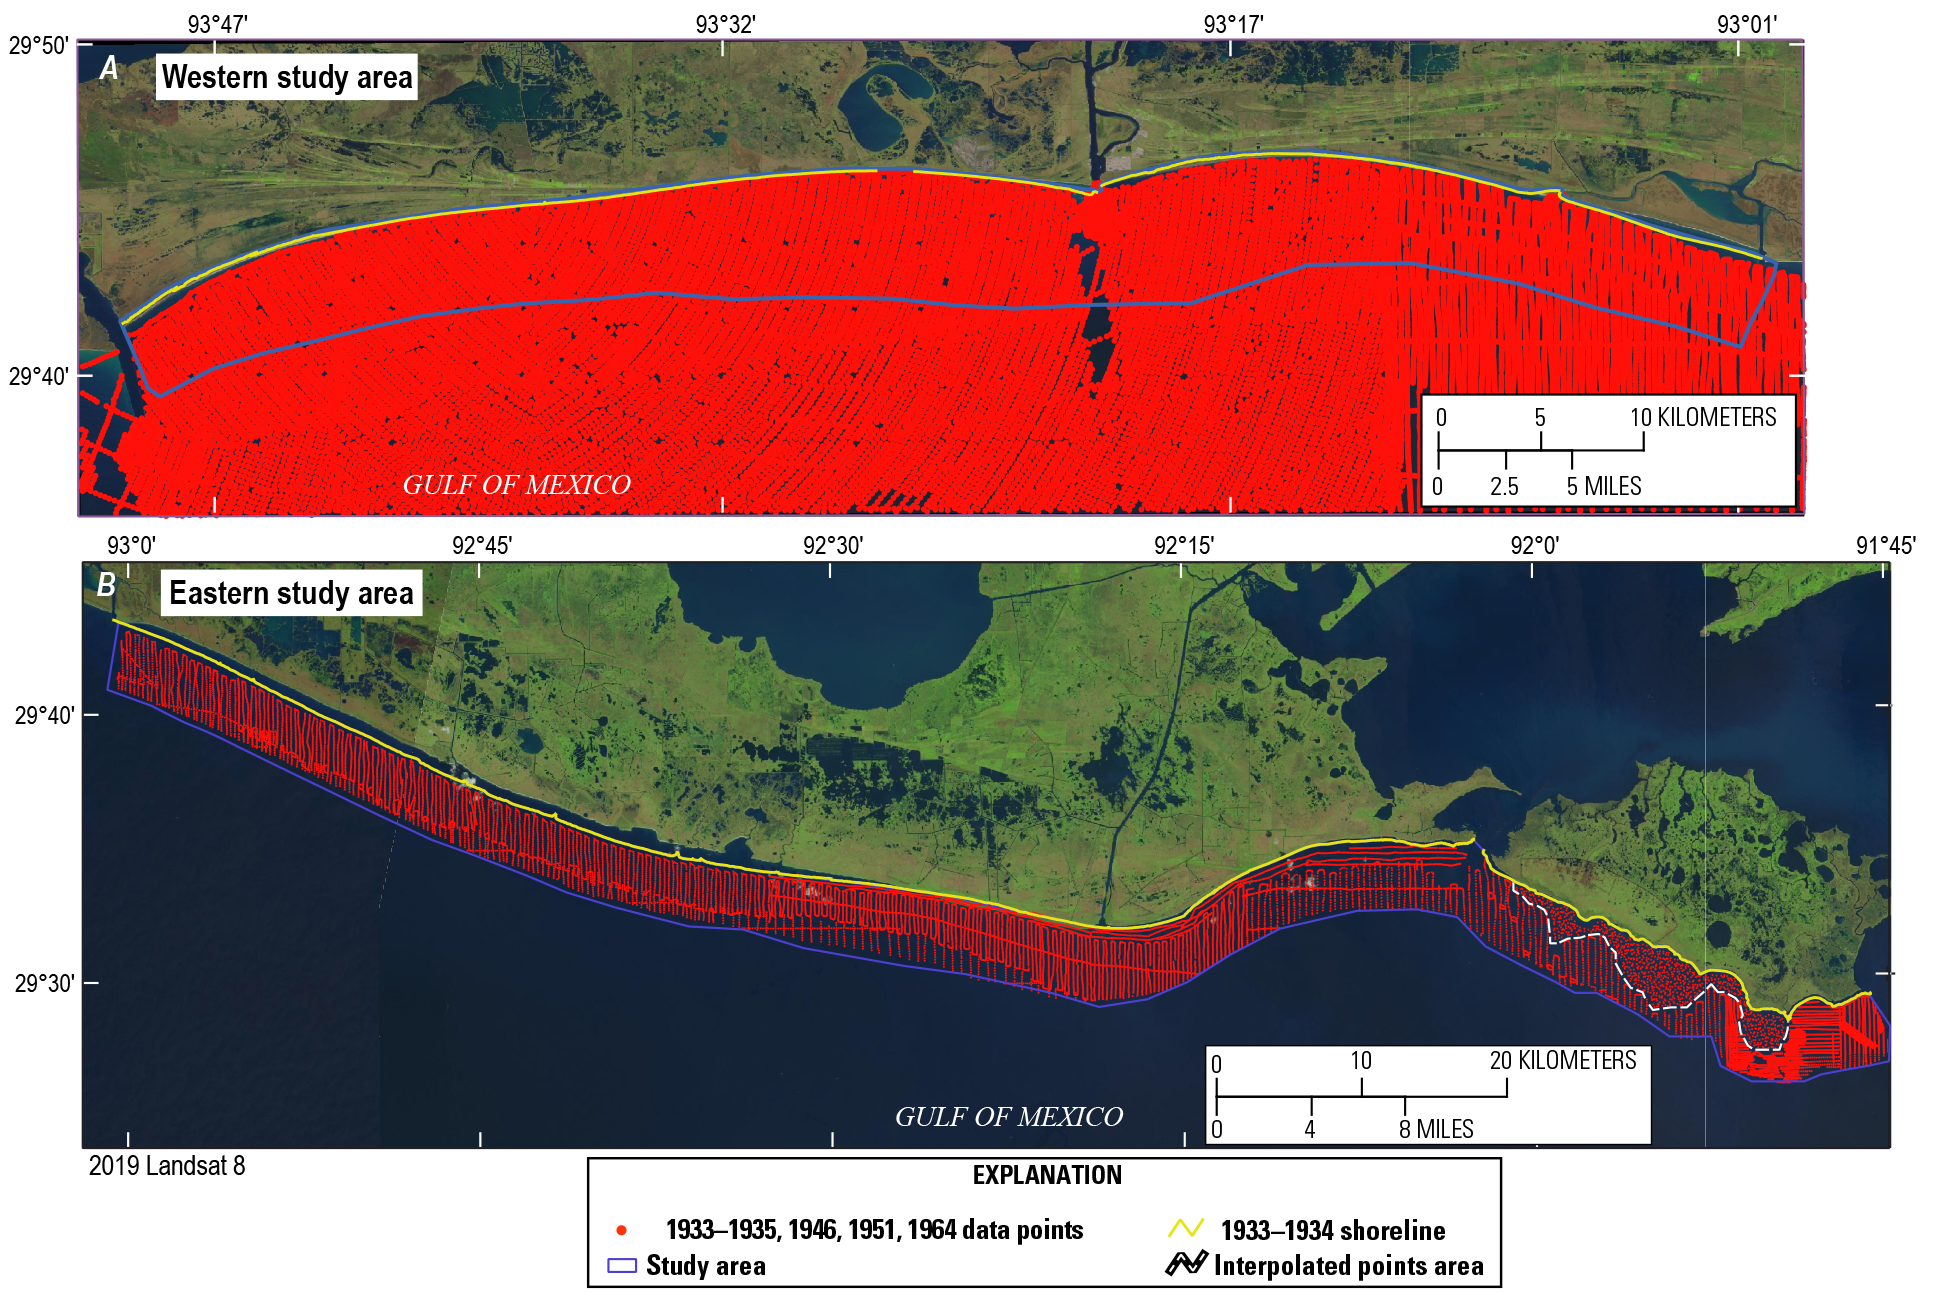
Maps showing the data points and shoreline position used to generate the 1930s digital elevation model for (A) the western study area and (B) the eastern study area. The base map is 2019 Landsat 8 imagery and does not reflect the 1930s shoreline position.
2007 Bathymetry Data
As part of the BICM project, single-beam bathymetric data were collected from the Mermentau River inlet to Sabine Pass (fig. 1) during the summer of 2007. The survey was conducted by the USGS and the University of New Orleans, Pontchartrain Institute for Environmental Studies (Miner and others, 2009). The survey extended 3–7 kilometers (km) offshore (fig. 9). The single-beam survey strategy included shore-perpendicular lines spaced approximately 500 m apart and a shore-normal survey line along the shoreline. The data were referenced to NAD 83 UTM 15N, with elevations provided in meters NAVD 88 using geoid model 03 (GEOID03). The data were transformed to the GEOID12B model using NOAA's VDatum (ver. 3.9) software to provide a consistent datum for future comparison studies. Shoreline data points with an elevation of +0.25 m (NAVD 88) were added to the bathymetric elevations to supplement the dataset. The shoreline was digitized from a combination of 2005 USGS digital orthophoto quarter quadrangles (DOQQs) and 2004 DigitalGlobe QuickBird satellite imagery (Martinez and others, 2009). Data were not collected in the eastern study area in 2007.
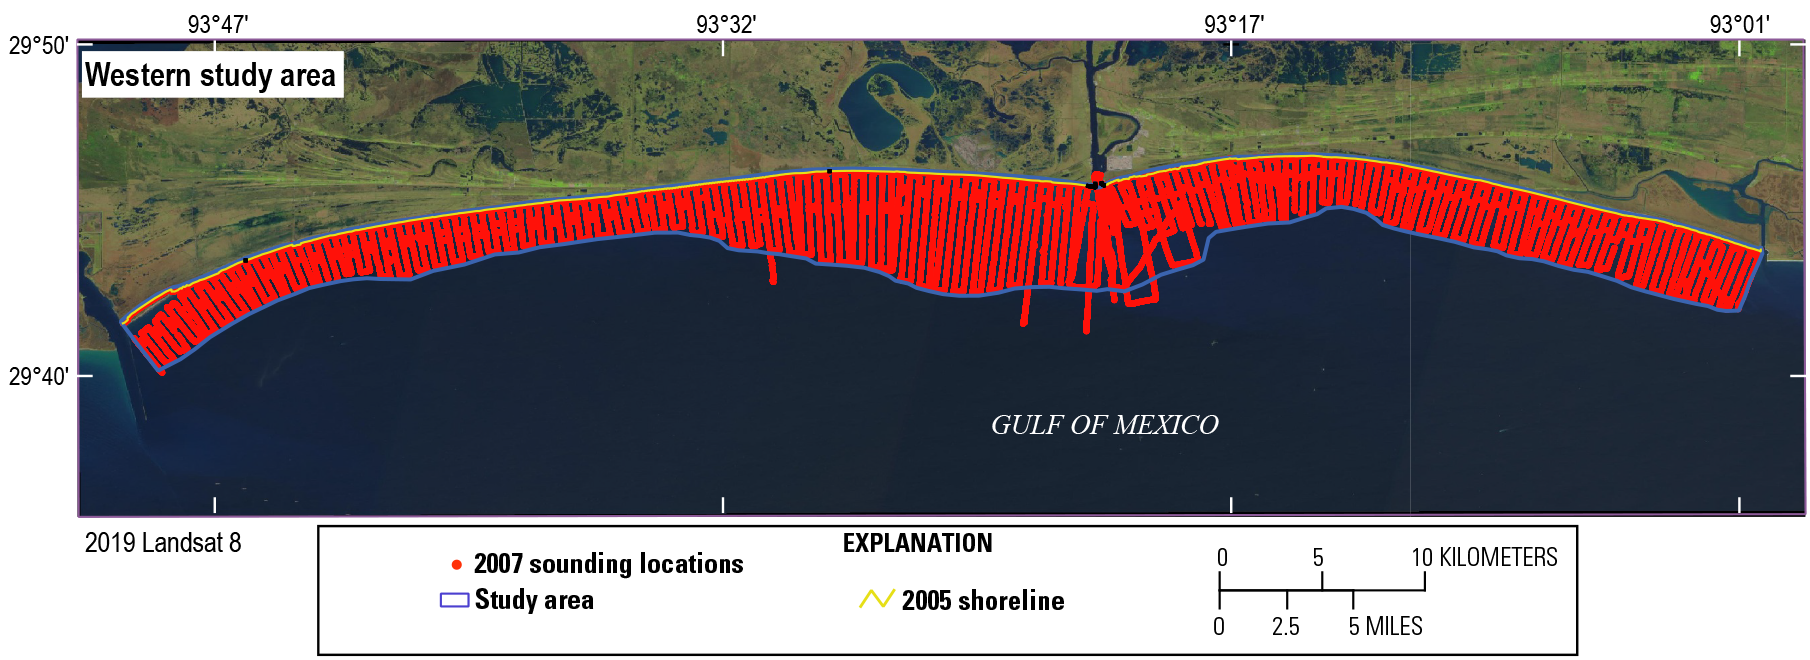
Map showing the 2007 bathymetric data points and the 2005 shoreline position used to generate the digital elevation model for the western study area. No data were collected in the eastern study area in 2007. The base map is 2019 Landsat 8 imagery and does not reflect the 2005 shoreline position.
2009 Topographic Light Detection and Ranging (Lidar) Data
Topographic lidar data for the Louisiana Chenier Plain region west of Marsh Island were collected in 2009 by the U.S. Army Corps of Engineers (USACE) National Coastal Mapping Program (NCMP). Classified (attributed) bare-earth products were downloaded from the NOAA Data Access Viewer in LAS format. Only the processed lidar tiles that included the western study-area shoreline were downloaded (fig. 10). Bare-earth land classification elevations were extracted from the LAS files and clipped to the study area using LAStools (ver.181119) software (https://rapidlasso.com/). The data were projected from the NAD 83 geographic coordinate system used during acquisition to NAD 83 UTM 15N grid coordinates, using NOAA's VDatum (ver. 3.9) software. Elevation data were provided in NAVD 88, GEOID12A and were not transformed to GEOID12B as there is no difference between the two geoid models in the northern Gulf of Mexico (National Geodetic Survey, 2020). A blockmean filter was applied to the data at a 1-m interval to reduce the volume of the point cloud. The blockmean filter from Generic Mapping Tools (GMT) (ver. 5; https://www.soest.hawaii.edu/gmt/) software reads arbitrarily located xyz data and outputs a mean position and value at the designated interval. Additional edits included clipping edge artifacts, such as outliers, using breaklines in the Esri ArcGIS software.
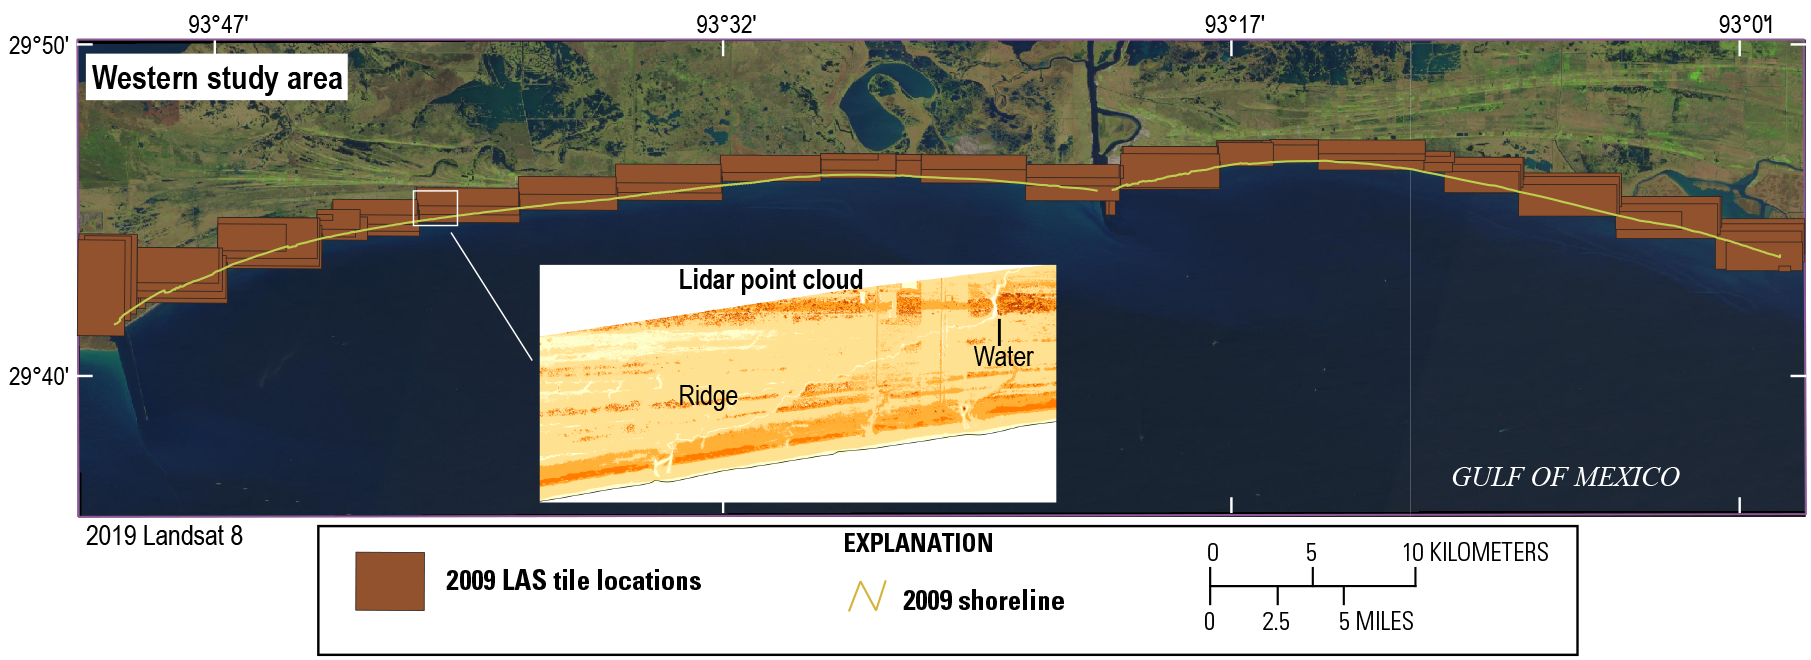
Location of light detection and ranging (lidar) data tiles collected for the National Coastal Mapping Program and downloaded from the National Oceanic and Atmospheric Administration Data Access Viewer (https://coast.noaa.gov/dataviewer/#/) for the western study area. The bare-earth land classification points were used to generate the 2009 topographic digital elevation model. The inset image shows an example of the lidar point cloud. The base map is 2019 Landsat 8 imagery and does not reflect the 2009 shoreline position. LAS, LASer file format.
2017 Bathymetry Data
As part of the BICM project in 2017, the USGS conducted a nearshore, single-beam bathymetric survey from Sabine Pass to Marsh Island (fig. 11). Over 3,300 line-kilometers of single-beam data were acquired during two field missions between June 2 and July 16, 2017. The survey strategy was designed to reoccupy the 2007 western study area tracklines (fig. 9), to the extent possible, with a shore-perpendicular trackline spacing of approximately 500 m and a shore-parallel line collected alongshore. The 2017 survey extended farther offshore than most of the 2007 survey, with shore-perpendicular lines extending out to approximately 5 km, and a second shore-parallel line was collected about 4 km offshore. The survey in the eastern study area followed the same strategy (fig. 11) despite no data being collected in the eastern study area in 2007; some areas along Marsh Island have never been surveyed (see the earlier description in the “1930s Bathymetry Data” section). For a description of data collection and processing, see Stalk and others (2018).
For this study, the processed xyz data were projected from NAD 83 to NAD 83 UTM 15N, GEOID12B, using the NOAA VDatum (ver.3.9) software. Points along the 2017 shoreline for both regions were generated from the shoreline breakline vector file from the 2017 topographic lidar dataset (see the “2017 Topographic Light Detection and Ranging (Lidar) Data” section). The shoreline vector was reduced to points using QGIS (ver. 3.6) software, and each point was assigned an elevation of +0.25 m and merged with the bathymetric datasets to represent the shoreface.
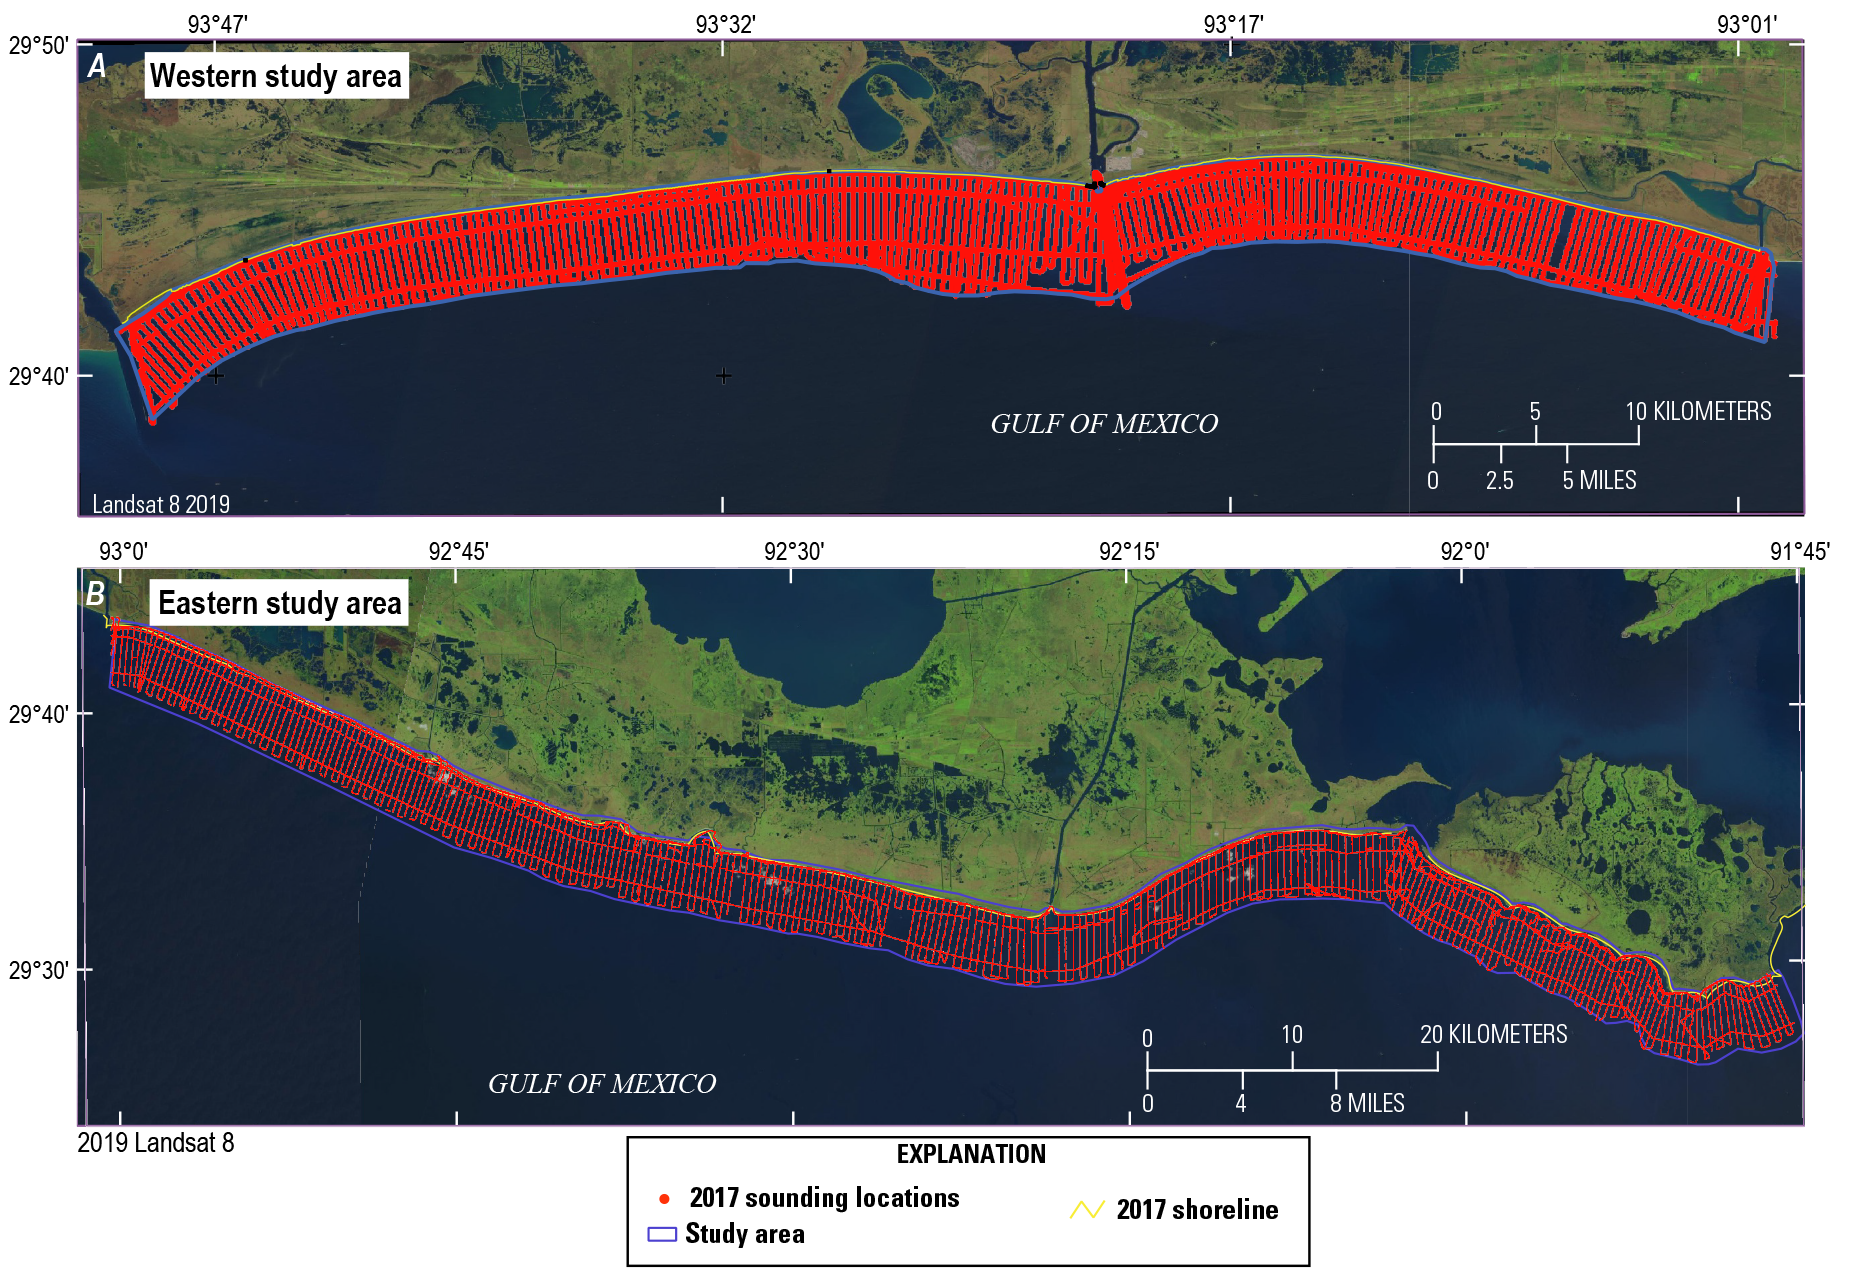
Maps of the (A) western study area and (B) eastern study area showing the 2017 data points and shoreline position used to develop the digital elevation model for each area. The base map is 2019 Landsat 8 imagery and does not reflect the 2017 shoreline position.
2017 Topographic Light Detection and Ranging (Lidar) Data
Bare-earth topographic lidar data acquired across the Louisiana Chenier Plain region were collected by Woolpert, Inc., for the USGS between January and March 2017. For the data and details on data acquisition and processing, see USGS (2017). The published data are also available for download in LAS format from the NOAA Digital Coast Data Access Viewer (https://coast.noaa.gov/dataviewer/#/). The classified LAS data were provided in NAD 83, UTM 15N, NAVD 88, and GEOID12B. For this study, the bare-earth land classifications were extracted and clipped to the study area using LAStools (ver.181119) software (fig. 12). A blockmean filter was applied to the data at a 1-m interval using GMT (ver. 5) software (https://www.generic-mapping-tools.org/) to reduce the volume of the point cloud.
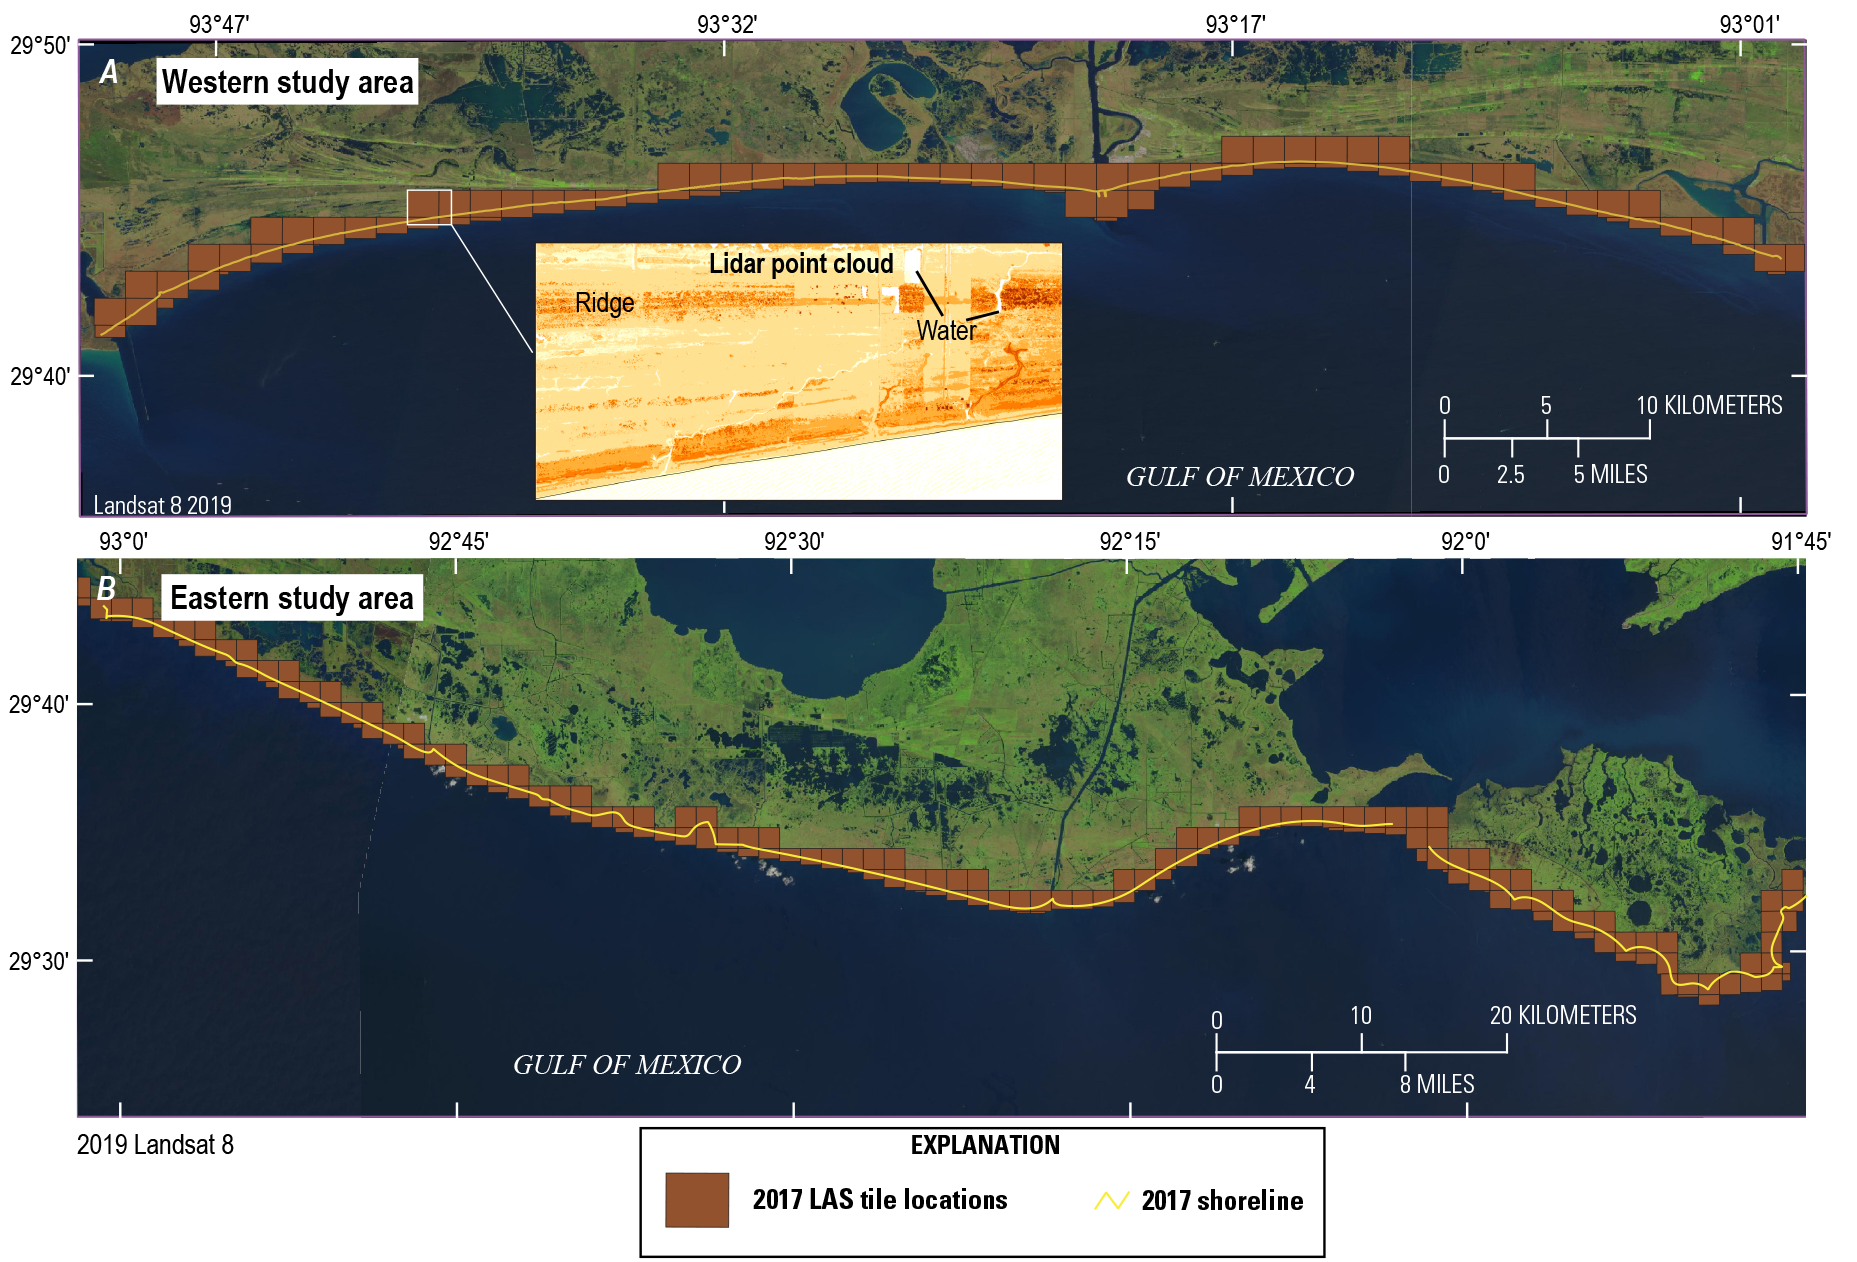
Maps showing the location of light detection and ranging (lidar) data tiles collected for the U.S. Geological Survey in 2017 and downloaded from the National Oceanic and Atmospheric Administration Data Access Viewer (https://coast.noaa.gov/dataviewer/#/) for the Chenier Plain region (A) western study area and (B) eastern study area. The bare-earth land classification points were used to generate the 2017 topographic digital elevation model for the western and eastern study areas. The inset image shows an example of the lidar point cloud. The base map is 2019 Landsat 8 imagery and does not reflect the 2017 shoreline position. LAS, LASer file format.
Deriving the Digital Elevation Models, Raster Map, and Contour Map
A DEM was derived separately for each dataset (figs. 13–20). The procedure used to generate the DEM and associated products is essentially the same across datasets and involves a series of processing steps in the Esri ArcGIS software:
-
Convert the ASCII–xyz point file from each dataset into an Esri shapefile.
-
Generate a triangulated irregular network (TIN) with elevation (z) as the height field using the “Create TIN” tool.
-
Clip the TIN to the study area spatial-extent polygon using the “hard clip” feature in the “Edit TIN” tool. The lidar TIN files in this report were further edited using breaklines as hard-clip features to clear spurious features at the edges.
-
Generate a raster dataset using the “TIN to Raster” tool. The Natural Neighbor interpolation method was used in this report, with a cell size of 2.0 m for the lidar datasets and 50.0 m for the bathymetric datasets. The raster dataset was then exported to a raster image in the Tagged Image File Format (TIFF).
-
Generate a contour vector shapefile from the raster dataset using the “Contour” tool in ArcGIS with a contour interval of 1 m. The fields in the vector attribute table are populated according to the CPRA Coastal Information Management System (CIMS) attribute labeling convention (Coastal Protection and Restoration Authority, Coastal Information Management System, 2016).
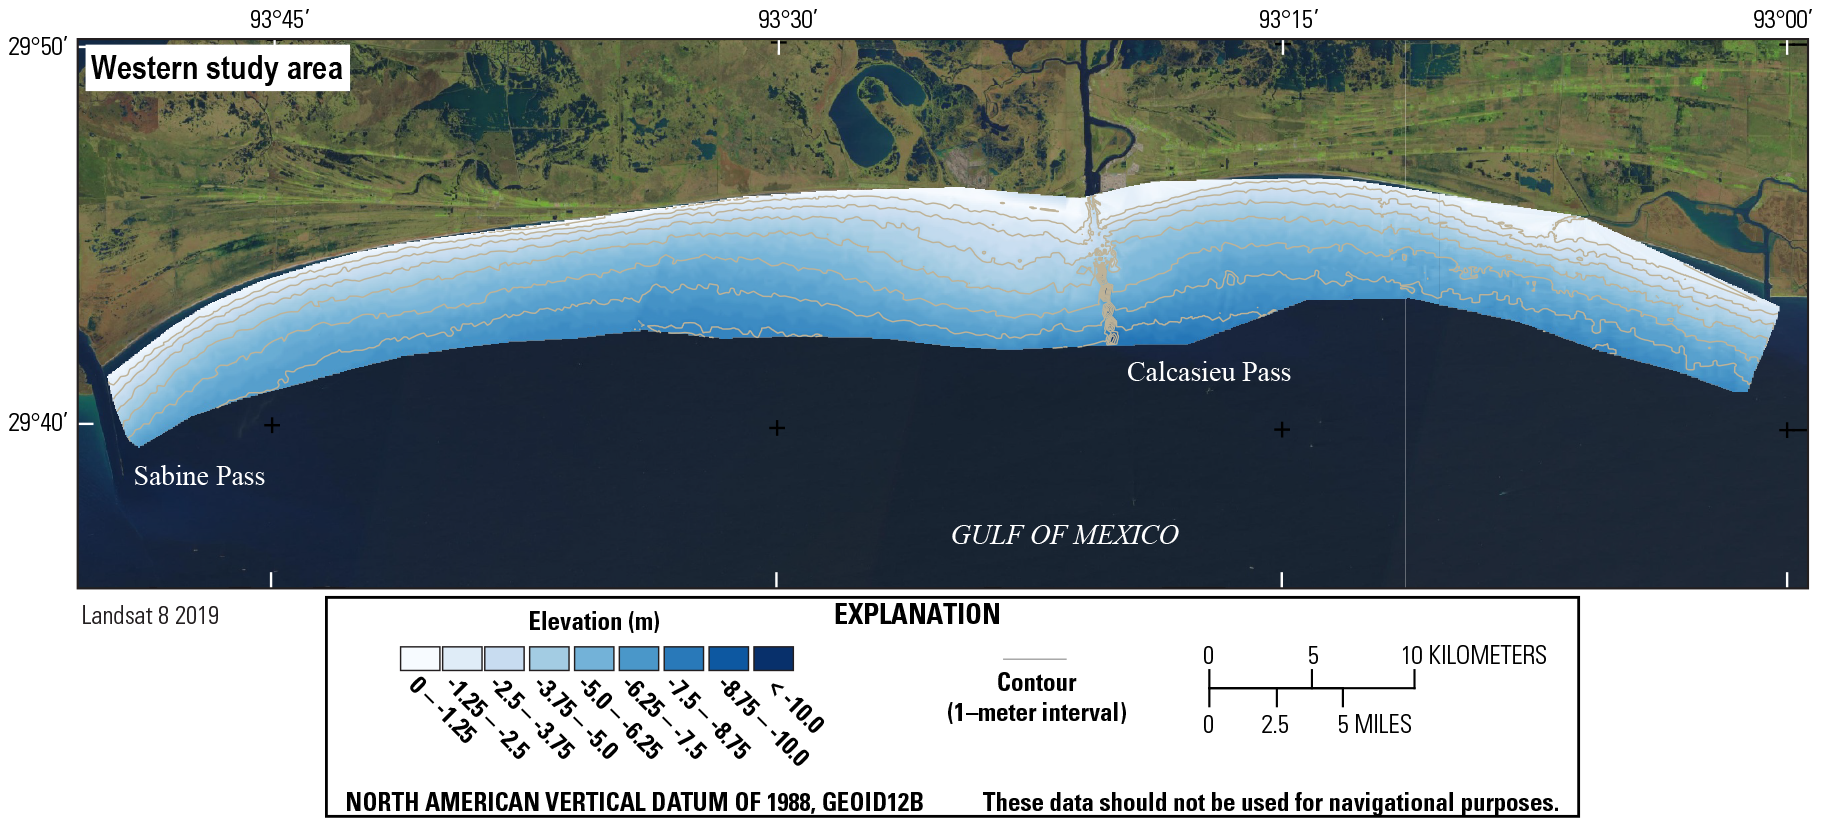
Digital elevation model for the western study area generated from the 1930s bathymetric and shoreline data. The base map is 2019 Landsat 8 imagery and does not reflect the 1930s shoreline position. GEOID12B, geoid model 12B; m, meter.
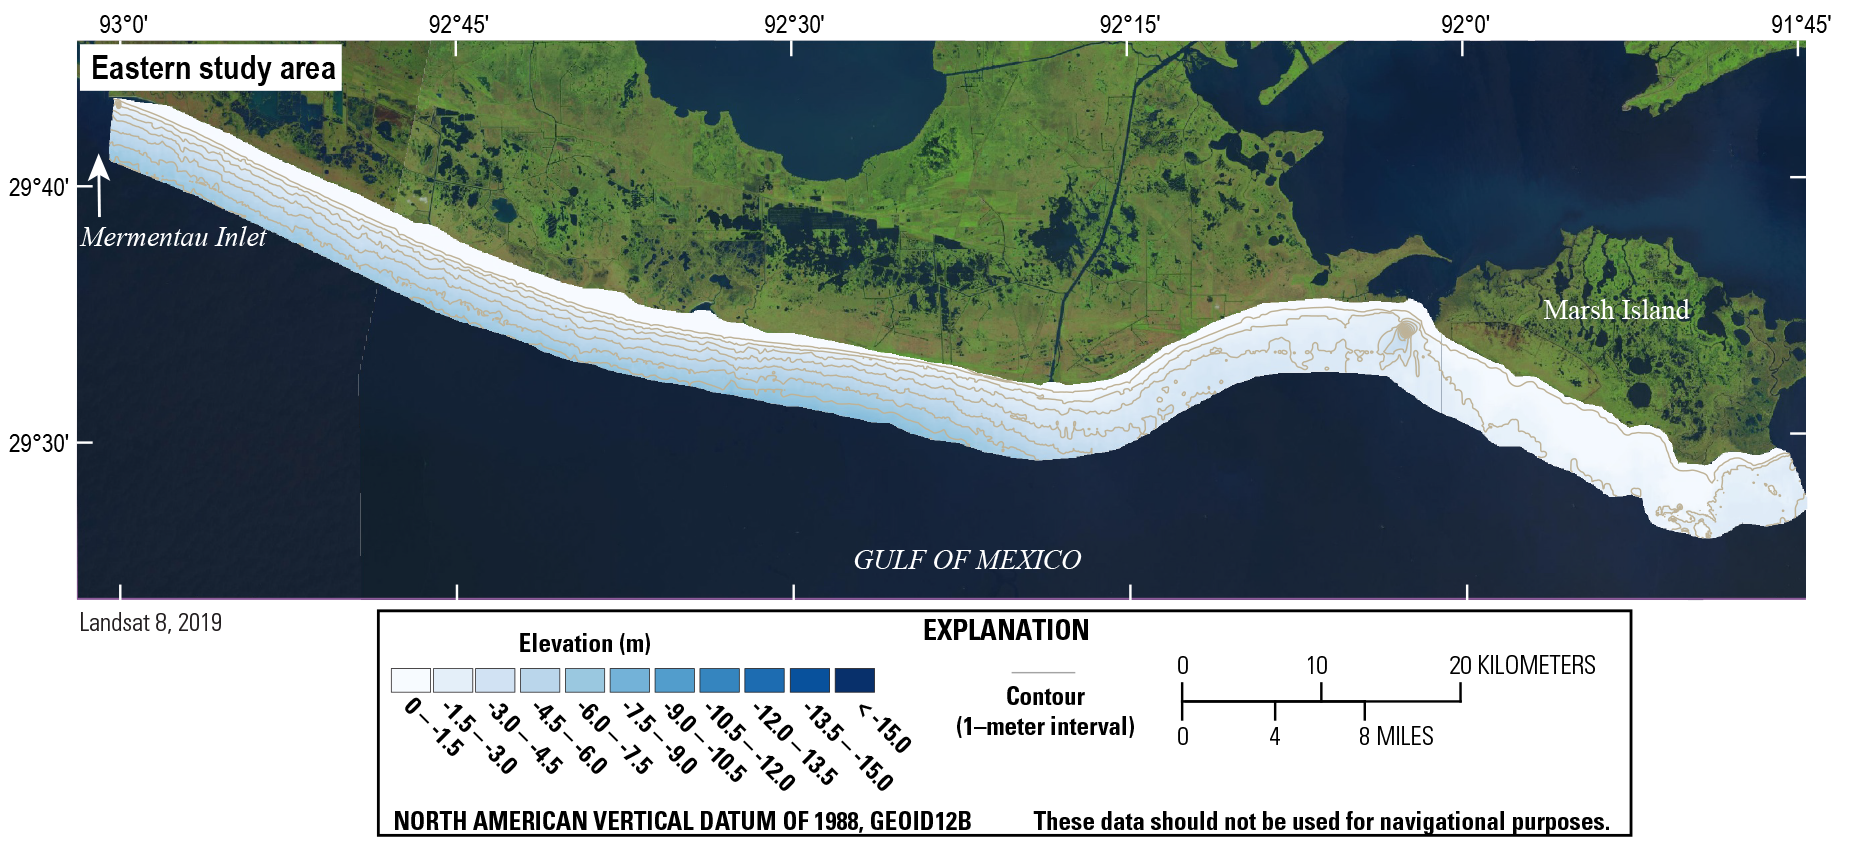
Digital elevation model for the eastern study area generated from the 1930s bathymetric and shoreline data. The base map is 2019 Landsat 8 imagery and does not reflect the 1930s shoreline position. GEOID12B, geoid model 12B; m, meter.
Digital elevation model for the western study area generated from the 2007 bathymetric and shoreline data. The base map is 2019 Landsat 8 imagery and does not reflect the 2007 shoreline position. GEOID12B, geoid model 12B; m, meter.
Digital elevation model (DEM) for the western study area generated from the 2009 topographic light detection and ranging (lidar) data. Inset image shows an expanded view of the DEM.
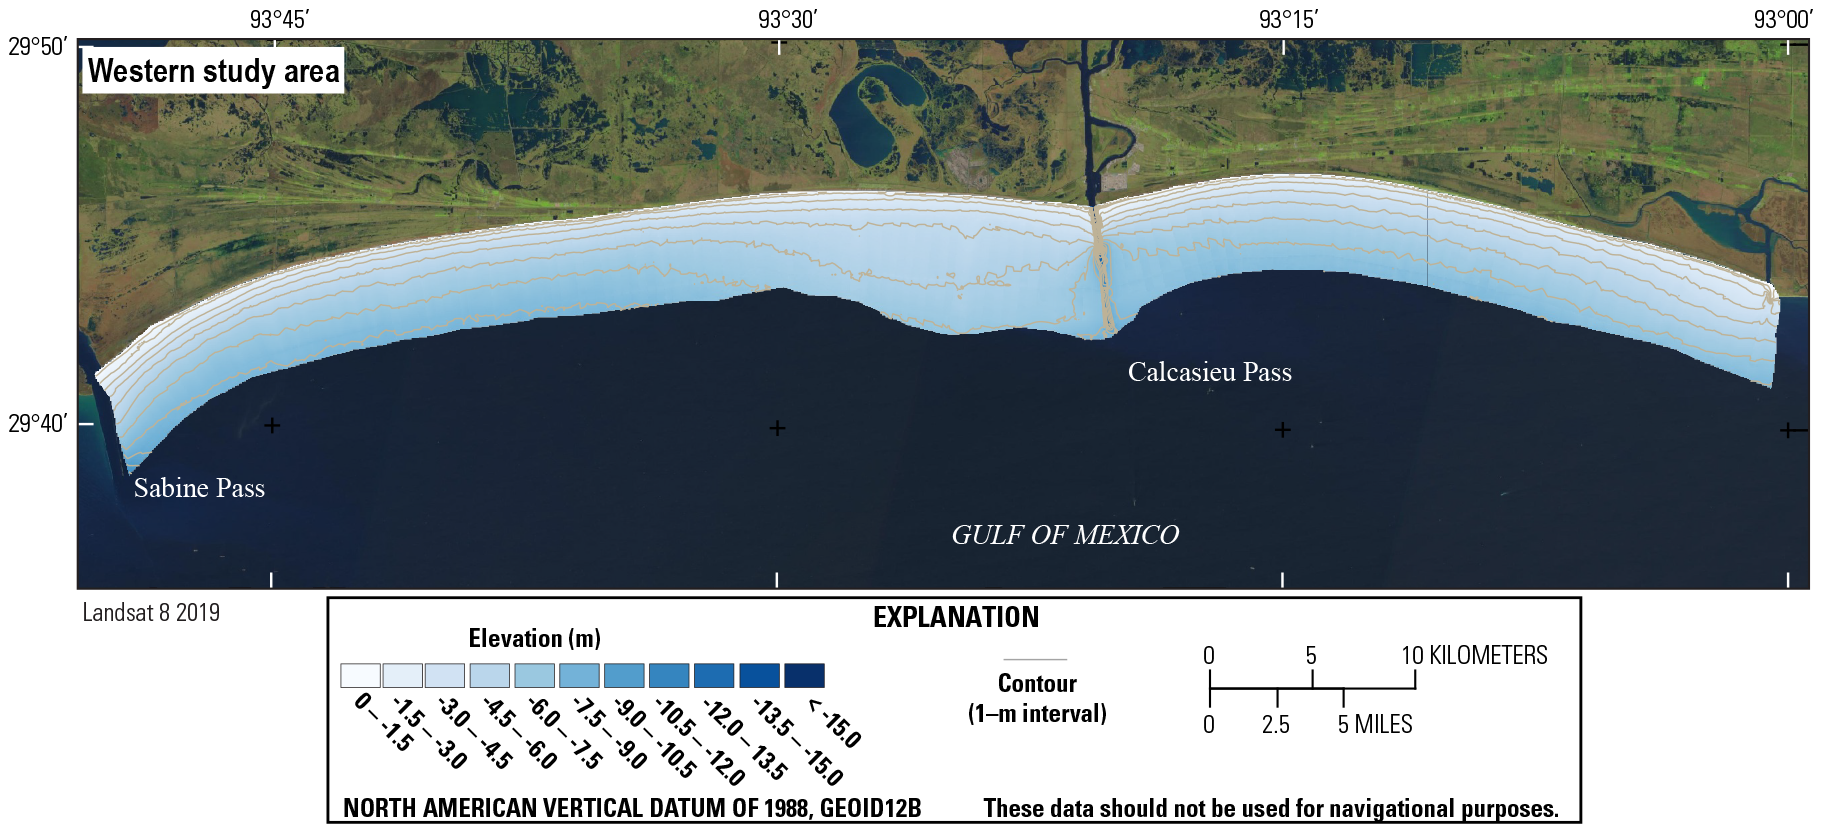
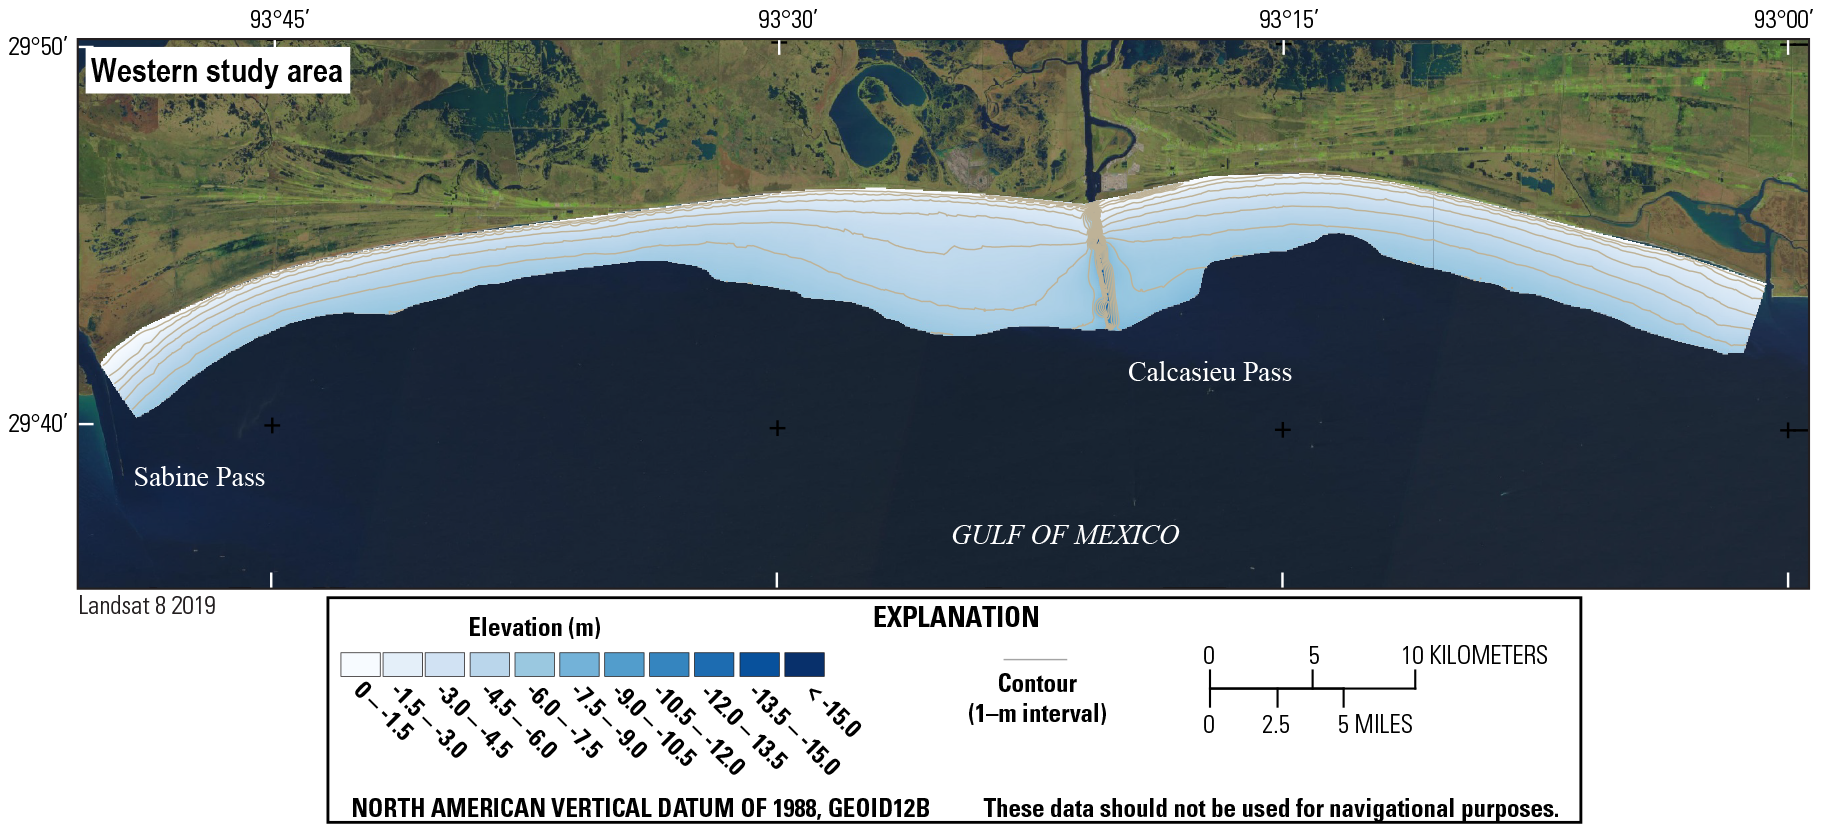
Digital elevation model for the western study area generated from the 2017 bathymetric and shoreline data. The base map is 2019 Landsat 8 imagery and does not reflect the 2017 shoreline position. GEOID12B, geoid model 12B; m, meter.
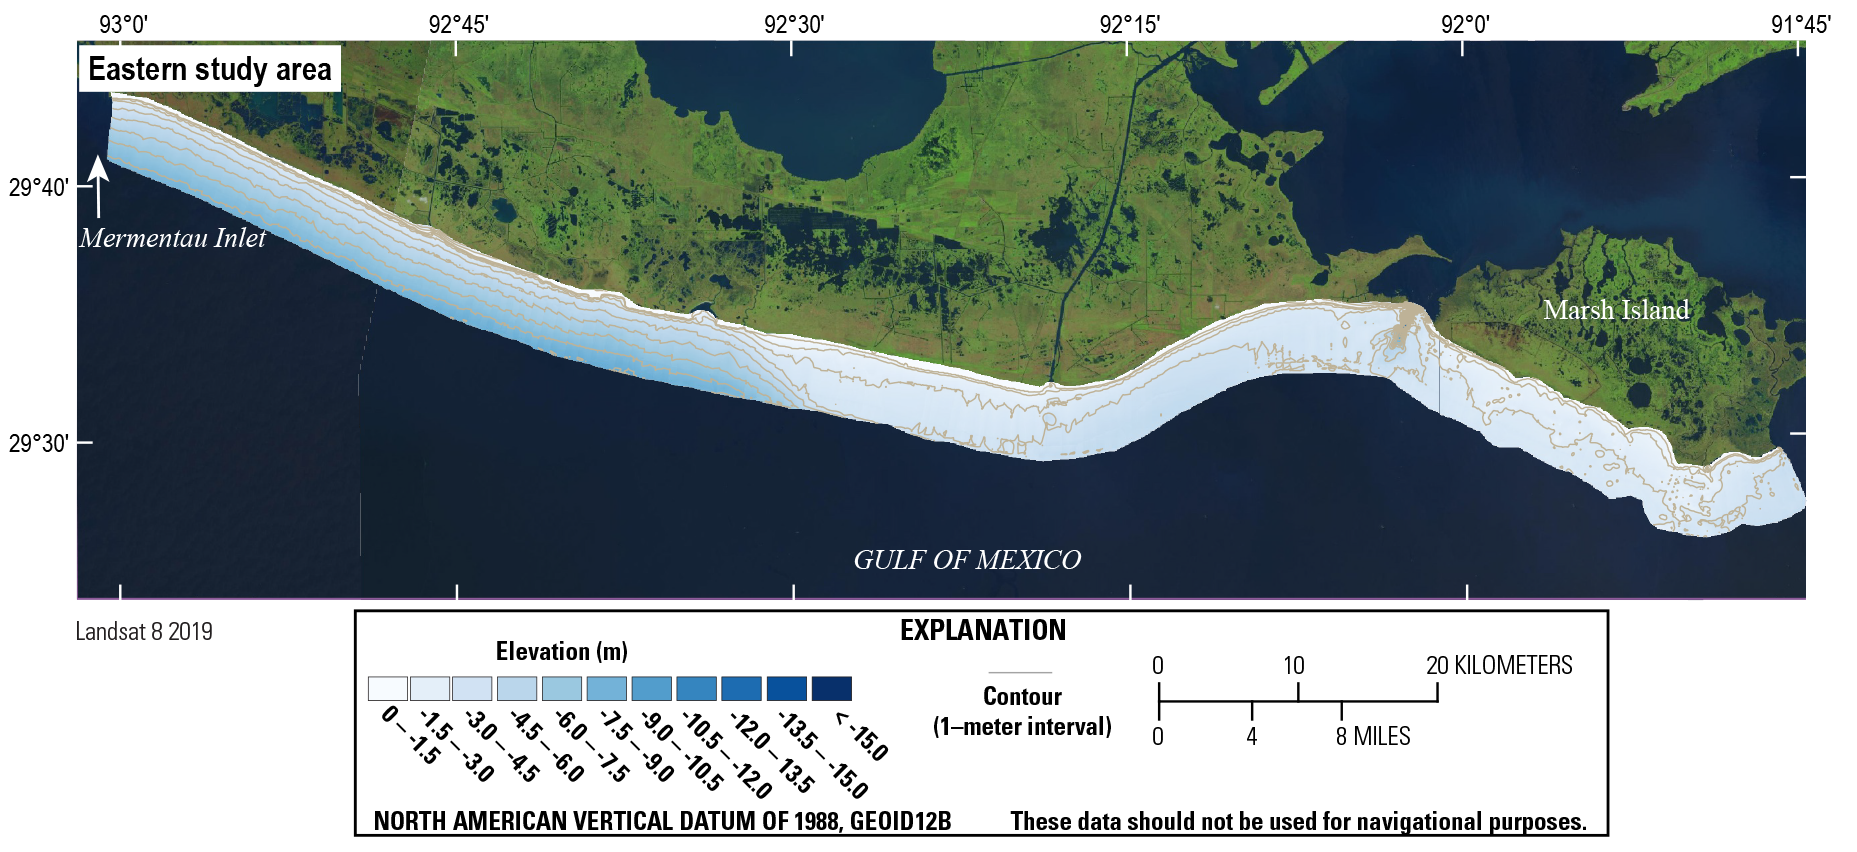
Digital elevation model for the eastern study area generated from the 2017 bathymetric and shoreline data. The base map is 2019 Landsat 8 imagery and does not reflect the 2017 shoreline position. GEOID12B, geoid model 12B; m, meter.
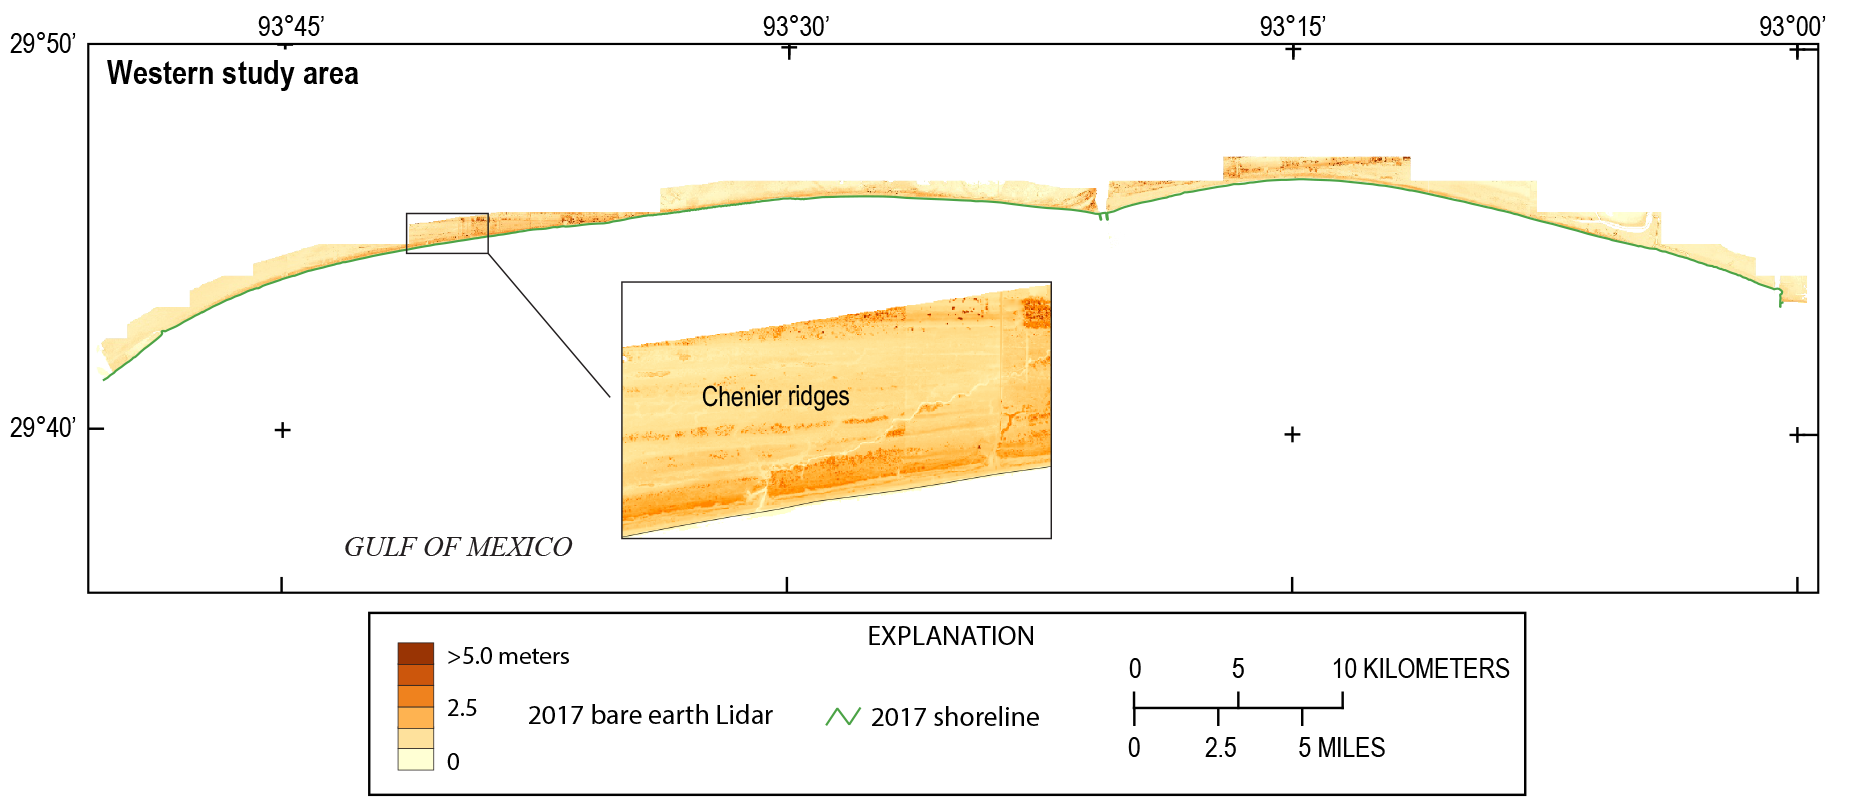
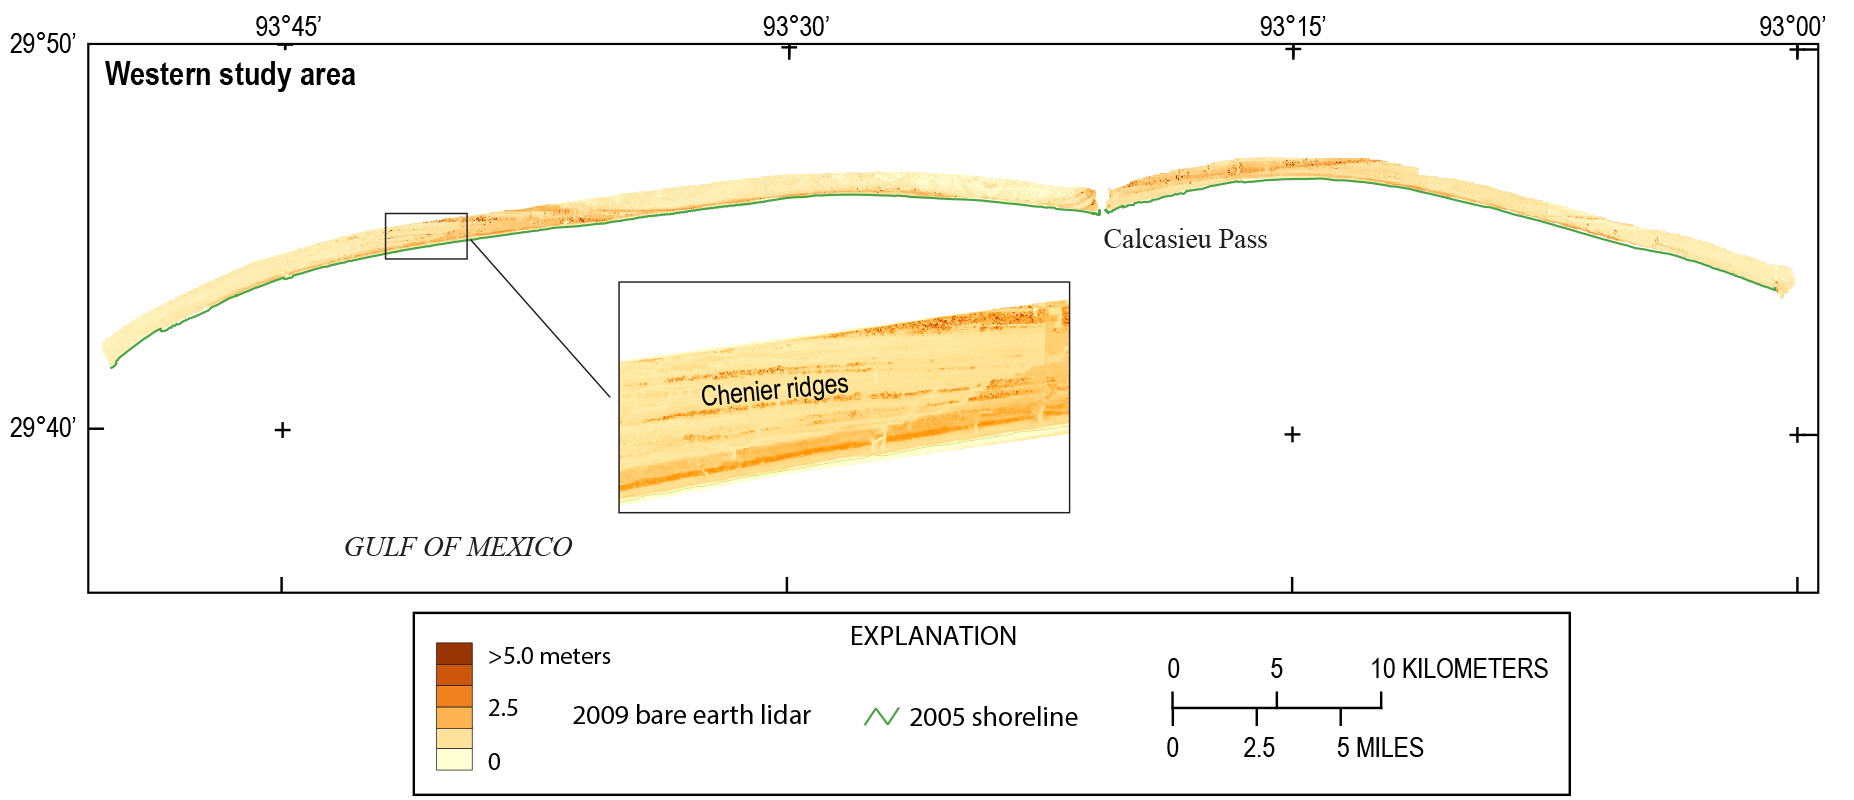
Digital elevation model (DEM) for the western study area generated from the 2017 topographic light detection and ranging (lidar) data. Inset image shows an expanded view of the DEM.
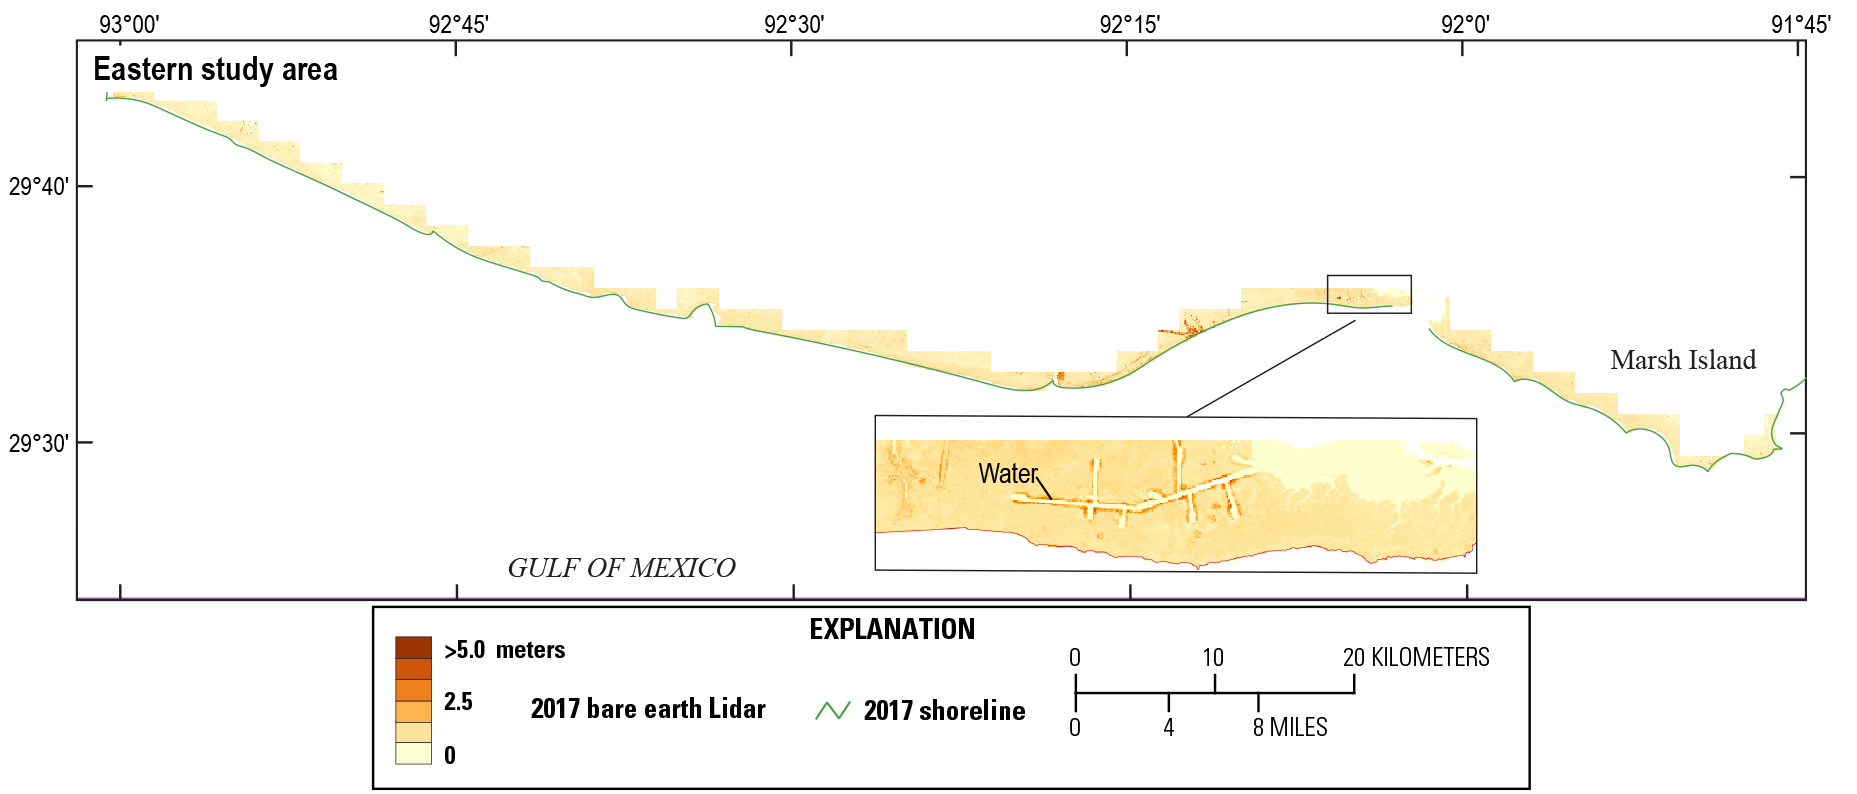
Digital elevation model (DEM) for the eastern study area generated from the 2017 topographic light detection and ranging (lidar) data. Inset image shows an expanded view of the DEM.
Error Analysis
The DEM for each period was compared with the data points used to generate the DEM for determining the error associated with the gridding process. From this comparison, the root mean square (RMS) error was calculated for each DEM and reported in table 3. The RMS error is a measure of the differences between the data points and the values predicted by the model and is expressed as
where the average difference between the actual and predicted values are determined.The GMT tools “grdtrack,” “gmtinfo,” and “grdinfo” were used to extract the datapoint positions from the DEM grid cells and generate the statistics for each dataset and DEM. The RMS error ranged from 0.02 to 0.15 m. The greatest amount of error likely occurs where gradients are high, such as along the inlets and structures on land.
Table 3.
Cell statistics and root mean square error values calculated for each dataset. Elevation values are referenced to North American Vertical Datum of 1988 (NAVD 88).[DEM, digital elevation model; m, meter; RMS, root mean square]
Conclusion
This study shows how bathymetric data acquisition and processing evolved over the past century and the methodologies necessary to compare these data effectively over time, while also demonstrating the usefulness of the comparisons in perpetuity. These products form the base datasets for the evaluation of shoreline and seafloor change and provide information on long-term change for use in coastal management, storm-impact analysis, and habitant assessment.
References Cited
Buster, N.A., and Morton, R.A., 2011, Historical bathymetry and bathymetric change in the Mississippi-Alabama coastal region, 1847–2009: U.S. Geological Survey Scientific Investigations Map 3154, 13-p. pamphlet, accessed January 11, 2020, at https://doi.org/10.3133/sim3154. [Includes associated data files.]
Byrnes, M.R., Berlinghoff, J.L., Griffee, S.F., and Lee, D.M., 2018, Louisiana Barrier Island Comprehensive Monitoring program (BICM)—Phase 2—Updated shoreline compilation and change assessment, 1880s to 2015, [Final report]: Louisiana Coastal Protection and Restoration Authority report, prepared by Applied Coastal Research and Engineering, Mashpee, Mass., and Metairie, La., 140 p. [Also available at https://www.lacoast.gov/reports/project/20180812_BICM_Phase2_Final_Report_plus_Appendices.pdf.]
Coastal Protection and Restoration Authority, Coastal Information Management System, 2016, Coastal Protection and Restoration Authority (CPRA) Coastal Information Management System (CIMS)—File naming convention (ver. 1.8): Coastal Protection and Restoration Authority of Louisiana report, 9 p., accessed January 11, 2020, at http://mrhdms.coastal.louisiana.gov/site/docs/CPRACIMSFileNamingConvention_v1_8.pdf.
Gould, H.R., and McFarlan, E., Jr., 1959, Geologic history of the Chenier Plain, southwestern Louisiana: Gulf Coast Association of Geological Societies Transactions, v. 9, p. 261–270, accessed January 29, 2018, at https://archives.datapages.com/data/gcags/data/009/009001/0261.htm.
Kindinger, J.L., Buster, N.A., Flocks, J.G., Bernier, J.C., and Kulp, M.A., 2013, Louisiana Barrier Island Comprehensive Monitoring (BICM) program summary report—Data and analyses 2006 through 2010: U.S. Geological Survey Open-File Report 2013–1083, 86 p., accessed January 11, 2020, at https://doi.org/10.3133/ofr20131083.
Miner, M., Kulp, M., Weathers, D., Mottie, J., McCarty, P., Brown, M., Torres, J., Martinez, L., Flocks, J., DeWitt, N., Reynolds, B., Twichell, D., Baldwin, W., Danforth, B., Worley, C., and Bergeron, E., 2009, Louisiana Barrier Island Comprehensive Monitoring program (BICM) volume 3—Bathymetry and historical seafloor change 1869–2007, part 3—Southern Chandeleur Islands and western Chenier Beaches, bathymetry maps, [Final report]: Louisiana Coastal Protection and Restoration Authority report, prepared by University of New Orleans, Pontchartrain Institute for Environmental Sciences, New Orleans, La., and U.S. Geological Survey, Reston, Va., 13 p., accessed January 11, 2020, at https://www.lacoast.gov/reports/project/BICM3_part3_SouthernChandeleurIs_WestChenBeachesBathy.pdf.
Martinez, L., O’Brien, S., Bethel, M., Penland, S., and Kulp, S., 2009, Louisiana Barrier Island Comprehensive Monitoring program (BICM) volume 2—Shoreline changes and barrier island land loss 1800’s–2005: Louisiana Coastal Protection and Restoration Authority, prepared by University of New Orleans, Pontchartrain Institute for Environmental Sciences, New Orleans, La., 32 p., accessed January 12, 2022, at https://scholarworks.uno.edu/cgi/viewcontent.cgi?article=1000&context=pies_rpts.
National Centers for Environmental Information [NCEI], 1933a, Report for H05334: National Oceanic and Atmospheric Administration website, accessed January 12, 2022, at https://www.ngdc.noaa.gov/nos/H04001-H06000/H05334.html.
National Centers for Environmental Information [NCEI], 1933b, Report for H05361: National Oceanic and Atmospheric Administration website, accessed January 12, 2022, at https://www.ngdc.noaa.gov/nos/H04001-H06000/H05361.html.
National Centers for Environmental Information [NCEI], 1933c, Report for H05418: National Oceanic and Atmospheric Administration website, accessed January 12, 2022, at https://www.ngdc.noaa.gov/nos/H04001-H06000/H05418.html.
National Centers for Environmental Information [NCEI], 1934a, Report for H05410: National Oceanic and Atmospheric Administration website, accessed January 12, 2022, at https://www.ngdc.noaa.gov/nos/H04001-H06000/H05410.html.
National Centers for Environmental Information [NCEI], 1934b, Report for H05764: National Oceanic and Atmospheric Administration website, accessed January 12, 2022, at https://www.ngdc.noaa.gov/nos/H04001-H06000/H05764.html.
National Centers for Environmental Information [NCEI], 1935a, Report for H05765: National Oceanic and Atmospheric Administration website, accessed January 12, 2022, at https://www.ngdc.noaa.gov/nos/H04001-H06000/H05765.html.
National Centers for Environmental Information [NCEI], 1935b, Report for H05766: National Oceanic and Atmospheric Administration website, accessed January 12, 2022, at https://www.ngdc.noaa.gov/nos/H04001-H06000/H05766.html.
National Centers for Environmental Information [NCEI], 1935c, Report for H05837: National Oceanic and Atmospheric Administration website, accessed January 12, 2022, at https://www.ngdc.noaa.gov/nos/H04001-H06000/H05837.html.
National Centers for Environmental Information [NCEI], 1964a, Report for H08795: National Oceanic and Atmospheric Administration website, accessed January 12, 2022, at https://www.ngdc.noaa.gov/nos/H08001-H10000/H08795.html.
National Centers for Environmental Information [NCEI], 1964b, Report for H08796: National Oceanic and Atmospheric Administration website, accessed January 12, 2022, at https://www.ngdc.noaa.gov/nos/H08001-H10000/H08796.html.
National Geodetic Survey, 2020, Technical Details for GEOID12/12A/12B: National Oceanic and Atmospheric Administration website, accessed January 12, 2020, at https://www.ngs.noaa.gov/GEOID/GEOID12B/GEOID12B_TD.shtml.
National Hurricane Center and Central Pacific Hurricane Center, 2020, Tropical cyclone climatology: National Oceanic and Atmospheric Administration website, accessed January 12, 2020, at https://www.nhc.noaa.gov/climo/#bac.
Stalk, C.A., Flocks, J.G., Bernier, J.C., DeWitt, N.T., Fredericks, J.J., Kelso, K.W., Farmer, A.S., Tuten, T.M., and Wilcox, H.S., 2018, Coastal single-beam bathymetry data collected in 2017 from the Chenier Plain, Louisiana: U.S. Geological Survey data release, accessed January 12, 2020, at https://doi.org/10.5066/F7CV4GZH.
U.S. Geological Survey, [USGS], 1952a, Bayou Lucien quadrangle, Louisiana, (N2930–W9152.5/7.5): U.S. Coast and Geodetic Survey 7.5-minute series topographic map T–9114, 1 sheet, scale 1:24,000, accessed January 12, 2022, at https://ngmdb.usgs.gov/ht-bin/tv_browse.pl?id=596c7f30f77cbc018cf5ddad99621fdc.
U.S. Geological Survey, [USGS], 1952b, Mound Point quadrangle, Louisiana-Iberia Parish (N2922.5–W9145/7.5): U.S. Coast and Geodetic Survey 7.5-minute series topographic map T–9117, 1 sheet, scale 1:24,000, accessed January 12, 2022, at https://ngmdb.usgs.gov/ht-bin/tv_browse.pl?id=bc8f198f746ee4b62a5f782078796e94.
U.S. Geological Survey, [USGS], 2017, 2017 USGS lidar—Chenier Plain, LA: U.S. Geological Survey dataset, prepared by Woolpert, Inc., [Dayton, Ohio], and Aerial Services, Inc., [Cedar Falls, Iowa], under USGS contract no. G16PC00022, accessed January 12, 2020, at https://www.fisheries.noaa.gov/inport/item/53710.
U.S. Geological Survey and State of Louisiana Board of State Engineers, 1946, Louisiana, Redfish Point quadrangle (SE quarter): U.S. Geological Survey topographic map, 1 sheet, scale 1:31,680, accessed January 12, 2022, at https://ngmdb.usgs.gov/ht-bin/tv_browse.pl?id=21a1c2616e043f89a80760598d32bd71.
Westphal, K.A., 2008, Louisiana Barrier Island Comprehensive Monitoring program (BICM)—Volume 1—Barrier shoreline post-storm assessment, part 3—2005–2007 photo pairs: Louisiana Department of Natural Resources, Coastal Restoration Division, prepared by the University of New Orleans, Pontchartrain Institute for Environmental Sciences, New Orleans, La., 27 p., accessed on January 12, 2020, at https://www.lacoast.gov/reports/project/3890913~1.pdf.
Datum
Vertical coordinate information is referenced to the North American Vertical Datum of 1988 (NAVD 88).
Horizontal coordinate information is referenced to the North American Datum of 1983 (NAD 83).
Altitude, as used in this report, refers to distance above the vertical datum.
Abbreviations
15N
zone 15 north
ASCII
American Standard Code for Information Interchange
BICM
Barrier Island Comprehensive Monitoring
CIMS
Coastal Information Management System
cm
centimeter
CPRA
Coastal Protection and Restoration Authority
DEM
digital elevation model
DOQQ
digital orthophoto quarter quadrangle
GEOID03
geoid model 03
GEOID12B
geoid model 12B
GMT
Generic Mapping Tools
GPS
Global Positioning System
H-sheet
hydrographic sheet
LAS
LASer file format
Lidar
light detection and ranging
MLW
mean low water
m
meter
m/yr
meters per year
NAD 83
North American Datum of 1983
NAVD 88
North American Vertical Datum of 1988
NGS
National Geodetic Survey
NOAA
National Oceanic and Atmospheric Administration
QA/QC
quality assurance/quality control
RMS
root mean square
RWR
Rockefeller Wildlife Refuge
TIFF
Tagged Image File Format
TIN
triangulated irregular network
USGS
U.S. Geological Survey
UTM
Universal Transverse Mercator
Suggested Citation
Flocks, J.G., Forde, A.S., and Bernier, J.C., 2022, Chenier Plain region bathymetric and topographic datasets: Methodology report: U.S. Geological Survey Open-File Report 2022–1014, 21 p., https://doi.org/10.3133/ofr20221014.
ISSN: 2331-1258 (online)
Study Area
| Publication type | Report |
|---|---|
| Publication Subtype | USGS Numbered Series |
| Title | Chenier Plain region bathymetric and topographic datasets: Methodology report |
| Series title | Open-File Report |
| Series number | 2022-1014 |
| DOI | 10.3133/ofr20221014 |
| Year Published | 2022 |
| Language | English |
| Publisher | U.S. Geological Survey |
| Publisher location | Reston, VA |
| Contributing office(s) | St. Petersburg Coastal and Marine Science Center |
| Description | vii, 21 p. |
| Country | United States |
| State | Louisiana |
| Other Geospatial | Chenier Plain |
| Online Only (Y/N) | Y |
| Additional Online Files (Y/N) | N |
| Google Analytic Metrics | Metrics page |