

Underwater Videographic Observations of Domesticated Delta Smelt in Field Enclosures
Links
- Document: Report (8.5 MB pdf) , HTML , XML
- Data Release: Underwater videographic observations of cultured Delta Smelt in field enclosures—Video clips and summary data
- Download citation as: RIS | Dublin Core
Acknowledgments
Funding for this study was provided by the California Department of Water Resources (agreement number 4600011123). We thank the numerous staff members at the California Department of Water Resources including, Nicole Kwan, Catarina Pien, Brittany Davis, Melinda Baerwald, Brian Schreier, Daphne Gille, Rosemary Hartman, and Ted Sommer. We also thank Amanda Agosta, Mackenzie Miner, Dennis Cocherell, and Nann Fangue, from the University of California, Davis, for guidance and allowing use of their facility, enclosures, and fish. U.S. Geological Survey staff members Jesse Kathan, Emerson Gusto, Veronica Larwood, and Justin Clause assisted with field work.
Abstract
The delta smelt (Hypomesus transpacificus) is a small, euryhaline fish species endemic to the Sacramento–San Joaquin Delta; it is protected under the U.S. and California Endangered Species Acts, and because of declines in population abundance, the delta smelt may be vulnerable to extinction. The California Department of Water Resources (DWR) is conducting studies to test the viability of using domesticated fish to supplement the wild population of delta smelt. These studies have focused on examining the health and survival of domesticated delta smelt placed inside enclosures (circular cages that are approximately 1.5 meters tall by 1 meter in diameter) into the wild. We completed two parts within this study using underwater cameras inside the enclosures to observe fish behavior and their responses to certain stimuli. In both parts of the study, delta smelt behaviors were broadly categorized into two basic categories: (1) normal and (2) alarm. Normal behavior was characterized as calm, non-polarized, and docile swimming behavior. Alarm behavior was characterized by sudden and rapid darting, polarized frantic swimming activity, and tighter schooling polarization of individuals.
The first part of the study took place in a semi-controlled agricultural pond on the campus of the University of California, Davis. At this agricultural pond, we developed methods of observation and documented how fish behaved in response to enclosure disturbances associated with routine cleaning and service that is required during extended field deployments of the enclosures. We observed that delta smelt behavior changed from normal to alarm at the onset of an enclosure service and from alarm to normal within about 2 minutes after the service ended.
The second part of the study was completed in cooperation with the DWR. In October 2019, DWR deployed three enclosures in the Sacramento River near Rio Vista, California. To monitor survival rate of delta smelt, DWR permitted us to deploy cameras in one enclosure to document the frequency and duration of alarm behaviors exhibited by delta smelt and the frequency, duration, and intensity of three types of disturbances: (1) noise generated from passing boats, (2) noise generated from the enclosure moving in response to wave energy, and (3) vertical movements of the enclosure generated from wave energy. Alarm behaviors averaged about 2 minutes in duration and occurred most frequently during the evening compared to midday or morning. Each disturbance variable exhibited substantial variability in duration and intensity and occurred least frequently during the morning and evening compared to midday. Alarm behaviors appeared to be most associated with high intensity enclosure noises and vertical movements; however, limited replicate samples prohibited developing a statistical relation. Alarm behaviors did not directly contribute to injury or mortality of individual delta smelt; however, indirect or sublethal effects of alarm behaviors were not examined.
Introduction
The delta smelt (Hypomesus transpacificus) is a small, euryhaline fish species endemic to the Sacramento–San Joaquin Delta. Since the 1980s, the delta smelt population has declined substantially (Moyle and others, 1992; Bennett, 2005; Sommer and others, 2007); the delta smelt is listed as threatened by the U.S. Fish and Wildlife Service and as endangered by the California Department of Fish and Wildlife (2021). This imperiled status has established the fish as a species of special management concern. The substantial decline in the delta smelt population has caused concern that the species might be vulnerable to extinction (Hobbs and others, 2017). In 2016, the State of California’s Delta Smelt Resiliency Strategy outlined management actions to enhance the conservation of Delta Smelt (California Natural Resources Agency, 2016), including the continued support of a refuge population of delta smelt that is located at the University of California, Davis (UC Davis), Fish Conservation and Culture Laboratory (FCCL) in Byron, California (fig. 1). The refuge population at FCCL primarily serves as a tool to prevent delta smelt extinction but also provides the scientific community with a source of fish to study and help better understand the species (Lindberg and others, 2013).
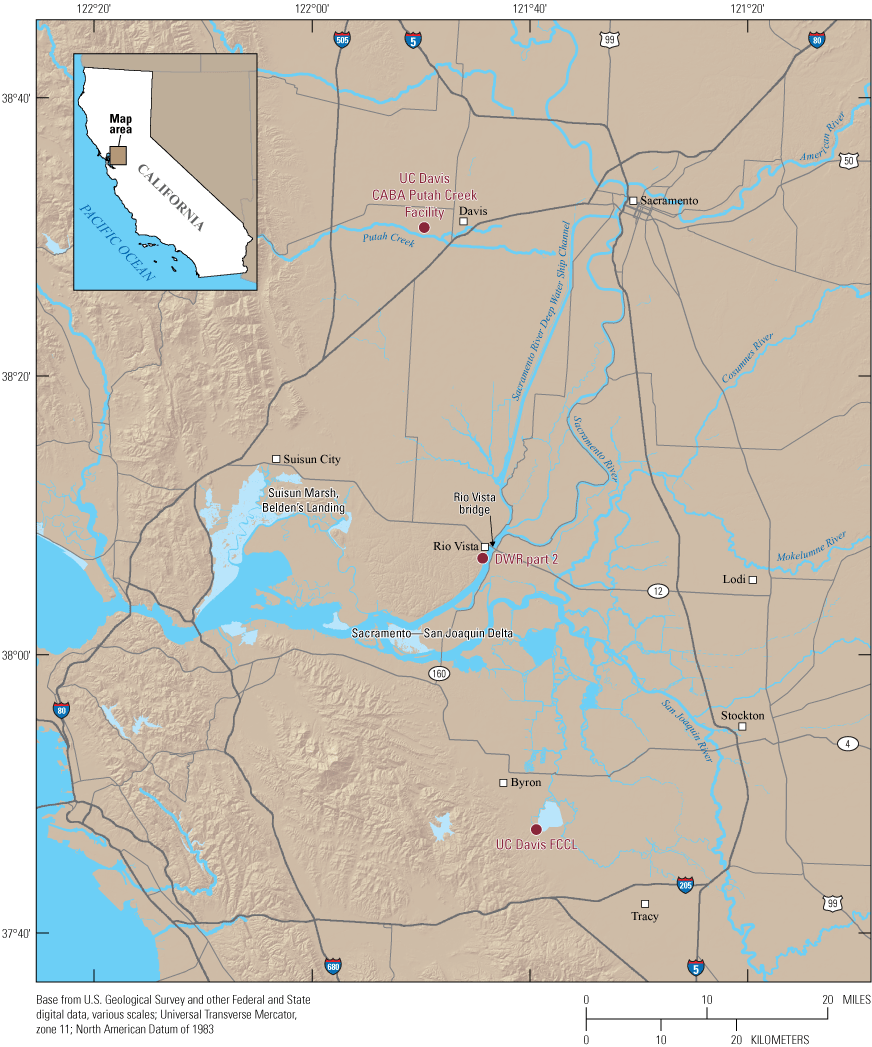
The two study sites and the University of California, Davis (UC Davis), Fish Conservation and Culture Lab (FCCL) where the delta smelt used in the study originated. The UC Davis Center for Aquatic Biology and Aquaculture (CABA), Putah Creek Facility, focuses its research on the wild and cultured biological resources in California. Rio Vista is the location of part two of the study and the California Department of Water Resources (DWR) wild enclosure deployment.
There is a growing interest from resource managers to develop the science required to introduce domesticated delta smelt into the wild to avoid extinction (California Natural Resources Agency, 2016; Lessard and others, 2018). Hung and others (2019) determined that domesticated delta smelt could survive in a semi-natural environment with unmanaged water quality and naturally produced wild prey. Based on the findings of Hung and others (2019) and in response to developments from a 2017 Smelt Supplementation Workshop (Lessard and others, 2018), the California Department of Water Resources (DWR) conducted a series of experiments to evaluate the survival of domesticated delta smelt across a range of natural field conditions. These experiments were conducted prior to the enclosure deployments that were the focus of this study, which was completed cooperatively between DWR and the U.S. Geological Survey (USGS). Generally, the experiments examined survival and other parameters of interest of domesticated delta smelt in enclosures placed in locations throughout the Sacramento–San Joaquin Delta. After this initial deployment, DWR had questions regarding how the fish were behaving within the enclosures in response to various stimuli. The purposes of this report were to (1) describe methods that were developed to observe fish behavior in the enclosures, (2) document basic behaviors, and (3) determine how fish within the enclosures respond to various stimuli.
This report was organized into two separate parts (part 1 and part 2) conducted in 2019. Part 1 focused on the development of videography methods to observe fish within enclosures and included preliminary observations of how fish behavior was influenced when the enclosure was disturbed in a manner consistent with routine cleaning and servicing. Part 2 focused on documenting basic attributes of delta smelt behavior and a select range of potential disturbances to enclosures that might affect delta smelt behavior during an experimental enclosure deployment in the Sacramento River at Rio Vista, California.
Methods
All data generated by this study, including all video clips and the spreadsheet of data generated from them, have been published in a USGS data release (Enos and others, 2020). Net flow data were obtained from DWR (California Department of Water Resources, 2021a). Water temperature, specific conductance, wind speed, turbidity, and chlorophyll data were obtained from DWR (California Department of Water Resources, 2021b).
The field enclosures used in this study were designed and fabricated by DWR (fig. 2). The circular enclosures were constructed of powder-coated aluminum with a 4.7-millimeter (mm) perforated sheet mesh, and the enclosures were 914 mm in diameter and 1,219 mm in height. The enclosures had locking lids constructed of the same mesh and were secured in place in the field with a system that included 60-kilogram (kg) pyramid anchors, mooring buoys, and stainless-steel cable rigging lines enclosed in pipes made of polyvinyl chloride (fig. 3).
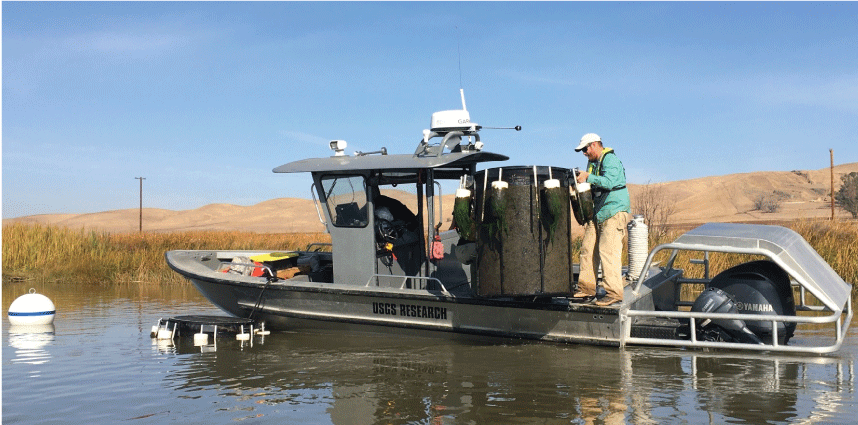
Retrieval of delta smelt enclosures deployed at Suisun Marsh near Belden’s Landing, Suisun City, California, November 7, 2019.
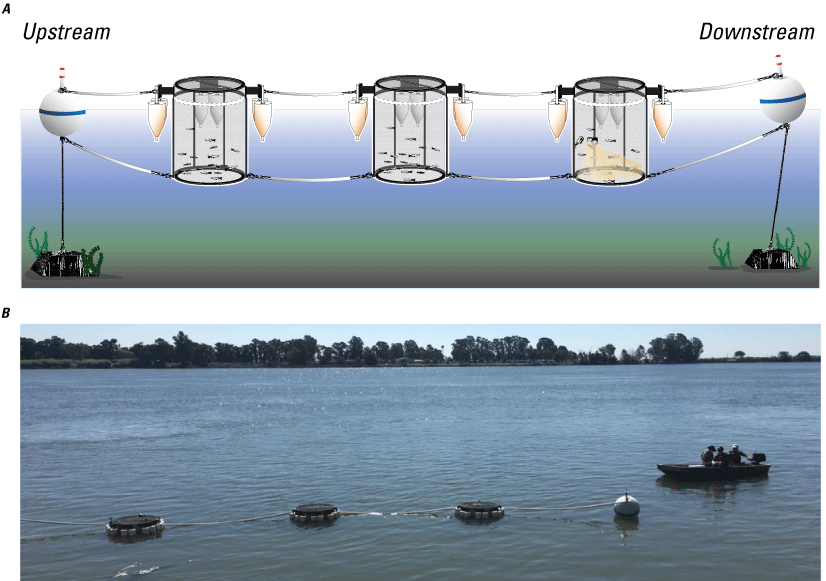
The delta smelt enclosure setup used at the Rio Vista, California, study site. Cameras were in the most downstream (right) enclosure. The enclosures were linked together via a steel cable enclosed by a polyvinyl chloride pipe: A, a conceptualized illustration and B, a photograph of the actual field deployment. White cone shaped objects around the outside of the enclosure are buoys to provide balance and keep the enclosure floating.
Based on Davis and others (2019), delta smelt group behaviors were broadly categorized into two basic categories: (1) normal and (2) alarm. Normal behavior was characterized as calm, non-polarized, and docile swimming behavior. In this case, individual fish did not exhibit group cohesion (were very loosely shoaled), were relatively evenly dispersed throughout the enclosure, and demonstrated slow, deliberate swimming patterns. Alarm behavior was characterized by sudden and rapid darting, frantic swimming activity, and tighter polarization of individuals. Fish exhibiting alarm behavior appeared to be stressed and attempted to avoid potentially deleterious events.
Part 1 of the study took place in a controlled semi-agricultural pond at the UC Davis Center for Aquatic Biology and Aquaculture (CABA), Putah Creek Facility, which focuses its research on the wild and cultured biological resources in California (fig. 1). The first objective was to determine the optimal camera equipment, settings, and deployment methods required to observe the behavior of delta smelt in the field enclosures. The camera used in this study was the GoPro (San Mateo, California) Hero 4 Black that was paired with a Blink Time Lapse Controller (CamDo Solutions Inc, Vancouver, British Columbia, Canada) for customized scheduling of operations and recording. The optimal basic camera settings for our study included the super wide viewing option with a resolution level of 1,920-pixel horizontal display, 1,080-pixel vertical display, and the low-light mode turned off. Through trial and error, we determined that these settings optimized video quality and minimized battery drain. The low-light mode was turned off because it caused the Blink Time Lapse Controller to malfunction. Four individual cameras were affixed to the interior of a single enclosure (fig. 4). The cameras were affixed with magnets, positioned at about mid-height on the enclosure, and evenly spaced at about 90 degrees of the enclosure’s circumference. The cameras were angled slightly downward to generate a viewing area representing approximately half of the opposite quadrant of the enclosure.
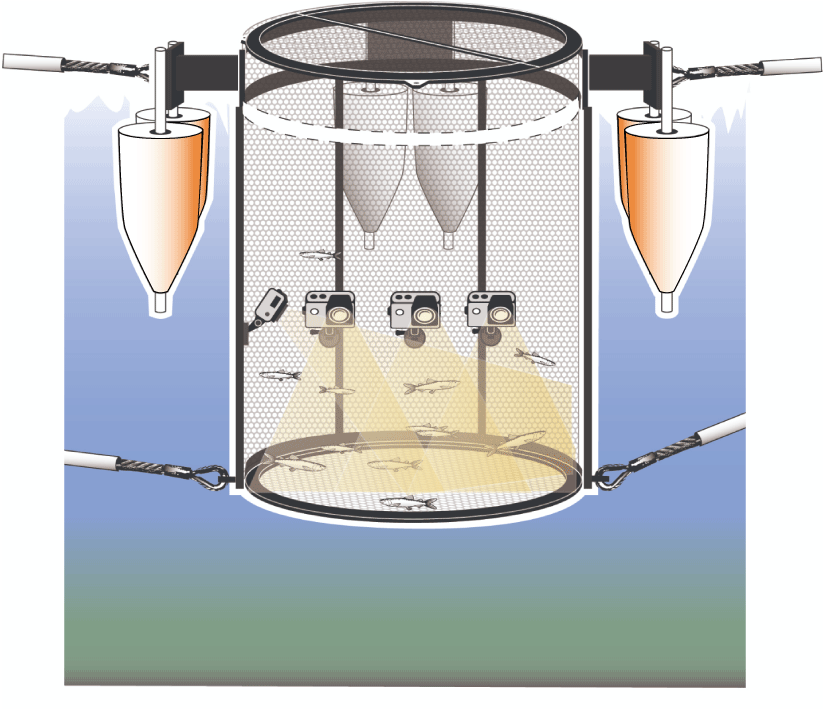
Depiction of the single enclosure located in the controlled agricultural pond at the University of California, Davis, Putah Creek Facility. The white cone-shaped items are buoys used to keep the enclosure afloat.
The single enclosure was placed into the pond on September 4, 2019; it was stocked on September 5, 2019, with 40 domesticated adult delta smelt that were raised at the FCCL and had been maintained at CABA to be available for researchers to complete experiments. We tested the camera system by repeatedly observing how the fish in the enclosure reacted to disturbances of the enclosure that were consistent with how the enclosures are typically cleaned and serviced during field deployments; enclosures deployed in the field require periodic service for general cleaning and removal of biofouling, especially attached algal growth. The enclosure was visited for a mock service cleaning four individual times: once each on September 10, 12, 13, and 18, 2019. All services took place in the morning at about 0900 (Pacific daylight time). Each mock service lasted about 5 minutes, and the specific activities consisted of tying a boat to the enclosure, inspecting the interior of the enclosure for dead fish, scrubbing the exterior of the enclosure to remove biofouling, and measuring water-quality parameters near the enclosure with a hand-held EXO2 sonde that was manufactured by Xylem, the parent company of Yellow Springs Incorporated (YSI). A single camera was programmed to record video for a period starting 10 minutes before each enclosure mock service through 30 minutes following the end of the service. The enclosure was removed from the pond on October 9, 2019, and the fish that were in the enclosure were euthanized by CABA staff. U.S. Geological Survey personnel did not directly handle or interact with the fish for the duration of the study.
Part 2 of the study took place during an experimental field deployment of enclosures conducted by DWR in the Sacramento River near Rio Vista, California, from October 8 to November 6, 2019. The deployment was located approximately 60 meters (m) off the north bank of the Sacramento River and approximately 1 kilometer (km) downstream from the Rio Vista Bridge (fig. 1). The deployment consisted of three enclosures connected in an upstream–downstream orientation parallel with the shoreline, with two cameras (compared to four cameras in study 1; fig. 5) placed into the farthest-downstream enclosure. Cameras were only placed into one enclosure because our study was an added piece to a larger DWR survival study, and we were only permitted access to one enclosure. We used two cameras instead of four because two cameras provided the same enclosure coverage and enough battery life for our needs. Throughout the sample period, there was a steady decrease in net flow and temperature and a spike in turbidity and chlorophyll toward the end of the sample period. Wind speed and specific conductance also were measured for the entirety of the enclosure deployment (fig. 6).
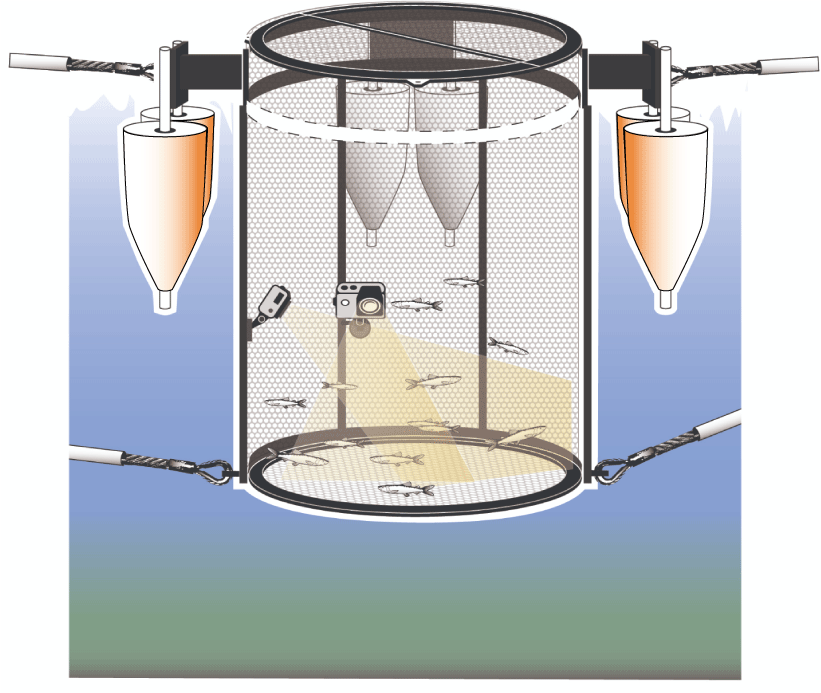
Depiction of the farthest-downstream enclosure at the Rio Vista, California, sample site. The two cameras alternated recording, and the white cone-shaped items are buoys used to keep the enclosure afloat.
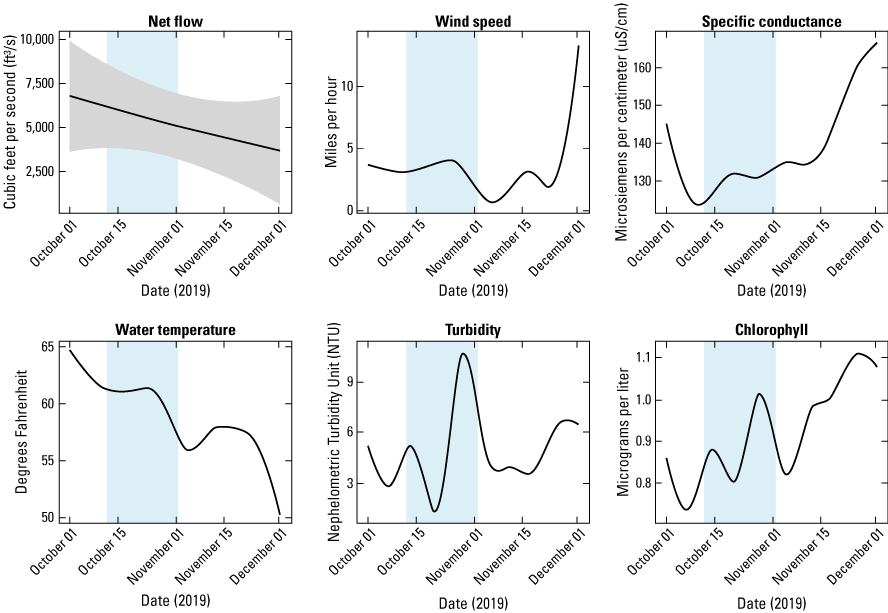
Environmental conditions during October–December 2019 in the vicinity of the enclosure deployment. The blue-shaded area represents the period that the enclosures were deployed. The gray-shaded areas are 95-percent confidence intervals.
The cameras were programmed to record video clips of 10 minutes in duration, four times per day during daylight hours: 0900, 1200, 1500, and 1800. Recordings were made starting on October 12 through November 2, 2019. Camera settings matched those described for part 1. Video clips were recorded by one camera at a time, and consecutive recordings alternated between cameras to maximize battery life. A total of 590 minutes of video footage was recorded in the form of 59 individual, 10-minute video clips.
Video clips collected in part 2 also were analyzed to broadly characterize water clarity and the timing, duration, and intensity of three basic types of disturbances that could potentially cause stress to delta smelt within the enclosures. Water clarity represented our general ability to observe behaviors and was assigned subjective visibility categorical values: clear, full vision (fig. 7A), slightly turbid but full vision (fig. 7B), and turbid with limited vision (fig. 7C). The three types of disturbances were categorized as (1) boat noise, (2) enclosure noise, and (3) physical enclosure movements.
Boat and enclosure noises were identified from the audio element of the video clips. Boat noise was characterized as the whirring or humming of boat motors as boats traveled near the enclosure. Boat noise intensities were defined as (1) low audible boat noise and pitch, (2) intermediate audible boat noise and pitch, and (3) highest audible boat noise and pitch. Enclosure noise was characterized as the creaking, clanking, or banging noises associated with the various components of the enclosure system contacting each other. Enclosure noise intensities were defined as (1) low frequency creaking, (2) intermediate creaking with clanking, and (3) intense clanking. Physical enclosure movement was identified visually and was characterized as vertical movements of the enclosure caused by wave energy. Physical movement intensities were defined as (1) minimal vertical movement, (2) intermediate vertical movement, and (3) violent vertical movement. Boat noise and physical movement events were typically continuous and uninterrupted, making it relatively easy to discern start and end points of individual events. Enclosure noise events were more erratic and irregular, which caused difficulty in discerning individual events. Ultimately, we characterized individual events as enclosure noises separated by at least 15 seconds. If a disturbance event contained multiple intensities, the highest intensity observed was recorded.
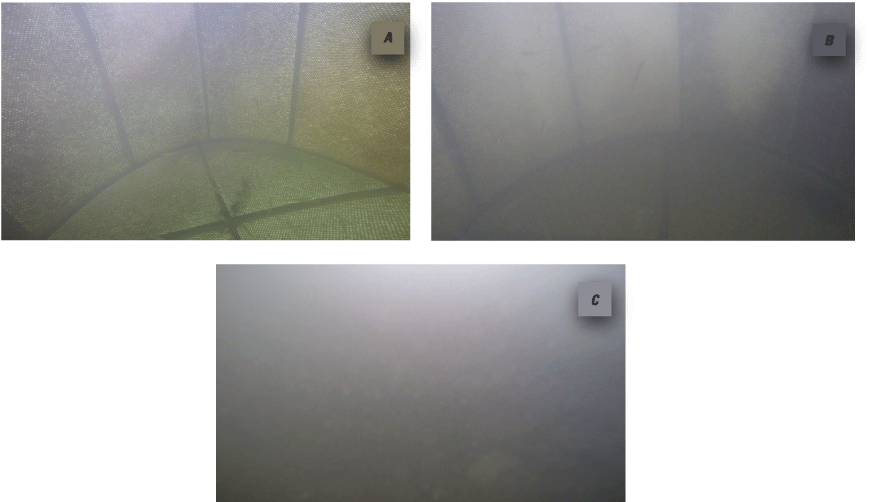
Visual representation of the subjective categorical values recorded for video visibility: A, clear, full vision; B, slightly turbid but full vision; and C, turbid with limited vision.
Data recorded for each of the 59 video clips consisted of (1) the start time and end time of delta smelt alarm behaviors (normal behavior was considered the default), (2) the start time, end time, and intensity of each disturbance event, and (3) the water clarity ranking. Analyses were limited to the computation and interpretation of summary statistics and plots of the generated data because this was an exploratory study with limited, repeated observations of a single group of fish in a single enclosure. Water temperature, specific conductance, wind speed, turbidity, and chlorophyll data were obtained from DWR (California Department of Water Resources, 2021b).
Results
In each of the four individual mock service visits of the enclosure in the agriculture pond, delta smelt exhibited normal behavior before the service, alarm behavior immediately at the onset of the service, and a return to normal behavior within 130 seconds following the end of the service (table 1).
Table 1.
Summary data of the four sample videos recorded in the enclosure deployed at the University of California, Davis, Putah Creek Facility.[Recovery duration is the amount of time from the enclosure visit end to when the fish returned to normal behavior (Alarm end). Abbreviations: mm/dd/yyyy, month/day/year; hh:mm:ss, hour:minute:second; s, second]
Of the 59 sampling events collected from the Rio Vista site, we observed a total of 33 alarm behaviors. The number of individual alarm behaviors exhibited per 10-minute sampling event ranged from 0 to 3 (mean = 0.5, standard deviation = 0.8). Overall, the duration-frequency histogram shows that the duration of alarm behaviors ranged from 6 to 599 seconds (mean = 129, standard deviation = 175; fig. 8). Alarm behaviors occurred at all times of the day but appeared to be most numerous at 0900, 1200, and 1500, and least numerous at 1800 (fig. 9); however, there was no apparent pattern in the duration of alarm behaviors with time of day. There also was no apparent pattern in the events or duration of alarm behaviors with the time of month (period from start to end of the deployment). Of the 59 sampling events, 12 were considered visibility 1, 24 were visibility 2, and 23 were visibility 3.
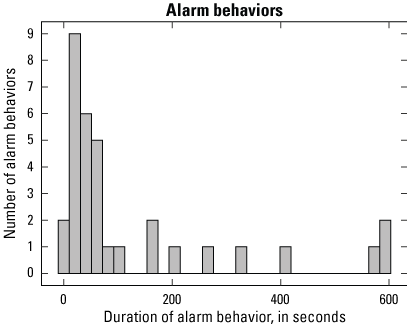
A duration-frequency histogram showing the number and duration of alarm behaviors recorded during sampling events at experimental field enclosures deployed in the Sacramento River near Rio Vista, California, from October 12 to November 2, 2019.
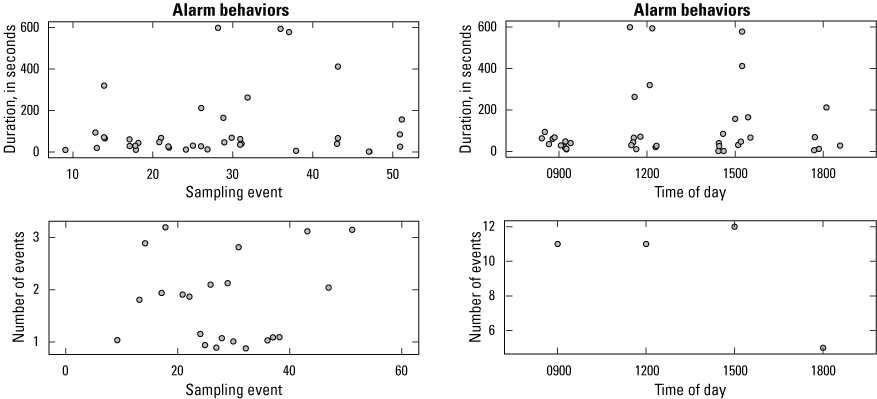
The number and duration of alarm behaviors and the time of day recorded during sampling events at experimental field enclosures deployed in the Sacramento River near Rio Vista, California, from October 12 to November 2, 2019.
Of the 209 disturbance events we observed, 77 (37 percent) were caused by boat noise, 85 (41 percent) were caused by enclosure noise, and 47 (22 percent) were caused by movement of the enclosures. The duration of the boat noises ranged from 8 to 600 seconds (mean = 144, standard deviation = 129; fig. 10), the duration of the enclosure noises ranged from 28 to 600 seconds (mean = 333, standard deviation = 223; fig. 11), and the duration of movements ranged from 23 to 600 seconds (mean = 331; standard deviation = 231; fig. 12). Of the 77 boat noise disturbances, 21 (27 percent) were intensity 1, 28 (36 percent) were intensity 2, and 28 (36 percent) were intensity 3. Of the 85 enclosure noise disturbances, 40 (47 percent) were intensity 1, 29 (34 percent) were intensity 2, and 16 (19 percent) were intensity 3. Of the 47 movement disturbances, 17 (36 percent) were intensity 1, 22 (46 percent) were intensity 2, and 8 (17 percent) were intensity 3. All disturbance categories occurred at all times of the day but appeared to be most numerous at 1200 and 1500, and least numerous at 0900 and 1800 (figs. 13, 14, 15). Patterns in the duration of disturbances in any category or with time of day were not identified (figs. 13, 14, 15). Patterns in the number or duration of disturbance events across sampling events (period from start to end of the deployment; figs. 13, 14, 15) or in disturbance intensity with time of day or across sampling events (figs. 16, 17, 18) also were not identified.
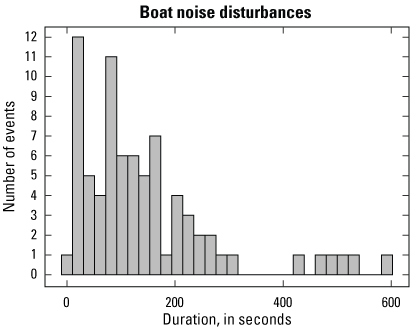
The number and duration of boat noise disturbance events recorded during sampling events at experimental field enclosures deployed in the Sacramento River near Rio Vista, California, from October 12 to November 2, 2019.
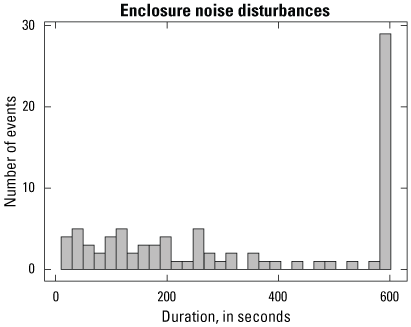
The number and duration of enclosure noise disturbance events recorded during sampling events at experimental field enclosures deployed in the Sacramento River near Rio Vista, California, from October 12 to November 2, 2019.
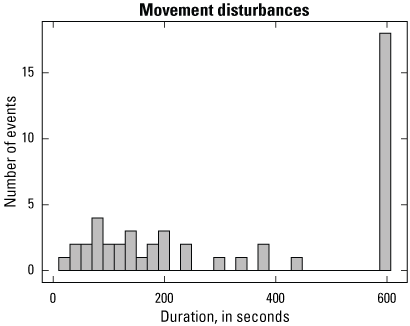
The number and duration of movement disturbance events recorded during sampling events at experimental field enclosures deployed in the Sacramento River near Rio Vista, California, from October 12 to November 2, 2019.
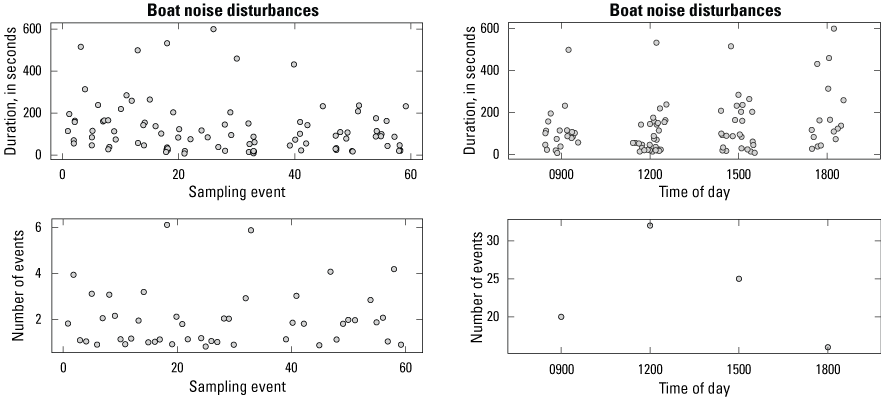
The number and duration of boat noise disturbance events and the time of day recorded in the enclosure deployed during sampling events at experimental field enclosures in the Sacramento River near Rio Vista, California, from October 12 to November 2, 2019.
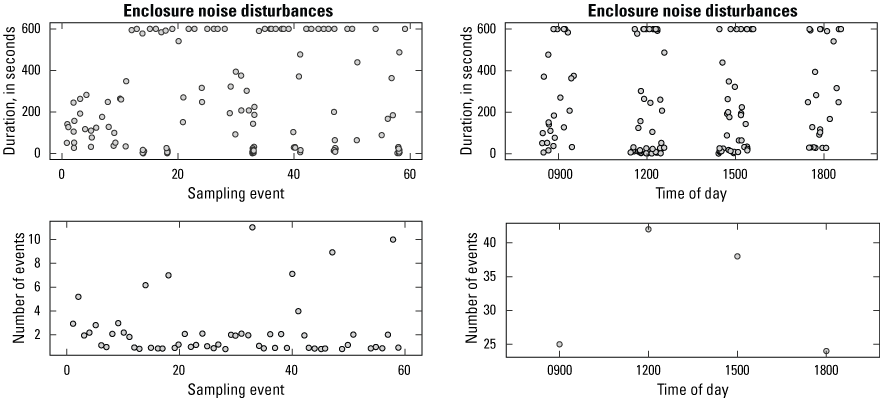
The number and duration of enclosure noise disturbance events and the time of day recorded during sampling events at experimental field enclosures deployed in the Sacramento River near Rio Vista, California, from October 12 to November 2, 2019.
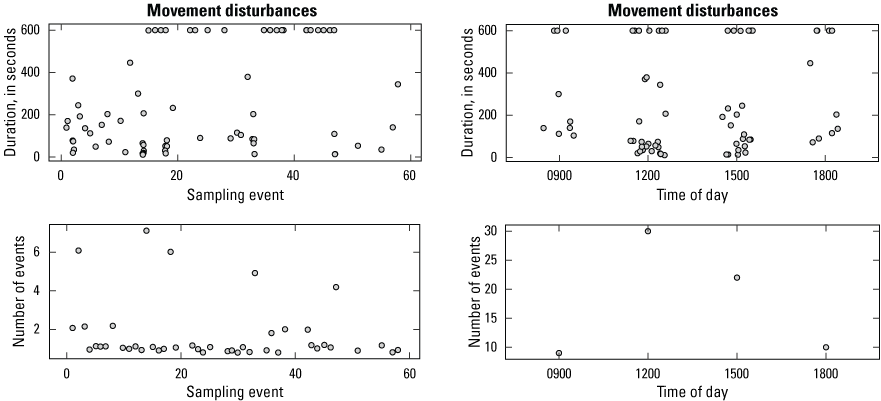
The number and duration of movement disturbance events and the time of day recorded during sampling events at experimental field enclosures deployed in the Sacramento River near Rio Vista, California, from October 12 to November 2, 2019.
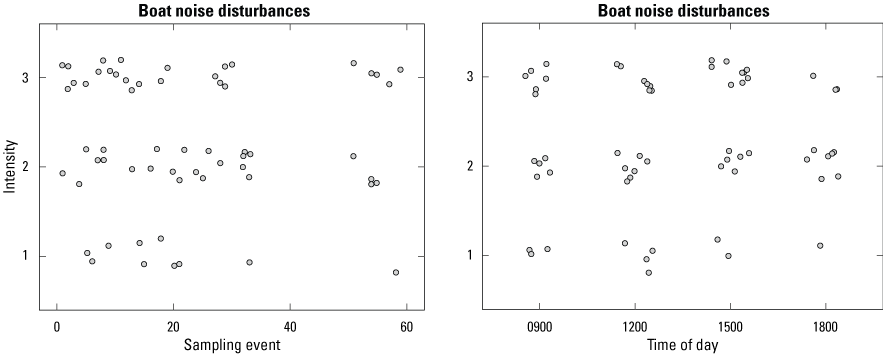
The intensities and times of day of boat noise disturbance events during sampling events (October 12–November 2, 2019) were recorded in the experimental enclosure deployed in the Sacramento River near Rio Vista, California.
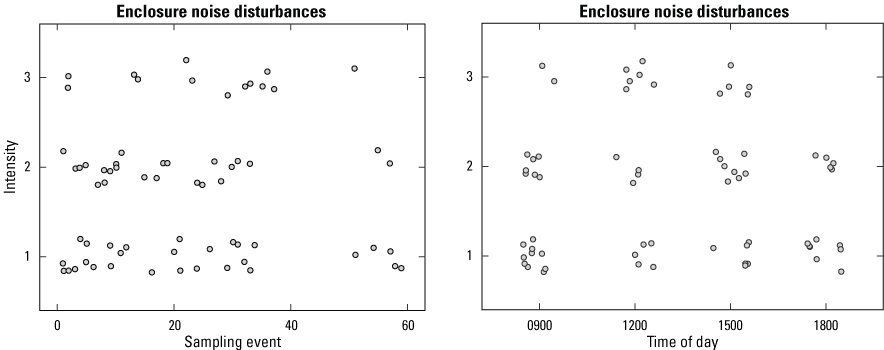
The intensity of enclosure noise disturbance events and the time of day of each during sampling events (October 12–November 2, 2019) were recorded in the experimental enclosure deployed in the Sacramento River near Rio Vista, California.
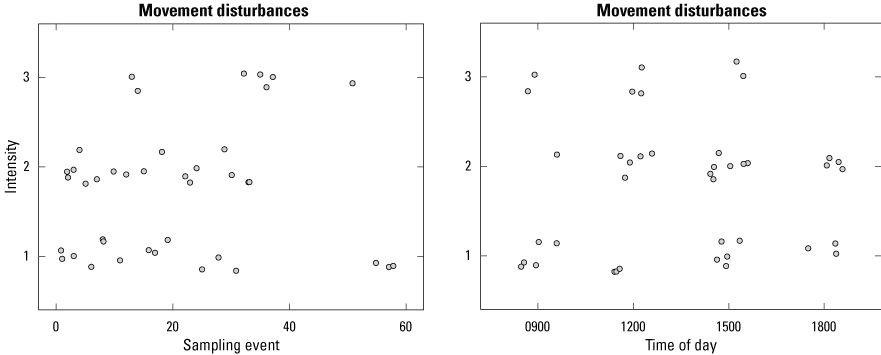
The intensity of movement disturbance events and the time of day of each during sampling events (October 12–November 2, 2019) were recorded in the experimental enclosure deployed in the Sacramento River near Rio Vista, California.
Discussion
The results of this study contribute to the growing body of knowledge needed to successfully determine the viability of using domesticated fish to supplement the wild population of delta smelt (Lessard and others, 2018; Hung and others, 2019). Video observations allowed us to observe general delta smelt behaviors throughout the deployment of the enclosures and provided insight into the extent and intensity of disturbances experienced by the fish in the enclosures. Throughout our observations, the fish generally exhibited normal behavior in both the agricultural pond and the enclosures deployed in the Sacramento River near Rio Vista. Delta smelt deployed at the UC Davis CABA facility exhibited alarm behaviors in direct response to simulated enclosure services. However, this does not appear to be detrimental to the continual use of this enclosure design. Our observations showed no evidence that the alarm behaviors lead to direct injury or death, and the delta smelt returned to normal behavior quickly after the enclosure service ended. Occasionally, increased active swimming was observed in the Rio Vista enclosure to compensate for high tidal flow, but this did not appear to negatively affect the health of the fish. However, indirect impacts of alarm behaviors on fish health and behavior were not part of this study; therefore, we cannot comment on the long-term effects of enclosures and alarm behaviors on delta smelt. Far more disturbances were noted than alarm behaviors in the Rio Vista enclosure, indicating that delta smelt are relatively resilient to the disturbances we identified. Although we were unable to statistically link specific disturbances to alarm behavior, the high intensity enclosure noise seemed to often trigger alarm behavior. Once again, these alarm behaviors do not appear to be detrimental to the health of the fish because evidence of injury or death due to alarm behaviors was not seen. Like the fish deployed at UC Davis, the fish in the Rio Vista enclosure quickly returned to baseline normal behavior.
Our experiments were part of a pilot study, and we acknowledge the limitations associated with our observations. All experimental observations were made on one group of delta smelt, and observations on a single treatment made rigorous statistical analysis unfeasible, which limited our interpretation of results to simple summary data analysis and anecdotal observations. In addition, the observed disturbance events are those audible and visible to humans and may not indicate what is perceived or impactful to the fish. Environmental conditions were uncontrolled; therefore, it was not possible to test the effect of environmental conditions on behavior, outside of disturbances. There were some instances where visibility was relatively poor and our confidence in our observations was not strong. The videos (35, 38–50, 52, 53, and 56)) demonstrate the limitations of our camera setups in high turbidity and low-light situations. We recognize that these video recordings are subsamples that only capture a small percentage of the daily activity of the fish. In addition, several enclosure noise and movement disturbances lasted the entire 10-minute recording; therefore, we do not know how long these disturbances continued before or after the recording period and whether they triggered alarm behaviors not captured by the cameras.
Based on what we learned in this pilot study, there are many ways to improve on our abilities to observe delta smelt in the enclosures. The GoPro cameras were effective for recording video during the day; however, the GoPro cameras did not help us evaluate behaviors of delta smelt at night. Understanding nighttime behaviors of delta smelt could be an important part of understanding overall fish behavior within the enclosures. Use of night vision camera technology could be examined further. Similarly, the ability to observe fish in highly turbid conditions could allow for a better understanding of the relation between delta smelt and turbidity.
The camera setup only allowed us to view a portion of the enclosure, but the angle of viewing seemed to allow us to see the majority of the fish, we still saw fish moving in and out of the frame. The use of multiple cameras recording at once could provide complete coverage of the enclosure and enable more rigorous behavioral analysis. Multiple cameras could be combined with a reliable camera mounting system to improve the precision of camera placement and the viewing angles of the cameras. The study design could be improved by expanding the number of enclosures and groups of fish being observed. Expanding the number of enclosures, the number of sites with enclosures, and the number of cameras would create a more robust study design. Further study designs could include comparisons of delta smelt domestication levels and fish densities within the enclosures would further enhance the study design.
Throughout our review of the videos, violent enclosure noise and movement often appeared to trigger an alarm behavior; most likely these were caused by high winds and waves or boat wakes contacting the enclosure. Choosing calm protected locations with minimal boat traffic would help minimize alarm behaviors. Furthermore, later in the day may be the best time to introduce and acclimate delta smelt to the enclosures because our summary data show that there is a decrease in disturbance events at 1800. Releasing the fish into the enclosure around this time could provide them an opportunity to acclimate to the new conditions without enduring disturbance events that occur during the day. However, as we have seen, we were unable to link alarm behaviors to the death of delta smelt, so alarm behaviors do not appear to detrimentally impact delta smelt in deployed enclosures.
Summary
The delta smelt (Hypomesus transpacificus) is a small, euryhaline fish species endemic to the Sacramento–San Joaquin Delta; it is protected under the U.S. and California Endangered Species Acts, and because of declines in population abundance, the delta smelt may be vulnerable to extinction. The California Department of Water Resources has conducted studies to test the viability of using domesticated fish to supplement the wild population of delta smelt. These studies focused on examining the health and survival of domesticated delta smelt placed inside enclosures (circular cages that are approximately 1.5 meters tall by 1 meter in diameter) into the wild. The U.S. Geological Survey, in cooperation with the California Department of Water Resources, completed two parts within this study using underwater cameras inside the enclosures to observe fish behavior and their responses to certain stimuli. In both parts of the study, delta smelt behaviors were broadly categorized into two basic categories: (1) normal and (2) alarm. Normal behavior was characterized as calm, non-polarized, and docile swimming behavior. Alarm behavior was characterized by sudden and rapid darting, polarized frantic swimming activity, and tighter schooling polarization of individuals.
The first part of the study took place in a semi-controlled agricultural pond on the campus of the University of California, Davis. At this agricultural pond, we developed methods of observation and documented how fish behaved in response to enclosure disturbances associated with routine cleaning and service that is required during extended field deployments of the enclosures. We observed that delta smelt behavior changed from normal to alarm at the onset of an enclosure service and from alarm to normal within about 2 minutes after the service ended.
The second part of the study was completed in cooperation with the California Department of Water Resources (DWR). In October 2019, DWR deployed three enclosures in the Sacramento River near Rio Vista, California, to monitor survival rate of delta smelt. The DWR permitted us to deploy cameras in one enclosure to document the frequency and duration of alarm behaviors exhibited by delta smelt and the frequency, duration, and intensity of three types of disturbances: (1) noise generated from passing boats, (2) noise generated from the enclosure moving in response to wave energy, and (3) vertical movements of the enclosure generated from wave energy. Alarm behaviors averaged about 2 minutes in duration and occurred most frequently during the evening compared to midday or morning. Each disturbance variable exhibited substantial variability in duration and intensity and occurred least frequently during the morning and evening compared to midday. Alarm behaviors appeared to be most associated with high intensity enclosure noises and vertical movements; however, limited replicate samples prohibited developing a statistical relation. Alarm behaviors did not directly contribute to injury or mortality of individual delta smelt; however, indirect or sublethal effects of alarm behaviors were not examined.
References Cited
Bennett, W.A., 2005, Critical assessment of the Delta Smelt population in the San Francisco Estuary, California: San Francisco Estuary and Watershed Science, v. 3, no. 2, 71 p. [Available at https://doi.org/10.15447/sfews.2005v3iss2art1.]
California Department of Fish and Wildlife, 2021, Delta Smelt, accessed December 30, 2021, at https://wildlife.ca.gov/Conservation/Fishes/Delta-Smelt#:~:text=Species%20Status%20Delta%20Smelt%20was%20listed%20as%20threatened,In%202009%2C%20CESA%20status%20was%20changed%20to%20endangered.
California Department of Water Resources, 2021a, California Data Exchange Center: SRV—Sacramento River at Rio Vista (USGS), accessed October 19, 2021, at http://cdec.water.ca.gov/cdecstation2/?sta=SRV.
California Department of Water Resources, 2021b, California Data Exchange Center: SRV—Sacramento River at Rio Vista (USGS), accessed October 19, 2021, at http://cdec.water.ca.gov/cdecstation2/?sta=RVB.
California Natural Resources Agency (CNRA), 2016, Delta Smelt resiliency strategy, July 2016: California Natural Resources Agency, 11 p. [Available at https://resources.ca.gov/CNRALegacyFiles/docs/Delta-Smelt-Resiliency-Strategy-FINAL070816.pdf.]
Davis, B.E., Hansen, M.J., Cocherell, D.E., Nguyen, T.X., Sommer, T., Baxter, R.D., Fangue, N.A., and Todgham, A.E., 2019, Consequences of temperature and temperature variability on swimming activity, group structure, and predation of endangered Delta Smelt: Freshwater Biology, v. 64, no. 12, p. 2156–2175. [Available at https://doi.org/10.1111/fwb.13403.]
Enos, E.R., Patton, O.J., and Feyrer, F.V., 2020, Underwater videographic observations of cultured Delta Smelt in field enclosures—Video clips and summary data: U.S. Geological Survey data release, https://doi.org/10.5066/P9CY39ZG.
Hobbs, J., Moyle, P.B., Fangue, N., and Connon, R.E., 2017, Is extinction inevitable for Delta Smelt and Longfin Smelt? An opinion and recommendations for recovery: San Francisco Estuary and Watershed Science, v. 15, no. 2, 19 p. [Available at https://doi.org/10.15447/sfews.2017v15iss2art2.]
Hung, T.-C., Rosales, M., Kurobe, T., Stevenson, T., Ellison, L., Tigan, G., Sandford, M., Lam, C., Schultz, A., and Teh, S., 2019, A pilot study of the performance of captive-reared Delta Smelt Hypomesus transpacificus in a semi-natural environment: Journal of Fish Biology, v. 95, no. 6, p. 1517–1522. [Available at https://doi.org/10.1111/jfb.14162.]
Lessard, J., Cavallo, B., Anders, P., Sommer, T., Schreier, B., Gille, D., Schreier, A., Finger, A., Hung, T.-C., Hobbs, J., May, B., Schultz, A., Burgess, O., and Clarke, R., 2018, Considerations for the use of captive-reared Delta Smelt for species recovery and research: San Francisco Estuary and Watershed Science, v. 16, no. 3, 15 p. [Available at https://doi.org/10.15447/sfews.2018v16iss3art3.]
Lindberg, J.C., Tigan, G., Ellison, L., Rettinghouse, T., Nagel, M.M., and Fisch, K.M., 2013, Aquaculture methods for a genetically managed population of endangered Delta Smelt: North American Journal of Aquaculture, v. 75, no. 2, p. 186–196. [Available at https://doi.org/10.1080/15222055.2012.751942.]
Moyle, P.B., Herbold, B., Stevens, D.E., and Miller, L.W., 1992, Life history and status of Delta Smelt in the Sacramento–San Joaquin estuary, California: Transactions of the American Fisheries Society, v. 121, no. 1, p. 67–77. [Available at https://doi.org/10.1577/1548-8659(1992)121%3C0067:LHASOD%3E2.3.CO;2.]
Sommer, T., Armor, C., Baxter, R., Breuer, R., Brown, L., Chotkowski, M., Culberson, S., Feyrer, F., Gingras, M., Herbold, B., Kimmerer, W., Mueller-Solger, A., Nobriga, M., and Souza, K., 2007, The collapse of pelagic fishes in the upper San Francisco Estuary: Bethesda, Md., Fisheries , v. 32, no. 6, p. 270–277. [Available at https://doi.org/10.1577/1548-8446(2007)32[270:TCOPFI]2.0.CO;2.]
Conversion Factors
For more information concerning the research in this report, contact the
Director, California Water Science Center
U.S. Geological Survey
6000 J Street, Placer Hall
Sacramento, California 95819
https://www.usgs.gov/centers/ca-water/
Publishing support provided by the U.S. Geological Survey
Science Publishing Network, Sacramento Publishing Service Center
Suggested Citation
Enos, E., Patton, O., and Feyrer, F., 2022, Underwater videographic observations of domesticated Delta smelt in field enclosures: U.S. Geological Survey Open-File Report 2022–1028, 17 p., https://doi.org/10.3133/ofr20221028.
ISSN: 2331-1258 (online)
Study Area
| Publication type | Report |
|---|---|
| Publication Subtype | USGS Numbered Series |
| Title | Underwater videographic observations of domesticated Delta smelt in field enclosures |
| Series title | Open-File Report |
| Series number | 2022-1028 |
| DOI | 10.3133/ofr20221028 |
| Year Published | 2022 |
| Language | English |
| Publisher | U.S. Geological Survey |
| Publisher location | Reston, VA |
| Contributing office(s) | California Water Science Center |
| Description | Report: vii, 17 p.; Data Release |
| Country | United States |
| State | California |
| Other Geospatial | Sacramento–San Joaquin Delta |
| Online Only (Y/N) | Y |
| Google Analytic Metrics | Metrics page |