

Summary of the Midchannel Springflows in Jackson River Below Gathright Dam Between April 24, 2010, and May 7, 2019
Links
- Document: Report (1.60 MB pdf) , HTML , XML
- Download citation as: RIS | Dublin Core
Abstract
Between April 2010 and May 2019, springflow was determined for a midchannel spring in Jackson River below Gathright Dam near Hot Springs, Virginia. The springflow was measured to assess if the spring was influenced by the elevation of Lake Moomaw. Local precipitation was also reviewed to determine whether variations in springflow were influenced by rainfall. The spring is approximately 250 feet downstream from the dam’s discharge race channel, where the water is carried away from the base of the dam, and its flow was determined by the gain in streamflow between concurrent measurements made upstream and downstream from the spring. Throughout the study period, the springflow showed little variation over time, and no direct correlations were determined between the observed springflow and the elevation of Lake Moomaw or local precipitation data.
Introduction
The U.S. Army Corps of Engineers Norfolk District contacted the U.S. Geological Survey (USGS) in April 2010 regarding the determination of flow from a midchannel spring located in Jackson River below Gathright Dam near Hot Springs, Virginia. The spring is located midchannel approximately 250 feet downstream from the dam’s discharge race channel. The spring can be located by means of a pipe that has been placed near the center of the spring; water can be observed discharging directly to the Jackson River around the pipe (fig. 1). As part of this effort, the USGS compared measured streamflows at the existing streamgage, 02011800 Jackson River below Gathright Dam near Hot Springs, Va., to measured streamflows for the newly established streamgage, 02011799 Jackson River above spring near Hot Springs, Va. (figs. 2 and 3) to compute the springflow. During the period from April 24, 2010, to May 7, 2019, the USGS made 30 concurrent site inspections with streamflow measurements at each streamgage location for comparison and calculation of springflows. The calculated springflows were compared with the daily elevation of Lake Moomaw at 08:00 a.m. (U.S. Army Corps of Engineers Norfolk District Water Management, 2020) and local precipitation totals from the National Oceanic and Atmospheric Administration (NOAA) weather station in Hot Springs, Va., USC 0444128 (National Oceanic and Atmospheric Administration, 2020).
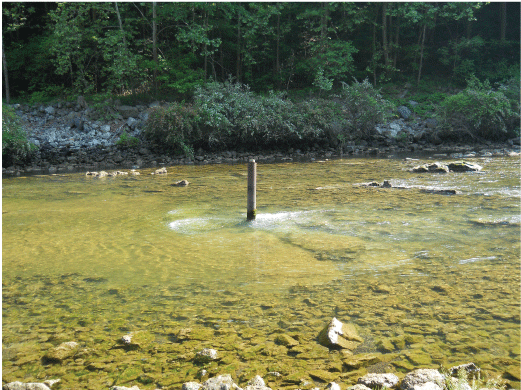
Springflow at pipe at Jackson River below Gathright Dam near Hot Springs Virginia. Photograph by the U.S. Geological Survey.
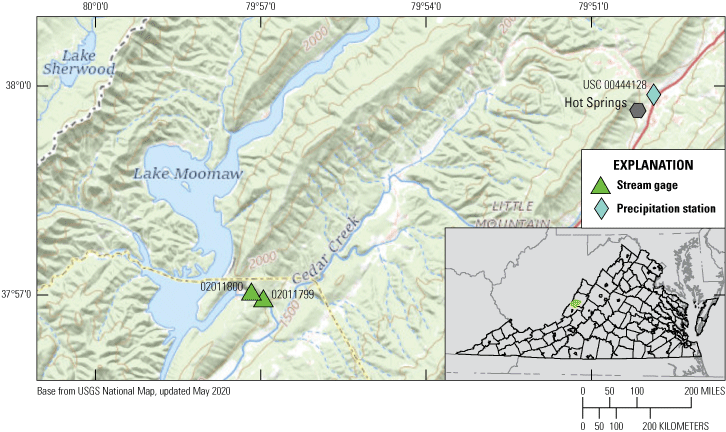
Location of the data collection sites near Lake Moomaw, Virginia, and Hot Springs, Va.
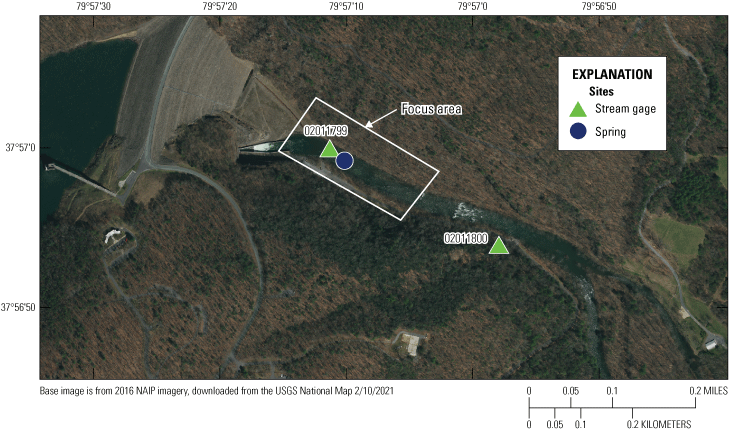
Location of U.S. Geological Survey streamgages 02011799 and 02011800 below Gathright Dam. Streamflow measurements were made within the focus area above and below the spring.
Data Collection and Springflow Determination
Site inspections of the USGS streamgages in Jackson River at 02011800 Jackson River below Gathright Dam near Hot Springs, Va., and 02011799 Jackson River above spring near Hot Springs, Va., below Gathright Dam, were made between April 27, 2010, and May 7, 2019, to determine the springflow. The site inspections included concurrent streamflow measurements above and below the spring to determine its flow (fig. 4). The mean streamflow was determined prior to computing the springflow for inspections that included more than one measurement.
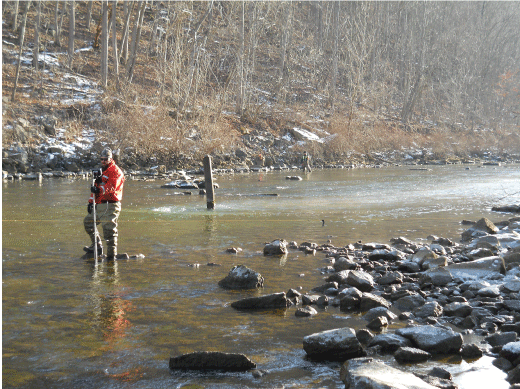
U.S. Geological Survey (USGS) hydrographers making concurrent streamflow measurements to compute springflow from the midchannel spring in Jackson River below Gathright Dam near Hot Springs, Virginia. Photograph by the USGS.
Streamflow Measurement Methods
Streamflow measurements were made using an acoustic Doppler velocimeter (ADV), an acoustic Doppler current profiler (ADCP), and a Price AA current-meter (AA). To minimize bias associated with specific measurement equipment or a hydrographer’s measurement technique, streamflow measurements were made by different USGS staff and streamflow measurement equipment, depending on the availability of each. Prior to the streamflow measurements, releases from the dam were stabilized and a temporary reference gage was deployed in the settling pool below the dam outflow to confirm a consistent water level and steady flow rate. The gage height, or water-surface elevation, of the downstream reference gage, 02011800, also was observed to confirm flow conditions; however, a lag in water-level stabilization because of travel time was observed at the beginning of some measurements. The lag in gage height stabilization at station 02011800 did not impact the measurements, as the water-levels at the measurement locations had already stabilized. For the 30 site inspections made, a total of 49 streamflow measurements were used from the upstream streamgage, 02011799 (table 1), and 47 streamflow measurements were used from the downstream streamgage, 02011800 (table 2).
Table 1.
Streamflow measurement data for U.S. Geological Survey streamgage 02011799 (U.S. Geological Survey, 2020a).[Dates shown as month, day, year. All measurement times are Eastern Local Time. ft3/s, cubic foot per second; ADV, acoustic Doppler velocimeter; ADCP, acoustic Doppler current profiler; >, greater than]
Table 2.
Streamflow measurement data for U.S. Geological Survey streamgage 02011800 (U.S. Geological Survey, 2020b).[Dates shown as month, day, year. All measurement times are Eastern Local Time. ft3/s, cubic foot per second; ADV, acoustic Doppler velocimeter; AA, Price AA current meter; ADCP, acoustic Doppler current profiler; >, greater than]
Springflow Determination
Springflow was computed by determining the gain in flow of the reach between the upstream (02011799) and downstream (02011800) streamflow measurements. For inspections that included more than one streamflow measurement at a site, the average streamflow at that site was determined prior to computing the springflow. A plot showing the average measured streamflow at each inspection upstream and downstream of the spring is shown in figure 5. The gain in flow was calculated by determining the difference in measured streamflow between sites 02011800 and 02011799. Table 3 lists the summary of the average measured streamflow, calculated springflow, the water-surface elevation of Lake Moomaw at 08:00 a.m.Eastern Local Time , in feet above the National Geodetic Vertical Datum of 1929 (NGVD 29), and a 30-day precipitation total prior to the inspection for NOAA weather station USC 00444128 in Hot Springs, Va., on the day of the inspection. Springflow calculated from the 30 inspections made during the study period ranged from −7.00 to 43.0 cubic feet per second. The negative springflows are considered zero flow, as the differences are within the acceptable uncertainty of the streamflow measurements, the percent uncertainty of each measurement can be found in tables 1 and 2. Streamflow measurement uncertainties include uncertainties in the cross-section, the water-velocity profile, computational assumptions, and other systematic errors (Turnipseed and Sauer, 2010). While each year of the study contained limited springflow data points due to a small number of site inspection, the average annual springflow observed was calculated and entered in table 4. The average annual springflow is used to review how the flow of the spring varied over time.
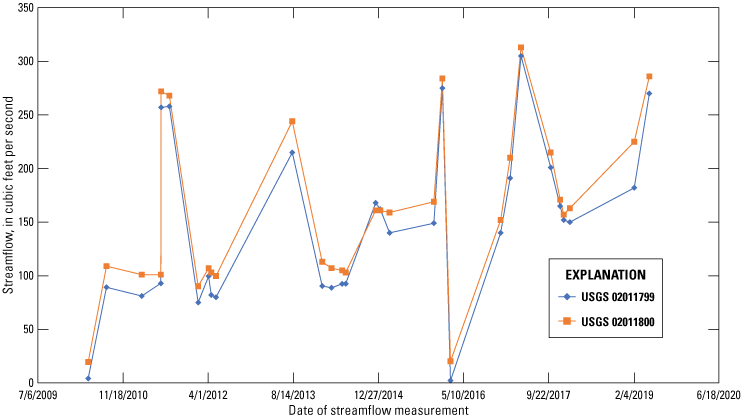
Average measured streamflow values at the U.S. Geological Survey streamgages 02011799 and 02011800 during site inspections.
Table 3.
Summary of the average measured streamflow data for U.S. Geological Survey streamgages 02011799 and 02011800, calculated springflow, the water-surface elevation of Lake Moomaw at 08:00 a.m. Eastern Local Time (U.S. Army Corps of Engineers, 2020) and a 30-day precipitation total for the National Oceanic and Atmospheric Administration weather station USC 00444128 in Hot Springs, Virginia (National Oceanic and Atmospheric Administration, 2020).[Dates shown as month, day, year. ft3/s, cubic foot per second; NGVD 29, National Geodetic Vertical Datum of 1929; in., inch]
Table 4.
Average annual springflow observed and annual precipitation totals from National Oceanic and Atmospheric Administration weather station USC 00444128 in Hot Springs, Virginia (National Oceanic and Atmospheric Administration, 2020).[NOAA, National Oceanic and Atmospheric Administration; ft3/s, cubic foot per second; in., inch]
Results and Findings
To determine if the elevation of Lake Moomaw and the springflow show a direct relationship a statistical analysis of the springflow was examined using a linear regression model (fig. 6) between the calculated springflow and the elevation of the Lake Moomaw on the day of the site inspections. The linear regression analysis shows significant scatter or variability in the data points and a coefficient of determination (R2) value of 0.2186. Analysis of the sample data indicated the lake elevation and springflow do not have a significant correlation.
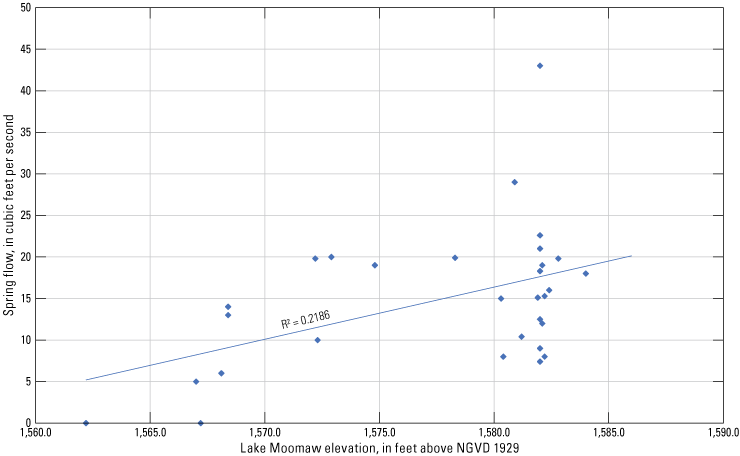
Linear regression analysis of springflow with elevation of Lake Moomaw between April 2010 and May 2019. R2 is the coefficient of determination.
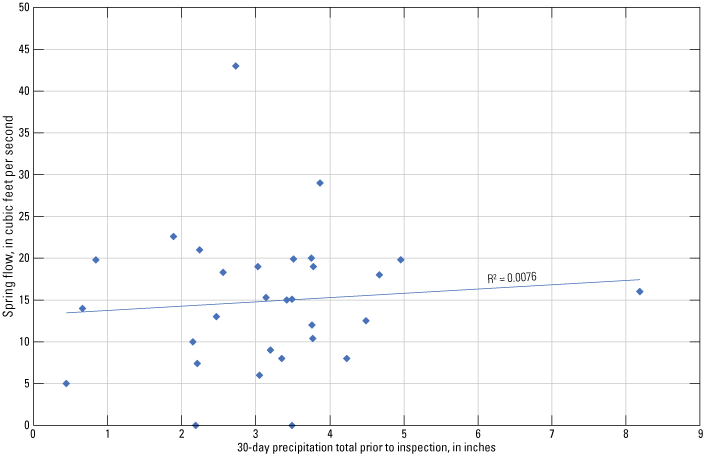
Daily precipitation data from the NOAA weather station USC 00444128 was used to determine the total precipitation for the 30 days preceding the site inspections (table 3). The total does not include the day of the inspection, because the NOAA datasets are reported as daily totals and the precipitation may have occurred after the inspections. A linear regression analysis was also used on the 30-day precipitation total and the calculated springflows to determine if a relationship between recent precipitation and the springflow exists (fig. 7). The linear regression analysis results show significant scatter or variability in the data points and an R2 value of 0.0076. The results of the analysis indicate that the precipitation prior to the measurement inspections does not affect calculated springflow.
Linear regression analysis of the springflow with 30-day precipitation totals from National Oceanic and Atmospheric Administration weather station in Hot Springs, Virginia between April 2010 and May 2019. R2 is the coefficient of determination.
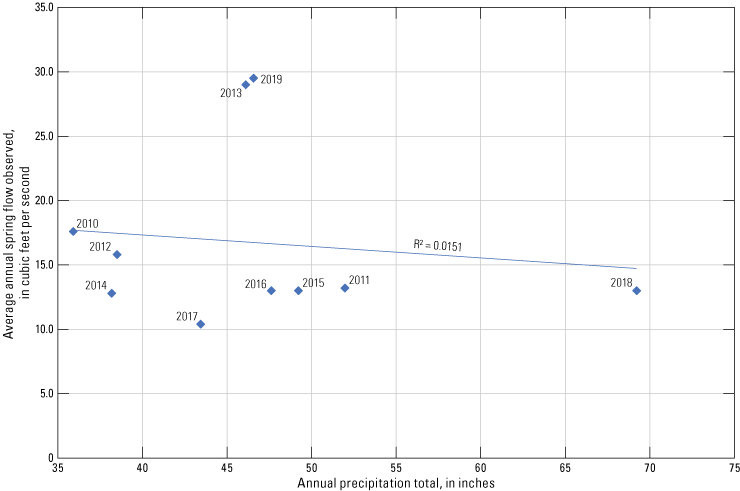
A review of springflow and an analysis of how it relates to the elevation of Lake Moomaw and recent precipitation totals determined that neither variable displays a significant correlation with springflow. The average annual springflow observed (table 4) was reviewed to examine how the springflow varied over time. The annual springflow shows little variation of over time, with 8 of the 10 years falling within one standard deviation of the mean and the remaining 2 years within two standard deviations. Table 4 also includes total annual precipitation data from NOAA weather station USC 00444128 in Hot Springs, Va. A linear regression model (fig. 8) was used to compare the annual precipitation data with the annual mean springflow to determine if there are any correlations between the two datasets. The results of this analysis are similar to results from the analysis of springflow and 30-day precipitation totals, with the linear regression analysis indicating a significant scatter or variability in the data points and an R2 value of 0.0015. Based on this analysis, annual climatological changes did not affect the rate of the average annual springflow.
Linear regression analysis of the average annual springflow observed and the annual total precipitation amounts from National Oceanic and Atmospheric Administration weather station in Hot Springs, Virginia. R2 is the coefficient of determination.
Summary
During the period from April 2010 to May 2019 streamflow measurements from 02011799 Jackson River above spring near Hot Springs, Virginia and 02011800 Jackson River below Gathright Dam near Hot Springs Va., were used to determine the flow of a midchannel spring at the request of the U.S. Army Corps of Engineers Norfolk District. The calculated springflow data were analyzed to determine if correlations could be established between the elevation of Lake Moomaw or local precipitation data from Hot Springs, Va., and were evaluated for trends over time. Results of these analyses indicated no direct correlations between springflow and lake elevation. The local precipitation data indicated that the amount of springflow did not respond to changes in recent or long-term precipitation totals based on the observed springflow values. Annual average springflow data were used to review trends over time, and the data showed little variation in flow over the study period.
References Cited
National Oceanic and Atmospheric Administration, 2020, USC 00444128 Hot Springs, VA Weather Station: Climate Data Online, daily precipitation summary, accessed June 5, 2020, at https://www.ncdc.noaa.gov/cdo-web/datasets/GHCND/stations/GHCND:USC00444128/detail.
U.S. Army Corps of Engineers, 2020, Elevation data at Lake Moomaw, VA, in WM Data Dissemination: U.S. Army Corp of Engineers Access to Water Resources Data, accessed April 8, 2020, at https://water.usace.army.mil/a2w/f?p=100:1:0: [Query parameters: Locate Water Management Areas = Lake Moomaw and Gathright Dam]
U.S. Geological Survey, 2020a, USGS 02011799 Jackson River above Spring near Hot Springs, VA: U.S. Geological Survey National Water Information System database, accessed April 23, 2020, at https://doi.org/10.5066/F7P55KJN. [Data directly accessible at https://waterdata.usgs.gov/nwis/inventory/?site_no=02011799&agency_cd=USGS.]
U.S. Geological Survey, 2020b, USGS 02011800 Jackson River below Gathright Dam near Hot Springs, VA: U.S. Geological Survey National Water Information System database, accessed April 23, 2020, at https://doi.org/10.5066/F7P55KJN. [Data directly accessible at https://waterdata.usgs.gov/nwis/inventory/?site_no=02011800&agency_cd=USGS.]
Suggested Citation
Pula, B., and Wicklein, S., 2022, Summary of the midchannel springflows in Jackson River below Gathright Dam between April 24, 2010, and May 7, 2019: U.S. Geological Survey Open-File Report 2022–1047, 11 p., https://doi.org/10.3133/ofr20221047.
ISSN: 2331-1258 (online)
Study Area
| Publication type | Report |
|---|---|
| Publication Subtype | USGS Numbered Series |
| Title | Summary of the midchannel springflows in Jackson River below Gathright Dam between April 24, 2010, and May 7, 2019 |
| Series title | Open-File Report |
| Series number | 2022-1047 |
| DOI | 10.3133/ofr20221047 |
| Year Published | 2022 |
| Language | English |
| Publisher | U.S. Geological Survey |
| Publisher location | Reston, VA |
| Contributing office(s) | Virginia and West Virginia Water Science Center |
| Description | iv, 11 p. |
| Country | United States |
| State | Virginia |
| Other Geospatial | Jackson River |
| Online Only (Y/N) | Y |
| Additional Online Files (Y/N) | N |
| Google Analytic Metrics | Metrics page |