

Relative Contributions of Suspended Sediment between the Upper Suiattle River Basin and a Non-Glacial Tributary, Washington, May 2016–September 2017
Links
- Document: Report (8.1 MB pdf) , HTML , XML
- Data Release: USGS data release — Suspended sediment and water temperature data in the Suiattle River and the Downey Creek Tributary, Washington for select time periods over 2013 - 2017 (ver. 2.0, October 2021)
- Download citation as: RIS | Dublin Core
Abstract
Concentrations of suspended sediment were measured in discrete samples and turbidity was continuously monitored at four U.S. Geological Survey streamgages in western Washington State, including one gage on the Sauk River; two gages on the Suiattle River, a tributary to the Sauk River; and one gage on Downey Creek, a tributary to the Suiattle River. The Suiattle River is a sediment-rich stream with headwaters on Glacier Peak, a glaciated volcano in the northern Cascade Range.
Contributions of suspended sediment to the Suiattle River from unglaciated tributaries, represented by Downey Creek, were compared to the contributions from Glacier Peak in the upper Suiattle River watershed. During summer 2017, a period for which complete records of discharge and sediment data were available for all three streamgages in the Suiattle River Basin, the suspended-sediment load from Downey Creek (drainage area [DA] 93 square kilometers [km2]) was 1,400 metric tons, which is equivalent to a sediment yield of about 15 metric tons per km2. During the same period, the suspended-sediment load from the upper Suiattle River (DA 176 km2) was 142,000 metric tons, or a sediment yield of about 800 metric tons per km2; and the suspended-sediment load from the lower Suiattle River (DA 733 km2) was 230,000 metric tons, or a sediment yield of about 300 metric tons per km2. The Downey Creek Basin accounts for 13 percent of the drainage area of the Suiattle River watershed but contributed only 0.6 percent of the suspended-sediment load over the summer of 2017 and water year 2017 (October 1, 2016–September 30, 2017). In contrast, the upper Suiattle River Basin, which accounts for 24 percent of the entire Suiattle River watershed, contributed 62 percent of the suspended-sediment load during the summer of 2017.
Given the short period for which data were collected, it cannot be known with certainty whether the above values are representative of long-term means. The relatively minor contribution of suspended sediment from Downey Creek, however, is consistent with the expectation that the upper Suiattle River, which drains Glacier Peak, is the dominant contemporary source of suspended sediment to the Sauk River. During summer 2016, the suspended-sediment load in the upper Siuattle River (180,000 metric tons) was more than double the estimated load in the lower Sauk River (80,000 metric tons), even though the upper Suiattle River represents only 10 percent of the total contributing area to the lower Sauk River Basin. This ratio of relative contribution is interpreted as an indication of transient storage of sediment along the Suiattle and Sauk Rivers between the two streamgaging stations. In the glaciated upper Suiattle River Basin, sediment is transported by annual glacial-melt processes in spring and summer months, deposited during the summer base-flow period, and then remobilized by fall and winter floods for delivery to the lower Sauk River.
Introduction
Suspended sediment in rivers can influence the morphology of channels, floodplains, and estuary deltas; spawning and rearing habitat for fish and other aquatic species; and water quality (Czuba and others, 2011). The Sauk River in Washington State is an important sediment contributor to the Skagit River and Puget Sound. High suspended-sediment loads in the Suiattle River are generally attributed to the contribution of sediment from active glaciers on the east flank of Glacier Peak, which form the headwaters of the river. However, the relative contributions of suspended sediment from the glacial and non-glacial parts of the Suiattle River Basin are unknown. Given that sediment loads to main stem rivers may increase in response to accelerated glacial melting and changes in precipitation patterns associated with anticipated climate change (East and Sankey, 2020), documentation and analysis of the sediment loads from glacial and non-glacial sub-basins is necessary to better understand sediment regimes of mountain systems and their sensitivity to climate change.
To develop an understanding of stream sediment regimes in glaciated mountains, the U.S. Geological Survey (USGS), in cooperation with the Sauk-Suiattle Indian Tribe, conducted a study to characterize the relative suspended-sediment contributions of glacial and non-glacial sub-basins within the Suiattle River Basin. This project builds on a previous USGS study that quantified suspended sediment in the Sauk River and principal tributary rivers, the Suiattle and White Chuck Rivers (Jaeger and others, 2017). That study found that the Suiattle River accounts for almost 80 percent of the suspended-sediment load to the lower Sauk River (fig. 1).
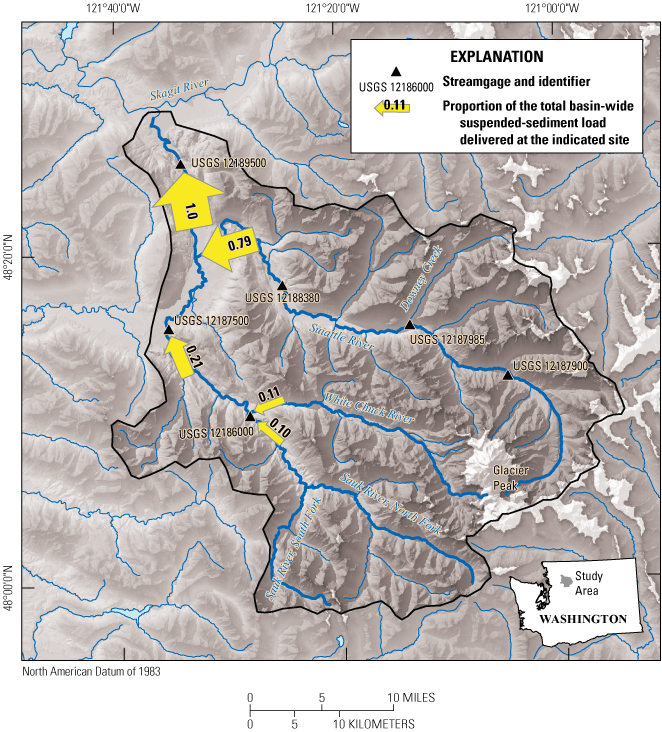
Sauk River Basin locations of the three streamgages in the Suiattle River Basin: U.S. Geological Survey (USGS) 12187900 (Upper Suiattle), USGS 12187985 (Downey Creek), and USGS 12188380 (Lower Suiattle), and one in the Sauk River Basin, USGS 12189500 (Lower Sauk). Values on the arrows indicate proportion of the total basin-wide suspended-sediment load delivered at the indicated site (Jaeger and others, 2017).
Purpose and Scope
The overall objective of this study was to characterize the relative suspended-sediment contributions of glacial and non-glacial sub-basins within the Suiattle River Basin. This project builds on a previous U.S. Geological Survey (USGS) study that quantified suspended sediment in the Sauk River and principal tributary rivers, the Suiattle and White Chuck Rivers (Jaeger and others, 2017). That study found that the Suiattle River accounts for almost 80 percent of the suspended-sediment load to the lower Sauk River (fig. 1).
In this report, we use discharge, sediment, and turbidity data collected at USGS streamgages to estimate suspended-sediment loads at sites on the upper and lower Suiattle River (USGS 12187900 and USGS 12188380, respectively), which both receive sediment from the eastern, glaciated flank of Glacier Peak, as well as at a site on Downey Creek (USGS 12187985), an unglaciated tributary that does not drain Glacier Peak. Turbidity monitoring in the lower Sauk River (USGS 12189500) during summer 2016, coupled with analyses presented in Jaeger and others (2017), allowed concurrent estimation of suspended-sediment load for the whole Sauk River watershed during that part of the study period when data were available. The total study period is from summer 2016 to the end of water year (WY) 2017 (October 1, 2016–September 30, 2017).
Description of Study Area
The primary study area for this work is the Suiattle River Basin, with a total drainage area of 890 km2. The Suiattle River enters the Sauk River about 21 river kilometers upstream from the Sauk-Skagit River confluence. The land is forested, and most of the basin is designated as wilderness and in U.S. Forest Service ownership. Most of the Suiattle River Basin, and most of the contributing area to the lower Suiattle River gage site, lies east of the Straight Creek Fault, where the underlying geology is intrusive high-grade metamorphic rocks (Tabor and others, 2002; fig. 2). Tributaries flowing into the Suiattle River from the northern, unglaciated part of the basin are steep, with valley bottoms underlain by unconsolidated glacial drift. Glacier Peak is composed of Quaternary volcanics and lahars (volcanic debris flows) and hosts numerous glaciers. The eastern flank of Glacier Peak, which include the Chocolate and Dusty Glaciers and their associated proglacial streams, appear to be particularly geomorphically active (Slaughter, 2004). These headwaters flow from the proglacial regions of Glacier Peak as unstable, colluvial channels and ultimately converge as the Suiattle River, becoming a characteristic steep, coarse-bedded mountain channel with areas of exposed bedrock. The longitudinal profiles of the water-surface elevation for the Sauk River, Suiattle River, and Downey Creek show typical concave profiles of mountain channels, with steep headwater channels and generally decreasing channel gradients in the downstream direction (fig. 3). All data used to construct the longitudinal profiles were extracted from the 2015 and 2017 aerial lidar that is publicly available through the Washington State Department of Natural Resources (2022). The lower Suiattle River is notably steeper than the Sauk River near their confluence. Discharge in the lower Sauk River, which is representative of flow conditions in the Suiattle River, is bi-modal, characterized by high flows during fall-winter precipitation and spring snowmelt, and low summertime base flows that include glacial meltwater (fig. 4) (U.S. Geological Survey, 2021e). A more complete description of the Sauk River Basin, including climate conditions, hydrology, land cover, geology, and channel morphology, are presented in Jaeger and others (2017).
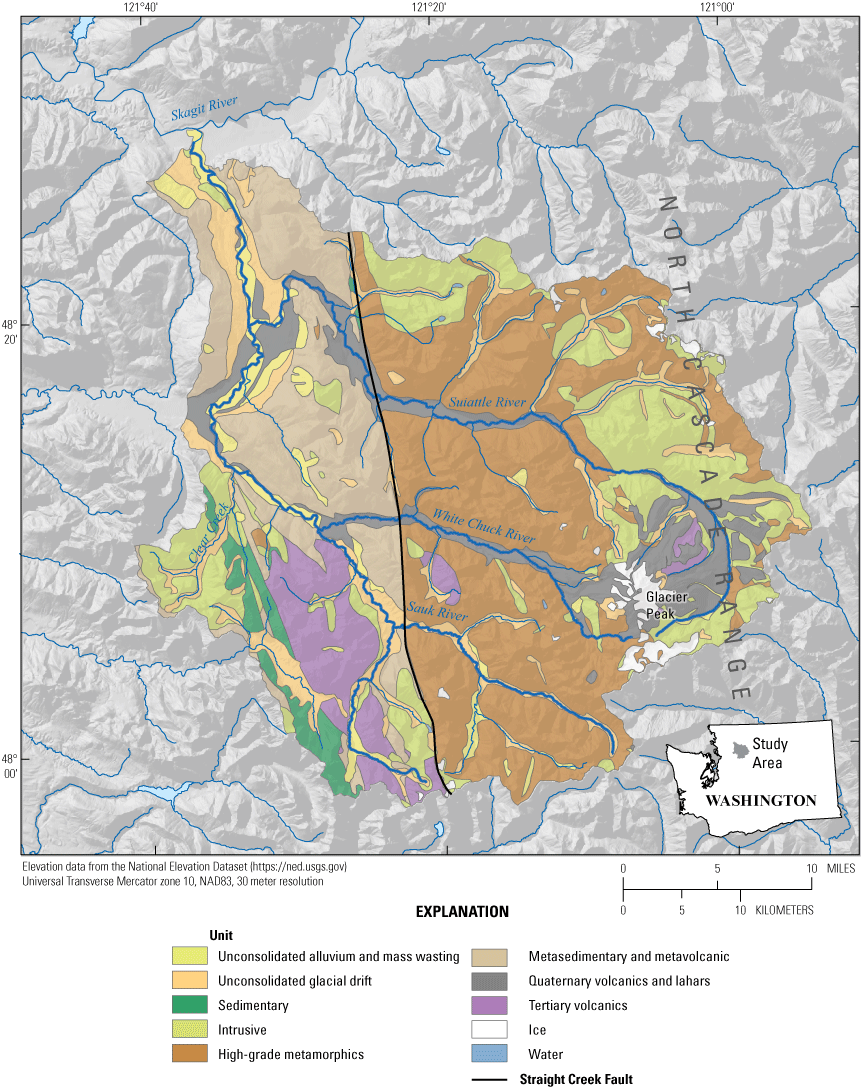
Surficial geology for the Sauk River Basin. [Figure modified from figure 2 from Jaeger and others, 2017.]
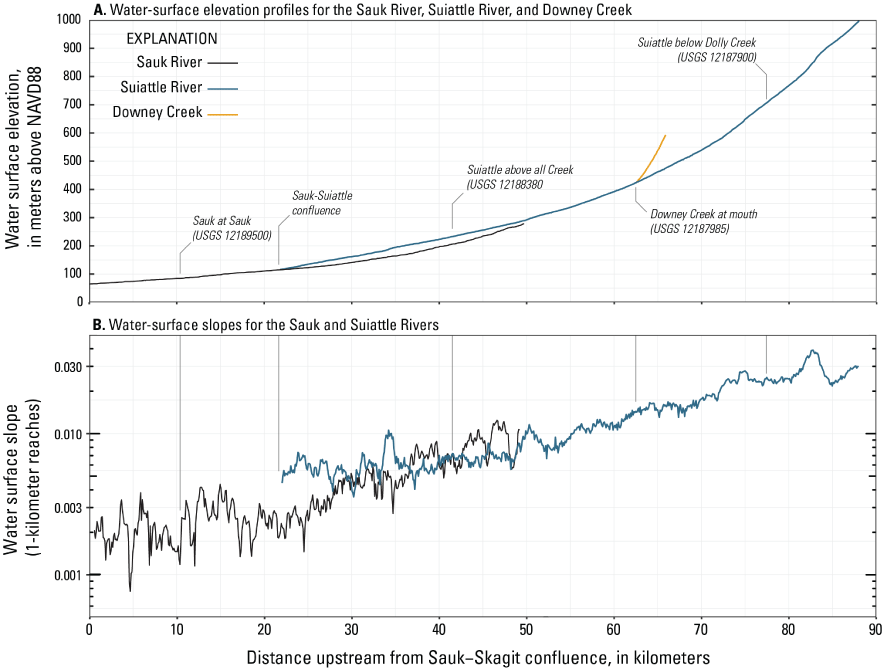
Elevation of the water-surface profiles of the Sauk River to its confluence of White Chuck River, Suiattle River, and Downey Creek (A); and water-surface slope (semi-log scale) of the Sauk River that lies upstream into the Suiattle River (B). [Figure derived from Washington State Department of Natural Resources, 2022.]
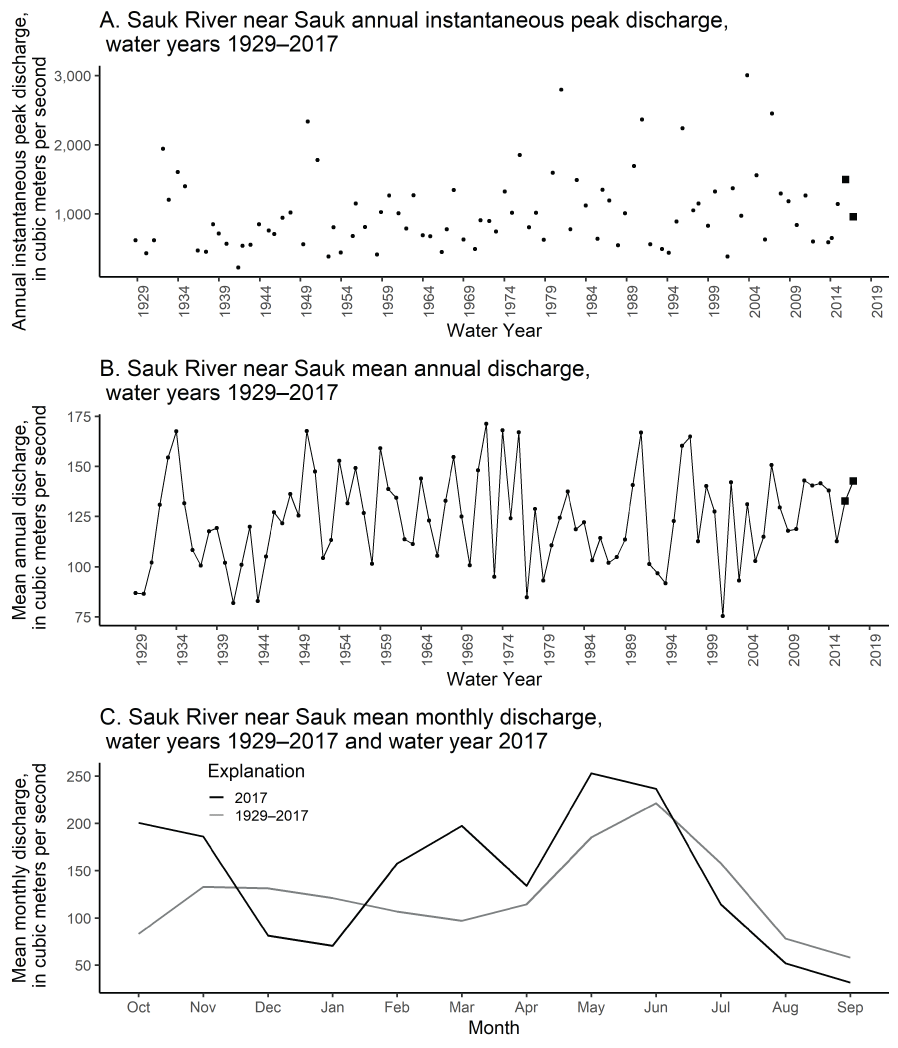
Annual instantaneous peak discharge for period of record (A), mean annual discharge for period of record (B), and mean monthly discharge for period of record and water year 2017 (C) for U.S. Geological Survey streamgage Sauk River near Sauk (12189500), water years 1929–2017 (U.S. Geological Survey, 2021d).
Study Sites and Discharge Conditions for Study Period
Continuous records of water stage, from which discharge is calculated on the basis of a stage-discharge relation, were collected at two USGS streamgages on the Suiattle River (U.S. Geological Survey, 2021b, c) and one USGS gage on the tributary, Downey Creek (U.S. Geological Survey, 2021d). Discharge at these gages was compared to discharge at a long-term USGS gage downstream on the lower Sauk River (U.S. Geological Survey, 2021e). The locations of the streamgages are shown in figure 1, and the periods of operation for each streamgage are in table 1. For ease of discussion in this report, the USGS streamgages on the Suiattle and Sauk Rivers are referenced in terms of the relative location of each streamgage along the river—Suiattle River below Dolly Creek (12187900, Upper Suiattle), Suiattle River above All Creek near Darrington (12188380, Lower Suiattle), and Sauk River near Sauk (12189500, Lower Sauk (table 1). Figure 5 shows the discharge for all four sites over the study period. The discharge hydrographs for all streamgages were well correlated (Pearson’s r greater than 0.87 among the four streamgages for overlapping periods). Correlations were lowest (0.87) between Downey Creek and both the lower Sauk River and the lower Suiattle River.
Table 1.
Description of the four U.S. Geological Survey (USGS) streamgages for the study period, May 2016–September 2017.[Abbreviation: km2, square kilometer]
The primary study period extended from May 2016 to the end of WY 2017. The long-term discharge record (1929–2017) at the lower Sauk River was used to describe how conditions over that time compare to conditions during the study period. Mean daily discharge for WY 2017 was approximately 15 percent greater than that for the period of record (143 cubic meters per second [m3/s] versus 124 m3/s) although monthly discharges for the study period were greater in the late winter and early spring until June, with lower snowmelt and summer base flows relative to the longer period of record (fig. 4C). The annual peak of WY 2017 (955 m3/s) that took place on October 20, 2016, was 93 percent of the average annual peak of 1,025 m3/s for the period of record. The annual peak for WY 2016 (1,495 m3/s) took place on November 17, 2015, prior to the start of this study. Annual peaks generally occur during the late fall-winter season. The cumulative discharge volume for the spring/summer 2016 period was approximately 70 percent of the long-term average, whereas the cumulative discharge volume for the 2017 spring/summer period was approximately equivalent (98 percent) to the long-term average.
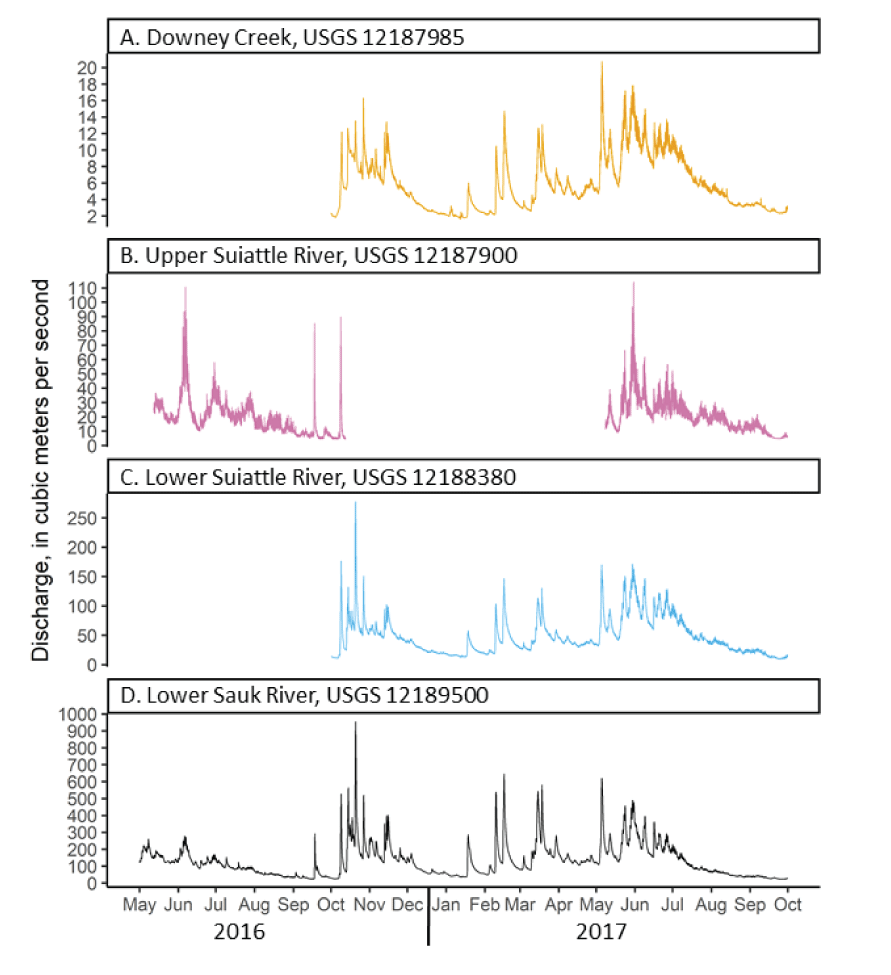
Time-series graphs showing 15-min discharge at the four U.S. Geological Survey (USGS) streamgages that include Downey Creek, the upper and lower sections of the Suiattle River, and the lower Sauk River, May 2016–September 2017 (U.S. Geological Survey, 2021b–e). Downy Creek flows into Suiattle River between the upper and lower Suiattle River streamgages.
Study Methods
Suspended-sediment loads (SSL) were estimated by developing simple linear regression models between continuously monitored turbidity or discharge data and suspended-sediment concentrations (SSC) measured in discrete samples (table 2; fig. 6). These regressions then allowed for continuous estimation of SSC and SSL over the available period of recorded turbidity and discharge per Rasmussen and others (2009). Study site instrumentation, data collection, data analysis, and calculation methods are presented in Senter and others (2020) and summarized here. Discharge, turbidity, and SSC samples are archived in the National Water Information System (U.S. Geological Survey, 2021a); the sediment sample data are summarized in Senter and others (2020).
Table 2.
Summary of 15-minute turbidity values measured at the four U.S. Geological Survey (USGS) streamgages for the study period, May 2016–September 2017.[Late corresponds to late summer (August–September); early corresponds to spring/early summer for the Upper Suiattle (May–July) and fall, winter, spring, and early summer Abbreviation: FNU, Formazin Nephelometric Units]
Turbidity was used as the primary surrogate for SSC, although discharge was used (via the regression equations) as a secondary surrogate to fill in data gaps for individual days when turbidity data were not available (Senter and others, 2020). A maximum turbidity value of 1600 Formazin Nephelometric Units, the maximum value measurable by the turbidimeter, was applied to any turbidity readings at the two Suiattle River gages and the Sauk River gage that exceeded this maximum value (table 2). Constraining high turbidity values to 1600 FNU does not affect regressions between SSC and turbidity, but it underestimates suspended-sediment loads.
Regressions between surrogates and SSC were fit using power laws, estimated through ordinary least-squares regressions on log base 10-transformed variables. At Downey Creek, linear regressions on untransformed data were used to define surrogate-SSC regressions (table 3). Regressions were fit for both total SSC and fine SSC (the suspended sediment for material finer than 0.063 millimeters in diameter). Fine-grained suspended sediment that does not include coarse sand is of interest as a water-quality factor. In addition, regressions between turbidity and fine SSC tends to have higher R2 compared to SSC that also includes sand-sized particles and therefore suspended-sediment load estimates may be considered to have less certainty. Regression models, residual plots, values for statistics and metrics, and model-calibration datasets can be found for USGS streamgages 12187900 (Upper Suiattle), 12187985 (Downey Creek), and 12188380 (Lower Suiattle) in Senter and others (2020) and for USGS gaging station 12189500 (Lower Sauk) in Jaeger and others (2017).
Table 3.
Models used to estimate suspended-sediment concentration from turbidity and discharge at the four U.S. Geological Survey (USGS) streamgages for the study period May 2017–September 2017.[Separate models for Upper Suiattle monitoring site, operated only during the spring and summer season, corresponds to an early season for data collected May–July and a late season for data collected August–early October. Abbreviations: bcf, bias correction factor; n, number of observations; adjR2, adjusted coefficient of determination; SSC, suspended-sediment concentration, in milligrams per liter; SSCf, fine portion of suspended-sediment concentration less than 0.063 mm, in milligrams per liter; Tu, turbidity, in Formazin Nephelometric Units; Q, discharge, in cubic meters per second]
Published in Senter and others (2020).
Published in Jaeger and others (2017), model 3.1, table 6 in that report. Bias correction factor is included in SSC regression for USGS 12189500 but is accounted for in all other regression equations.
For the upstream Suiattle River gage, which was operated only during the late spring and summer season, the regressions between SSC and discharge were divided into early season and late season periods. Early season corresponds to data collected between May 1 and August 1, and late season corresponds to data collected after August 1 and extending to early October (table 3; fig. 6). Differences in the SSC-discharge relations between the two seasons are visually evident in the scatter plots for the upper Suiattle River (figs. 6C, 6D) but are not apparent for Downey Creek (fig. 6F). Differences in SSC-discharge relations are a result of elevated concentrations of suspended sediment per unit discharge in the late season attributed to later summer melting of ice in the proglacial zones, and which was observed within the greater Sauk River Basin (Jaeger and others, 2017).
Regressions between SSC and turbidity or discharge were then used to compute the daily SSL passing each of the streamgages during the study period. Suspended-sediment load estimates were computed for the lower Suiattle River gage based on interpolated turbidity values during two low-flow, low-turbidity periods from October 28 to November 1, 2016, and from April 20 to 27, 2017. Computational methods are detailed in Senter and others (2020). This report summarizes suspended-sediment loads for the summer 2016 and 2017 seasons and full water year 2017 based on the extent of the data record.
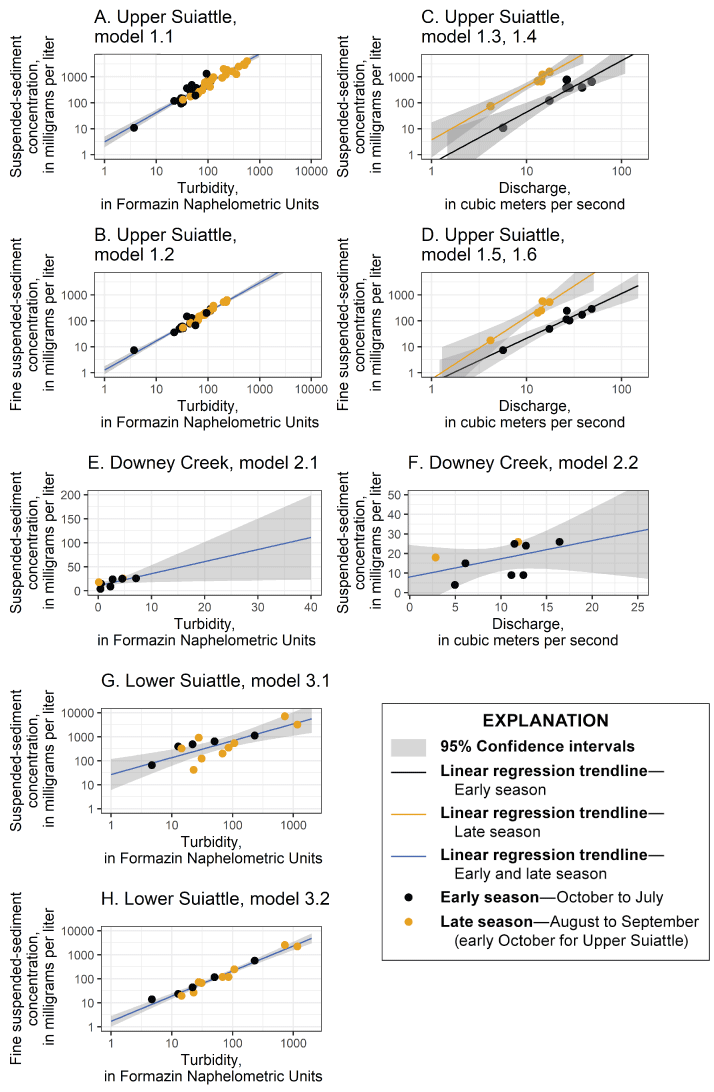
Suspended-sediment concentration and fine suspended-sediment concentration in milligrams per liter as a function of turbidity in Formazin Naphelometric Units or discharge in cubic meters per second at U.S. Geological Survey streamgages Downey Creek and the upper and lower sections of the Suiattle River. Trendlines and shaded confidence intervals extend to include range of turbidity and discharge values measured. Model numbers correspond to linear regression model equations reported in table 3.
Estimates of Turbidity, Suspended-Sediment Load, and Sediment Yield
Estimates of discharge, turbidity, and cumulative suspended-sediment loads are shown for the summers of 2016 and 2017 in figure 7, and for water year 2017 in figure 8. High turbidity/low discharge conditions beginning in late July 2016 at the upper Suiattle River gage and in 2017 at the lower Suiattle River gage, reflect the late summer glacial melt period and are consistent with conditions that have been observed in the greater Sauk River Basin (Jaeger and others, 2017). Average turbidity values at the upper Suiattle River gage are more than double the average values at the downstream lower Suiattle River gage for the late summer glacial melt period (table 2, fig. 7B). Comparisons between the two Suiattle River streamgages for other times of the year are limited by the absence of data earlier than May and after early October for the upper Suiattle River gage. A “first flush” of fines accumulated during the summer, resulting in high turbidity values, is observed in late September 2017 at the lower Suiattle River gage and corresponds with the start of the fall and winter flood season (fig. 7B). Conversely, turbidity values remain less than 10 FNU at Downey Creek throughout the summer period; increases in turbidity happened during spring rain/snowmelt peaks in May and June and during fall and winter floods. However, turbidity values at Downey Creek remain two orders of magnitude smaller than turbidity values at either of the Suiattle River gages (figs. 7B, 8B). Contributions of sediment by low turbidity tributaries like Downey Creek likely create a dilution effect in the Suiattle River, resulting in lower turbidity values in the lower Suiattle River relative to the upper Suiattle River.
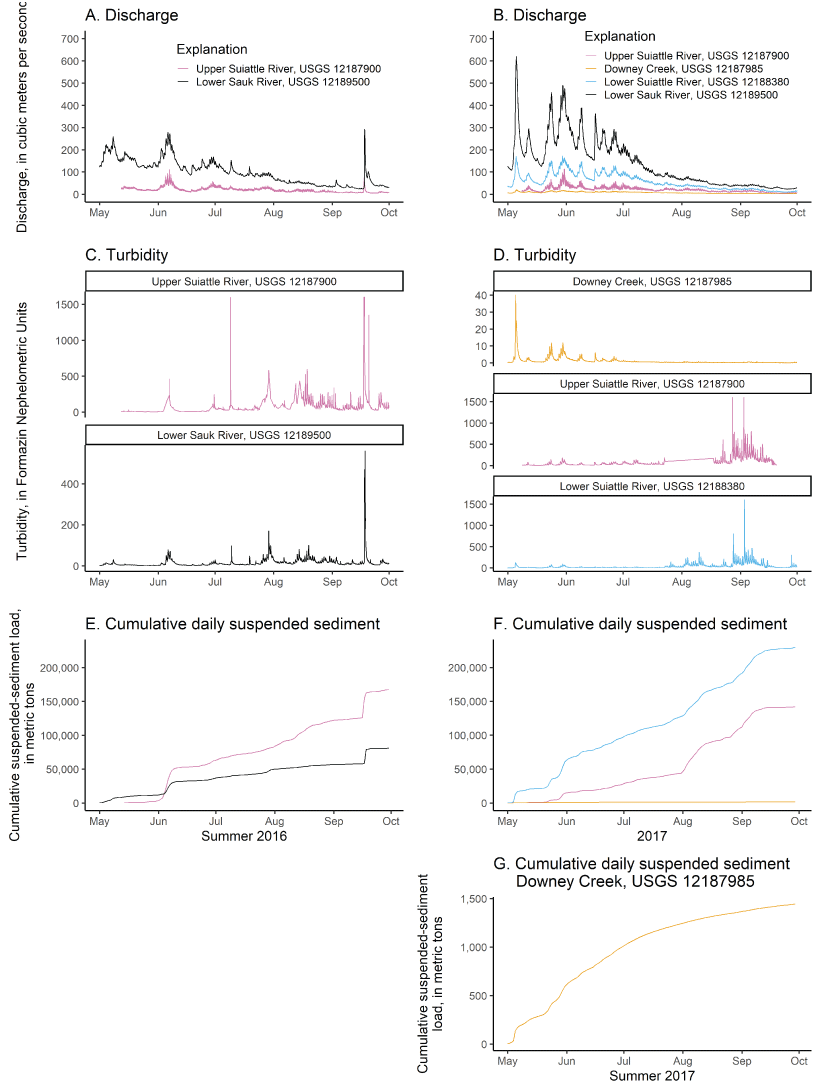
15-minute interval discharge (A), 15-minute interval turbidity (B), and cumulative daily suspended-sediment loads (C) at the four U.S. Geological Survey (USGS) streamgages, May 2016–September 2016 and May 2017–September 2017.
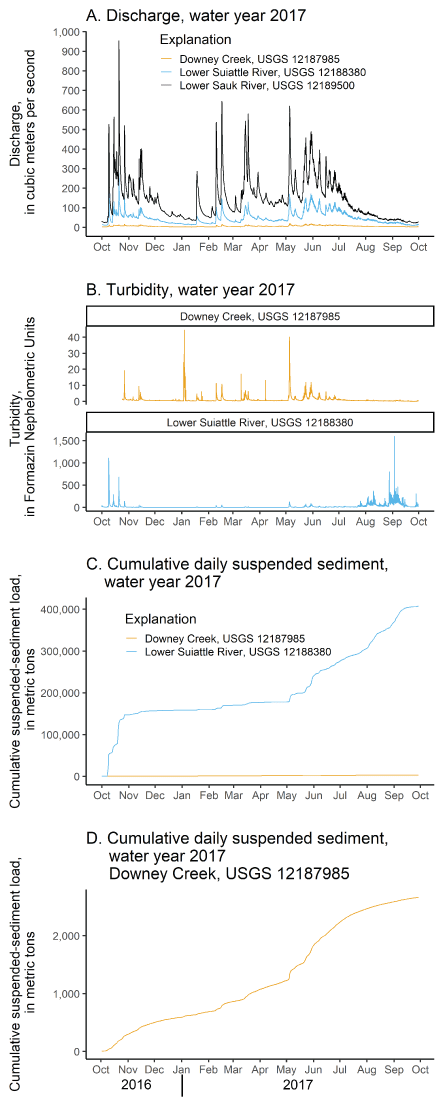
15-minute interval discharge (A), 15-minute interval turbidity (B), and cumulative daily suspended-sediment loads (C) at U.S. Geological Survey (USGS) streamgages Downey Creek and the lower Suiattle River, water year 2017.
During the summer of 2017, suspended sediment passing the upstream Suiattle River gage provided approximately 62 percent of suspended-sediment load at the downstream Suiattle River gage, while Downey Creek provided 0.6 percent of the load (table 4; fig. 9). Over the full 2017 water year, Downey Creek continued to contribute approximately 0.6 percent of the suspended-sediment load in the lower Suiattle River. While one individual year is a very short study period, given the episodic nature of sediment delivery in headwater systems (Gomi and others, 2002; May and Gresswell, 2003), the low relative contribution of suspended sediment from Downey Creek is consistent with the expectation that Glacier Peak is a dominant contemporary source of suspended sediment.
Table 4.
Estimates of suspended-sediment load at the four U.S. Geological Survey (USGS) streamgages for summer 2016, summer 2017, and water year 2017.[All values are in metric tons. Abbreviation: na, not available]
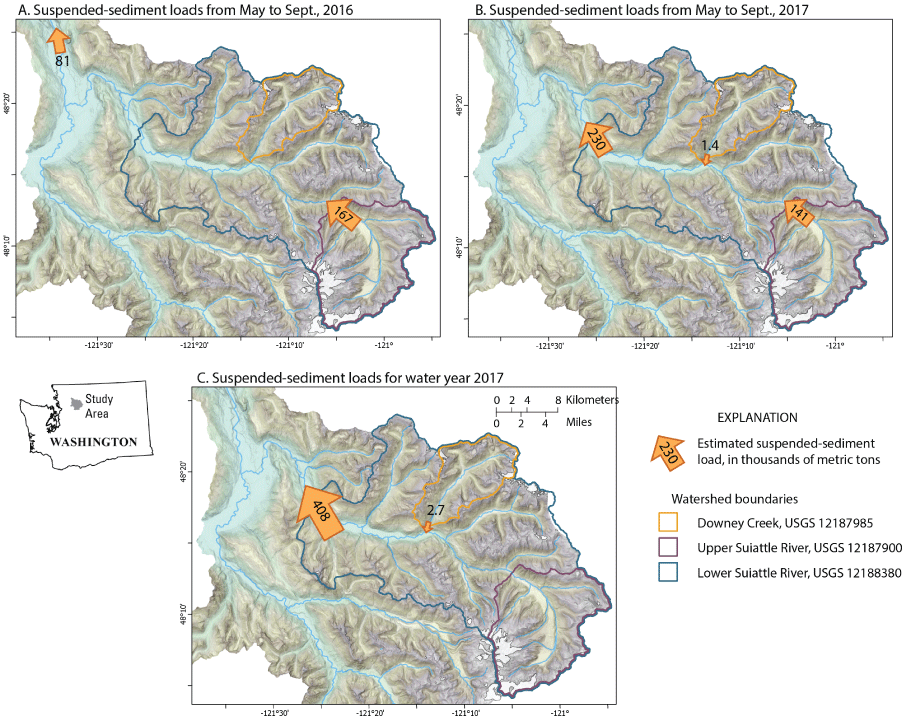
Estimates of suspended-sediment load in the Suiattle River Basin and lower Sauk River with sub-watershed boundaries for the upper Suiattle River and Downey Creek.
In the summer of 2016, suspended-sediment loads at the upstream Suiattle River gage were more than double the load at the downstream Sauk River gage (figs. 7, 9; table 4). We interpret this imbalance between the upper Suiattle River and lower Sauk River loads as an indication that suspended sediment was deposited and temporarily stored between the gages over this summer period. In the summer of 2017, sediment loads at the lower Suiattle River were approximately 1.6 times greater than that at the upper Suiattle River, indicating that summer flows were competent to move delivered suspended sediment at least to the lower Suiattle River location; deposition may then be more concentrated in the lower Suiattle and lower Sauk Rivers. Given that only the one full summer of 2016 of direct observations identifies this imbalance, it is not possible to say with certainty whether this imbalance is a persistent characteristic of suspended-sediment transport in the system. However, the progressive winnowing of suspended sediment deposited during summer months by fall and winter floods provides a plausible explanation for observations that in the lower Sauk River, suspended-sediment concentrations at a given discharge are typically higher early in the flood season and progressively decline through winter and spring (Jaeger and others, 2017; figure 21A). Annual sediment loads in the lower Sauk River are typically between 300,000 and 3,000,000 metric tons (Jaeger and others, 2017), therefore the imbalance observed in summer 2016 (around 160,000 metric tons) is modest in comparison to the likely total annual load. Suspended-sediment load at the upper Suiattle River was higher in summer 2016 compared to that in summer 2017 as a result of an early fall high-flow event in September 2016 (fig. 7).
Over the 2017 water year, annual suspended-sediment yield (annual SSL divided by drainage area) for the lower Suiattle River gage was about 560 metric tons per square kilometer per year (t/km2/yr) (table 5). This is comparable to indirect estimates of suspended-sediment yield for the entire Suiattle River watershed derived using a mass-balance approach (Jaeger and others, 2017), which averaged 680 t/km2/yr over the 2012–16 study period; annual yields in WY 2012–15 ranged from 280 to 430 t/km2, while the yield in WY 2016 was approximately 1,900 t/km2. We attribute the high yield in WY 2016, at least in part, to a series of summer 2015 debris flows in the upper reaches of the Suiattle River. The direct estimate of the WY 2017 yield presented here is roughly similar to the indirect yield estimates for the period 2012–15. Evaluating recovery to pre-debris flow conditions, however, would require a more robust analysis that controls for transport capacity, specifically flood hydrology, to evaluate changes in relative sediment availability from debris-flow delivery processes. Differences in discharge conditions between the years limit our ability to control for transport capacity and therefore limits inference on recovery to pre-debris-flow conditions.
Table 5.
Estimates of suspended-sediment yield at three U.S. Geological Survey (USGS) streamgages for summer 2016, summer 2017, and water year 2017.[All values are in metric tons per square kilometer per year]
The imbalance in SSL between the upper Suiattle River and the lower Sauk River in summer 2016 may reflect temporarily elevated levels of sediment associated with the debris flows that is transiting out of the upper Suiattle River Basin in the summer, but not arriving to the lower Sauk River until the winter flood season. In years not immediately following debris flows, SSL in the upper Suiattle River and lower Sauk River may be more nearly equivalent, although more data are needed to evaluate this hypothesis.
Sediment yield for Downey Creek was 29 t/km2/yr for the 2017 water year (table 5). This estimate is an order of magnitude lower than the estimate of 240 t/km2/yr for the upper Sauk River Basin reported in Jaeger and others (2017), which represents a largely unglaciated headwater region of the Sauk River Basin south of, and separate from, Glacier Peak (fig. 1). More data are necessary to determine underlying factors for the apparent large differences in sediment yield in different unglaciated portions of the basin, which could be a consequence of differences in geology and history of geomorphic disturbance.
Summary
This study developed estimates of suspended-sediment load for summer 2016, summer 2017, and water year 2017 from two sites on the Suiattle River in the Cascade Range, Washington. The river receives sediment from the eastern glaciated flank of Glacier Peak, and from Downey Creek, an unglaciated tributary that does not drain any part of the peak. The estimates of suspended-sediment load for the upper Suiattle River were compared to loads at Downey Creek, at the lower Suiattle River, and at the lower Sauk River, downstream from the Suiattle-Sauk River confluence. Principal findings of the study include the following:
-
The relatively low contribution of suspended sediment from Downey Creek (less than 1 percent of the suspended-sediment load at the lower Suiattle River site) is consistent with the expectation that Glacier Peak is a dominant contemporary suspended-sediment source compared to unglaciated portions of the basin. The cumulative suspended-sediment load from the upper Suiattle River Basin for the spring/summer 2017 period was approximately 142,000 tons, which constitutes approximately 62 percent of the suspended-sediment load delivered to the lower Suiattle River.
-
Higher suspended-sediment loads at the upper Suiattle River streamgage compared to those at Downey Creek most likely reflect a combination of glacial and geomorphic processes that are unique to streams draining Glacier Peak and are distinct from processes occurring at Downey Creek. Specifically, glacial melt processes remobilize debris flows, and the attrition of colluvial and fluvial material in the upper Suiattle River transform sediment traveling as bedload to traveling in suspension.
-
Higher summertime suspended-sediment loads, approximately double, in the upper Suiattle River compared to loads in the lower Sauk River main stem are interpreted as previously suspended sediment being temporarily stored along the riverbed during summer base flows. This sediment is then remobilized during larger fall and winter flows for potential delivery to the lower Sauk River. It is not clear if the imbalance in loads between the upper Suiattle River and lower Sauk River can be attributed to excess sediment associated from debris flows in the upper Suiattle River or persists across years.
-
The estimates of sediment yield for Downey Creek are an order of magnitude lower than estimates for the upper Sauk River, which represents another unglaciated portion of the Sauk River Basin with different underlying lithology and likely geomorphic disturbance history than Downey Creek.
-
More data are needed beyond this approximately one-year dataset to develop longer-term estimates of suspended-sediment load and yields.
Acknowledgments
This study was completed with the technical support of several technicians from the Sauk-Suiattle Indian Tribe, James Foreman, Katie Reams, Andrew Spanjer, Chad Opatz from the U.S. Geological Survey.
References Cited
Czuba, J.A., Magirl, C.S., Czuba, C.R., Grossman, E.E., Curran, C.A., Gendaszek, A.S., and Dinicola, R.S., 2011, Sediment load from major rivers into Puget Sound and its adjacent waters: U.S. Geological Survey Fact Sheet 2011–3082, 4 p., accessed November 2, 2021, at https://pubs.usgs.gov/fs/2011/3083/.
East, A.E. and Sankey, J.B., 2020. Geomorphic and sedimentary effects of modern climate change: current and anticipated future conditions in the western United States: Reviews of Geophysics, v. 58, no. 4, 59 p., accessed November 2, 2021, at https://doi.org/10.1029/2019RG000692.
Gomi, T., Sidle, R.C., and Richardson, J.S., 2002, Understanding processes and downstream linkages of headwater systems—Headwaters differ from downstream reaches by their close coupling to hillslope processes, more temporal and spatial variation, and their need for different means of protection from land use: Bioscience, v. 52, no. 10, p. 905–916.
Jaeger, K.L., Curran, C.A., Anderson, S.W., Morris, S.T., Moran, P.W., and Reams, K.A., 2017, Suspended sediment, turbidity, and stream water temperature in the Sauk River Basin, Washington, water years 2012–16: U.S. Geological Survey Scientific Investigations Report 2017–5113, 47 p. [Also available at https://doi.org/10.3133/sir20175113.]
Rasmussen, P.P., Gray, J.R., Glysson, G.D., and Ziegler, A.C., 2009, Guidelines and procedures for computing time-series suspended-sediment concentrations and loads from in-stream turbidity-sensor and discharge data: U.S. Geological Survey Techniques and Methods book 3, chap. C4, 53 p. [Also available at https://pubs.usgs.gov/tm/tm3c4/.]
Senter, C.A., Jaeger, K.L., Morris, S.T., Anderson, S.W., and Curran, C.A., 2020, Suspended sediment and water temperature data in the Suiattle River and the Downey Creek Tributary, Washington for select time periods over 2013–2017 (ver. 2.0, October 2021): U.S. Geological Survey data release, https://doi.org/10.5066/P9W74K0K.
U.S. Geological Survey, 2021a, USGS water data for the nation: U.S. Geological Survey National Water Information System database, accessed August 26, 2021, at https://waterdata.usgs.gov/nwis/.
U.S. Geological Survey, 2021b, USGS 12187900 Suiattle River below Dolly Creek near Darrington WA, in USGS water for the Nation: U.S. Geological Survey Water Information System database, accessed November 2, 2021, at https://doi.org/10.5066/F7P55KJN. [Site information directly accessible at https://waterdata.usgs.gov/nwis/dv?referred_module+sw&site_no=12187900.]
U.S. Geological Survey, 2021c, USGS 12188380 Suiattle River above All Creek near Darrington WA, in USGS water for the Nation: U.S. Geological Survey Water Information System database, accessed November 2, 2021, at https://doi.org/10.5066/F7P55KJN. [Site information directly accessible at https://waterdata.usgs.gov/nwis/dv?referred_module+sw&site_no=12188380.]
U.S. Geological Survey, 2021d, USGS 12187985 Downey Creek at Mouth near Darrington WA, in USGS water for the Nation: U.S. Geological Survey Water Information System database, accessed November 2, 2021, at https://doi.org/10.5066/F7P55KJN. [Site information directly accessible at https://waterdata.usgs.gov/nwis/dv?referred_module+sw&site_no=12187985.]
U.S. Geological Survey, 2021e, USGS 12189500 Sauk River near Sauk WA, in USGS water for the Nation: U.S. Geological Survey Water Information System database, accessed November 2, 2021, at https://doi.org/10.5066/F7P55KJN. [Site information directly accessible at https://waterdata.usgs.gov/nwis/dv?referred_module+sw&site_no=12189500.]
Washington State Department of Natural Resources, 2022, Washington lidar portal: Washington State Division of Natural Resources website, accessed October 1, 2021, at https://lidarportal.dnr.wa.gov.
Conversion Factors
International System of Units to U.S. customary units
Datums
Vertical coordinate information is referenced to the North American Vertical Datum of 1988 (NAVD 88).
Horizontal coordinate information is referenced to the North American Datum of 1983 (NAD 83).
Elevation, as used in this report, refers to distance above the vertical datum.
Publishing support provided by the U.S. Geological Survey
Science Publishing Network, Tacoma Publishing Service Center
For more information concerning the research in this report, contact the
Director, Washington Water Science Center
U.S. Geological Survey
934 Broadway, Suite 300
Tacoma, Washington 98402
Suggested Citation
Jaeger, K.L., Anderson, S.W., Senter, C.A., Curran, C.A., and Morris, S., 2022, Relative contributions of suspended sediment between the upper Suiattle River Basin and a non-glacial tributary, Washington, May 2016–September 2017: U.S. Geological Survey Open-File Report 2022–1056, 18 p., https://doi.org/10.3133/ofr20221056.
ISSN: 2331-1258 (online)
Study Area
| Publication type | Report |
|---|---|
| Publication Subtype | USGS Numbered Series |
| Title | Relative contributions of suspended sediment between the upper Suiattle River Basin and a non-glacial tributary, Washington, May 2016–September 2017 |
| Series title | Open-File Report |
| Series number | 2022-1056 |
| DOI | 10.3133/ofr20221056 |
| Year Published | 2022 |
| Language | English |
| Publisher | U.S. Geological Survey |
| Publisher location | Reston, VA |
| Contributing office(s) | Washington Water Science Center |
| Description | v, 18 p. |
| Country | United States |
| State | Washington |
| Other Geospatial | Upper Suiattle River Basin |
| Online Only (Y/N) | Y |
| Google Analytic Metrics | Metrics page |