

Groundwater Quality of the Lucerne Valley Groundwater Basin, California
Links
- Document: Report (3 MB pdf) , HTML , XML
- Related Work: Scientific Investigations Report 2022-5048 - Hydrogeology and Simulation of Groundwater Flow in the Lucerne Valley Groundwater Basin, California
- Download citation as: RIS | Dublin Core
Acknowledgments
The author would like to express gratitude to the many organizations and individuals who supplied data or contributed to the completion of this study and report. This project could not have been completed without the continued support, technical input, and collaboration provided by the Mojave Water Agency. U.S. Geological Survey illustrator Donna Knifong greatly improved the quality of the figures in the report. Field technicians Greg Smith and Dennis Clark were instrumental in the collection and processing of water samples collected in 2021 for this study. Finally, a debt of gratitude is owed to the authors and field investigators who contributed to the previous investigations in the Lucerne Valley.
Abstract
Anthropogenic activities, including groundwater withdrawals, return flow from irrigated agriculture, and treated wastewater-effluent disposal have the potential to affect groundwater quality in the Lucerne Valley groundwater basin, located in the southwest Mojave Desert. Questions regarding the current state and potential future of groundwater quality in this basin were addressed by (1) considering groundwater data from and findings of historical water-quality studies, (2) evaluating recent (1990–2021) U.S. Geological Survey water-quality and geochemical-tracer data, and (3) assessing groundwater-quality results from samples collected in 2021 to better understand the transport of applied treated wastewater effluent in the subsurface and associated effects of this practice on water quality. As observed by previous studies, differences in groundwater quality existed among the upper, middle, and lower aquifers of the Lucerne Valley groundwater basin, with the lower aquifer characterized by high dissolved-solid content relative to the middle and upper aquifers. Stable and radioisotope tracers indicate that most of the groundwater sampled in the basin was recharged during cooler, wetter climate conditions than those of the present day (2022). Analyses of the 2021 samples collected to examine the subsurface transport of applied treated wastewater effluent were not conclusive but indicate that water from applied treated wastewater effluent is currently (2022) limited to the upper aquifer and likely to remain so given the extensive confining unit below the upper aquifer.
Introduction
The Lucerne Valley is in the southwestern part of the Mojave Desert, about 75 miles (mi) northeast of Los Angeles, California (fig. 1). Lucerne Valley is roughly bounded by the Helendale Fault to the west, the San Bernardino Mountains to the south, and smaller mountain ranges including the Granite Mountains, Ord Mountains, and Cougar Buttes to the north and east. As is the case with many desert regions, the history of the Lucerne Valley is closely linked to the presence and development of its groundwater resources. Flowing artesian groundwater springs made the area an excellent stopover for Native Americans traveling to the San Bernardino Mountains to gather pinion nuts (Owen, 1988). In the late 19th century, settlers arrived and began to use these springs and associated abundant shallow groundwater resources for irrigated agriculture. Alfalfa, also known as lucerne, was the favored crop of early farmers, and became the valley’s namesake. Groundwater was pumped for irrigated agriculture in excess of natural recharge in the Lucerne Valley throughout the early and middle 20th century, resulting in previously flowing springs becoming dry and large decreases in water-table altitudes, with observed declines up to 100 feet (ft; Schaefer, 1979) and later associated land subsidence (Sneed and others, 2003; Brandt and Sneed, 2017). Beginning in 1980, treated wastewater effluent from Big Bear Area Regional Wastewater Agency (BBARWA), located in the San Bernardino Mountains to the south, has been transported to Lucerne Valley for disposal through irrigation and infiltration ponds (fig. 1).
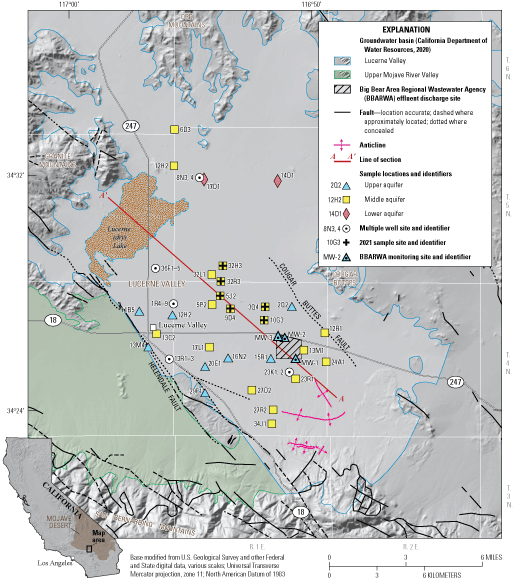
Overview of the Lucerne Valley groundwater basin. Aquifer designations for sample locations are based on the hydrogeologic framework of Stamos and others (2022). Site information for U.S. Geological Survey sites can be found in the U.S, Geological Survey (USGS) National Water Information System (NWIS; https://waterdata.usgs.gov; U.S. Geological Survey, 2022). Site information for Big Bear Area Regional Wastewater Agency monitoring wells was acquired from California Regional Water Quality Control Board, Colorado River Basin Region (2021), available at https://www.waterboards.ca.gov/coloradoriver/board_decisions/tentative_orders/docs/2021/2021_0023bigbear_wdr.pdf.
Present-day (2022) Lucerne Valley has a population of 5,331 (U.S. Census Bureau, 2020) and is still utilized primarily for agricultural purposes. Groundwater remains the dominant source of water for domestic, agricultural, and industrial purposes. Questions remain about how future stressors, including changes in land use and the potential loss of any recharge from BBARWA wastewater effluent discharge, may affect the long-term sustainability of water quality and quantity (Stamos and others, 2022). Therefore, the U.S. Geological Survey (USGS) began a study in cooperation with the Mojave Water Agency to better understand the quality of groundwater in Lucerne Valley and how the quality could change in response to future stressors.
Purpose and Scope
The purposes of this report are to (1) summarize the findings of previous studies of groundwater quality in Lucerne Valley; (2) present analyses of recent (post-1990) USGS water-quality data from the Lucerne Valley groundwater basin, with focus on water-quality parameters important to the assessment of water-quality degradation and tracing of water sources and relative ages; and (3) describe the results of a set of groundwater-quality samples collected by USGS in 2021 downgradient from the BBARWA discharge area in an effort to gain insight into the transport and effects on groundwater quality of this imported water in the subsurface. This report is intended to complement a USGS report on Lucerne Valley hydrogeology (Stamos and others, 2022), which includes an extensive discussion of the hydrogeologic framework of this region and a numerical groundwater-flow simulation.
Study Area Description
Unconsolidated deposits within the 230-square-mile (mi2) Lucerne Valley groundwater basin (California Department of Water Resources, 2020; fig. 1) are underlain and surrounded by consolidated bedrock. Land-surface altitude of the basin ranges from 4,500 ft above the North American Vertical Datum of 1988 (NAVD 88) to 2,850 ft at Lucerne (dry) Lake. Altitudes in the San Bernardino Mountains south of the basin exceed 11,000 ft. The climate of Lucerne Valley is typical of the high Mojave Desert region, with low humidity, high evaporation rates, large diurnal and seasonal temperature variations, and average annual precipitation less than 5 inches per year (in/yr). The Lucerne Valley groundwater basin does not contain perennial water sources, and recharge from present-day (2022) precipitation is likely negligible (Stamos and others, 2022). Natural recharge occurs primarily as intermittent infiltration of ephemeral washes in response to precipitation or snowmelt in the surrounding mountains. The estimated annual natural recharge rate for the Lucerne Valley groundwater basin from the California Basin Characterization Model (Flint and others, 2013) is 635 acre-feet per year (acre-ft/yr) for 1942–2016. Artificial recharge to the basin occurs in the form of BBARWA wastewater effluent imported into the Lucerne Valley from communities in the San Bernardino Mountains.
This study uses the hydrogeologic framework of Stamos and others (2022) as a basis for interpreting the Lucerne Valley groundwater quality. The Lucerne Valley groundwater basin is considered to contain four distinct units (fig. 2):
-
An upper aquifer (typically less than 200 ft thick) consisting of Quaternary alluvium derived from the San Bernardino Mountains,
-
A confining unit, consisting of lacustrine deposits associated with previous iterations of the Lucerne (dry) Lake,
-
A middle aquifer (ranging from 50 to 500 ft thick), consisting of Quaternary and Tertiary alluvial deposits derived from Mojave Desert sources to the north and east, and
-
A lower aquifer (up to 300 ft thick), consisting of Tertiary alluvial deposits derived from Mojave Desert sources to the north.
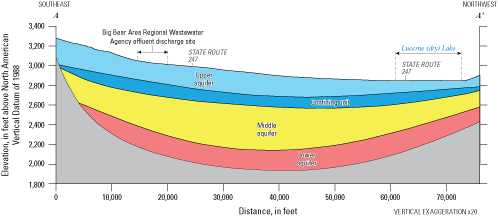
Conceptual hydrogeologic cross section of the southern portion of the Lucerne Valley groundwater basin modified from Stamos and others (2022). See figure 1 for location of section.
The total thickness of unconsolidated water-bearing units in the Lucerne Valley groundwater basin is about 1,000 ft at its deepest part. Groundwater flow is from the edges of the basin toward Lucerne (dry) Lake. The confining unit has created perched conditions in some areas, where the upper and middle aquifers are separated by an unsaturated interval. Of the three water-bearing units, the middle aquifer is primarily used for production purposes, with most of the pumping focused on the area immediately south and southeast of Lucerne (dry) Lake. Major faults in the groundwater basin include the Helendale Fault, which forms a part of the western boundary of the basin, and the Cougar Buttes Fault, in the southeast part of the basin. Both faults are interpreted as lateral impediments to groundwater flow based on differences in water levels in wells across the fault traces.
Previous Studies of Groundwater Quality in Lucerne Valley
Previous studies that include the evaluation of the Lucerne Valley groundwater quality have been either subsections of larger historical studies of groundwater occurrence and flow in the Lucerne Valley (Riley, 1956; California Department of Water Resources, 1967; Schaefer, 1979) or subsections of larger works that present groundwater-quality data across a larger area, often either with minimal analysis or focused on a specific subset of parameters (Christensen and Fields-Garland, 2001; Izbicki, 2004; Izbicki and Michel, 2004; Mojave Water Agency and California State University-Fullerton, 2005; Mathany and others, 2012; Metzger and others, 2015). Nevertheless, consideration of the datasets and findings of these studies can yield insight into the quality of Lucerne Valley groundwater.
Riley (1956) was one of the first studies to systematically study water quality in the Lucerne Valley groundwater basin, focusing on total dissolved solids (TDS) and major dissolved ion concentrations. Riley (1956) noted that groundwater quality was generally good south and northwest of Lucerne (dry) Lake, with TDS concentrations ranging from 200 to 500 milligrams per liter (mg/L), but marginal to very poor northeast of Lucerne (dry) Lake, with TDS concentrations ranging from 2,000 to 5,000 mg/L, primarily as sodium and chloride.
California Department of Water Resources (1967) collected some groundwater-quality data similar in scope to that of Riley (1956). In addition to confirming the same general trends in water quality as Riley (1956), the authors noted that groundwater of the magnesium bicarbonate-type in the southern part of the basin could be attributed to the presence of dolomitic rocks in the nearby San Bernardino Mountains.
Schaefer (1979) considered the different aquifer units in Lucerne Valley with respect to the interpretation of groundwater-quality data. Data collected from 1973 to 1975 indicated that groundwater underlying, and to the east of, Lucerne (dry) Lake was poor in quality, with TDS concentrations ranging from 1,200 to 7,000 mg/L. This finding was attributed to evaporative concentration, dissolution of older lakebed evaporite deposits, or both, and Schaefer (1979) noted that discernable movement of this poor-quality water had not been observed, but that the potential exists for future migration toward pumping centers. Schaefer (1979) also stated that the water quality in the upper aquifer (above the confining unit) had increasing TDS concentrations, averaging 2,700 mg/L in 1976, and that high-nitrate concentrations also were present in water from some wells in this aquifer, likely due to the infiltration of irrigation-return water.
More recent studies that included a broad range of water-quality parameters for the Lucerne Valley groundwater basin (Christensen and Fields-Garland, 2001; Mojave Water Agency and California State University-Fullerton, 2005; Mathany and others, 2012; Metzger and others, 2015) are descriptive rather than interpretive in nature and tend to confirm the findings of previous studies in terms of spatial distribution of water-quality parameters. Studies utilizing stable isotopes of water as a tracer of groundwater source and transport (Izbicki, 2004) and tritium and carbon-14 as tracers of groundwater age (Izbicki and Michel, 2004) indicate that groundwater in the basin farther from the base of the San Bernardino Mountains is likely very old and was recharged thousands of years ago during a different, wetter climate regime than that of the present day (2022). Correspondingly, these studies reported that modern, post-1952 recharge, as indicated by the presence of tritium and elevated carbon-14 activity, is confined to areas near the San Bernardino Mountains front and near the Helendale Fault. The prevalence of older groundwater and the small spatial footprint of recently recharged groundwater have implications for interpreting water-quality results presented in this study and determining the transport and fate of BBARWA effluent in this system.
Approach
The groundwater-quality data presented in this study were collected between 1990 and 2021, and the data and associated methodological information can be found in the USGS National Water Information System (NWIS; https://waterdata.usgs.gov; U.S. Geological Survey, 2022). Additionally, a substantial part of the water-quality data presented here can be visualized in an interactive map format (https://ca.water.usgs.gov/mojave/mojave-water-data.html) developed by Metzger and others (2015). The USGS sample site information can be found in appendix 1 of this report. Water-quality data for BBARWA effluent and monitoring wells proximal to the BBARWA effluent discharge site for the period 2016–20 were acquired from the California Regional Water Quality Control Board, Colorado River Basin Region (2021), available at https://www.waterboards.ca.gov/coloradoriver/board_decisions/tentative_orders/docs/2021/2021_0023bigbear_wdr.pdf.
In this study, water-quality parameters, including water-quality indicators, inorganic constituents, stable isotope tracers, and radioisotope tracers, were used to interpret groundwater quality, sources, and relative ages. Specific emphasis was placed on samples collected in 2021 used to determine the fate and transport of the BBARWA effluent. Water-quality parameters examined in this study included water-quality indicators (pH, dissolved oxygen, and TDS), inorganic constituents (chloride, nitrate, silica, fluoride, arsenic, boron, iron, manganese, and chromium), stable isotopic ratios of hydrogen and oxygen in water, and tritium activities.
The stable isotopic ratios of hydrogen and oxygen in water are used to interpret sources of groundwater recharge. These stable isotope ratios indicate the altitude, latitude, and temperature of precipitation and the extent of evaporation of the water in surface-water bodies or soils before infiltration into the aquifer (Coplen and others, 1999). These ratios are expressed in delta notation, which indicates the relative difference in the ratio of the uncommon and common stable isotopes of the element in the sample with those of a standard reference material in units of per mil. A characteristic relationship between delta deuterium and delta oxygen-18 has been observed in global precipitation and is known as the global meteoric water line (GMWL).
Tritium activities provide information about the age (time since recharge) of groundwater (Solomon and Cook, 1999). Tritium is a short-lived (half-life 12.32 years) radioactive isotope of hydrogen that is incorporated into the water molecule. Low levels of tritium are produced continuously by the interaction of cosmic radiation with the Earth’s atmosphere, and a large amount of tritium was produced as a result of atmospheric testing of nuclear weapons between 1952 and 1963. Thus, concentrations of tritium greater than those resulting from cosmic radiation levels generally indicate the presence of water recharged after the early 1950s.
Water-quality samples considered for this study were collected from USGS multiple-well sites containing short-screened (commonly 20 ft or less) observation wells in a single borehole (fig. 1) and longer screened wells designed to produce water for irrigation or domestic purposes. Observation wells at USGS multiple well sites are designed to draw groundwater from specific depths for the assessment of water levels and water quality, but longer-screened production wells are designed with the primary goal of producing greater quantities of water of sufficient quality for the intended use. As a result, longer-screened production wells may draw a mixture of water from different aquifers and tend to be biased toward units that yield the most and highest-quality water because production wells that produce water too poor to use are not economical to maintain in service. This potential bias in the longer-screened production wells sampled for this study needs to be considered when interpreting water-quality data from these sources.
Results and Discussion
Water-Quality Indicators and Inorganic Constituents
Water-quality indicator and inorganic-constituent results are shown in figure 3. The U.S. Environmental Protection Agency (EPA) Maximum Contaminant Levels (MCL) or Secondary Maximum Contaminant Levels (SMCL; U.S. Environmental Protection Agency, 2009) are provided on applicable plots for reference. Although these findings are largely consistent with the results of previous studies of the Lucerne Valley groundwater basin (Riley, 1956; California Department of Water Resources, 1967; Schaefer, 1979; Christensen and Fields-Garland, 2001; Mojave Water Agency and California State University-Fullerton, 2005; Mathany and others, 2012; Metzger and others, 2015), consideration of the data with respect to aquifer designation can be used to gain additional insight into the source and transport of dissolved species in this system.
The lower aquifer of the Lucerne Valley groundwater basin is typically not utilized for extraction by longer screened production wells because the groundwater within this aquifer tends to be unsuitable for most agricultural or domestic uses due to elevated TDS concentrations. Samples collected from the lower aquifer tended to have the highest pH and lowest dissolved-oxygen concentrations and were enriched in most dissolved solutes relative to samples collected from the middle and upper aquifers, with the exceptions of nitrate and silica (fig. 3). Groundwater of similarly high TDS concentrations reported by earlier studies underlying and east of Lucerne (dry) Lake (Riley, 1956; Schaefer, 1979) likely represent samples from the lower aquifer. The combination of water-quality parameter values observed in the lower aquifer is broadly consistent with long residence times (Alley, 1993). The concentrations of solutes such as chloride, fluoride, and boron tend to increase with the amount of time spent in contact with aquifer materials, whereas dissolved oxygen and nitrate concentrations may decrease through time because of consumption by biogeochemical reactions; concentrations of silica may decrease through time because of mineral precipitation reactions. Lower dissolved-oxygen concentrations detected in groundwater sampled from the lower aquifer may shift metal species such as iron and manganese to more soluble forms, resulting in increased concentrations of these constituents in groundwater (fig. 3). However, water within the lower aquifer is generally within oxic ranges (McMahon and Chapelle, 2008), and chromium concentrations in the lower aquifer up to 10 micrograms per liter (fig. 3) are likely the result of desorption of chromium from surface sorption sites on aquifer mineral grains at high pH values during oxic conditions with long contact times in older groundwater.
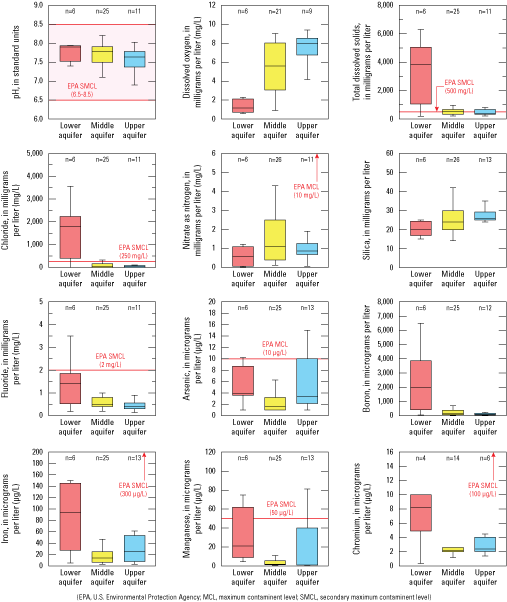
Box plots of water-quality parameters from Lucerne Valley groundwater basin lower, middle, and upper aquifers, 1990 to 2021; “n values” refer to the number of sample sites in the aquifer with data available for the given parameter. For sample sites with multiple samples collected for a given parameter, sample parameter values were averaged before inclusion in the box plots. These data can be found in the U.S. Geological Survey National Water Information System (NWIS; https://waterdata.usgs.gov; U.S. Geological Survey, 2022).
The Lucerne Valley groundwater basin middle aquifer has historically been, and remains, heavily utilized for production purposes. As described earlier, groundwater levels in the middle aquifer declined through most of the 20th century; some areas have shown slight recovery after groundwater pumping was decreased in the mid-1990s (Stamos and others, 2022). Samples collected from the middle aquifer indicate that it generally remains a viable water source for irrigation and domestic use (fig. 3), though a few samples collected near Lucerne (dry) Lake indicated high TDS and low dissolved-oxygen concentrations resembling those detected in the lower aquifer, and some other middle aquifer-samples contained elevated concentrations of nitrate, commonly characteristic of irrigation or septic-return influence. Because there are no low-permeability units separating the middle and lower aquifers, mixing at the interface may account for the middle-aquifer samples with higher TDS and lower dissolved-oxygen concentrations. Although elevated nitrate concentrations observed in some middle aquifer samples could have come from dissolution of natural evaporite deposits (Schaefer, 1979), they could be indicative of irrigation return or septic inputs. Faults, discontinuities in the confining unit, and failed or improperly screened wells could allow irrigation return or septic sources to enter the middle aquifer.
The upper aquifer of the Lucerne Valley groundwater basin lies atop the low-permeability confining unit. The low-permeability confining unit separates the upper aquifer from the middle aquifer and is perched or separated from the middle aquifer by an unsaturated zone in some places. Schaefer (1979) described the upper aquifer as elevated in TDS and nitrate concentration because of irrigation returns, but the results of this study indicate that water samples collected from the upper aquifer generally have similar or even slightly lower concentrations of these species than those collected from the middle aquifer (fig. 3). Although TDS and nitrate concentrations in parts of the upper aquifer may have decreased because of a decrease in irrigated agriculture since the mid-1990s (Stamos and others, 2022), the upper-aquifer samples collected for this study could be biased toward higher-quality water caused by high-capacity production wells for water samples as discussed earlier. Continued monitoring of the Lucerne Valley upper aquifer, utilizing vertically and spatially unbiased sampling points, could help to better understand its current water-quality conditions.
Water Stable Isotopes
Results for stable isotopic composition of water (delta deuterium and delta oxygen-18 values) are presented on figure 4; data presented in Izbicki (2004) and data obtained from more recently collected samples are included. Also shown on figure 4 are volume-weighted average water stable isotope values in modern winter precipitation in the neighboring San Bernardino Mountains reported by Izbicki (2004) and water stable isotope values from a sample of BBARWA effluent collected in 2021. The groundwater stable isotope data presented here support the findings of Izbicki (2004) in that the stable isotopic composition of groundwater in the Lucerne Valley groundwater basin indicates contributions from infiltration of runoff from two primary sources: (1) precipitation that fell at higher altitudes in the San Bernardino Mountains during cooler and wetter climatic conditions than those of the present (2022) and (2) precipitation that fell on mountains in the Mojave Desert to the north during cooler and wetter climatic conditions that prevailed in the even more distant past. Because tritium age-dating evidence indicates that most of the groundwater in this basin was recharged before the commencement of atmospheric nuclear testing during the 1950s (Izbicki and Michel, 2004), most of the recharge in the basin associated with precipitation from the San Bernardino Mountains is likely on the order of hundreds to thousands of years old, whereas recharge associated with precipitation in the mountains in the Mojave Desert to the north is likely on the order of thousands to ten thousand or more years old. Recharge from infiltration of runoff from precipitation during present-day (2022) climatic conditions, as indicated by elevated tritium activities from atmospheric nuclear testing, is limited to small areas near streams draining the mountain front (Izbicki and Michel, 2004). The water stable isotope values measured in Lucerne Valley groundwater basin indicate a range in recharge compositions throughout climatic and hydrologic conditions through time and varying levels of enrichment by evaporation prior to recharge. Examining these data in the context of aquifer classification provide insights about groundwater recharge and flow.
Most water isotope samples from the upper aquifer tend to plot near an evaporative trend line that intersects the GMWL near a delta deuterium value of about −90 per mil. These results indicate that the stable isotopic composition of groundwater sampled from the upper aquifer is inconsistent with recharge from present-day (2022) precipitation and that the upper aquifer likely contains groundwater predominantly recharged from the infiltration of precipitation in the San Bernardino Mountains during climatic conditions that differ from present day (2022); this result is consistent with groundwater-age data for wells in the area reported by Izbicki and Michel (2004). Water isotope values from two upper aquifer sample locations (well 4N/1W-13R3 and well 4N/1E-2Q2) were unlike those of the other sampling locations (fig. 4; U.S. Geological Survey, 2022). Well 4N/1W-13R3, located near the Helendale Fault (fig. 1), had less negative water stable isotope values than other upper aquifer samples, which indicates contribution of water from modern precipitation in the San Bernardino Mountains. This well also had elevated tritium activities (Izbicki and Michel, 2004), consistent with the interpretation of a portion of groundwater sampled at this site having been recharged after the 1950s. Water stable isotope values measured at 4N/1E-2Q2 have more negative delta deuterium values than those of other upper aquifer samples and are more consistent with the stable isotopic composition of groundwater from wells in the lower aquifer. Anoxic conditions (0 mg/L dissolved oxygen) and elevated TDS (1,390 mg/L) concentrations measured at this site are also consistent with contribution from the lower aquifer. The hydrogeologic framework of Stamos and others (2022) shows a pinch out of the confining unit separating the upper and middle aquifers near this location, which may provide a pathway for upward migration of groundwater from the lower to the upper aquifer.
Most samples from the lower aquifer tend to have water stable isotope compositions consistent with evaporative enrichment of precipitation that fell on mountains in the Mojave Desert to the north during cooler and wetter climatic conditions that prevailed in the distant past. Samples from the middle aquifer have a wide range of stable isotope compositions with varying degrees of evaporative enrichment that indicates recharge over a range of climatic conditions during the last several thousand, to more than ten thousand years before present. As noted by Izbicki (2004), geographic location is an important control on recharge sources in the middle and lower aquifers. Samples closer to the San Bernardino Mountains front indicate more contribution of precipitation from the San Bernardino Mountains during cooler and wetter climatic conditions than those of the present (2022), while samples closer to Lucerne (dry) Lake indicate more contribution of precipitation in mountains in the Mojave Desert to the north during cooler and wetter climatic conditions that prevailed in the more distant past.
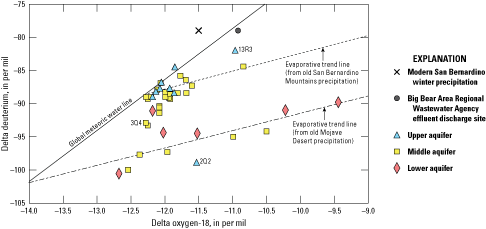
Plot of delta deuterium and delta oxygen-18 values for Lucerne Valley groundwater basin samples, 1990–2021; showing global meteoric water line as well as inferred evaporation trends from different precipitation sources. These data can be found in the U.S. Geological Survey National Water Information System (NWIS; https://waterdata.usgs.gov; U.S. Geological Survey, 2022) with the exception of the volume-weighted average water stable isotope values in modern winter precipitation in the neighboring San Bernardino Mountains which was reported by Izbicki (2004).
Big Bear Area Regional Wastewater Agency Effluent Fate
Imported treated wastewater effluent from BBARWA has been applied to alfalfa fields and infiltration ponds in the Lucerne Valley groundwater basin since 1980 at volumes that ranged from about 1,470 to 4,000 acre-feet (acre-ft) annually between 1980 and 2016 (Stamos and others, 2022). This yearly volume of effluent exceeded the estimated annual natural recharge rate from the California Basin Characterization Model (Flint and others, 2013) of about 635 acre-ft/yr for 1942–2016. Despite the temporal and volumetric scale of this activity, little has been ascertained about the transport of this treated wastewater effluent in the subsurface and its effects on water quality. To gain insight into the behavior of BBARWA treated wastewater effluent in the subsurface, samples were collected in 2021 from six downgradient wells that were analyzed for water-quality indicators, stable isotopic composition of water, and tritium activity. The BBARWA effluent also was sampled but was only analyzed for stable isotopic composition of water. Additional water-quality data from the period 2016–20 for BBARWA effluent and from three monitoring wells at the effluent discharge site were obtained to supplement and aid in interpretation of these results. Location and water-quality data associated with this effort are presented on figure 5 and table 1.
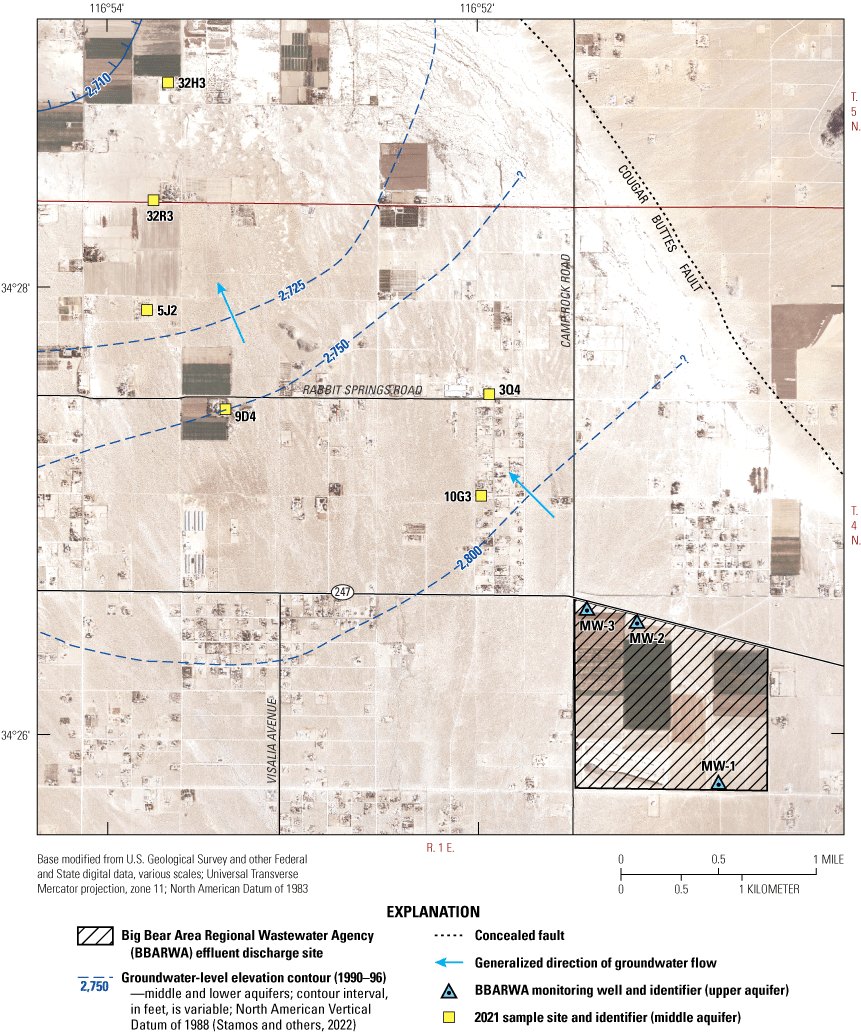
Zoomed in view of Big Bear Area Regional Wastewater Agency (BBARWA) effluent discharge area, monitoring wells, and groundwater sites sampled in 2021. Site information for U.S. Geological Survey (USGS) sites can be found in the USGS National Water Information System (NWIS; https://waterdata.usgs.gov; U.S. Geological Survey, 2022). Site information for BBARWA monitoring wells was acquired from California Regional Water Quality Control Board, Colorado River Basin Region (2021), available at https://www.waterboards.ca.gov/coloradoriver/board_decisions/tentative_orders/docs/2021/2021_0023bigbear_wdr.pdf.
Table 1.
Total dissolved solids, nitrate as nitrogen, delta oxygen-18, and tritium activity information for Big Bear Area Regional Wastewater Agency effluent, Big Bear Agency Regional Wastewater Agency monitoring wells, and groundwater sites sampled in 2021.[USGS, U.S. Geological Survey; BBARWA, Big Bear Area Regional Wastewater Agency; —, no data; pCi/L, picocuries per liter]
| Site name | USGS site number | Aquifer | Total dissolved solids (milligrams per liter) |
Nitrate as nitrogen (milligrams per liter) |
Delta oxygen-18 (per mil) |
Tritium activity |
Data source |
|---|---|---|---|---|---|---|---|
| BBARWA | 342437116513101 | — | 441 | 1.7 | −10.9 | Yes1 | U.S. Geological Survey (2022)2, California Regional Water Quality Control Board, Colorado River Basin Region (2021)3,4 |
| MW-1 | — | Upper | 436 | 9.0 | Not measured | Yes1 | California Regional Water Quality Control Board, Colorado River Basin Region (2021)4 |
| MW-2 | — | Upper | 655 | 14.5 | Not measured | Yes1 | California Regional Water Quality Control Board, Colorado River Basin Region (2021)4 |
| MW-3 | — | Upper | 583 | 15.4 | Not measured | Yes1 | California Regional Water Quality Control Board, Colorado River Basin Region (2021)4 |
| 4N/1E-10G3 | 342704116515901 | Middle | 508 | 9.5 | −11.9 | No | U.S. Geological Survey (2022) |
| 4N/1E-3Q4 | 342731116515601 | Middle | 309 | 1.4 | −12.3 | Yes (1.6 pCi/L) | U.S. Geological Survey (2022) |
| 4N/1E-9D4 | 342728116531901 | Middle | 562 | 3.5 | −11.7 | No | U.S. Geological Survey (2022) |
| 4N/1E-5J2 | 342754116534701 | Middle | 423 | 1.2 | −12.0 | No | U.S. Geological Survey (2022) |
| 5N/1E-32R3 | 342823116534501 | Middle | 519 | 0.6 | −12.0 | No | U.S. Geological Survey (2022) |
| 5N/1E-32H3 | 342855116534001 | Middle | 1,350 | 2.2 | −11.8 | No | U.S. Geological Survey (2022) |
Assumed based on recharge occurring after atmospheric testing of nuclear weapons (Solomon and Cook, 1999).
Reported BBARWA effluent TDS and nitrate concentrations were relatively low and generally comparable to those detected in downgradient wells. However, reported TDS and nitrate concentrations at sites MW-2 and MW-3, which are situated in the upper aquifer underlying the downgradient part of the effluent discharge area, were elevated compared to BBARWA effluent (table 1). These elevated TDS and nitrate concentrations could be due to processes such as evaporative enrichment, leaching of fertilizer and crop residues from the irrigated fields, and biogeochemical conversion of organic nitrogen and ammonium in wastewater to nitrate (Alley, 1993). Site MW-1, which is nominally upgradient from the area where treated effluent is applied, also had nitrate concentrations in excess of those of the treated effluent and those typically observed by this study in the upper aquifer (table 1). These results complicate the use of TDS and nitrate as tracers of BBARWA effluent because the elevated TDS and nitrate values seem to be related more to irrigated agriculture, which is common throughout the basin, rather than an inherent property of the applied effluent.
The single BBARWA wastewater effluent sample collected in 2021 from near the effluent discharge site had water stable isotope values that were distinct from those measured in the Lucerne Valley groundwater samples. Measured BBARWA wastewater effluent values were consistent with evaporative enrichment of the winter precipitation from the San Bernardino Mountains in the Big Bear area where the wastewater originates (fig. 4). The collection of only a single sample leaves questions regarding the potential temporal variability of water stable isotope values in BBARWA wastewater effluent, which may be subject to seasonal differences in water source and varying levels of evaporative enrichment on its journey from the mountains to the discharge site. Nevertheless, the water stable isotope sample provides another tracer to evaluate the transport of BBARWA effluent in the subsurface.
The BBARWA effluent discharge commenced in 1980 (Stamos and others, 2022) and post-dates the atmospheric nuclear tests that produced large amounts of tritium in the atmosphere in the 1950s. Therefore, any BBARWA effluent in the subsurface would be expected to contain measurable tritium. Because measured tritium concentrations were less than the reporting limit in groundwater previously analyzed in this part of the Lucerne Valley (Izbicki and Michel, 2004), any measured tritium activity in groundwater near the BBARWA effluent discharge site may indicate the presence of this recent source.
Based on available well-constuction data, the six groundwater samples collected downgradient from the BBARWA effluent discharge site (to evaluate the movement of this source in the subsurface) were interpreted to be from the middle aquifer (Stamos and others, 2022). For BBARWA effluent to be detected in these samples, it would need to first travel through the upper aquifer, then through or around the confining unit separating the upper and middle aquifers. The meaning of the analytical results from these samples is somewhat unclear, but we describe them here. Site 4N/1E-10G3, located closest to the BBARWA effluent discharge site (fig. 1; table 1), had TDS and elevated nitrate concentrations similar to those detected in monitoring wells sites MW-1, MW-2 and MW-3; however, delta oxygen-18 values for site 4N/1E-10G3 were different from values for BBARWA effluent, and measurable tritium activity was not observed in site 4N/1E-10G3. Site 4N/1E-3Q4, located second closest to the BBARWA effluent discharge site (fig. 1; table 1), had measurable tritium activity of 1.6 picocuries per liter (pCi/L) but lower concentrations of TDS and nitrate and more negative delta oxygen-18 values than would be expected for BBARWA effluent in the subsurface. None of the remaining sites sampled had measurable tritium activity or any other compelling indicator of the potential presence of BBARWA effluent.
Existing data do not provide definitive answers about whether groundwater sampled from sites 4N/1E-10G3 or 4N/1E-3Q4 contains BBARWA effluent. However, the results of existing data can be used to address other questions. If site 4N/1E-10G3 does not contain substantial contributions of BBARWA effluent, as indicated by the lack of observed tritium, then there is likely a significant legacy (pre-1950s) source of nitrate to the groundwater in this location. The results for site 4N/1E-3Q4 are more complex. If groundwater does not contain substantial contributions of BBARWA effluent at this site, as indicated by incompatible TDS, nitrate, and delta oxygen-18 values, then there is likely another source of recent recharge to this site. An ephemeral wash located along the Cougar Buttes Fault, located roughly 1 mi east of this site, may provide a potential source of post-1950s recharge, and the pinch out of the confining unit in this area (as discussed earlier) may provide a vertical pathway for infiltration of modern recharge from the surface to the middle aquifer. To further confound the interpretation of these results, site 4N/1E-3Q4 is near the upper aquifer site 4N/1E-2Q2. As discussed above, site 4N/1E-2Q2 has water stable isotope values consistent with evaporative enrichment of older Mojave Desert precipitation, potentially indicating upward flow from the underlying aquifers at this location. Although water stable isotope values from site 4N/1E-3Q4 are not clearly consistent with evaporative enrichment of older Mojave Desert precipitation like those of site 4N/1E-2Q2, they could be consistent with a mixture of older Mojave Desert precipitation and a more modern recharge source, such as precipitation from the San Bernardino Mountains, BBARWA effluent, or both.
The results of samples collected in 2021 to evaluate presence and extent of BBARWA effluent in the subsurface were difficult to interpret, but the lack of clear evidence for BBARWA effluent contributions to the sampled downgradient middle aquifer sites indicates that BBARWA effluent recharge has primarily remained in the upper aquifer and was not present in water from wells available for sample collection as part of this study. Dedicated sampling of wells installed in upper aquifer in the area near the BBARWA effluent discharge site could help to constrain the extent of lateral transport of this BBARWA effluent. Additionally, results of this sampling effort provide evidence for previously unobserved groundwater recharge and flow phenomena in this part of the Lucerne Valley groundwater basin, which could be evaluated in future studies.
Summary
The Lucerne Valley groundwater basin has a long history of groundwater development, agricultural activities, and application of reclaimed wastewater for irrigation purposes. These activities have affected groundwater quantity and quality in the basin. The U.S. Geological Survey completed this report in cooperation with the Mojave Water Agency as a groundwater-quality focused companion to a larger report on the hydrogeology and simulation of groundwater flow. The purposes of this report were to examine the findings of previous studies on groundwater quality and evaluate recently collected groundwater quality and tracer data, with an emphasis on samples collected in 2021, to examine the occurrence of applied Big Bear Area Regional Wastewater Agency (BBARWA) treated wastewater effluent within the hydrogeologic framework of the larger study.
Results for water-quality indicators, inorganic constituents, and stable isotope tracers are largely consistent with those of previous studies. The lower aquifer tends to be enriched in dissolved solutes and contains water recharged during cooler, wetter climate conditions than those of today (2022). The heavily utilized middle aquifer generally remains low in dissolved solutes, though some samples from this aquifer indicate evidence of contributions from high-nitrate irrigation returns. Other samples indicate evidence of mixing with the high aquifer and are primarily derived from recharge associated with precipitation during cooler, wetter climate conditions than those of present day (2022). The upper aquifer is perched in some places and is separated from the middle aquifer by a confining unit. In previous studies, the upper aquifer was described as heavily compromised in terms of water quality from irrigation return, but results presented in this report indicate the upper aquifer may be similar to the middle aquifer with respect to water quality. Similarities may be due to some improvement in groundwater quality associated with a decline in irrigated agriculture since the mid-1990s, sample bias in favor of higher-quality groundwater introduced by the sampling of in-service production wells for a part of the data considered in this study, or some combination of these factors.
The results of the 2021 samples collected to examine the subsurface transport of applied BBARWA treated wastewater were not conclusive but indicated that treated wastewater from the BBARWA likely remains primarily above the confining unit in the upper aquifer. Wells downgradient from the BBARWA effluent discharge site that were screened within the upper aquifer were not available for sample collection as part of this study. Additional findings of this study indicate that there may be infiltration of modern recharge along an ephemeral wash along the Cougar Buttes Fault.
Additional research, including installation of multiple-well monitoring sites that have short-screened observation wells completed within individual aquifers in key locations, could help to resolve uncertainties that remain regarding the groundwater quality and the transport of BBARWA effluent in the Lucerne Valley groundwater basin. Interpretation of groundwater-quality data from these types of well sites could help assess the future viability of groundwater resources in Lucerne Valley during different recharge and land-use scenarios.
References Cited
Brandt, J., and Sneed, M., 2017, Land subsidence in the southwestern Mojave Desert, California, 1992–2009: U.S. Geological Survey Fact Sheet 2017–3053, 6 p. [Available at https://doi.org/10.3133/fs20173053.]
California Department of Water Resources, 2020, California’s groundwater update 2020: California Department of Water Resources Bulletin 118, accessed January 20, 2022, at https://data.cnra.ca.gov/dataset/calgw_update2020.
California Regional Water Quality Control Board, Colorado River Basin Region, 2021, Order R7-2021-0023, 35 p., accessed January 20, 2022, at https://www.waterboards.ca.gov/coloradoriver/board_decisions/tentative_orders/docs/2021/2021_0023bigbear_wdr.pdf.
Christensen, A.H., and Fields-Garland, L.S., 2001, Concentrations for total dissolved solids, arsenic, boron, fluoride, and nitrite-nitrate for wells sampled in the Mojave Water Agency management area, California, 1991–97: U.S. Geological Survey Open File Report 2001–84. [Available at https://doi.org/10.3133/ofr0184.]
Flint, L.E., Flint, A.L., Thorne, J.H., and Boynton, R., 2013, Fine-scale hydrologic modeling for regional landscape applications—The California Basin characterization model development and performance: Ecological Processes, v. 2, no. 1, 25 p. [Available at https://doi.org/10.1186/2192-1709-2-25.]
Izbicki, J.A., 2004, Source and movement of ground water in the western part of the Mojave Desert, southern California, USA: U.S. Geological Survey Water-Resources Investigations Report 03–4313, 28 p. [https://doi.org/10.3133/wri034313.]
Izbicki, J.A., and Michel, R.L., 2004, Movement and age of ground water in the western part of the Mojave Desert, southern California, USA: U.S. Geological Survey Water-Resources Investigations Report 03–4314, 35 p. [Available at https://doi.org/10.3133/wri034314.]
Mathany, T.M., Wright, M.T., Beuttel, B.S., and Belitz, K., 2012, Groundwater-quality data in the Borrego Valley, Central Desert, and Low-Use Basins of the Mojave and Sonoran Deserts study unit, 2008–2010—Results from the California GAMA Program: U.S. Geological Survey Data Series 659, 100 p. [Available at https://doi.org/10.3133/ds659.]
McMahon, P.B., and Chapelle, F.H., 2008, Redox processes and water quality of selected principal aquifer systems: Groundwater, v. 46, no. 2, p. 259–271, accessed January 20, 2022, at https://doi.org/10.1111/j.1745-6584.2007.00385.x.
Metzger, L.F., Landon, M.K., House, S.F., and Olsen, L.D., 2015, Mapping selected trace elements and major ions, 2000–2012, Mojave River and Morongo Groundwater Basins, Southwestern Mojave Desert, San Bernardino County, California: U.S. Geological Survey data release, accessed January 20, 2022 at https://ca.water.usgs.gov/mojave/mojave-water-quality.html.
Mojave Water Agency and California State University-Fullerton, 2005, Este groundwater atlas: Mojave Water Agency, accessed June 10, 2022, at https://www.williamlaton.com/mojave.
Owen, E., 1988, Quick history of Lucerne Valley: Lucerne Valley webpage, accessed January 20, 2022, at www.lucernevalley.net/history/owen1.htm.
Riley, F.S., 1956, Data on water wells in Lucerne, Johnson, Fry, and Means Valley, San Bernardino County, California: U.S. Geological Survey Open-File Report 56–100, 150 p., 1 pl. [Available at https://doi.org/10.3133/ofr56100.]
Sneed, M., Ikehara, M.E., Stork, S.V., Amelun, F., and Galloway, D.L., 2003, Detection and measurement of land subsidence using interferometric synthetic aperture radar and global positioning system, San Bernardino County, Mojave Desert, California: U.S. Geological Survey Water-Resources Investigations Report 03–4015, 60 p.
Stamos, C.L., Larsen, J.D., Powell, R.E., Matti, J.C., and Martin, P., 2022, Hydrogeology and simulation of groundwater flow in the Lucerne Valley groundwater basin, California: U.S. Geological Survey Scientific Investigations Report 2022–5048, 120 p. [Available at https://doi.org/10.3133/sir20225048.]
U.S. Census Bureau, 2020, QuickFacts—Lucerne Valley CDP, California, United States: U.S. Census Bureau, accessed February 6, 2022, at https://www.census.gov/quickfacts/fact/table/lucernevalleycdpcalifornia,US/POP010220.
U.S. Environmental Protection Agency, 2009, National primary drinking water regulations complete table: U.S. Environmental Protection Agency, 7 p., accessed February 6, 2022, at https://www.epa.gov/sites/default/files/2016-06/documents/npwdr_complete_table.pdf.
U.S. Geological Survey, 2022, USGS water data for the Nation: U.S. Geological Survey National Water Information System database, accessed March 22, 2022, at https://doi.org/10.5066/F7P55KJN.
Appendix 1. Water-Quality Sample Information
Table 1.1.
Sites with water-quality data available on the U.S. Geological Survey National Water Information System (NWIS; U.S. Geological Survey, 2022) from 1990 to 2021 within the Lucerne Valley groundwater basin, California.[mm/dd/yyyy, month/day/year; hh:mm, hour:minute; WG, groundwater; BBARWA, Big Bear Area Regional Wastewater Agency; WE, effluent]
Reference Cited
U.S. Geological Survey, 2022, USGS water data for the Nation: U.S. Geological Survey National Water Information System database, accessed March 22, 2022, at https://doi.org/10.5066/F7P55KJN.
Conversion Factors
U.S. customary units to International System of Units
Datum
Vertical coordinate information is referenced to the North American Vertical Datum of 1988 (NAVD 88).
Horizontal coordinate information is referenced to the North American Datum of 1983 (NAD 83).
Altitude, as used in this report, refers to distance above the vertical datum.
Supplemental Information
Concentrations of chemical constituents in water are given in either milligrams per liter (mg/L) or micrograms per liter (µg/L).
Activities for radioactive constituents in water are given in picocuries per liter (pCi/L).
Results for measurements of stable isotopes of the elements H and O (represented with symbol E) in water are commonly expressed as the relative difference in the ratio of the number of the less abundant isotope (iE) to the number of the more abundant isotope of a sample with respect to a measurement standard. Ratios are expressed in delta notation in units of per mil.
Well-Numbering System
Wells are identified and numbered according to their location in the rectangular system for the subdivision of public lands. Identification consists of the township number, north or south; the range number, east or west; and the section number. Each section is divided into 16, 40-acre tracts lettered consecutively (except “I” and “O”), beginning with “A” in the northeast corner of the section and progressing in a sinusoidal manner to “R” in the southeast corner. Within the 40-acre tract, wells are sequentially numbered in the order they are inventoried. The final letter refers to the base line and meridian. In California, there are three base lines and meridians: Humboldt (H), Mount Diablo (M), and San Bernardino (S). All wells in the study area are referenced to the San Bernardino base line and meridian (S). Well numbers consist of 15 characters and follow the format 004N001E10G003S. In this report, well numbers are abbreviated and written 4N/1E-10G3. Wells in the same township and range are referred to only by their section designation, 10G3. The following diagram shows how the number for well 4N/1E-10G3 is derived.
For more information concerning the research in this report, contact the
Director, California Water Science Center
U.S. Geological Survey
6000 J Street, Placer Hall
Sacramento, California 95819
https://www.usgs.gov/centers/ca-water/
Publishing support provided by the U.S. Geological Survey
Science Publishing Network, Sacramento Publishing Service Center
Suggested Citation
Fackrell, J.K., 2022, Groundwater quality of the Lucerne Valley groundwater basin, California: U.S. Geological Survey Open-File Report 2022-1063, 19 p., https://doi.org/10.3133/ofr20221063.
ISSN: 2331-1258 (online)
Study Area
| Publication type | Report |
|---|---|
| Publication Subtype | USGS Numbered Series |
| Title | Groundwater quality of the Lucerne Valley groundwater basin, California |
| Series title | Open-File Report |
| Series number | 2022-1063 |
| DOI | 10.3133/ofr20221063 |
| Year Published | 2022 |
| Language | English |
| Publisher | U.S. Geological Survey |
| Publisher location | Reston, VA |
| Contributing office(s) | California Water Science Center |
| Description | viii, 19 p. |
| Country | United States |
| State | California |
| Other Geospatial | Lucerne Valley Groundwater Basin |
| Online Only (Y/N) | Y |
| Google Analytic Metrics | Metrics page |