

Preliminary Models Relating Lake Level Gate Operation and Discharge at Reelfoot Lake in Tennessee and Kentucky
Links
- Document: Report (2.57 MB pdf) , HTML , XML
- Data Release: USGS data release— Preliminary model data for lake level gate operation and discharge at Reelfoot Lake—Tennessee and Kentucky
- Database: USGS water data for the Nation— U.S. Geological Survey National Water Information System database
- Download citation as: RIS | Dublin Core
Acknowledgments
Funding was provided by Tennessee Wildlife Resources Agency and U.S. Geological Survey Cooperative Water Program. James Fountain of the U.S. Geological Survey provided technical guidance for monitoring gate openings. Randy Cook of the U.S. Fish and Wildlife Service operated the control structure and provided gate operation data.
Abstract
Preliminary models for gate operations at the new outlet control structure for Reelfoot Lake were developed by the U.S. Geological Survey, using calibrated ratings of the lift gates, to support the U.S. Fish and Wildlife Service in managing lake level. In 2018, the old structure at the outlet of Reelfoot Lake was buried and lake level control was transferred to a new structure. The transition from lake-level management of the old control structure to the new control structure was documented using historical lake level and discharge measurements and records of stop-log management from March 7, 2013, to August 12, 2018. Discharge into Running Reelfoot Bayou was determined using a standard stage-discharge rating curve. Discharge measured using an acoustic Doppler current profiler was used to calibrate gate-discharge equations for free and submerged orifice flow at the new structure.
Two lake operation models, one for the summer season and another for the winter season, are provided for the new structure based on data from this period. The summer operation model is based on operation of the gates once the lake level exceeds an elevation of 282.7 feet (ft) above the North American Vertical Datum of 1988 (NAVD 88). Free flow begins when lake level reaches 282.3 ft above NAVD 88 and becomes transitional once the lake level exceeds 282.8 ft above NAVD 88. Submerged flow begins once the lake level reaches 283 ft above NAVD 88 and the tail-water depth is above critical flow depth. The winter operation model is based on operation of the gates once the lake level exceeds 283.2 ft above NAVD 88. Submerged flow begins when the lake rises to an elevation of 283.5 ft above NAVD 88 and the tail-water depth is above critical flow depth.
Introduction
Reelfoot Lake, in northwestern Tennessee and southwestern Kentucky (fig. 1), exemplifies the challenges of managing water levels in multiuse lakes. The lake is home to a Federal wildlife refuge, a State wildlife-management area, and to tourism that is based on hunting, fishing, birding, and the area’s unique natural and cultural history (Vanderwood, 2003; Bray and others, 2007). The lake margins include private lands that are sites for seasonal homes, local businesses, and commercial agriculture. In addition, Reelfoot Lake’s main outflow channel, Running Reelfoot Bayou, is bounded by commercial agricultural fields. These varied interests in the lake water level can lead to conflicts. Depending on the time of year, scarcity of water can degrade wildlife habitat and ecological health or leave public and private docks isolated from the water, and excess water can flood residential and commercial structures and agricultural fields.
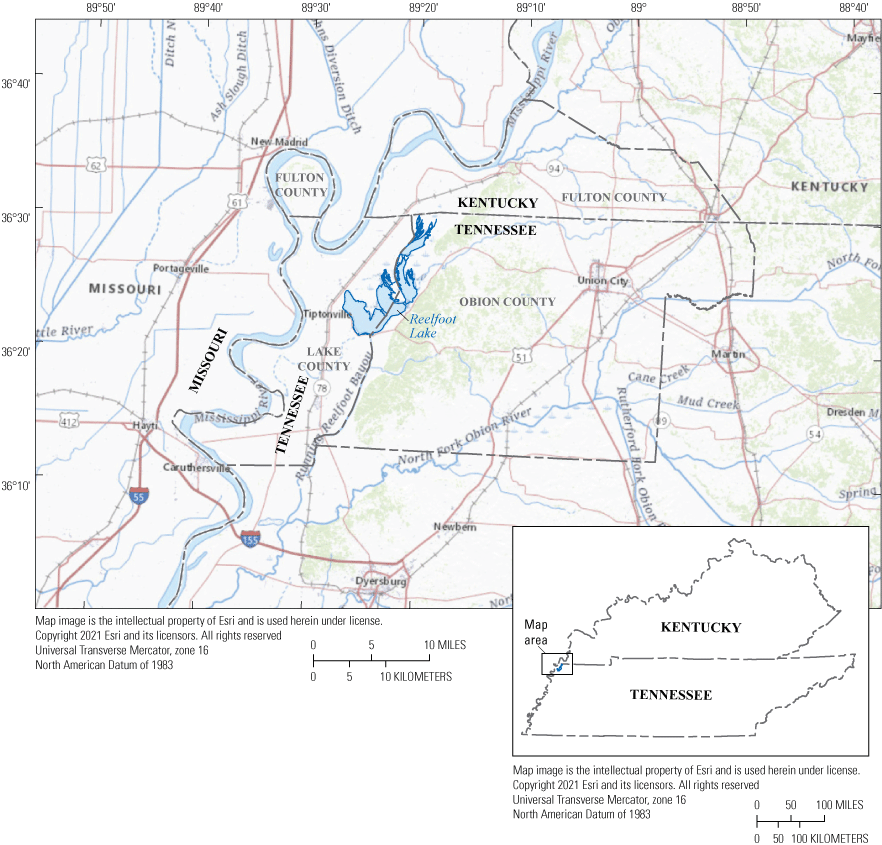
Location of study area with surrounding counties.
Since 1941, the U.S. Fish and Wildlife Service (USFWS) has been responsible for balancing the diverse societal interests in and around Reelfoot Lake. By the early 2000s, the old control structure had deteriorated to the point of being, at best, marginally operable and in danger of catastrophic failure (Bray and others, 2007). A new control structure, made operational in 2018, allows for far more precise control of water levels over a wider range than was previously possible. The design and dimensions of the new structure are sufficiently different from those of the old structure, which makes the old operational “rules of thumb,” developed over decades of experience, in need of significant updating (Tennessee Department of Transportation, written commun., 2018; U.S. Army Corps of Engineers, 1999).
In 2012, the U.S. Geological Survey (USGS), in cooperation with the Tennessee Wildlife Resources Agency and the USFWS, began a series of hydrologic investigations to support the USFWS in the transition between the old and new control structures. A central objective of the investigations was to determine whether and how the new structure could be operated to preserve the historic patterns of variability that had characterized the lake for the past 60 years while meeting seasonal water-level targets implemented in 1991 (U.S. Army Corps of Engineers, 1999). Achieving that objective required the development of operational models relating operation of the old and new structures to lake level and outflow.
Reelfoot Lake is the largest natural lake in Tennessee and is an integral part of northwest Tennessee for economic, recreational, and ecological reasons. The lake was formed by the New Madrid earthquakes of 1811 and 1812 and is located within Lake County and Obion County in Tennessee and Fulton County in Kentucky (fig. 1). The nominal summer lake elevation is 282.2 feet (ft) above the North American Vertical Datum of 1988 (NAVD 88). The lake’s surface area covers approximately 15,500 acres, and average lake depth is approximately 5.2 ft (U.S. Army Corps of Engineers, 1999).
Lake level management and gate operation is the responsibility of the USFWS, which also manages the Reelfoot National Wildlife Refuge in the northern section of the lake. To protect property owners adjacent to the lake and farmers that have land surrounding Running Reelfoot Bayou from flooding catastrophically, a water management plan for Reelfoot Lake was developed in 1989. In 1991, an interim water level management plan was adopted, which stated that Reelfoot lake level is allowed to fluctuate up to an elevation of 283.2 ft above NAVD 88 during the winter season, from November 15 to April 15, and up to an elevation of 282.7 ft above NAVD 88 during the summer growing season, from April 16 to November 14 (USFWS, 1989). Currently, the USFWS typically lowers the lake level to the summer target level by April 1 to lessen chances that flooding will impact the growing season (Randy Cook, USFWS, oral commun., 2019).
Purpose and Scope
This report provides preliminary results of USGS investigations into the response of water level in Reelfoot Lake and Running Reelfoot Bayou during operation of the old and new control structures. The report includes a concise account of the construction and operation of control structures on Reelfoot Lake, descriptions of hydrologic monitoring, compilation and analyses of historic and contemporary records of lake level, streamflow, and the specification and results of operational models relating gate operation to lake water level and outflow. Volumetric measurements of leakage through the seals of the stop-log weirs on the outer bays of the new control structure are included as well. The data to support the models and findings in this study are available from Heal and Diehl (2022).
Reelfoot Lake Control Structures
The Reelfoot Lake spillway was constructed in 1917 to maintain water levels in the lake. The original spillway was replaced in 1931 and a Tainter gate was added in 1948. In 1959, Running Reelfoot Bayou was widened to expand discharge capacity (U.S. Army Corps of Engineers, 1999). The Tennessee Department of Transportation began constructing a vertical lift gate control structure with four stop-log weirs in 2011, but it was not operational until August 2018, after the 1931 structure, referred to in this report as the “old structure,” was blocked off with sheet piling and buried.
The old control structure for Reelfoot Lake consisted of a concrete broad-crested weir of twenty 10-ft-wide bays, which were separated by piers (U.S. Army Corps of Engineers, 1999), and a rotating 20-ft-wide Tainter gate with a sill elevation of 276.7 ft above NAVD 88 (Randy Cook, USFWS, written commun., 2019). The stop logs were operated using hand cranks. Stop-log management depended on winter and summer season target lake levels. In accordance with the water level management plan of 1991, stop logs were raised when the lake level exceeded the seasonal target lake level specified by USFWS personnel (USFWS, 1989; U.S. Army Corps of Engineers, 1999).
By 2011, the Tainter gate had degraded enough to be nonoperational (Randy Cook, USFWS, oral commun., 2017). Flow through the inlet bay approached the weir from the west, parallel to the weir crest and perpendicular to the wall piers, then turned sharply and entered the gates diagonally from the northwest before being discharged southward (fig. 2).
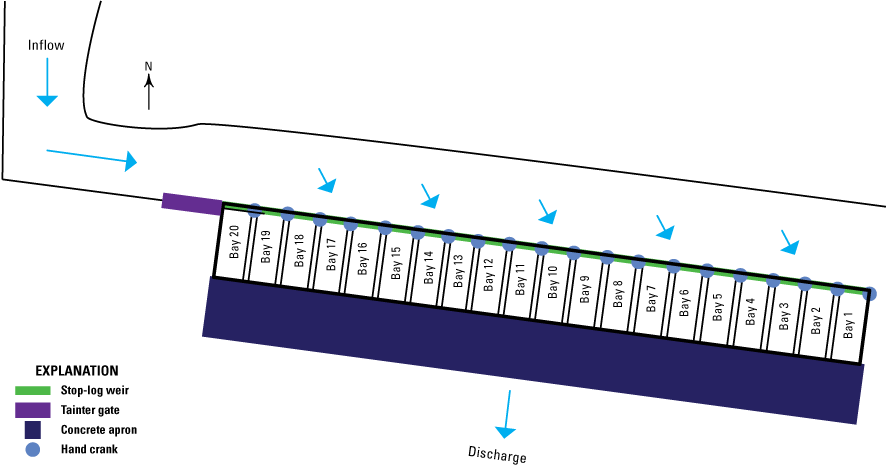
Old structure schematic and pattern of flow through inlet bay.
The skew in approaching flow was less pronounced at low levels when the water in the inlet bay was moving slowly. The crest of the weir was at 280.95 ft. Flow was reduced by lowering a single 1.3-ft-high stop log onto the concrete weir sill in each bay, which raised the weir crest elevation to 282.20 ft above NAVD 88.
The new control structure, which controls discharge with more precision than the old structure, has six 20-ft-wide bays (fig. 3). All six bays have vertical lift gates that are 20 ft wide, 12.17 ft high, and have a sill elevation of 274.25 ft above NAVD 88 (table 1). The two center gates, 3 and 4, are used to control discharge; the four outer gates, 1, 2, 5, and 6, remain open during normal operations. The four outer bays have steel stop-log weirs (fig. 3), with a top elevation of 282.2 ft above NAVD 88 (table 1), located approximately 20 ft upstream from the lift gates (Tennessee Department of Transportation, written commun., 2018).
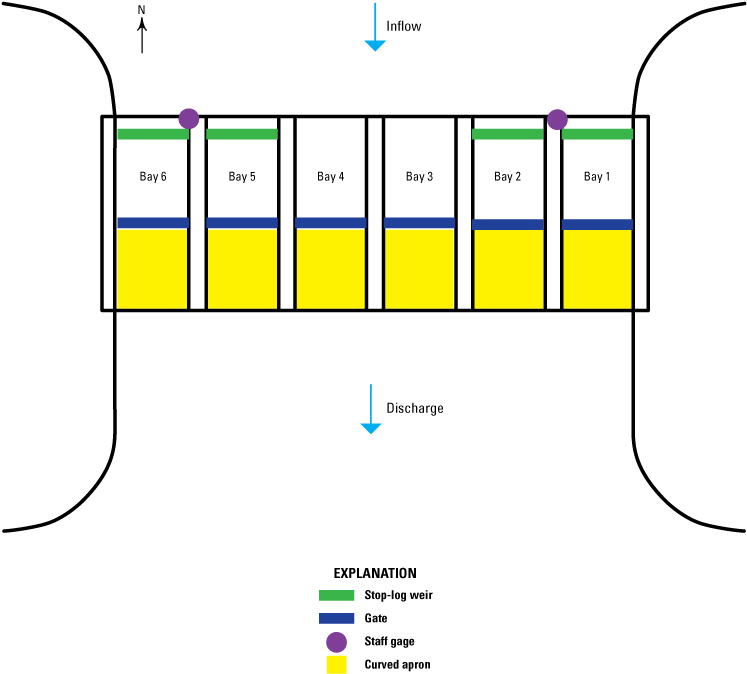
New control structure schematic based on original design plans (Tennessee Department of Transportation, written commun., 2018).
Table 1.
Gate, weir, and gage elevations of the new control structure (Tennessee Department of Transportation, written commun., 2018).[ft, foot; NAVD 88, North American Vertical Datum of 1988]
The gates are currently controlled manually, although gate automation software has been developed and will be available for use once gate operation plans are finalized. There are two staff gages located on the upstream side of the structure; measurements were not obtained using these gages because of drawdown effects during gate operations (Heal and Diehl, 2022). During normal operations with the center gates closed, minimum flow through the structure occurs when the lake level is below an elevation of 282.2 ft above NAVD 88, and only leakage is passing through the weirs. Minimum flow can be enforced by closing all six gates, which also lessens overall leakage. With the gates closed and stop logs in place, flow begins to pass over the weirs once the lake level exceeds an elevation of 282.2 ft above NAVD 88.
Methods
Discharge through the old structure was characterized as a function of lake level and the number of stop logs in place on the crest of the spillway through the examination of recorded lake levels, discharge in Running Reelfoot Bayou calculated using the standard stage-discharge method, and USFWS records of the placement and removal of stop logs collected from March 7, 2013, to August 12, 2018. Discharge through the new structure was defined using gate opening and discharge measurements obtained from site visits, recorded water levels for Reelfoot Lake and Running Reelfoot Bayou (fig. 4), and gate operation data from the USFWS and incremental encoders (U.S. Geological Survey, 2019; Heal and Diehl, 2022). Discharge coefficients were calculated using free and submerged weir and orifice flow equations.
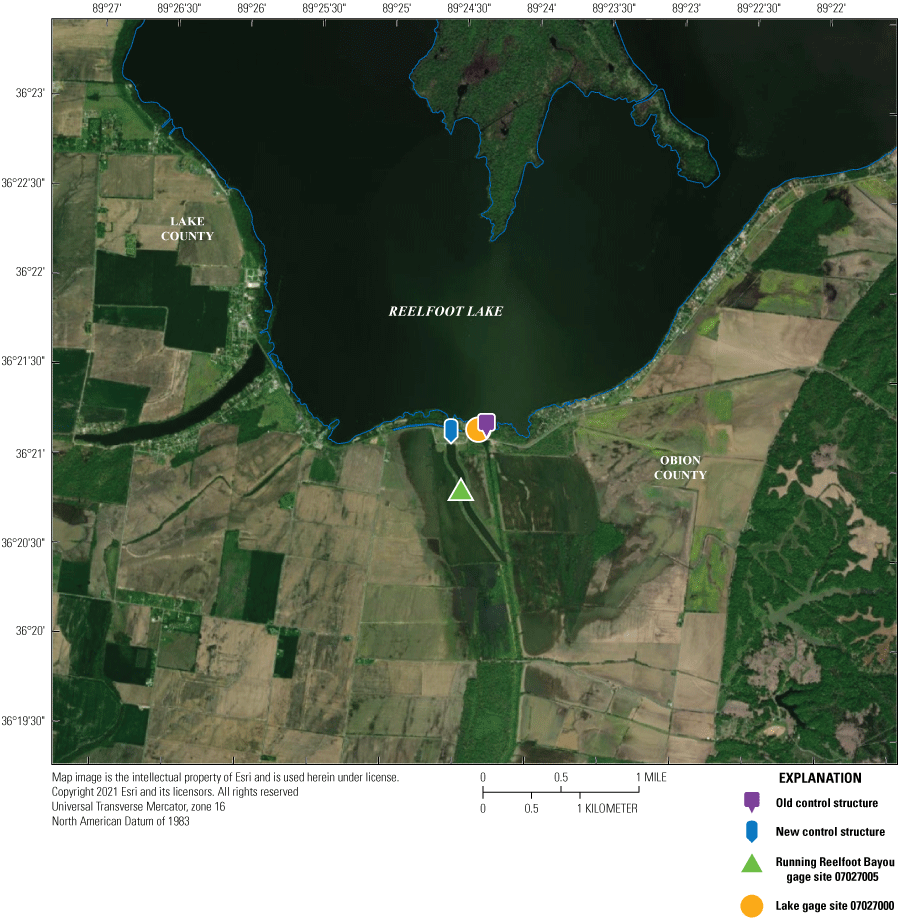
Location of Reelfoot Lake, control structures, and gaging stations.
Data Collection and Compilation
The existing hydrology of Reelfoot Lake, its major tributaries, and its outflow channel were observed from March 7, 2013, to August 12, 2018. In relation to the old structure, this period of time will hereafter be referred to as the “old structure study period.” Study site locations are shown on figure 4.
Both the upstream and downstream sites were moved during this study to mitigate spillway channel effects on stage and discharge measurements. The original and new locations are labeled on figure 5.
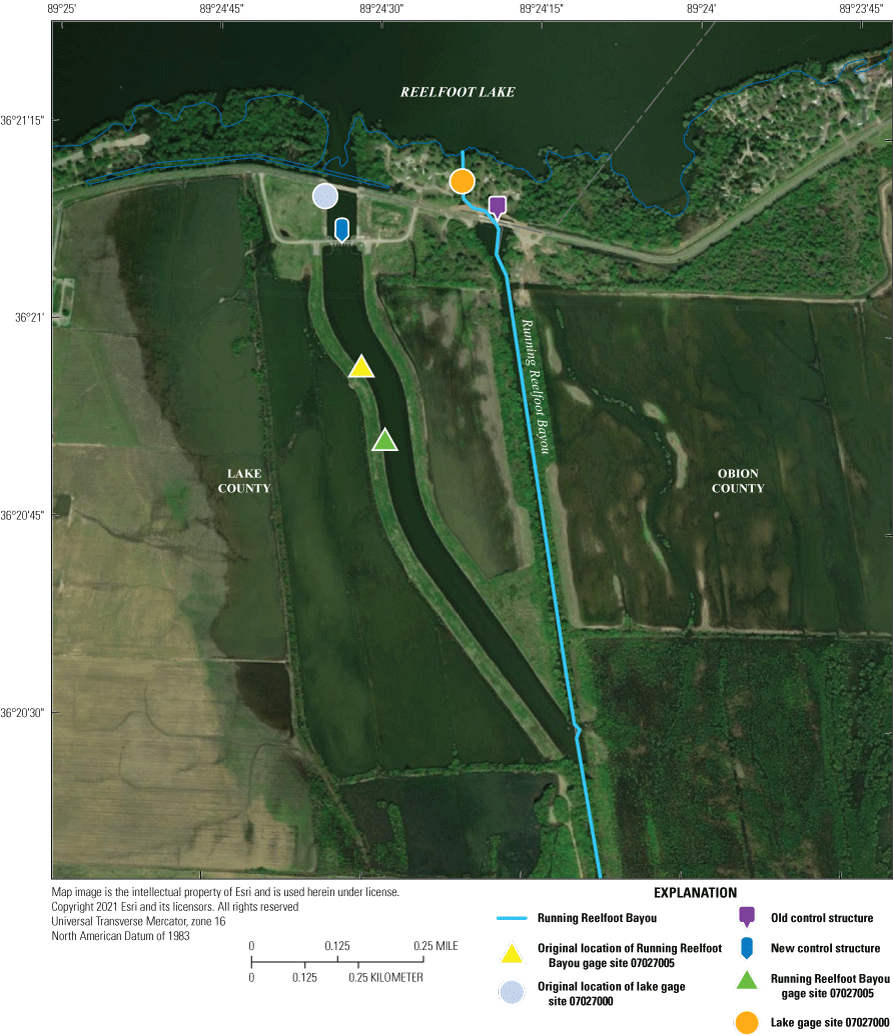
Control structures and gage locations.
Site 07027000—Reelfoot Lake
The upstream gage, site 07027000, records gage height hourly and is located on Reelfoot Lake (U.S. Geological Survey, 2019). Lake level was analyzed from March 2013 through June 2019. The upstream gage was originally located upstream from the new control structure and was moved to its current location near the old control structure in March 2019 (fig. 5).
Sites 07027002 and 07027005—Running Reelfoot Bayou
The downstream gage, site 07027005, is located on Running Reelfoot Bayou. Gage height and rated discharge were observed from March 2013 through June 2019. Discharge data for March 2013–August 2018 were acquired from gage site 07027002 and for August 2018–June 2019 from gage site 07027005; both gage sites recorded data at 15-minute intervals. An acoustic velocity meter installed in December 2018 is also located at the downstream location and logs real-time velocity every 15 minutes (U.S. Geological Survey, 2019); water velocity data from December 2018 to December 2020 were analyzed. The downstream gage and acoustic velocity meter were moved approximately 200 meters downstream to their current location (fig. 5) in June 2019.
A precipitation gage currently transmits data every 15 minutes at site 07027005 (U.S. Geological Survey, 2019). It was located at the upstream site (site 07027000) from March 7, 2013, to August 26, 2020, and has been located at the downstream site from September 9, 2020, to the present.
Site 07027003—Reelfoot Control Structure
Two incremental encoders, site 07027003, were installed on gates 3 and 4 of the new control structure and transmitted gate opening data hourly (U.S. Geological Survey, 2019) from May 9, 2019, through the beginning of June 2021. The encoders were replaced with potentiometers on June 9, 2021.
Old Structure
Stop-log operation data recorded during the old structure study period were chosen for analysis. During this period, the summer growing season (April 16–November 14) lake level was maintained within the elevation range from 281.4 to 282.9 ft above NAVD 88 90 percent of the time. The lake level during the remainder of the year was maintained in the elevation range from 281.3 to 283.8 ft above NAVD 88 90 percent of the time.
Historical high discharges were inferred from historical lake stages from 1941 through 2018, and the frequency of growing-season flood peaks was estimated on the basis of multiple dates defining the beginning of the growing season. For high lake stages, discharge was estimated by means of the rating curve for the old structure with all logs above the water. During the growing season in years before 1991, logs were typically raised when the lake level exceeded 282.2 ft above NAVD 88; after 1991, they were typically raised when the lake level exceeded 282.7 ft above NAVD 88. Historic maximum growing-season discharges estimated to have been less than 900 cubic feet per second (ft3/s) by this method were actually lower than that if the stop logs were not raised during the period of maximum lake level.
Rating Approach at Old Structure
Regression was not used to estimate the rating curves for the old outlet structure because of the bias in the historical discharge measurements and uncertainty about the number of stop logs in use. Instead, curves with appropriate functional forms were fitted subjectively through the densest areas of data when plotting discharge versus lake level during the old structure study period. For any given number of stop logs resting on the sill (down), when tail water was below the sill there was free flow over the weir and in principle, discharge should not vary by more than 10 percent at a given lake level (Murphy, 1904; Horton, 1907; Dickinson, 1967; Harmel and others, 2006). In this case, the data show that published discharge (site 07027002) varied over a range of about plus or minus 10 percent.
The mean error through time of the rated discharge published at the gage (site 07027002) is not expected to be zero because of backwater and unsteady-flow effects. Backwater in Running Reelfoot Bayou created overestimates of discharge at the old structure, some large, whereas periods of increasing lake level produced underestimates.
The records of the times at which the stop logs were up or down are not completely accurate. As a result, the position of the stop logs (up or down) had to be deduced from lake level (site 07027000) and published discharge (site 07027002). Classifying data into categories for 0 logs, 10 logs, and 20 logs down involves censoring data from each class on the basis of how far removed they are from the central band for that class. Thus, regression of a rating through the categorized data was not used because of the sensitivity of the criteria for censoring.
New Structure
Discharge through vertical lift gates is generally defined by two different hydraulic conditions: free flow and submerged flow (Rajaratnam and Subramanya, 1967). In this case, another hydraulic condition of concern is transitional flow. As discussed previously, discharge through the new control structure is dependent upon the water level of Running Reelfoot Bayou, gate openings, and lake level.
Free and Submerged Flow Characterization and Equations
In this study, orifice flow equations (Tillis and Swain, 1998) were used to determine discharge and discharge coefficients for free and submerged orifice flow regimes during normal operations. These equations were implemented with the assumption that discharge increased gradually during the transition from free to submerged orifice flow and that the transition from free to submerged flow at the weirs was smooth. Weir flow equations (Tillis and Swain, 1998) were used to model flow through the four outer bays with stop-log weirs, as well as flow through the old structure.
The gate design of the new structure has features that are not included in the theoretical analysis upon which the orifice flow equations are based. On the upstream side, flow contraction in the bay openings increases as discharge increases; this is caused by the larger width of the upstream channel, approximately 212 ft across, in relation to the two 20-ft-wide center gates (fig. 3). Furthermore, the apron is not flat on the downstream side of the gate, but curves downward, like an ogee spillway.
Free Weir Flow
Free weir flow is defined by discharge freely cascading over a weir into open atmosphere; it is not influenced by tail-water elevation (Henderson, 1966). Free weir flow conditions exist in gates 1, 2, 5, and 6 with the stop logs in place when gates are raised above tail-water level, the lake level is above 282.2 ft above NAVD 88, and tail water is below the critical flow level on the crest of the weir (fig. 6).
Free weir flow water surface profile of the new structure based on original design plans (Tennessee Department of Transportation, written commun., 2018). ft, foot; H, headwater depth above sill, in feet; NAVD 88, North American Vertical Datum of 1988.
To compute free flow over the stop-log weirs, the coefficient of discharge, Cw, was used (Tillis and Swain, 1998):
whereFree Orifice Flow
Similarly, free orifice flow occurs when discharge passes through an orifice, or gate opening, and is supported by the sill. When gates 3 and 4 of the new structure are raised as much as 1 ft, free orifice flow is generally observed, as shown in figure 7, as the tail water remains below the critical flow depth on the sill.
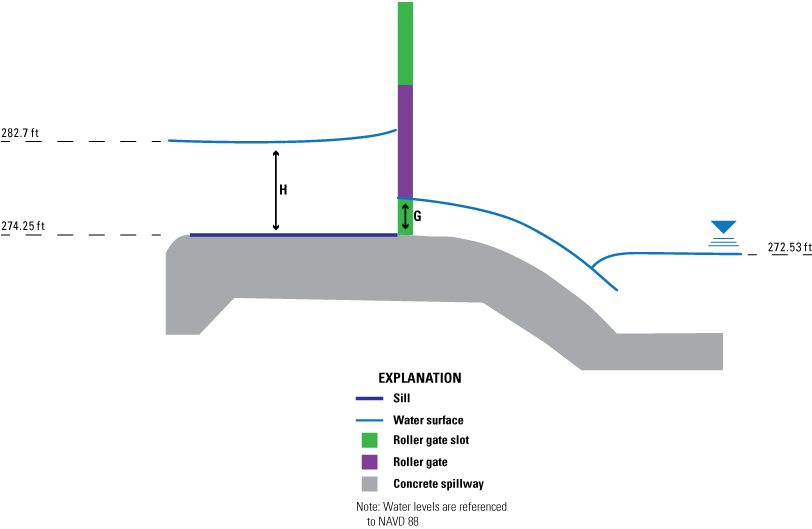
Free orifice flow water surface profile through center gate of the new structure based on original design plans (Tennessee Department of Transportation, written commun., 2018). ft, foot; H, headwater depth above sill, in feet; G, gate opening, in feet; NAVD 88, North American Vertical Datum of 1988.
To compute free orifice flow for discharge through the two center gates of the new structure, the coefficient of discharge, Cg, was used (Tillis and Swain, 1998):
whereCg
= discharge coefficient for free orifice flow;
G
= gate opening, in feet; and
g
= acceleration of gravity (32.17 feet per square second).
Using existing USGS gage measurements for Q, equation 2 can be rearranged to solve for the discharge coefficient:
Submerged Weir Flow
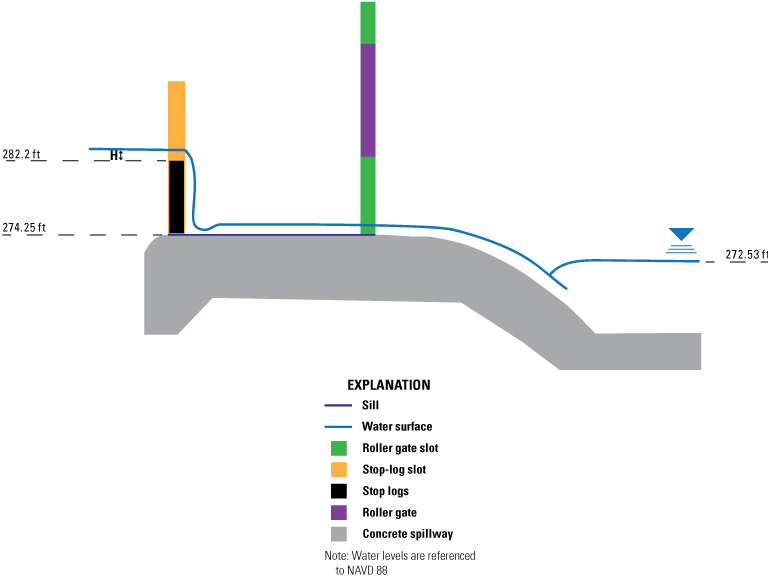
Submerged weir flow occurs in bays 1, 2, 5, and 6 when the tail-water elevation rises above the critical flow depth on the weir crest (fig. 8). This exceedance creates backwater that affects discharge (Chin, 2006).
Submerged weir flow water surface profile of the new structure based on original design plans (Tennessee Department of Transportation, written commun., 2018). ft, foot; H, headwater depth above sill, in feet; h, tail-water depth above sill, in feet; NAVD 88, North American Vertical Datum of 1988.
To compute submerged weir flow, the coefficient of discharge, Cws, was used in the following equation (Tillis and Swain, 1998):
whereSubmerged Orifice Flow
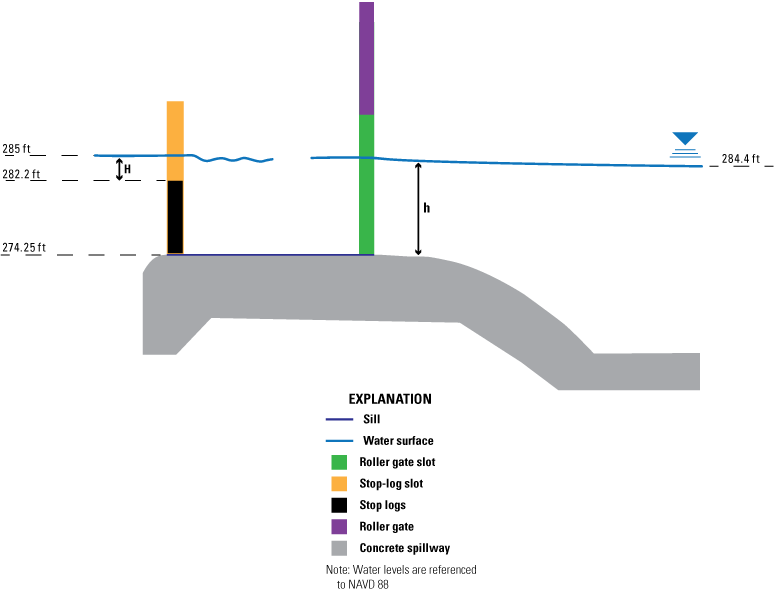
Submerged orifice flow occurs through gates 3 and 4 when the gates are open and the tail-water depth is above the critical flow depth on the apron, immediately downstream from the gate (fig. 9). To compute submerged orifice flow through the gates of the new structure, the coefficient of discharge, Cgs, was used (Tillis and Swain, 1998):
where Equation 5 can be rearranged to solve for the discharge coefficient: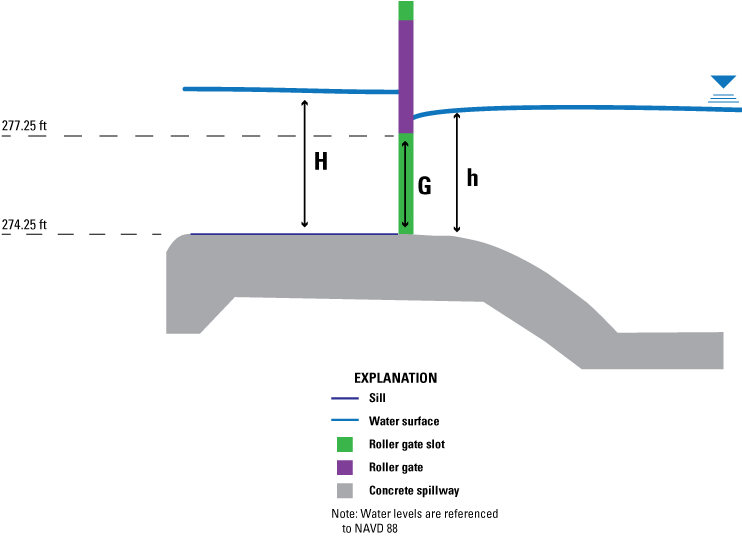
Submerged orifice flow water surface profile through center gate of the new structure based on original design plans (Tennessee Department of Transportation, written commun., 2018). ft, foot; H, headwater depth above sill, in feet; G, gate opening, in feet; h, tail-water depth above sill, in feet; NAVD 88, North American Vertical Datum of 1988.
As Cgs is a function of gate opening and submergence, the computed values are plotted against the dimensionless parameter, h/G, and used in the following form (Tillis and Swain, 1998):
whereTransitional Flow
Transitional flow develops when flow switches between free and submerged orifice flow conditions. It is an unstable flow condition that is difficult to define mathematically because it occurs within a general zone instead of at a specific point. The transitional flow zone has upper and lower boundaries that are influenced by variations in depth of the tail water and geometry of the sill (Ansar and Chen, 2009). In this case, transitional flow was determined through direct observation of gate operations during 11 site visits from December 2, 2013, to October 24, 2018.
Velocity Measurements and Rating Curves
For all periods of flow through the old and new structure, discharge was determined by using a standard stage-discharge rating curve that incorporates real-time stage data from the standard gage on Running Reelfoot Bayou (site 07027005) and periodic field measurements made with a four-beam acoustic Doppler current profiler (Turnipseed and Sauer, 2010). At times, the bayou is affected by variable backwater, which generally occurs after rain events. Overflow from ditches used for agricultural drainage enters the bayou, raising the water level and thereby reducing flow velocity at the gage. Variable backwater also occurs during gate operations when the water level of the bayou changes rapidly.
An index velocity rating, which is based on the wetted area of the bayou and a mean velocity to instantaneous velocity regression, was applied to selected data for analysis during a precipitation event from March 11 to March 13, 2020 (Turnipseed and Sauer, 2010; U.S. Geological Survey, 2019; Heal and Diehl, 2022). To calculate index velocity, real-time point velocity data were obtained from an acoustic Doppler current profiler that was installed in addition to the standard stage gage at site 07027005; the profiler uses a two-beam transducer configuration that sends and receives acoustic pulses into the stream channel. Water velocity in a relatively small portion of the channel is determined by measuring the frequency shift of the transmitted and received acoustic pulses as they are reflected off particles in the water (Turnipseed and Sauer, 2010).
Gate Opening Measurements
Gate opening measurements at the new structure were recorded using two methods: by hand, with a metal tape attached to a long stick, and with two incremental shaft encoders (fig. 10). Incremental encoders are typically used to record water levels using a float sensor on the water surface connected to a metal tape (Sauer and Turnipseed, 2010). In this case, the metal tapes were attached to the top of both center gates with magnets to record vertical gate movement.
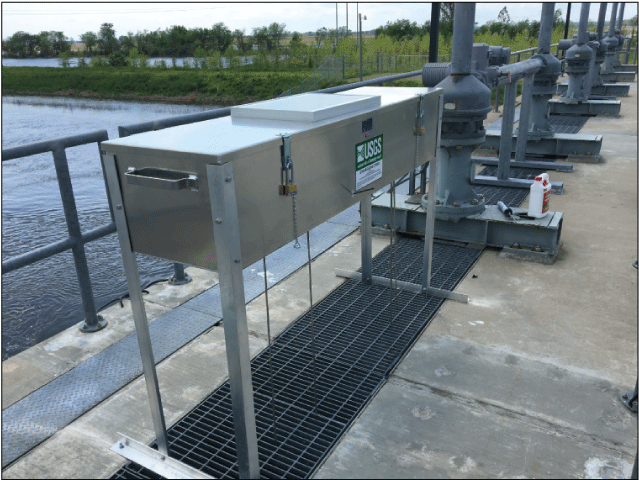
Incremental encoders on the new control structure at Reelfoot Lake. Photograph by Jerry W. Garrett, U.S. Geological Survey.
Stop-Log Weir Leakage Measurements
Leakage was observed through the seals of the stop logs on bays 1, 2, 5, and 6 of the new structure. The lake level was 0.6 ft below the top of the stop-log weir for all measurements. The USGS volumetric method (Turnipseed and Sauer, 2010) was used to measure leakage in each of the four bays (fig. 11). Leakage was contained by closing the gates on bays 1, 2, 5, and 6. The water level was then measured repeatedly as it rose in the space between the weir and gate. The water surface area between the weir and gate was about 396 square feet. The following equation was used to determine leakage discharge rates (Turnipseed and Sauer, 2010):
where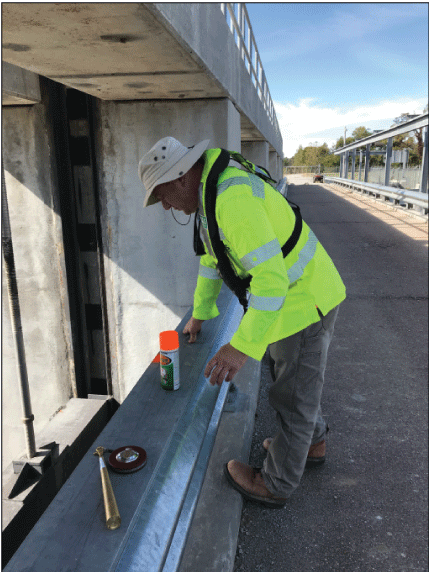
David Crum, U.S. Geological Survey (USGS) hydrographer, marking measurement points. Photograph by Elizabeth N. Heal, USGS.
Statistical Error Method for Free and Submerged Orifice Flow Regimes
For free and submerged orifice flow, error statistics were computed using the nonlinear least squares method, which uses polynomial regression to determine the weighted least square estimates (Ciaburro, 2018):
whereRSS
= residual sum of squares,
x
= independent variable,
y
= dependent variable, and
β
= unknown coefficient.
The overview method in the R statistical software was then applied to calculate standard error and related statistical variables using the nonlinear least squares method results (Baty and others, 2015; R Core Team, 2019):
whereHydrologic Analyses
This section provides the estimated results of old and new control structure data, which were used to determine discharge coefficients and related equations. The results of weir leakage testing are also presented.
Old Structure Operations
Discharge from the old structure was modeled as a function of lake level using four rating curves (fig. 12). Three of the four equations for estimated curves that best match the stage-discharge data have the form of weir discharge equations. However, the values used for the “weir crest level” in the fitted equations are treated as variables and do not correspond exactly to the nominal sill level, either of the concrete weir crest or the top of the stop logs. The fitted coefficients of discharge are low compared to reference values (Tracy, 1957; Brater and King, 1976). These peculiarities may be due to large differences between the existing weir structure and the idealized weirs upon which theoretical weir discharge equations are based, particularly the skewed inflow, as discussed previously. Weir discharge coefficients for steps in natural channels can be as low as 2.0 (Said, 2015):
whereQ1
= discharge, in cubic feet per second; for lake elevation less than 282.1 ft above NAVD 88;
Q2
= discharge, in cubic feet per second; for free weir flow over 20 stop logs; and
Q3
= discharge, in cubic feet per second; for free weir flow without stop logs.
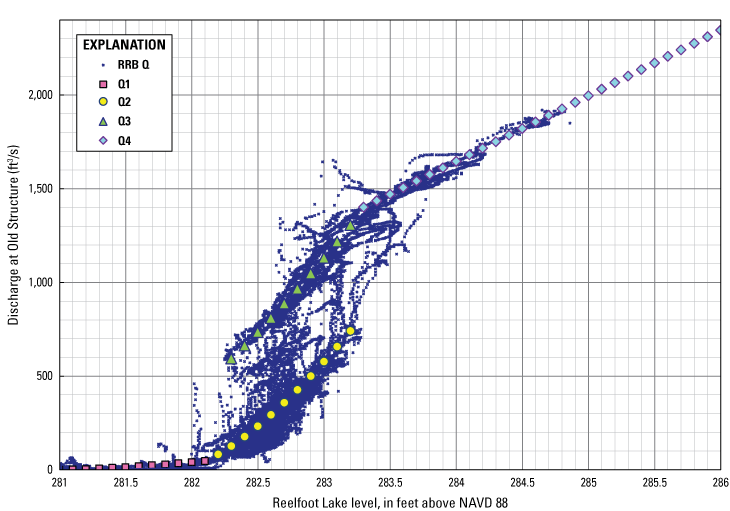
Estimated ratings at the old structure. ft3/s, cubic foot per second; ft, foot; Q, discharge, in cubic feet per second; NAVD 88, North American Vertical Datum of 1988.
The equation for submerged weir flow, Q4, is based on the linear regression of 1,775 selected points, with Running Reelfoot Bayou discharge measurements of 1,400 ft3/s or higher against a lake level of 283.3 ft above NAVD 88 or higher:
whereQ4
= discharge, in cubic feet per second, for submerged weir flow, lake stage greater than 283.30 ft above NAVD 88.
Based on data analysis of the monitoring period, stop-log operations generally followed the 1991 management plan. Stop logs were not always lowered during periods when the lake level was below the nominal target water level. During the summer season, all 20 stop logs were kept down at lake levels below 282.25 ft above NAVD 88 and all 20 stop logs were raised at lake levels above 282.65 ft above NAVD 88. Over a lake level range of 282.25–282.65 ft above NAVD 88, a variable number of logs were used (fig. 13). Typically, the lake was drawn down around March 20 to facilitate reaching the summer target lake level of 282.2 ft above NAVD 88 by April 1 (Randy Cook, USFWS, oral commun., 2017).
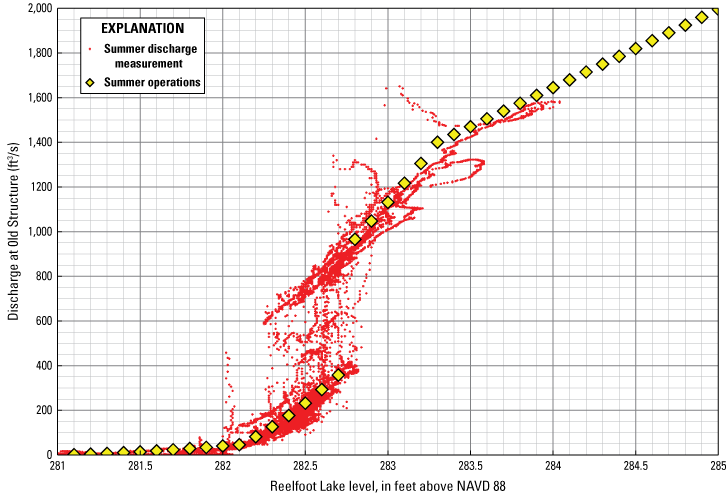
Nominal summer operations and published discharges. ft3/s, cubic foot per second; ft, foot; NAVD 88, North American Vertical Datum of 1988.
During the winter season, all 20 logs were kept down at lake levels below 282.4 ft above NAVD 88. On some occasions, the stop logs were kept in place up to a lake stage of 283.25 ft above NAVD 88. Over the lake stage range of 282.4–283.6 ft above NAVD 88, a setting of 10 logs was sometimes used. All 20 logs were raised during some periods when lake levels were above 282.75 ft above NAVD 88, and during all periods when lake levels were above 283.65 ft above NAVD 88 (fig. 14).
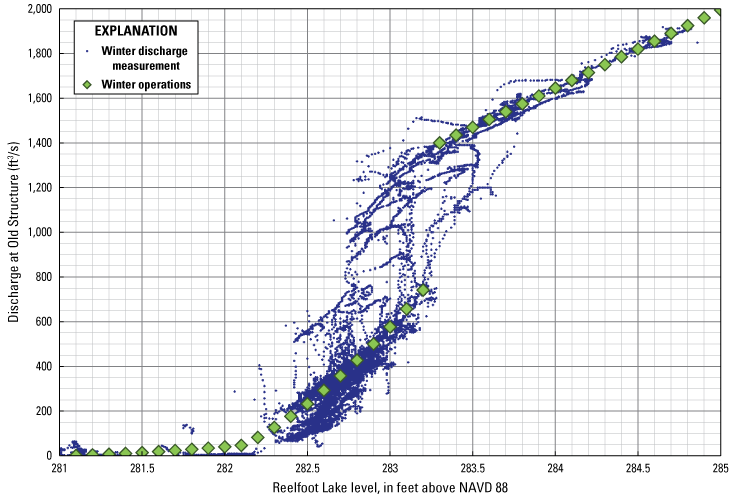
Nominal winter operations and published discharges. ft3/s, cubic foot per second; ft, foot; NAVD 88, North American Vertical Datum of 1988.
Discharge Ratings
Most points representing lake stage and discharge during periods with 20 stop logs reported to be resting on the weir sill are clustered around two curves (Q1 and Q2), joined at a breakpoint, at a lake stage of approximately 282.2 ft above NAVD 88 and a Running Reelfoot Bayou discharge of approximately 50 ft3/s (fig. 15). The curve below 50 ft3/s represents leakage around the logs and through, around, and under the rest of the old structure. The curve above 50 ft3/s and extending to about 600 ft3/s at a lake level of 283 ft above NAVD 88 represents free flow over the top of the stop logs at 282.2 ft above NAVD 88.
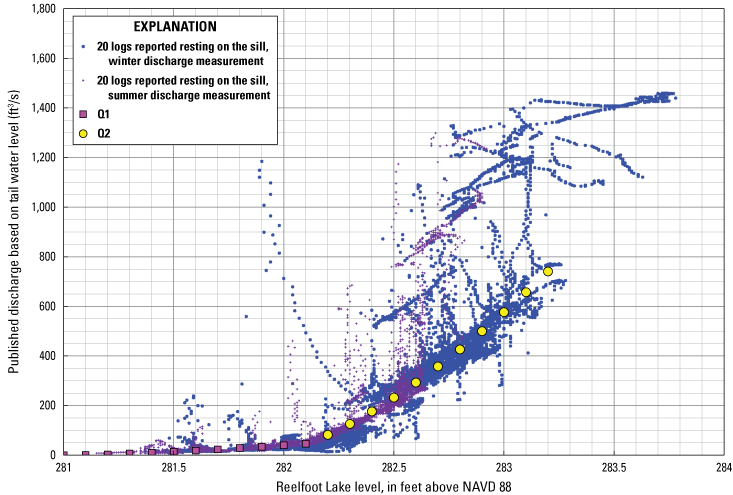
Lake level versus discharge with 20 logs reported to be resting on the sill, 2013–16. ft3/s, cubic foot per second; ft, foot; Q, discharge, in cubic feet per second; NAVD 88, North American Vertical Datum of 1988.
In figure 12, data points for lake level and discharge cluster around two rating curves (Q3 and Q4) during periods when all logs were reported to be raised clear of the water. These curves are joined by a breakpoint at 283.3 ft above NAVD 88 and 1,400 ft3/s. The curve below 1,400 ft3/s represents free weir flow over the concrete weir sill, whereas the curve above 1,400 ft3/s represents submerged weir flow. At the transition from free to submerged flow, the tail water is approximately 282.19 ft above NAVD 88, which is 1.24 ft above the weir crest at 280.95 ft above NAVD 88, and the vertical drop in the water surface across the weir is approximately 1.11 ft. Figure 16 shows a selected time period identical to that of the data displayed in figure 12, namely 2013–16. Lake level and discharge data points in this figure correspond to the period of time for which the records of stop-log operation were available.
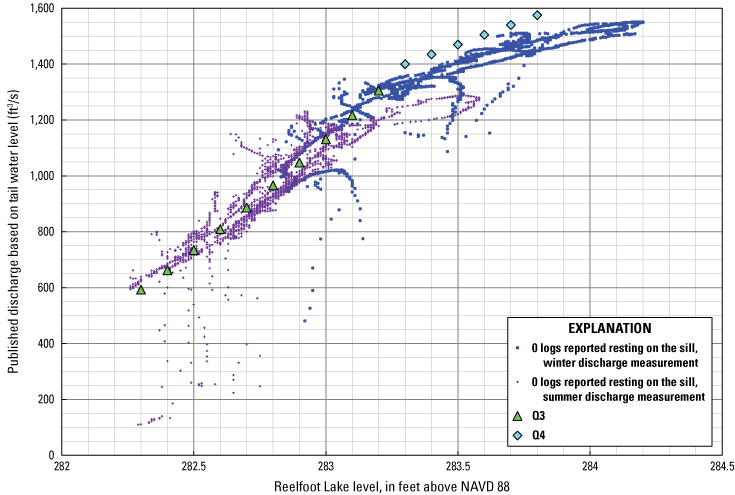
Lake level versus discharge with zero logs reported to be resting on the sill, 2013–16. ft3/s, cubic foot per second; ft, foot; Q, discharge, in cubic feet per second; NAVD 88, North American Vertical Datum of 1988.
To model high flows, the upper end of the Running Reelfoot Bayou rating curve and the upper end of the discharge rating for the old structure were extrapolated as linear functions; the uncertainty associated with both ratings increases above 1,900 ft3/s (fig. 12). At a lake elevation (and maximum value of extrapolation) of 286.0 ft above NAVD 88, modeled discharge was 2,345 ft3/s, tail water was at 285.29 ft above NAVD 88, and the vertical drop in the water surface across the weir was approximately 0.71 ft.
Data points representing lake level and discharge during periods with 10 logs resting on the concrete sill and 10 raised clear of the water are clustered around a curve that is intermediate between the curves for 20 logs lowered and 20 raised (fig. 17). Usage of the 10-log setting was rare and inconsistent. Because of this inconsistency, this gate setting was not used for modeling purposes, and no curve was fit to the data for the 10-log setting.
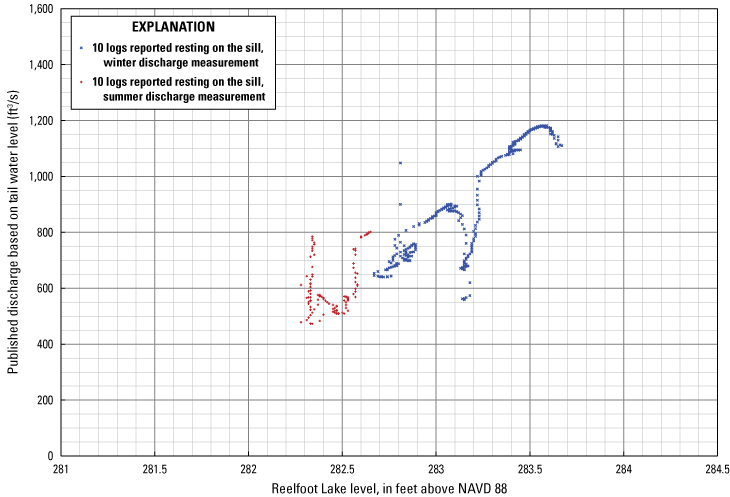
Lake level versus discharge with 10 logs reported to be resting on the sill, 2013–16. ft3/s, cubic foot per second; ft, foot; NAVD 88, North American Vertical Datum of 1988.
Numerous plotted points of lake level and discharge appeared to represent a specific number of stop logs. However, records of stop-log operations implied during some time periods that a different number of logs was used. For interpretation, it was assumed that the actual number of stop logs in place was reflected by the plotted relation of lake level to discharge, despite inconsistency in the recorded number of stop logs. These periods of discrepancy between the estimated and recorded number of logs were dominated by episodes in March and April when the estimated number of logs in place on the sill was less than the recorded number. In the period of available USFWS records of stop-log numbers, from April 9, 2013, through April 19, 2016, 10 percent of hourly measurements had a discrepancy between the level-discharge pair and the reported number of logs.
Historic Lake Levels
In the period from 1991 through 2018, growing-season peak discharge quantiles were noticeably lower than annual peak discharge quantiles (table 2). Over a 2-year recurrence interval, the median peak discharge for the entire calendar year was approximately 1,480 ft3/s. For the growing season from April 16 through November 14, the median peak discharge for the growing season was approximately 1,345 ft3/s.
Table 2.
Median annual peak discharges and peak growing-season discharges by recurrence interval.[ft3/s, cubic foot per second; Nov., November; yr, year]
Maximum Reelfoot Lake water levels for the entire year and for the growing season were calculated over a period of 63 years to assess their height and timing (fig. 18). Annual maximum lake levels typically occurred outside the growing season; when they occurred in the growing season, they were typically lower than winter maximum levels. Maximum growing-season lake levels typically occurred at the beginning of the growing season or within the following 6 weeks. Between 1941 and 2016 (excluding 1971–83), the highest maximum summer lake level was recorded at 285.85 ft above NAVD 88 on May 4, 2011, day 124. The lowest maximum growing-season lake level was 281.46 ft above NAVD 88 on April 23, 1941.
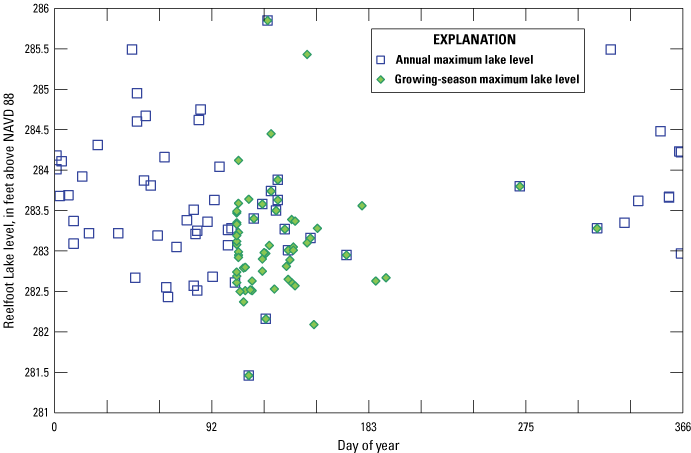
Annual and growing-season maximum Reelfoot Lake levels. ft, foot; NAVD 88, North American Vertical Datum of 1988.
New Structure
Several site visits from December 2, 2013, to October 24, 2018, were made to obtain gate opening data and corresponding discharge measurements. Free and submerged orifice flow conditions were confirmed by observation during site visits. Hysteresis in the gate rating, which can be caused by the abrupt transition in depth from supercritical to subcritical depth upstream or downstream of a vertical lift gate (Defina and Susin, 2003), was not found to be a concern at the new structure. As backwater increased, discharge decreased gradually from the amount predicted by the fitted free orifice equation to the amount predicted by the submerged orifice equation.
Free Weir and Submerged Flow Discharge Measurements
Free weir flow conditions exist at the new structure when gates 1, 2, 5, and 6 are raised above tail-water level and the lake level exceeds 282.2 ft above NAVD 88. Submerged weir flow occurs in bays 1, 2, 5, and 6 when the tail-water elevation rises above the critical flow depth on the weir crest. Onsite discharge measurements to determine weir flow coefficients specific to the new structure were not available for the period December 2, 2013–October 24, 2018.
Free Orifice Flow Discharge Measurements
The mean discharge coefficient from field data, Cg, based on equation 3, was 0.533. The discharge coefficient ranged from 0.36 at a measured discharge of 308 ft3/s to 0.64 at a measured discharge of 839 ft3/s. As shown in figure 19, the discharge coefficient for free orifice flow calculated using the method described in Tillis and Swain (1998) was 0.532, which is the slope of the fitted line. The standard error (SE) was 0.010 (table 3).
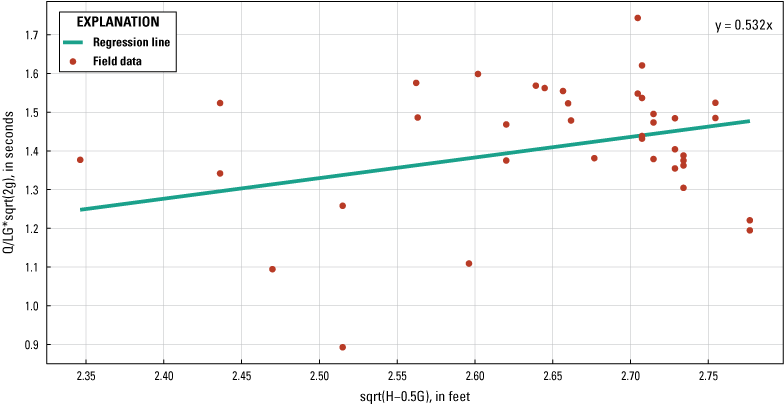
Free orifice flow discharge coefficient, Cg, calibration plot. Q, discharge, in cubic feet per second; L, length of sill, in feet; G, gate opening, in feet; H, headwater depth above sill, in feet; g, acceleration of gravity, in feet per square second.
Table 3.
Free orifice flow regression statistics.[SE, standard error; RSS, residual sum of squares; RSE, residual standard error; t value, ratio of difference between mean of sample sets and variation that exists within sample sets; Pr(>|t|), p-value associated with t value; %, percent; <, less than]
Submerged Orifice Flow Discharge Measurements
The mean discharge coefficient from field data, Cgs, based on equation 6, was 0.283. The discharge coefficient ranged from 0.130 at a measured discharge of 952 ft3/s to 0.383 at a measured discharge of 1,209 ft3/s. As shown in figure 20, the discharge coefficient for submerged orifice flow, using the method described in Tillis and Swain (1998), was 0.671x-1.026, where x is h/G, the ratio of tail water to gate opening. The SE values for variables a and b were 0.050 and 0.094 (table 4).
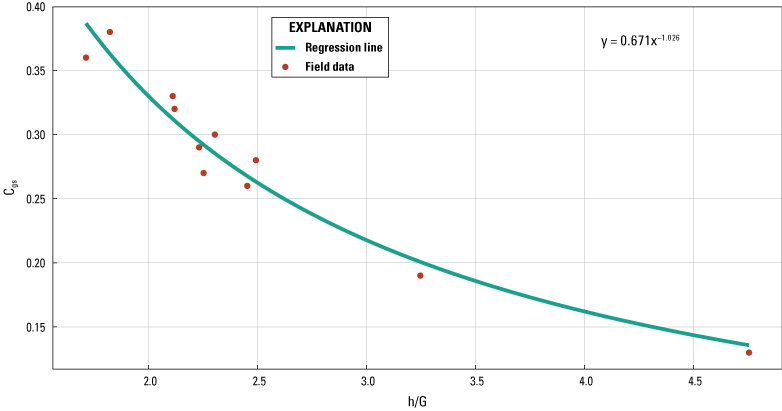
Submerged orifice flow discharge coefficient, Cgs, calibration plot. Cgs, discharge coefficient for submerged orifice flow; h/G, ratio of tail water to gate opening.
Table 4.
Submerged orifice flow regression statistics.[SE, standard error; RSS, residual sum of squares; RSE, residual standard error; t value, ratio of difference between mean of sample sets and variation that exists within sample sets; Pr(>|t|), p-value associated with t value; %, percent; NA, not applicable]
Preliminary Model Results Relating Gate Operation to Water Level and Discharge
The summer and winter models were developed to mimic the volume of flow that would have passed through the old control structure and follow the 1991 interim management plan (U.S. Army Corps of Engineers, 1999). The total target discharge column of tables 5 and 6 reflects how much water was moving through the old structure at each lake level. The last column of both tables lists the expected water level downstream without backwater effects.
Table 5.
Preliminary summer gate operation model for gates 3 and 4.[Water levels are in feet above the North American Vertical Datum of 1988; ft, foot; NAVD 88, North American Vertical Datum of 1988; ft3/s, cubic foot per second]
Table 6.
Preliminary winter gate operation model for gates 3 and 4.[Water levels are in feet above the North American Vertical Datum of 1988; ft, foot; NAVD 88, North American Vertical Datum of 1988; ft3/s, cubic foot per second]
The summer operation model (table 5) is based on operation of the gates above the lake level of 282.7 ft above NAVD 88. At 282.8 ft above NAVD 88, a total target discharge of 966 ft3/s was determined to be the amount of discharge moving through the old structure if all stop logs were removed. To move 966 ft3/s of water through the new structure, at a lake level of 282.8 ft above NAVD 88, the two center gates can be opened to 2.18 ft, in which 108 ft3/s of the total discharge is expected to pass over the stop-log weirs of the outer bays. At this gate height, flow conditions are expected to be transitional, moving from free to submerged. Based on the rating of the Running Reelfoot Bayou gage (site 07027005), the tail-water elevation is expected to be 279.64 ft above NAVD 88.
To approximate the behavior of free flow through the old structure between water levels of 282.3 and 282.7 ft above NAVD 88, when all 20 stop logs were down, the total target discharge was determined to range from 126 to 358 ft3/s. According to the summer model, at a lake level of 282.3 ft above NAVD 88, if 7 ft3/s is passing over the outer stop-log weirs of the new structure, the gates can be raised 0.25 ft to release an additional discharge of 119 ft3/s, thereby reaching the target discharge of 126 ft3/s.
The winter operation model (table 6) was based on historical flow through the old structure and the 1991 interim water level management plan. At 283.3 ft above NAVD 88, if the gates are raised to 4.90 ft, a discharge of 1,128 ft3/s will be passing through the gates and 267 ft3/s will be flowing over the outer weirs, which approximates a total discharge of 1,395 ft3/s. At this gate opening height, flow through the structure is expected to be transitional, reaching submerged conditions at a gate opening of 5.16 ft and lake level of 283.5 ft above NAVD 88. This model also includes gate openings for water levels between 282.3 and 282.7 ft above NAVD 88 with total target discharge, in free flow conditions, ranging from 126 to 741 ft3/s.
Gate Operations
Gate operational data were provided by the USFWS (Heal and Diehl, 2022) and compared with USGS incremental encoder data (U.S. Geological Survey, 2019). The period of data from February 12, 2019, through April 8, 2019, can be disregarded in relation to gate operations because the gates were lifted completely out of the water to relieve flood conditions. In figure 21, the gate opening was recalculated to reflect the elevation of the bottom of the gate to illustrate the water-level relationship between Reelfoot Lake and Running Reelfoot Bayou. After each gate operation, it was observed that the water level in Running Reelfoot Bayou took approximately 24 hours to reach steady-state conditions. Most of the time, the tail water was above the bottom of the gate, suggesting submerged conditions after reaching a steady state.
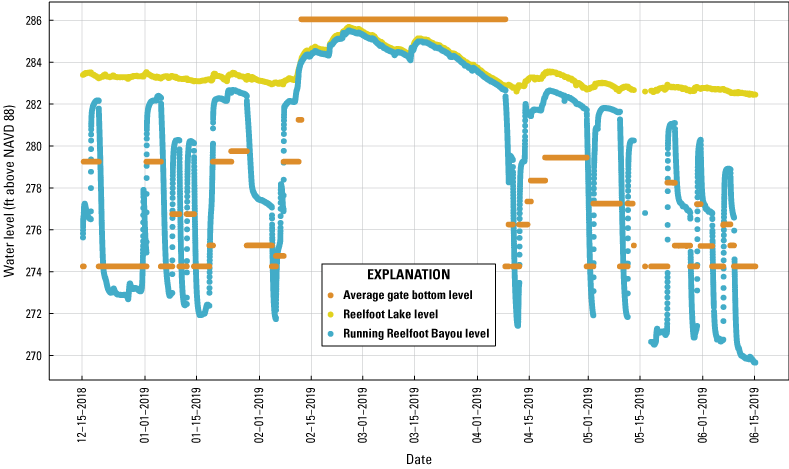
Lake level and Running Reelfoot Bayou level in relation to gate operations from December 15, 2018, to June 15, 2019. ft, foot; RRB, Running Reelfoot Bayou; NAVD 88, North American Vertical Datum of 1988.
Variable Backwater
At times, Running Reelfoot Bayou is affected by variable backwater occurring after rain events. Tributary drainage enters the bayou, raises its water level, and thereby reduces flow velocity at the downstream gage (fig. 22). At 10 a.m. on March 10, 2020, gates 3 and 4 were opened 2 ft in response to rising lake level caused by precipitation beginning on March 9 and continuing intermittently throughout the month (fig. 22). When precipitation occurred for a short period on March 11, 2020, with no changes in gate level, the water level in Running Reelfoot Bayou rose while flow velocity initially spiked and then decreased (fig. 23).
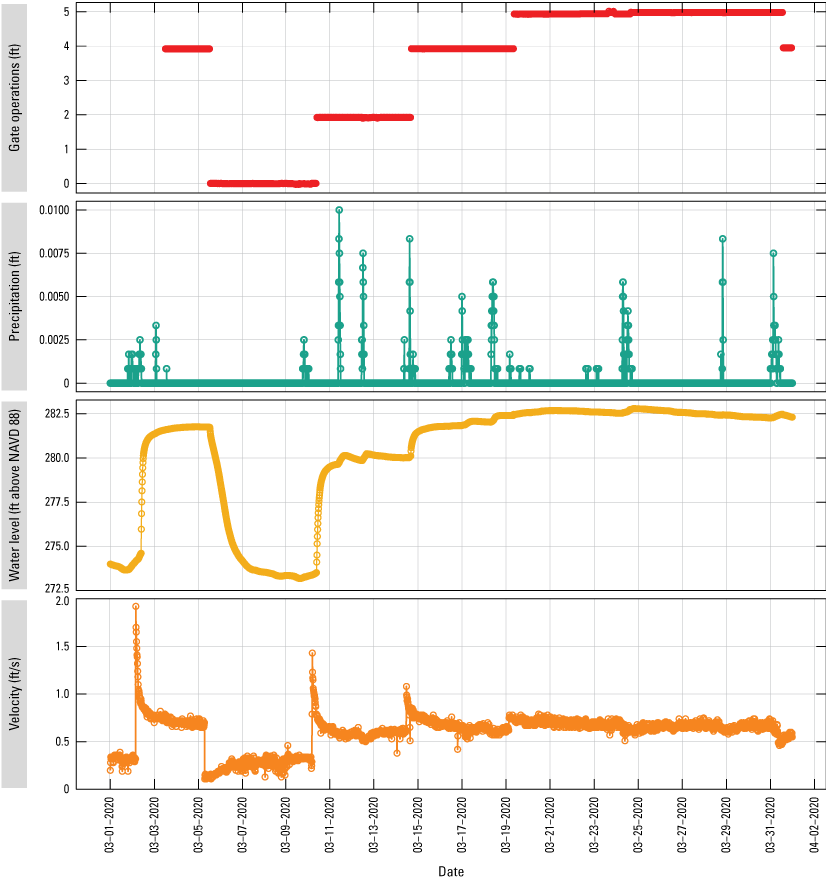
Precipitation for March 2020 (sites 07027000, 07027003, and 07027005; U.S. Geological Survey, 2019; Heal and Diehl, 2022). ft, foot; ft/s, foot per second; NAVD 88, North American Vertical Datum of 1988.
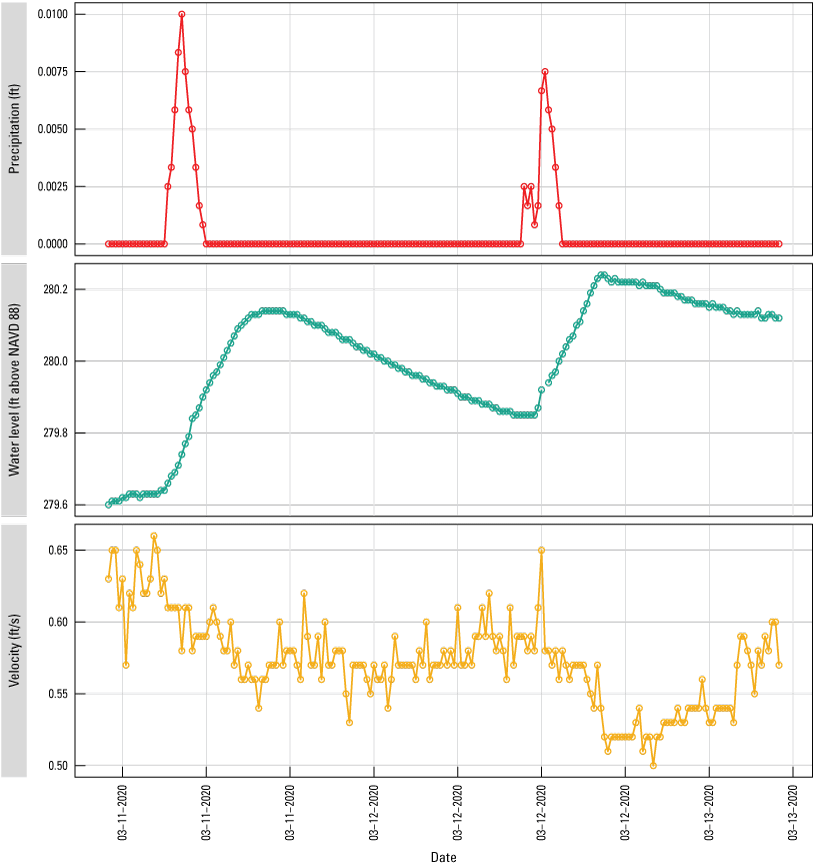
Precipitation for March 11–13, 2020 (sites 07027000 and 07027005; U.S. Geological Survey, 2019; Heal and Diehl, 2022). ft, foot; ft/s, foot per second; NAVD 88, North American Vertical Datum of 1988.
Weir Leakage
Based on the volumetric method, the total leakage through the four weirs (1, 2, 5, and 6) was about 3 ft3/s. Stop-log weir 2 had the highest amount of leakage at 2.7 ft3/s (table 7). Leakage through weir 1 appeared to be similar in flow to weir 6 but could not be measured because the gate in this bay leaked as much as the stop-log weir. This created a steady-state flow condition in which the water level did not rise between the weir and the gate.
Conclusions
The new control structure provides the opportunity to control discharge at a more precise level than the old structure. The vertical lift gates can release a higher level of discharge into Running Reelfoot Bayou and weir leakage is significantly lower. During gate operations, the water level of Running Reelfoot Bayou changes rapidly, which creates unsteady conditions. It was observed that the water level at the downstream gage, located about 1,740 feet from the control structure, takes approximately 24 hours to reach steady-state conditions. During this 24-hour period, after the gates are opened, the tail water is above the bottom of the gates, suggesting submerged conditions before a steady state. For future analysis of the relationship between rated discharge and actual discharge during this 24-hour period, instantaneous velocity data were collected from the acoustic Doppler current profiler, which is located at the downstream gage. Abnormalities associated with the old structure, such as skewed inflow and the complex shape of the weir crest, caused the calculated coefficients of discharge for the structure to be low in comparison to theoretical reference values.
References Cited
Baty, F., Ritz, C., Charles, S., Brutsche, M., Flandrois, J.P., and Delignette-Muller, M.L., 2015, A toolbox for nonlinear regression in R—The package nlstools: Journal of Statistical Software, v. 66, no. 5, p. 1–21, accessed August, 12, 2019, at https://doi.org/10.18637/jss.v066.i05.
Defina, A., and Susin, F., 2003, Hysteretic behavior of the flow under a vertical sluice gate: Physics of Fluids, v. 15, no. 9, p. 2541–2548, accessed September 16, 2019, at https://doi.org/10.1063/1.1596193.
Dickinson, W.T., 1967, Accuracy of discharge determinations: Fort Collins, Colo., Colorado State University Hydrology Papers, no. 20, 62 p. [Also available at https://mountainscholar.org/bitstream/handle/10217/61300/HydrologyPapers_n20.pdf?sequence=1.]
Heal, E.N., and Diehl, T.H., 2022, Preliminary model data for lake level gate operation and discharge at Reelfoot Lake—Tennessee and Kentucky: U.S. Geological Survey data release, https://doi.org/10.5066/P9GY1UF4.
Horton, R.E., 1907, Weir experiments, coefficients, and formulas: U.S. Geological Survey Water-Supply and Irrigation Paper 200, Series M, General Hydrographic Investigations 24, 235 p. [Also available at https://pubs.usgs.gov/wsp/0200/report.pdf.]
Murphy, E.C., 1904, Accuracy of stream measurements (2d ed.): U.S. Geological Survey Water-Supply and Irrigation Paper No. 95, Series M, General Hydrographic Investigations 10, 162 p. [Also available at https://books.google.com/books?id=_25MAAAAYAAJ&pg=RA6-PA72&lpg=RA6-PA72&dq=weir+rating+percent+variation&source=bl&ots=1CIe09cfOj&sig=ACfU3U0NMv6VXYaCmhAdZJZS4oZxOlWk7A&hl=en&sa=X&ved=2ahUKEwj6v7SE1MXoAhUIG80KHfdUAY0Q6AEwCnoECAcQAQ#v=onepage&q=weir%20rating%20percent%20variation&f=false.]
R Core Team, 2019, R—A language and environment for statistical computing: Vienna, Austria, R Foundation for Statistical Computing, accessed August 12, 2019, at https://www.R-project.org/.
Said, A., 2015, The coefficient of broad-crested weir in natural channels: International Journal of Science and Engineering Invention, v. 1, no. 1, 14 p., accessed September 28, 2017, at http://ijsei.in/index.php/ijsei/issue/view/1.
Sauer, V.B., and Turnipseed, D.P., 2010, Stage measurement at gaging stations: U.S. Geological Survey Techniques and Methods, book 3, chap. A7, 45 p. [Also available at https://doi.org/10.3133/tm3A7.]
Tillis, G.M., and Swain, E.D., 1998, Determining discharge-coefficient ratings for selected coastal structures in Broward and Palm Beach Counties, Florida: U.S. Geological Survey Water-Resources Investigations Report 98–4007, 37 p. [Also available at https://pubs.er.usgs.gov/publication/wri984007.]
Tracy, H.J., 1957, Discharge characteristics of broad-crested weirs: U.S. Geological Survey Circular 397, 15 p. [Also available at https://pubs.usgs.gov/circ/1957/0397/report.pdf.]
Turnipseed, D.P., and Sauer, V.B., 2010, Discharge measurements at gaging stations: U.S. Geological Survey Techniques and Methods, book 3, chap. A8, 87 p. [Also available at https://pubs.usgs.gov/tm/tm3-a8/.]
U.S. Geological Survey, 2019, USGS water data for the Nation: U.S. Geological Survey National Water Information System database, accessed July 9, 2019, at https://doi.org/10.5066/F7P55KJN.
Conversion Factors
U.S. customary units to International System of Units
Datum
Vertical coordinate information is referenced to the North American Vertical Datum of 1988 (NAVD 88).
Horizontal coordinate information is referenced to the North American Datum of 1983 (NAD 83).
Elevation, as used in this report, refers to distance above the vertical datum.
For more information about this publication, contact
Director, Lower Mississippi-Gulf Water Science Center
U.S. Geological Survey
640 Grassmere Park, Suite 100
Nashville, TN 37211
For additional information, visit
https://www.usgs.gov/centers/lmg-water/
Publishing support provided by
Lafayette Publishing Service Center
Suggested Citation
Heal, E.N., Diehl, T.H., and Garrett, J.W., 2022, Preliminary models relating lake level gate operation and discharge at Reelfoot Lake in Tennessee and Kentucky: U.S. Geological Survey Open-File Report 2022–1073, 27 p., https://doi.org/10.3133/ofr20221073.
ISSN: 2331-1258 (online)
Study Area
| Publication type | Report |
|---|---|
| Publication Subtype | USGS Numbered Series |
| Title | Preliminary models relating lake level gate operation and discharge at Reelfoot Lake in Tennessee and Kentucky |
| Series title | Open-File Report |
| Series number | 2022-1073 |
| DOI | 10.3133/ofr20221073 |
| Year Published | 2022 |
| Language | English |
| Publisher | U.S. Geological Survey |
| Publisher location | Reston VA |
| Contributing office(s) | Lower Mississippi-Gulf Water Science Center |
| Description | Report: vii, 27 p.; Data Release; Database |
| Country | United States |
| State | Kentucky, Tennessee |
| Other Geospatial | Reelfoot Lake |
| Online Only (Y/N) | Y |
| Google Analytic Metrics | Metrics page |