

Summary of Extreme Water-Quality Conditions in Upper Klamath Lake, Oregon, 2005–19
Links
- Document: Report (6.5 MB pdf) , HTML , XML
- Download citation as: RIS | Dublin Core
Abstract
This study used the complete set of continuous water-quality (WQ) data and discrete measurements of total ammonia collected by the U.S. Geological Survey from 2005 to 2019 at the four core sites in Upper Klamath Lake, Oregon, to examine relations between variables and extreme conditions that may be harmful for endemic Lost River suckers (Deltistes luxatus) and shortnose suckers (Chasmistes brevirostris). Several graphical and tabular approaches were used to compare variables, sites, and years to better understand the factors contributing to and timing of extreme WQ in the lake. Extreme WQ thresholds were defined as the 1st or 99th percentiles of the daily average dataset of water temperature, pH, and dissolved oxygen (DO) concentration, and the weekly estimated un-ionized ammonia (NH3) from 2005 to 2019. Extreme WQ days were defined as those when at least 12 hours of measurements exceeded the extreme WQ threshold. The core site at Mid-Trench, which was also the deepest measurement site with a full-pool depth of 15 meters and at which water-quality sondes were deployed at the top and bottom of the water column, had the most extreme conditions of high water temperature, low DO, and high NH3. The upper sonde at Mid-Trench represented 40 percent of all days of extremely high water temperature (days with at least 12 hours exceeding 24.38 degrees Celsius) in the lake and 71 percent of all weekly estimates of extremely high NH3 (greater than 264 micrograms per liter) in the lake. The lower sonde at Mid-Trench represented 85 percent of all days of extremely low DO (days with at least 12 hours of DO concentrations less than 1.76 milligrams per liter) in the lake. In each of the study years, poor water quality at Mid-Trench, as represented by several metrics, lasted for multiple days. The shallowest site at the Williamson River outlet represented 54 percent of all days of extremely high pH (days with at least 12 hours of pH measurements exceeding 10.04) in the lake. The seasonality of extreme WQ during the summer sampling period (limited to June through September) was evaluated and most days of extremely high water temperature (83 percent) and extremely high pH (54 percent) occurred in July, whereas most days of extremely low DO (57 percent) and extremely high NH3 (57 percent) occurred in August. The years with the most days of extreme WQ accumulated for all variables (high water temperature, low DO, high pH, and high NH3) were 2012–15 and 2017, which all occurred in the latter half of the study period. The years with the fewest accumulated days of extreme WQ were 2010 and 2011.
Introduction
Water quality (WQ) in Upper Klamath Lake, Oregon, has declined during the past century following European settlement and activities on surrounding lands. This decline has included progressive eutrophication and the annual occurrence of massive cyanobacterial blooms dominated by Aphanizomenon flos-aquae (AFA) (Bradbury and others, 2004; Eilers and others, 2004). The temperature and nutrient-driven seasonal cycle of the cyanobacteria blooms has regularly led to extreme WQ conditions in Upper Klamath Lake during parts of the summer season. The annual cycle included rapid algal growth as temperatures increased in early summer, which led to increased pH and dissolved oxygen (DO) owing to photosynthesis. These increases were followed by a mid-summer “bloom crash,” which led to decreased pH and DO and increased un-ionized ammonia (NH3) concentrations owing to decomposition of cyanobacteria (Wood and others, 2006). The mid-summer crash often was followed by a second peak in growth, with increased pH and DO into autumn (Bortleson and Fretwell, 1993; Kann and Smith, 1999; Hoilman and others, 2008; Lindenberg and others, 2008; Kannarr and others, 2010). Extreme WQ conditions tended to occur from late June to August, with the highest water temperatures measured in July, the highest pH measured in June and July during the first bloom peak, and the lowest DO measured in July and August around the timing of the bloom crash. The highest NH3 estimates from weekly measurements occurred in July and August. The cyanobacteria bloom cycle, lake-surface elevation, and meteorological factors have contributed to extreme WQ conditions in Upper Klamath Lake (Morace, 2007; Jassby and Kann, 2010; Kann and Walker, 2020), which could have a detrimental effect on the sucker species endemic to the lake (Burdick and others, 2020b).
Sucker populations have decreased substantially during the past two decades because of lack of recruitment of juveniles into adult spawning populations (Burdick and Martin, 2017; Hewitt and others, 2018). Sucker larvae are spawned in spring (April–June) in the Williamson River upstream from Upper Klamath Lake, and at the western and eastern shoreline springs, and are transported into the lake through several pathways, including the recently restored Williamson River Delta (Wood and others, 2014). Poor WQ in the lake contributes to chronic stress in juveniles that could lead to increased mortality, although the exact mechanism is not fully understood (Hereford and others, 2019; Burdick and others, 2020a; Burdick and others, 2020b). Saiki and others (1999) evaluated the lethal concentrations (LC50) for larval (35-day-old) and juvenile (3–7-month-old) Lost River suckers (Deltistes luxatus) and shortnose suckers (Chasmistes brevirostris) exposed to multiple WQ parameters and determined the following mean LC50 ranges after 24 hours (the time period during which more than half of the fish died):
-
pH greater than 10.38–10.96,
-
NH3 greater than 510–1,290 micrograms per liter (μg/L),
-
water temperature greater than 30.76–31.93 degrees Celsius (°C), and
-
DO less than 1.14–2.01 milligrams per liter (mg/L).
In parts of Upper Klamath Lake, WQ conditions driven by the cyanobacteria bloom cycle have exceeded the extreme lethal thresholds of DO concentration and pH for several hours at a time, but only DO at the lower sonde of the Mid-Trench site has been documented to last as long as the 24 hour LC50 values determined by Saiki and others (1999).
Other aspects of the Upper Klamath Lake system that can affect extreme WQ conditions and sucker survival include lake-surface elevation, river discharge, and lake circulation patterns. Low lake-surface elevation limits the availability of shoreline spawning areas (Burdick and others, 2015) and reduces accessibility to the Williamson River Delta, a larval sucker habitat and refuge (Wood and others, 2014). Lake-surface elevation has also been hypothesized to affect WQ conditions in the lake (Kann and Walker, 2020). The combination of lake-surface elevation, river discharge, and wind-driven currents could affect the dispersal of larval suckers from spawning areas during spring (Wood, 2012). Lake circulation could also affect larval suckers by transporting water of harmful quality (depleted of DO) into habitat areas. Prevailing wind conditions (northwest) create a clockwise current in the main lake and water flowing through the deepest trench (where extremely low DO often is measured following a bloom crash) is preferentially routed to the northwestern part of the lake whereas water nearer the surface is preferentially routed south (Wood and others, 2006, 2008). In 2005, low DO percent saturation first measured in the trench contributed to decreases in DO saturation 2–4 days later in Shoalwater Bay and Ball Bay that were not apparent at the northwestern core site, Mid-North (fig. 1) (Hoilman and others, 2008). Hydrodynamic simulations also showed that the current in the deep trench could stall and even reverse when winds blew opposite to the prevailing direction (southwest) for at least a day (Wood and others, 2008). These studies showed the capability of lake circulation to distribute water from the deep trench, which could be depleted of DO, to shallower parts of the lake that provide habitat and refuge.
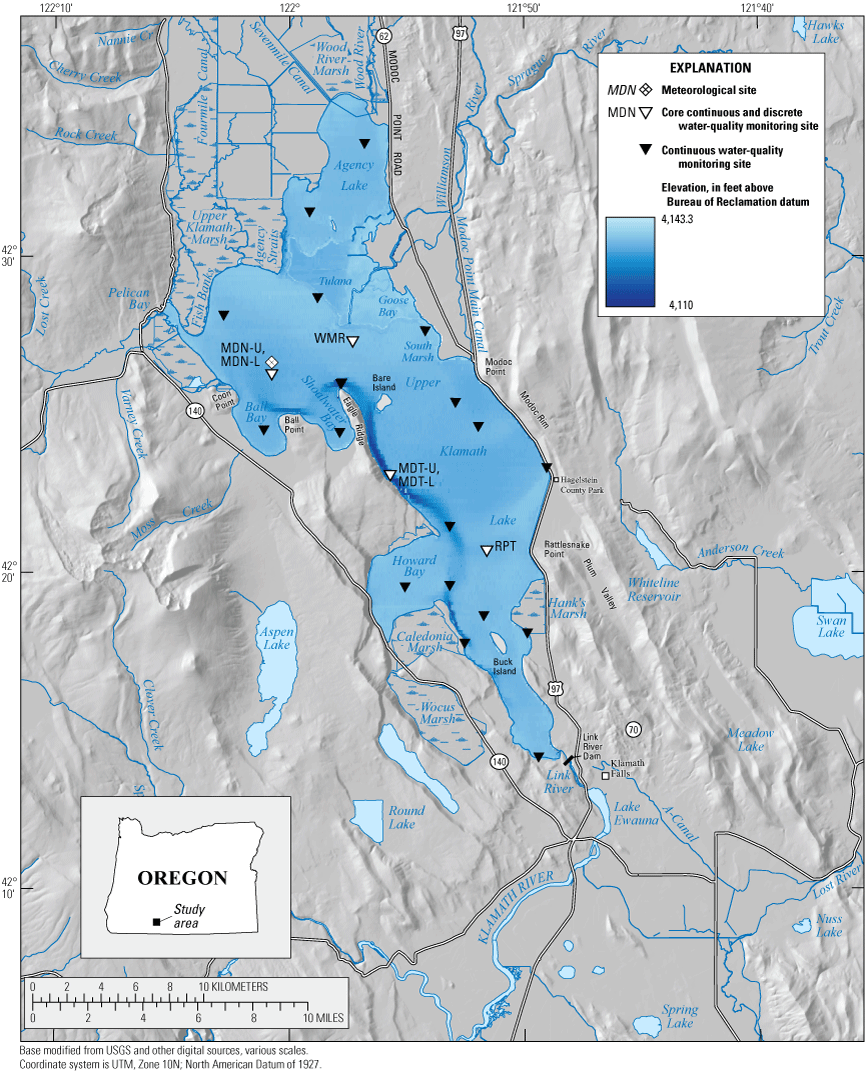
Continuous and discrete water-quality monitoring sites at which U.S. Geological Survey water-quality data used in this study were collected, Upper Klamath Lake, Oregon, 2005–19.
Purpose and Scope
WQ data have been collected biweekly in Upper Klamath Lake by the Klamath Tribes (Klamath Tribes, 2006) since the early 1990s and continuously with weekly sampling by the U.S. Geological Survey (USGS) since 2002 when monitoring stations were first placed in the northern part of the lake (Wood and others, 2006). The USGS monitoring program expanded to be lake-wide in 2005 (Hoilman and others, 2008), when WQ sondes still in operation today were installed at the four core continuous monitoring sites (fig. 1). Previous studies examined the status and trends of WQ in Upper Klamath Lake from the available data (Jassby and Kann, 2010; Eldridge and others, 2014) and determined that continued long-term monitoring would be necessary to identify statistically significant trends in extreme water quality that could be harmful to fish health. For this study, relations between the continuous WQ and discrete ammonia measurements from the four core USGS sites during 2005–19 were examined graphically to visualize the spatial and temporal characteristics of extreme WQ in Upper Klamath Lake. This study does not examine the long-term trends of extreme WQ in Upper Klamath Lake nor does it incorporate fish health or population data from Upper Klamath Lake.
Methods
The water-quality (WQ) data used in this study were collected using YSI model 600XLM, 6920, or 6600 continuous multiparameter water-quality monitors (sondes; U.S. Environmental, Waltham, Massachusetts) during 2005 to 2014 and EXO2 during 2015 to 2019 at the four core monitoring sites in Upper Klamath Lake managed by the USGS (U.S. Geological Survey, 2021): (1) Upper Klamath Lake at Williamson River outlet (WMR), (2) Rattlesnake Point (RPT), (3) Mid-North upper and lower (MDNU and MDNL), and (4) Mid-Trench upper and lower (MDTU and MDTL) (table 1) (Wagner and others, 2006; Hoilman and others, 2008; Lindenberg and others, 2008; Kannarr and others, 2010; Eldridge and others, 2012). The sondes were placed 1 meter (m) from the lake bottom for all four sites and a second sonde was placed 1 m from the surface at the two deepest sites, Mid-North and Mid-Trench. The measured WQ variables included water temperature (WT), DO, pH, and specific conductance (SC) that were collected hourly during the 2005–18 field season, which typically lasted from May to October, and half-hourly during the 2019 field season.
Table 1.
U.S. Geological Survey continuous and discrete monitoring sites used for analysis, Upper Klamath Lake, Oregon (U.S. Geological Survey, 2021).[Continuous water-quality monitors provide water temperature, dissolved oxygen, pH, and specific conductance data. Abbreviations: bws, below water surface; NA, Not applicable; USGS, U.S. Geological Survey]
Dissolved nutrient samples, which were analyzed for total ammonia (NH3 + ammonium ion [NH4+]) among others, were collected weekly at the core sites, typically between hours of 9 a.m. to 2 p.m., following established sampling and quality control protocols provided in the National Field Manual for the Collection of Water-Quality Data (U.S. Geological Survey, variously dated). At the Mid-North sites, samples were collected at the mid-point between the upper and lower sondes; however, at the Mid-Trench sites, samples were collected near both the upper and lower sonde locations. Samples for dissolved nutrient analysis were collected by lowering a hose to the appropriate depth and using a peristaltic pump to pass the sample through a 0.45-micrometer capsule filter (Hoilman and others, 2008; Lindenberg and others, 2008; Kannarr and others, 2010; Eldridge and others, 2012).
Lake-surface elevation data were collected at four sites at a 15- to 30-minute interval by USGS from 2005 to 2019 and spatially averaged to produce a continuous Upper Klamath Lake lake-surface elevation set (table 1). Before 2016, the elevation was calculated as the weighted average of sites Rocky Point (full weight), Rattlesnake Point (full weight), and near Klamath Falls (half weight) when all three sites were available, or from the secondary equation mean of Rocky Point and Rattlesnake Point (M. Erickson and M. Stewart, U.S. Geological Survey, written commun., 2021). Starting in 2016, the elevation was calculated as the weighted average of sites Rocky Point (full weight), Rattlesnake Point (full weight), near Klamath Falls (half weight), and Agency Lake (half weight; M. Erickson and M. Stewart, U.S. Geological Survey, written commun., 2021). All processing of data and graphics was done using R programming language and software (R Core Team, 2021).
Processing Continuous Data
The continuous WQ data were interpolated to an hourly time step filling gaps of 2 hours or less. Daily WQ time series were created by averaging hourly values for each day. Days with data gaps larger than 2 hours were set to not applicable for the daily set. The same process was used for the continuous lake-surface elevation data to produce hourly and daily sets. The daily average datasets will be referred to as WTavg, pHavg, DOavg, SCavg, and ELEVavg. Some analyses considered deviations in WQ and lake-surface elevation from expected values by calculating the difference between daily average values and Julian day average values. The daily deviation datasets will be referred to as WTdev, pHdev, DOdev, SCdev, and ELEVdev.
Calculating Un-Ionized Ammonia
U.S. Environmental Protection Agency (2013) outlined that nutrients directly contributing to fish toxicity included the un-ionized fraction of ammonia (NH3). NH3 concentrations in Upper Klamath Lake were calculated from in-lake measurements of total ammonia (NH3 + NH4+), water temperature, and pH by the following relations (Emerson and others, 1975):
where-
pKa is the ionization constant of the ammonium ion;
-
WThourly is the hourly water temperature in degrees Celsius;
-
fNH3 is the NH3 fraction from total ammonia; and
-
pHhourly is the hourly pH in standard units.
Total ammonia measurements were collected weekly at each core site for the period of record, so NH3 was calculated for the times when measurements were available. The approximately weekly time series of NH3 was created by applying the calculated hourly fraction of NH3 (fNH3) closest to the time of sample collection to the measured total ammonia for sites WMR, RPT, MDTU, and MDTL. For site Mid-North, where total ammonia samples were collected in the middle of the water column and were assumed constant throughout the water column, NH3 was only calculated for the upper site (MDNU) because higher water temperatures and pH values were measured at the upper sonde compared to the lower sonde and would result in higher fractions of NH3. Using the higher fractions of NH3 from the upper site would provide the upper end of concentrations for this site.
Extreme Water-Quality Days
Days with persistent conditions of extreme and potentially harmful WQ were identified over the study period. Extreme WQ days based on continuous data were defined as those during which at least 12 hours of measurements exceeded, or were less than in the case of DO, an extreme and potentially harmful WQ threshold. These days will be referred to as WText, pHext, and DOext. For NH3, extreme WQ days were defined as those days during which the weekly estimated NH3 concentration exceeded the extreme WQ threshold.
Statistically extreme WQ thresholds were calculated from the combined WTavg, pHavg, and DOavg time series for all core monitoring sites from 2005 to 2019. For water temperature and pH, which can be harmful to fish at higher values, the extreme WQ threshold was calculated as the 99th percentile of the long-term daily averages with values of 24.38 °C for water temperature and 10.04 standard units for pH (table 2). For DO, which can be harmful to fish at lower values, the extreme WQ threshold was calculated as the 1st percentile of the long-term daily average concentration at a value of 1.76 mg/L (table 2). An extreme WQ threshold also was calculated for NH3, which can be harmful to fish at high concentrations, from the combined weekly set of NH3 estimated from weekly measured total ammonia at the core sites from 2005 to 2019. The 99th percentile of the long-term weekly NH3 set was 264 μg/L (table 2).
Table 2.
Lethal thresholds of water quality for Lost River and shortnose suckers at 24-hour exposure from Saiki and others (1999) and the 99th and 1st percentile levels calculated from daily average or weekly estimated data, Upper Klamath Lake, Oregon, 2005–19.[Abbreviations: >, greater than; <, less than]
Graphical and Tabular Data Summary
This study focused on graphical representations and tabular summaries of data using R (Wickham, 2016; R Core Team, 2021) to examine relations between WQ variables and better understand the drivers of extreme water quality. The non-parametric Spearman rank correlation (ρ) was used to evaluate the magnitude of relations between datasets and a significance level (α) of 0.05 was used to reject the null hypothesis that ρ was not significantly different than zero. Daily average and hourly values of water temperature, pH, DO, and SC, and weekly estimates of NH3 from the four core sites in Upper Klamath Lake from 2005 to 2019 were considered. Most data were collected from June to September; however, in some years, data collection included parts of May, October, and November (fig. 2). For some analyses, WQ variables were considered with respect to daily average lake-surface elevation, which had a consistent seasonal pattern throughout the study period (fig. 3). One analysis used deviations from expected values of data that were created by subtracting the Julian day average values, calculated from 2005 to 2019, from the daily average values on matching Julian days. The graphical representations included the following:
-
Comparisons of daily average WQ. Compared daily average values of multiple combinations of WQ variables in a scatter plot with points color-coded by month to visualize variable relations and seasonal groupings.
-
Distribution of daily average WQ with respect to daily average lake-surface elevation. Developed boxplot distributions for each WQ variable with respect to daily average lake-surface elevation (1.0-ft [foot] bins) and color-coded by month to visualize the distribution of data and extreme WQ conditions with respect to season. Boxplot boxes had variable widths reflecting the number of observations in each group and boxes encompassed the interquartile range (IQR), with whiskers to 1.5 times the IQR and outliers mapped as points outside that range.
-
Distribution of deviations in WQ with respect to deviations in lake-surface elevation. Developed boxplots of deviations in daily average values of WQ variables from Julian Day average values with respect to deviations in daily average lake-surface elevation from Julian Day average values to visualize relations. Elevation bins were set to 1.0-ft (0.30 m) increments.
-
Comparisons of WQ averages and extremes to lake-surface elevation and Julian day. Created scatter plots that compared daily average lake-surface elevation to Julian day with points color-coded by both the daily average value of each WQ variable and the daily total hours exceeding the extreme WQ threshold for each core site. The plots were used to visualize seasonal and spatial patterns of extreme WQ conditions that could potentially affect fish health.
-
Distribution of NH3 with respect to year. Developed boxplot distributions of weekly estimated NH3 with respect to year and color-coded by site to visualize trends in concentration and spatial variability.
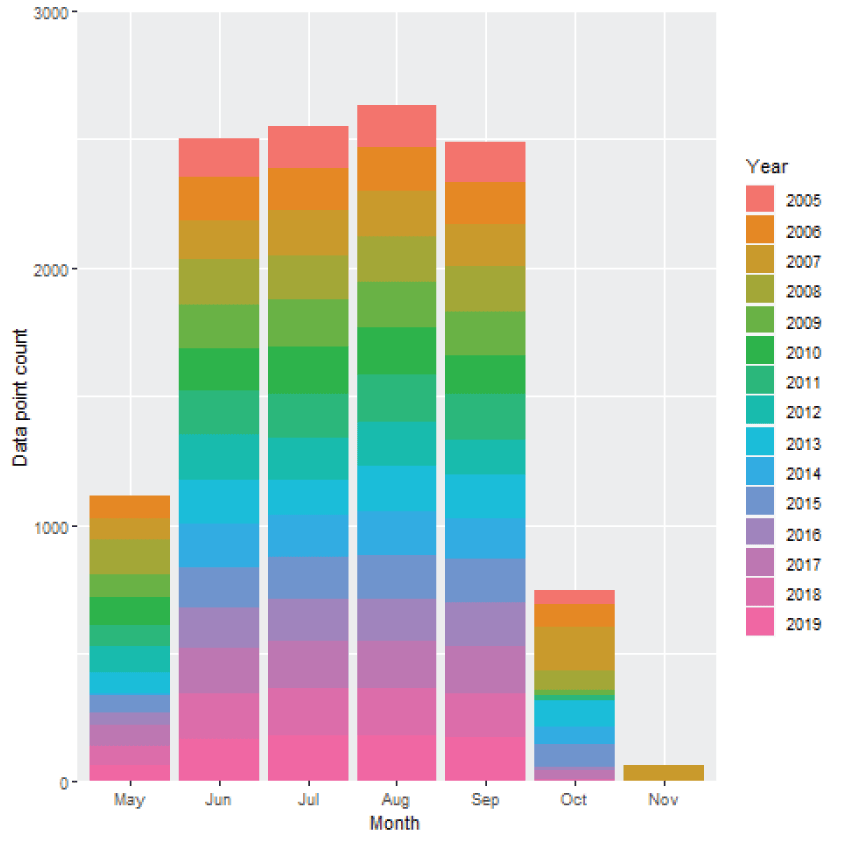
Days with measured water quality at core monitoring sites used in the graphical summary, organized by month and color-coded by year, Upper Klamath Lake, Oregon, 2005–19.
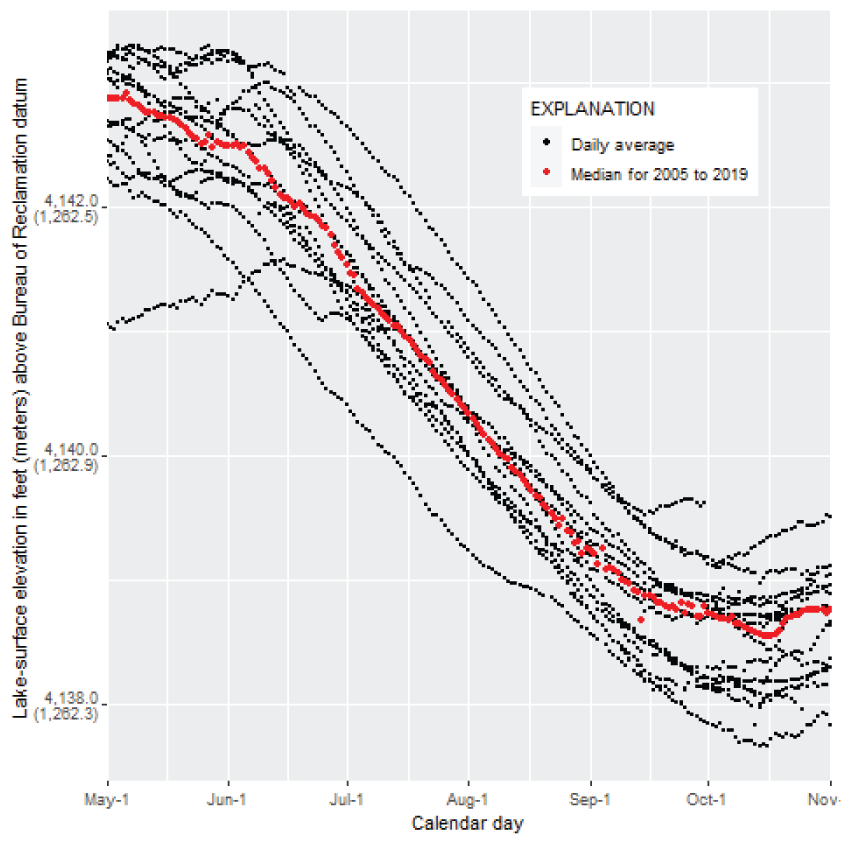
Daily average lake-surface elevation with respect to Julian day, Upper Klamath Lake, Oregon, 2005–19.
Findings
The specific findings associated with the five graphical analyses used to evaluate the extremes in long-term continuous and discrete water-quality (WQ) data are detailed in each section. Tabular analyses that compared sites, seasons, and years complemented the graphical findings.
Comparisons of Daily Average Water Quality and Extreme Water-Quality Days
The combined WTavg and DOavg for the core monitoring sites had a weak, negative relation (ρ = -0.21 [p< .001]), where the lowest DOavg (< 1.76 mg/L) occurred in July and August (fig. 4A) when WTavg was high (> 20 °C); however, many days showed that high DOavg co-occurred with high WTavg. July and August also had the most days of extreme water temperature and DO (table 3). DOavg and pHavg had a weak, positive relation (ρ = 0.38 [p < .001]; fig. 4B) where the highest pHavg values (> 10.04) occurred with high DOavg values (> 10 mg/L) and the lowest DOavg values (< 1.76 mg/L) occurred with pHavg values that ranged from 7 to 9.25.
Table 3.
Occurrences of extreme water-quality days by month at the core monitoring sites, Upper Klamath Lake, Oregon, 2005–19.[Abbreviations and symbols: DO, dissolved oxygen; °C, degrees Celsius; µg/L, micrograms per liter; mg,/L, milligrams per liter; >, greater than; <, less than]
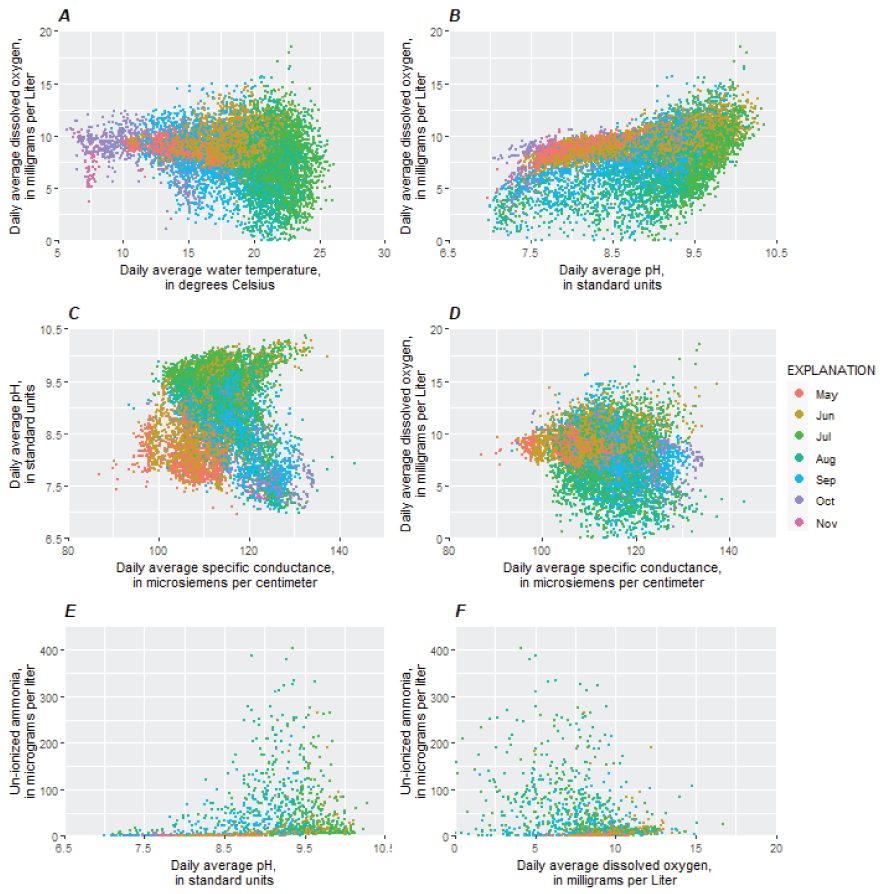
Comparisons of (A) daily average water temperature and daily average dissolved oxygen concentration (DO), (B) daily average pH and daily average DO, (C) daily average specific conductance and daily average pH, (D) daily average specific conductance and daily average DO, (E) average pH and estimated un-ionized ammonia (NH3) on weekly measurement dates, and (F) daily average DO and estimated NH3 on weekly measurement dates, collected from the four core monitoring stations in Upper Klamath Lake, Oregon, 2005–19. Daily averages were calculated from hourly continuous measurements.
SCavg had negligible relations with pHavg (ρ = –0.03 [p < .001]) and DOavg (ρ = –0.16 [p < .001]) during the complete sampling season (fig. 4C, 4D); however, seasonal relations were considered. The lowest SCavg values occurred earlier in the sampling season and in May and June, SCavg had a weak, positive relation with both pHavg (ρ = 0.34 [p < .001]) and DOavg (ρ = 0.22 [p < .001]). The highest SCavg concentrations (> 120 microsiemens per centimeter [μS/cm]) occurred in all sampling months and corresponded to a range of pHavg values and DOavg concentrations. The pHavg values that corresponded to high SCavg concentrations had a bimodal distribution wherein one group of values clustered above a pHavg of 9.0 (with a median pHavg of 9.7) and were measured in June through August, and the second group of values clustered below a pHavg of 9.0 (with a median pHavg of 7.8) and were measured predominantly in September and October. In September and October, SCavg had a moderate, negative relation with both pHavg (ρ = –0.56 [p < .001]) and DOavg (ρ = –0.44 [p < .001]).
Weekly estimated NH3 had a moderate, positive relation with pHavg (ρ = 0.53 [p < .001]), which was one of the variables used in its calculation, and a weak, negative relation with DOavg (ρ = –0.24 [p < .001]; fig. 4E, 4F). The highest concentrations of NH3 (> 264 μg/L) mostly occurred in July and August (table 3), with pH ranging from 8.8 to 9.8 and DO ranging from 4.1 to 9.4 mg/L.
Distribution of Water Quality with Respect to Lake-Surface Elevation and Month
Daily average lake-surface elevation (ELEVavg) in Upper Klamath Lake had a consistent seasonal pattern throughout the summer sampling period from 2005 to 2019. ELEVavg were highest in May, averaging 4,142.7 ft (1,262.7 m), and steadily decreased until October when elevation stabilized to an average 4,138.7 ft (1,261.5 m; fig. 3).
The distribution of WTavg with respect to ELEVavg and month had a seasonal pattern wherein temperatures increased through July as lake-surface elevation decreased, then decreased through the end of the sampling period as lake-surface elevation decreased (fig. 5A). The highest WTavg occurred in July and August, when ELEVavg was 4,139.5– 4,141.5 ft (1,261.7–1,252.3 m), and 60 days of WText were measured in July, from 2005 to 2019 (table 3).
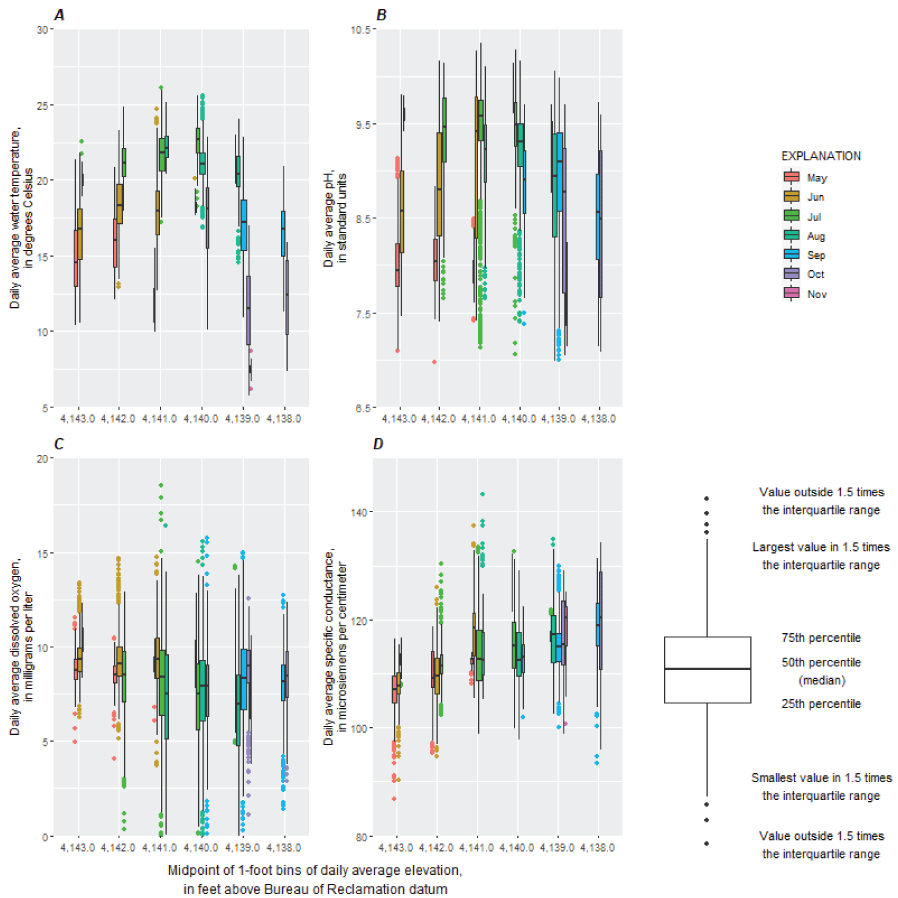
Boxplots showing daily average (A) water temperature, (B) pH, (C) dissolved oxygen concentration, and (D) specific conductance at core sites in Upper Klamath Lake, Oregon, 2005–19, with respect to lake-surface elevation and color-coded by month. Daily averages were calculated from hourly continuous measurements.
The distribution of pHavg with respect to ELEVavg and month had a similar seasonal pattern as WTavg where pH increased through July as lake-surface elevation decreased, then decreased through the end of the sampling period as lake-surface elevation decreased, although there were differences (fig. 5B). The highest pHavg values occurred in June, July, or August, when ELEVavg was 4,139.5– 4,142.5 ft (1,261.7– 1,262.6 m), and 96 days of pHext were measured in June and July, from 2005 to 2019 (table 3). The distributions of pHavg in July and August at 4,139.5– 4,141.5 ft (1,261.7–1,262.3 m) were negatively skewed and many low pHavg outliers fell below the lower whisker which represented the smallest value within 1.5 times the interquartile range.
The distribution of DOavg with respect to ELEVavg and month showed little change in the central tendency with median DOavg concentrations ranging from 7.5 to 10 mg/L (fig. 5C). Like high WTavg, the lowest DOavg concentrations were observed in July and August when ELEVavg ranged from 4,138.5 to 4,141.5 ft (1,261.4– 1,252.3 m). The lowest DOavg concentrations occurred in the months of July, August, and September across a broad range of ELEVavg, and those months combined had 153 days of DOext from 2005 to 2019 (table 3). The 153 days of DOext occurred with WTavg of 18.7–24.3 °C on all but 3 days, which corresponded to a maximum daily average level of 24.4 percent oxygen saturation. The highest DOavg concentrations (> 12.5 mg/L) were measured primarily in July for the 4,140.5– 4,141.5 ft (1,262.0–1,262.3 m) elevation range across seven different years (2007, 2010–12, 2015, 2017, 2019).
The distribution of SCavg with respect to ELEVavg and month showed that concentrations consistently increased during the season with decreased lake-surface elevation (fig. 5D). The biggest change in distribution with respect to elevation occurred in June, when the median SCavg increased by 9 μS/cm for the 4,140.5– 4,141.5 ft (1,262.0–1,262.3 m) ELEVavg range as compared to the 4,141.5– 4,142.5 ft (1,262.3–1,262.6 m) range.
The distribution of deviations of WQ variables from Julian day average values (WTdev, pHdev, DOdev, and SCdev) with respect to deviations of lake-surface elevation from Julian day average values (ELEVdev) did not show strong relations (fig. 6). ELEVdev had a weak, negative relation with SCdev (ρ = –0.36 [p < .001]) and showed a negligible relation with WTdev, pHdev, and DOdev. For lower-than-expected lake-surface elevations, SCavg was mostly higher than expected. For higher-than-expected lake-surface elevations, SCavg was mostly lower than expected, but the distributions were positively skewed with several occurrences of higher than expected SCavg. DOavg concentrations that were at least 5 mg/L lower than the Julian day average occurred for every range of ELEVdev, whereas DOavg concentrations that were more than 5 mg/L higher than the Julian day average occurred only when lake-surface elevations were in the expected range (within 0.5 ft of the Julian day average) or higher than expected (>0.5 ft higher than the Julian day average). For expected or higher-than-expected lake-surface elevations, the median pHdev was slightly higher (0.11–0.13 standard units) than expected but negatively skewed with occurrences of pHavg that were at least 1.5 standard units lower than the Julian day average. In contrast, for lower-than-expected lake-surface elevations, the median pHdev was slightly lower than expected (0.18 standard units).
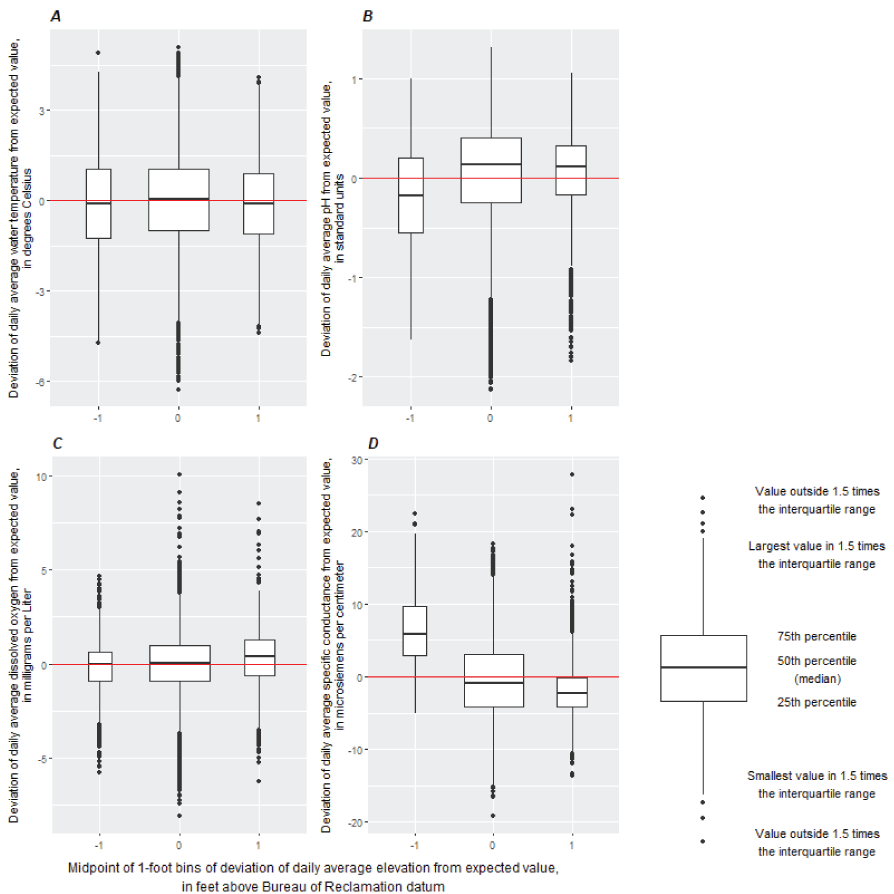
Boxplots showing deviations from Julian day average (A) water temperature, (B) pH, (C) dissolved oxygen concentration, and (D) specific conductance with respect to deviations from Julian day average lake-surface elevation at core sites in Upper Klamath Lake, Oregon, 2005–19.
Site Comparisons of Water Quality with Respect to Time and Lake-Surface Elevation
At Mid-North, a site with full-pool depth of 4.2 m (table 1), measurements were taken from sondes in the upper (MDNU) and lower (MDNL) water column. For both sondes, extreme water quality in the form of high water temperature, high pH, or low DO concentration mostly occurred from mid-June through mid-September when ELEVavg ranged from 4,139 to 4,142 ft (1,261.6–1,262.5 m). More days of extremely high water temperature and pH were measured at the upper sonde than the lower sonde, and more days of extremely low DO were measured at the lower sonde than the upper sonde (figs. 7 and 8). Within the 15-year study period, MDNU had 10 days of WText and 11 days of pHext, whereas MDNL had 11 days of DOext (table 4). In 2006, pHavg exceeding 9.5 persisted into late September and early October for both sondes. Both sondes showed a similar range in SCavg measurements.
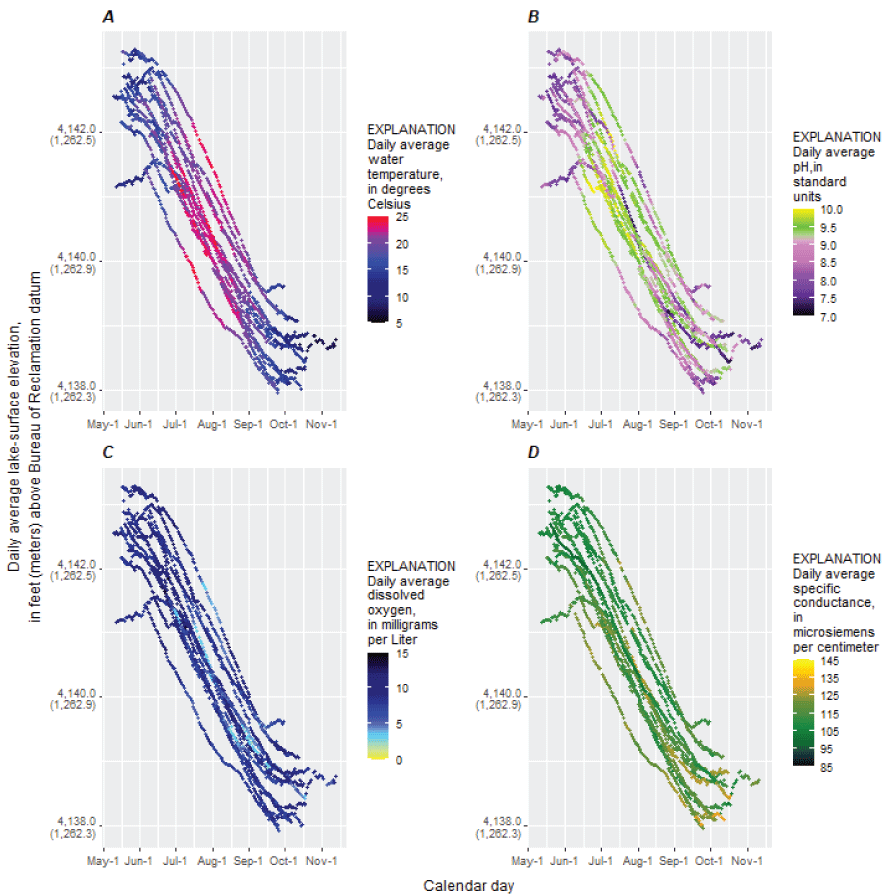
Julian day compared to lake-surface elevation, color-coded by daily average (A) water temperature, (B) pH, (C) dissolved oxygen concentrations, and (D) specific conductance, at Mid-North upper core monitoring site, Upper Klamath Lake, Oregon, 2005–19.

Julian day compared to lake-surface elevation, color-coded by daily average (A) water temperature, (B) pH, (C) dissolved oxygen concentrations, and (D) specific conductance, at Mid-North lower core monitoring site, Upper Klamath Lake, Oregon, 2005–19.
Table 4.
Occurrences of extreme water-quality days by site, Upper Klamath Lake, Oregon, 2005–19.[See table 1 for site names associated with site-name abbreviations. Abbreviations and symbols: °C, degrees Celsius; DO, dissolved oxygen; µg/L, micrograms per liter; mg/L, milligrams per liter; <, less than; >, greater than]
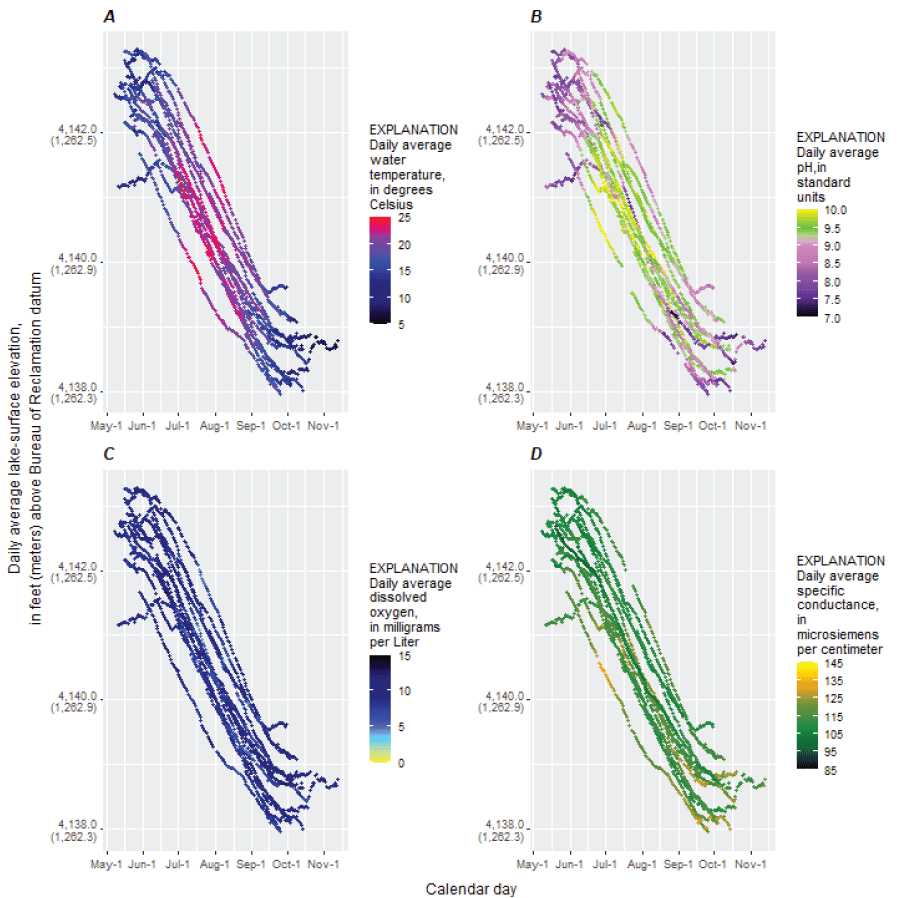
At Mid-Trench, the deepest core site in Upper Klamath Lake with a full-pool depth of 15 m (table 1), measurements were taken from sondes in the upper (MDTU) and lower (MDTL) water column. The sondes at Mid-Trench had similar timing of extreme water quality for the same lake-surface elevation range as Mid-North, with more days of extremely high water temperature and pH measured at the upper sonde than the lower sonde, and more days of extremely low DO measured at the lower sonde than the upper sonde (figs. 9 and 10). Within the 15-year study record, MDTU had 29 days of WText and 13 days of pHext, whereas MDTL had 132 days of DOext, which accounted for 85 percent of all days of DOext at the core sites (table 4). Days of DOext at MDTL occurred as early as July 3 (in 2015) and as late as October 10 (2015) for ELEVavg ranging from 4,138.0 ft–4,141.9 ft (1,261.3–1,262.5 m; fig. 10). In 2006, like Mid-North, the sondes at Mid-Trench had pHavg exceeding 9.5 into late September and early October. Both sondes had similar SCavg measurements to the MDNU and MDNL sites.

Julian day compared to lake-surface elevation, color-coded by daily average (A) water temperature, (B) pH, (C) dissolved oxygen concentrations, and (D) specific conductance, at Mid-Trench upper core monitoring site, Upper Klamath Lake, Oregon, 2005–19.
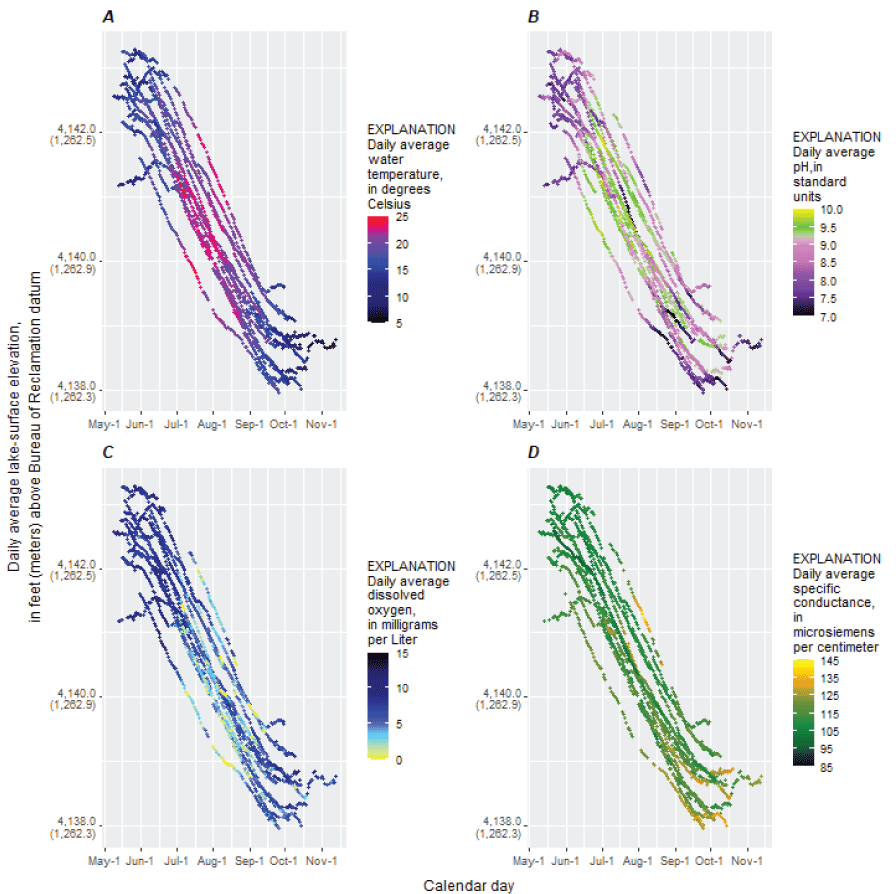
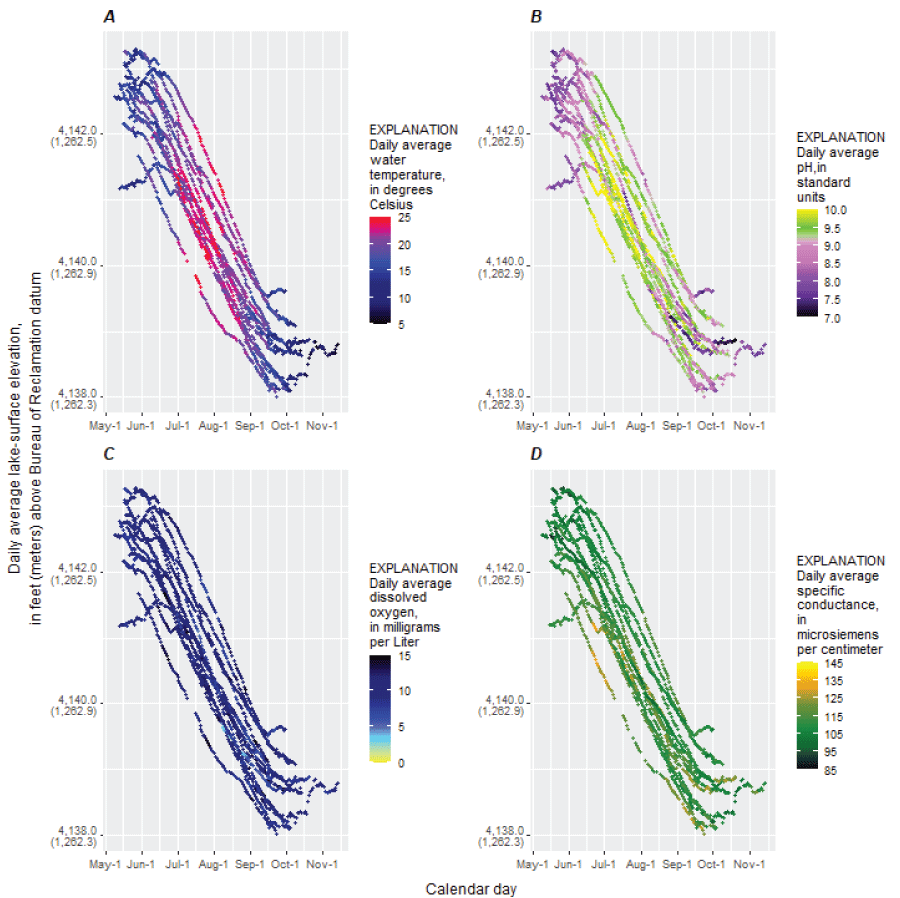
Julian day compared to lake-surface elevation, color-coded by daily average (A) water temperature, (B) pH, (C) dissolved oxygen concentrations, and (D) specific conductance, at Mid-Trench lower core monitoring site, Upper Klamath Lake, Oregon, 2005–19.
The sites at Williamson River outlet (WMR) and Rattlesnake Point (RPT) were more than 10 kilometers (km) apart; however. both sites were set up with a single sonde, had full-pool depths in a similar range (2.5–3.4 m), and had similarities in their spatio-temporal water quality during the study period. For both sondes, extreme water quality in the form of high water temperature and high pH occurred from mid-June through September at several lake-surface elevations from 4,139 to 4,142 ft (1,261.6 to 1,262.5 m), similar to Mid-North and Mid-Trench (figs. 11 and 12). Within the 15-year study period, WMR had 24 days of WText and 61 days of pHext, which accounted for 54 percent of all days of pHext at the core sites (table 4). RPT had 5 days of WText and 27 days of pHext. Both sondes had few days during which DOavg was less than 5 mg/L and only 1 day of DOext occurred at WMR during the study period. The value of pHavg exceeded 9.5 standard units in late September or early October at WMR or RPT during 2005–08 and 2010–11.
Julian day compared to daily average lake-surface elevation, color-coded by daily average (A) water temperature, (B) pH, (C) dissolved oxygen concentrations, and (D) specific conductance, at Rattlesnake Point core monitoring site, Upper Klamath Lake, Oregon, 2005–19.
Julian day compared to daily average lake-surface elevation, color-coded by daily average (A) water temperature, (B) pH, (C) dissolved oxygen concentrations, and (D) specific conductance, at Upper Klamath Lake at Williamson River outlet core monitoring site, Upper Klamath Lake, Oregon, 2005–19.
The spatial variability of continuous WQ data was considered by evaluating the variance in daily average values across all core sites for each day of the study period. The spatial variability was smaller for WTavg and pHavg, and larger for DOavg and SCavg. The range in WTavg for all sites and days was 5.71–26.1 °C and the daily variance across all sites was less than 0.8 °C (4.1 percent of the range) for 90 percent of days. The range in pHavg was 7.0–10.4 standard units and the daily variance across sites was less than 0.2 standard units (4.7 percent of the range) for 90 percent of days. The range in DOavg was 0–18.5 mg/L and the daily variance across sites was less than 0.6 mg/L (3.1 percent of the range) for 25 percent of days and more than 4.7 mg/L for 25 percent of days. Focusing on August, which was the month with the most days of DOext (table 3), the range in DOavg was 0–16.4 mg/L and the daily variance across core sites was less than 3.0 mg/L for 25 percent of days and more than 7.2 mg/L for 25 percent of days. Finally, the range in SCavg concentration for all sites and days was 86.8 –143 μS/cm and the daily variance across core sites was less than 3.2 μS/cm (5.7 percent of the range) for 50 percent of all days.
The upper sondes at Mid-North (MDNU) and Mid-Trench (MDTU) had the highest estimated concentrations of un-ionized ammonia (NH3; table 4). For both sondes, extremely high NH3 mostly occurred in July and August at ELEVavg ranging from 4,139 to 4,141 ft (1,261.6–1,262.2 m; fig. 13). Within the study period, MDTU had 9 weekly measurement dates when estimated NH3 exceeded 264 μg/L and those accounted for 60 percent of all days of extremely high NH3 for the core sites. MDNU also had five weekly measurement dates when estimated NH3 exceeded 264 μg/L. The highest estimated NH3 concentration occurred on dates when measured total ammonia concentrations ranged from 312 to 873 μg/L and calculated fractions of un-ionized ammonia ranged from 0.32 to 0.85 owing to the combination of measured pH exceeding 9.0 standard units and measured water temperature exceeding 21.53 °C for all ammonia measurement times. The WMR site had no dates of estimated NH3 exceeding 264 μg/L despite having the most dates of extremely high pH. The 14 highest total ammonia concentrations measured at WMR ranged from 330 to 740 μg/L but coincided with calculated fractions of un-ionized ammonia (eq. 2) that ranged from 0.01 to 0.43 owing to lower measured pH (< 9.0 standard units) and water temperature (< 22 °C) during high total ammonia measurement times.
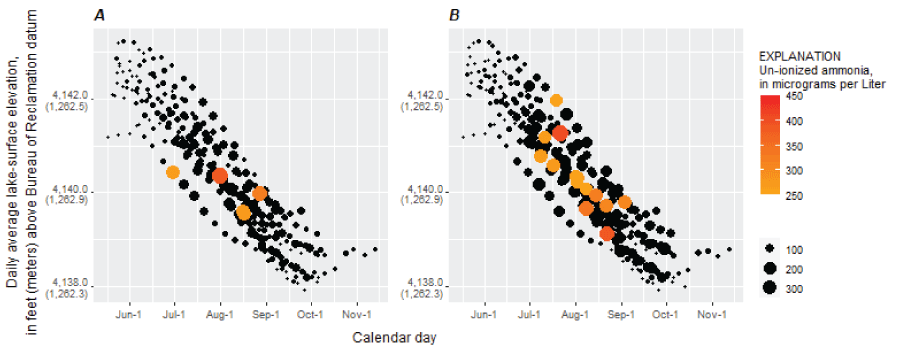
Julian day compared to daily average lake-surface elevation, color-coded and scaled by weekly estimated un-ionized ammonia, at (A) Mid-North upper and (B) Mid-Trench upper core monitoring sites, Upper Klamath Lake, Oregon, 2005–19.
Comparisons of Extreme Water-Quality Days with Respect to Time and Lake-Surface Elevation
Water temperatures greater than 24.38 °C (the 99th percentile for all WTavg) for multiple hours in a day were measured at all sites and in all years of the study (table 5; fig. 14). The most persistent conditions of extreme temperature were measured at the upper sondes of Mid-North (MDNU) and Mid-Trench (MDTU), and at the shallower WMR site. Within the study period, MDTU had 29 days and WMR had 24 days of WText (table 4), and MDTU recorded the highest hourly temperature of 29.46 °C on July 14, 2018. The years with the highest temperatures were 2006, 2009, 2015, and 2017 with totals ranging from 8 to 23 days of WText per year (table 5).
Table 5.
Occurrences of extreme water-quality days by year at the core monitoring sites, Upper Klamath Lake, Oregon, 2005–19.[Abbreviations and symbols: °C, degrees Celsius; DO, dissolved oxygen; µg/L, micrograms per liter; mg/L, milligrams per liter; <, less than; >, greater than]
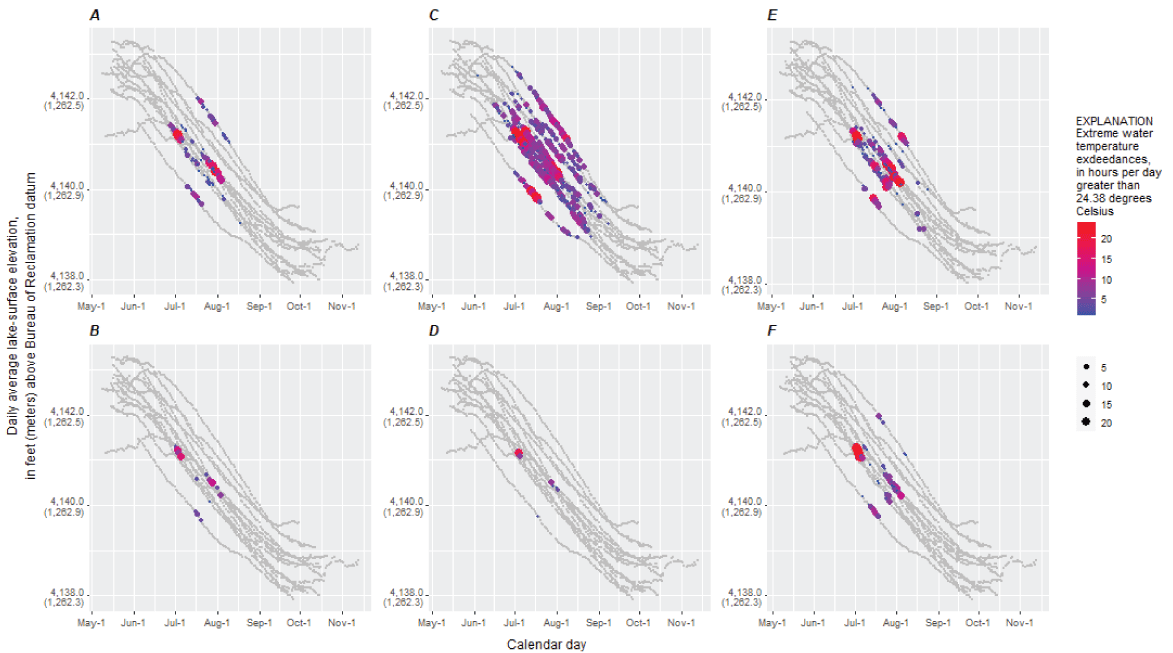
Julian day compared to daily average lake-surface elevation, color-coded by total hours per day with extremely high water temperature exceeding 24.38 degrees Celsius at (A) Mid-North upper, (B) Mid-North lower, (C) Mid-Trench upper, (D) Mid-Trench lower, (E) Upper Klamath Lake at Williamson River outlet, and (F) Rattlesnake Point core monitoring sites, Upper Klamath Lake, Oregon, 2005–19.
A pH greater than 10.04 standard units for multiple hours in a day was measured in all years of the study, predominantly at the shallower WMR and RPT sites, and the upper sondes at Mid-North and Mid-Trench (fig. 15). WMR had 61 days and RPT had 27 days of pHext during the study period (table 4), and WMR recorded the highest hourly pH of 10.64 standard units on June 29, 2018. The years with the highest pH were 2007–08, 2012–16, and 2018, with totals ranging from 7 to 28 days of pHext per year and that did not coincide with the years of extreme high water temperature, with the exception of 2015 (table 5).
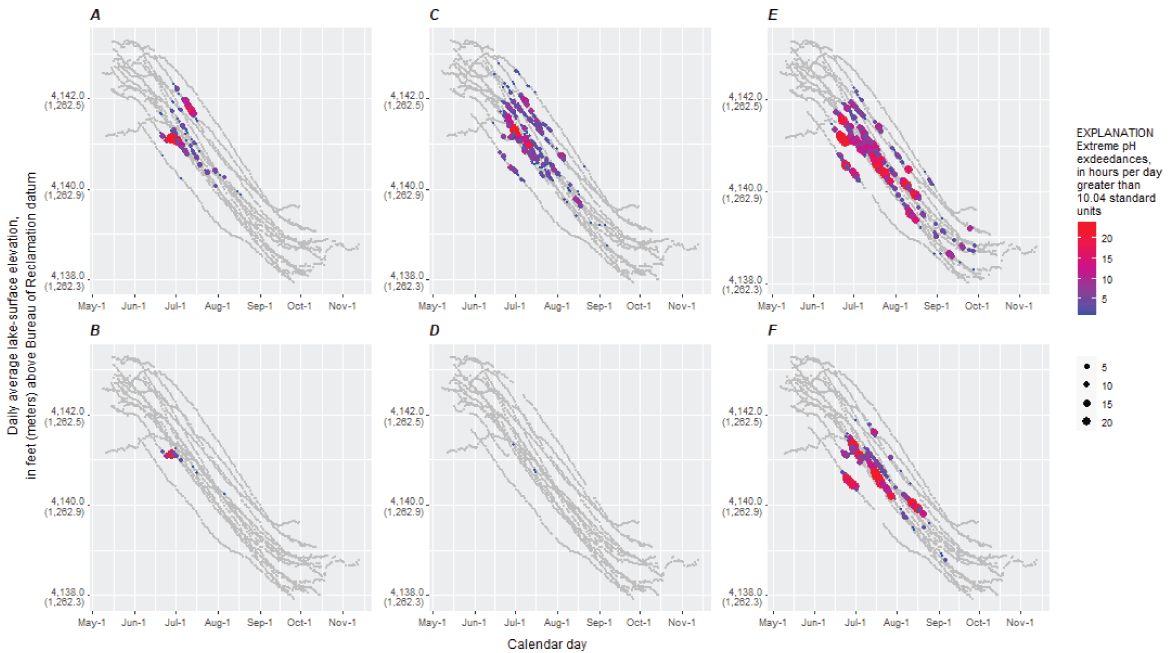
Julian day compared to daily average lake-surface elevation, color-coded by total hours per day with extremely high pH measurements exceeding 10.04 standard units at (A) Mid-North upper, (B) Mid-North lower, (C) Mid-Trench upper, (D) Mid-Trench lower, (E) Upper Klamath Lake at Williamson River Outlet, and (F) Rattlesnake Point core monitoring sites, Upper Klamath Lake, Oregon, 2005–19.
DO concentrations less than 1.76 mg/L were measured in all years of the study, predominantly at the lower sondes of Mid-North (MDNL) and Mid-Trench (MDTL; fig. 16). MDTL had 132 days of DOext during the study period, which accounted for 85 percent of extreme low DO days for the core sites (table 4). The lowest concentrations of less than 0.2 mg/L were measured in:
-
2013 (3 hours) at RPT;
-
2011 (2 hours), 2016 (34 hours), 2017 (2 hours), and 2019 (7 hours) at MDNL;
-
2008 (18 hours), 2012 (2 hours), 2017 (30 hours), 2018 (15 hours), and 2019 (23 hours) at MDTU; and
-
every year at MDTL.
-
25–29 hours in 2005, 2011–12, and 2016;
-
44–94 hours in 2006, 2013, and 2018–19; and
-
145–236 hours in 2008, 2014, and 2017.
The years with the most days of DOext were 2005, 2008–09, and 2012–19, with totals ranging from 7 to 25 days per year (table 5). A negligible relation was present between annual total days of DOext and WText; however, a moderate, positive relation existed between annual total days of DOext and pHext (ρ = 0.43 [p = .11]) that was not statistically significant. Significant moderate, positive relations existed between annual total days of DOext and total days of pHext from the previous year (ρ = 0.63 [p = .015]), and also between the combined total days of pHext in the current and previous years (ρ = 0.66 [p = .010]).
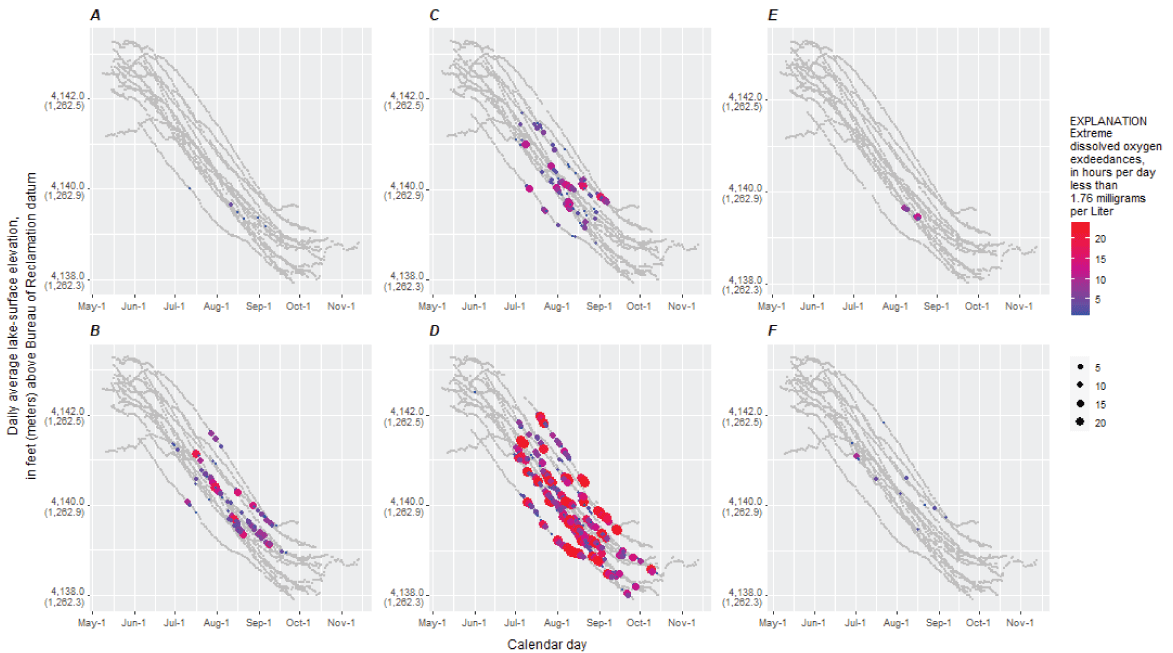
Julian day compared to daily average lake-surface elevation, color-coded by total hours per day with extremely low dissolved oxygen concentrations less than1.76 milligrams per liter at (A) Mid-North upper, (B) Mid-North lower, (C) Mid-Trench upper, (D) Mid-Trench lower, (E) Upper Klamath Lake at Williamson River outlet, and (F) Rattlesnake Point core monitoring sites, Upper Klamath Lake, Oregon, 2005–19.
Distribution of Un-Ionized Ammonia with Respect to Year
High NH3 concentrations mostly occurred in the latter half of the study period when 86 percent of concentrations greater than 264 μg/L were estimated at the Mid-North and Mid-Trench sites over 2012 to 2019 (table 5; fig. 17). MDTU had 9 days and MDNU had 5 days during which estimated NH3 exceeded 264 μg/L from 2005 to 2019 (table 4), and MDTU had the highest estimate of 403 μg/L on July 21, 2008. Based on the yearly upper quartiles, the highest estimated NH3 concentrations occurred in 2005, 2008–09, and 2016–19 (fig. 17); however, concentrations greater than 264 μg/L also were estimated in 2012–15 (table 5).
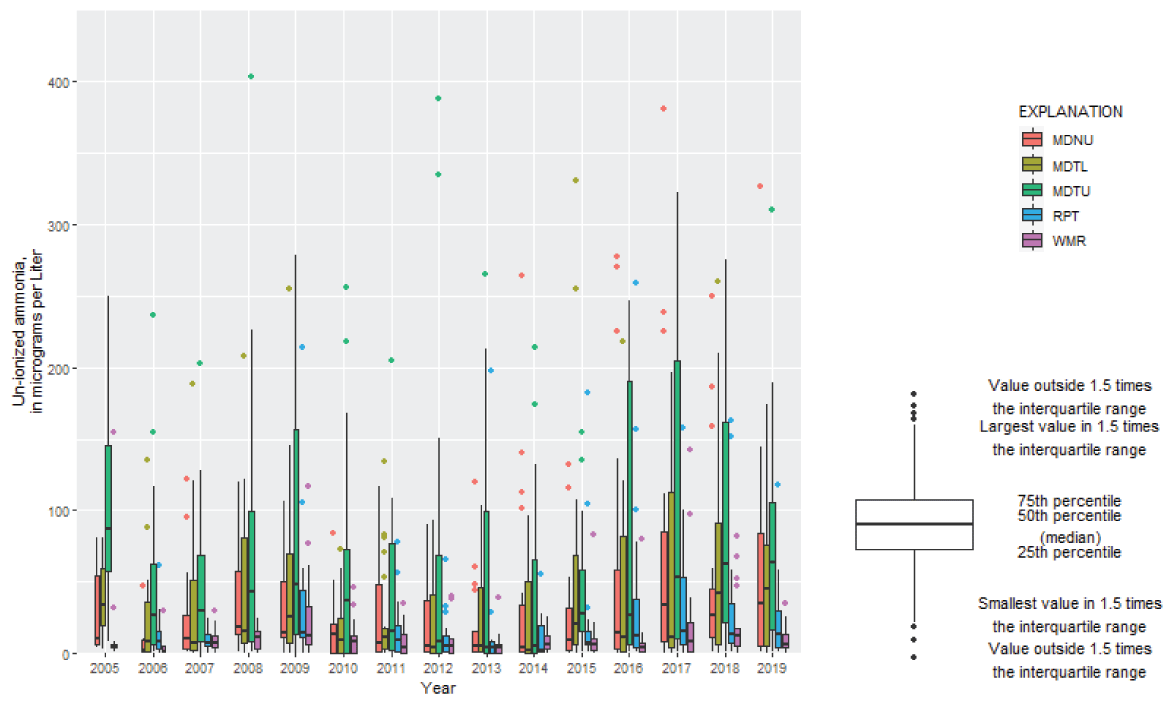
Boxplots showing weekly estimated un-ionized ammonia concentrations, by year and color-coded by site, Upper Klamath Lake, Oregon, 2005–19. MDNU, Mid-North upper core monitoring site; MDTL, Mid-Trench lower core monitoring site; MDTU, Mid-Trench upper core monitoring site; RPT; Rattlesnake Point core monitoring site; WMR, Upper Klamath Lake at Williamson River outlet core monitoring site.
Summary and Conclusions
The study examined the timing and relations between variables that indicated extreme water quality (WQ) in Upper Klamath Lake that potentially could be harmful to the endemic sucker species. Seasonal, spatial, and annual relations were explored using the 15-year set of continuous WQ and discrete-sampling data collected over 2005 to 2019 from four core monitoring sites in Upper Klamath Lake managed by the U.S. Geological Survey (USGS): (1) Upper Klamath Lake at Williamson River outlet (WMR), (2) Rattlesnake Point (RPT), (3) Mid-North upper and lower (MDNU and MDNL), and (4) Mid-Trench upper and lower (MDTU and MDTL). The continuous variables included water temperature, pH, dissolved oxygen (DO), specific conductance (SC), and lake-surface elevation. Weekly samples of total ammonia, and measurements of water temperature and pH, were used to estimate un-ionized ammonia concentrations (NH3). Daily averages, daily deviations from Julian day average values, and extreme WQ days were calculated from the datasets and used to evaluate relations between WQ variables, lake-surface elevation, and month.
Extreme WQ days were defined for water temperature, pH, and DO as those when at least 12 hours of continuous measurements exceeded a statistically extreme threshold, and were referred to as WText, pHext, and DOext. The extreme WQ thresholds for water temperature and pH were the 99th percentile of the daily average time series over the study period and equaled 24.38 °C and 10.04 standard units, whereas the extreme threshold for DO was the 1st percentile of the daily average time series over the study period and equaled 1.76 milligrams per liter (mg/L). For NH3, extreme WQ days were those when the weekly estimated NH3 concentration exceeded the 99th percentile value of 264 micrograms per liter (μg/L).
Seasonal Relations
The seasonality of water temperature, pH, DO, and NH3 during the summer sampling months was influenced by solar radiation and the life cycle of cyanobacteria in Upper Klamath Lake.
During the study period (2005–19), daily average temperature (WTavg) and pH (pHavg):
-
increased during May and June;
-
had the highest values in July, during which there were a total of 60 days of WText (83 percent of all months) and 61 days of pHext (54 percent of all months); and
-
decreased in August and September with fewer days of extreme conditions.
The highest levels of WTavg and pHavg were high but not in the lethal range for 24-hour exposure. The distribution of pHavg during July–September was skewed left because in some years pH had a mid-season drop. The days with the lowest mid-season DOavg values occurred with pHavg ranging from 7.05 to 9.39 standard units.
The central tendency of DOavg was consistently in the range of 7.5 to 10 mg/L throughout the sampling season, but fluctuated from 0.0 to 18.5 mg/L. Within the study period, DOavg concentrations below 0.2 mg/L occurred on 13 days in July and August at MDTL and there were 87 days (57 percent of all months) of DOext measured in August.
Extreme NH3 concentrations occurred when high pHavg coincided with high ammonia concentrations. Within the study period, extremely high NH3 was measured in August, during which time there were 10 weekly (67-percent) estimated NH3 concentrations that exceeded 264 μg/L.
SCavg increased through the sampling season as daily average lake-surface elevation (ELEVavg) decreased. During the summer sampling season, lake-surface elevation was affected by water loss from evaporation and dam releases, and water gains from snowmelt-derived inflows, groundwater, and irrigation return flows, all of which could have variable SC concentrations and contributions. Higher-than-expected SCavg (compared to the Julian day average) occurred when ELEVavg was lower-than-expected (compared to the Julian day average), and lower-than-expected SCavg occurred when ELEVavg was higher-than-expected. The relation between SCavg and DOavg or pHavg was negligible when all months of the sampling season were considered; however, in May and June, SCavg had weak, positive relations with DOavg (ρ = 0.22 [p < .001]) and pHavg (ρ = 0.34 [p < .001]), and in September and October SCavg had moderate, negative relations with DOavg (ρ = -0.44 [p < .001]) and pHavg (ρ = -0.56 [p < .001]).
Spatial Relations
The site at Mid-Trench located at the trench along the western shore of Upper Klamath Lake was the deepest of the core sites where depth ranged from 13.2 to 15 meters during the summer sampling period. From 2005 to 2019, the sonde at MDTU had 29 days of WText (40 percent of all sites) and 9 weekly estimated NH3 concentrations that exceeded 264 μg/L (60-percent of all sites), whereas the sonde at MDTL had 132 days of DOext (85 percent of all sites). The high temperatures at MDTU could be due to localized thermal stratification resulting in a “soft” boundary between the upper and lower water column. Although the location of site Mid-Trench is too deep to provide sucker habitat, the extreme WQ there could affect other parts of the lake because of a strong clockwise current observed with prevailing winds. Hydrodynamic studies reported that water flowing through the deepest trench was preferentially routed to the northwestern part of the lake, whereas water nearer the surface was preferentially routed south along the eastern shore.
Overall, the DOavg time series had similar seasonal patterns between sites each year, although the daily spatial variance in DOavg across all sites was greater than 4.7 mg/L for 25 percent of all days from 2005 to 2019. The daily spatial variance in August, which was the month with the most days of DOext, was greater than 7.2 mg/L for 25 percent of the August days in the study period.
The site at Mid-North was the only core site located in the northwestern part of Upper Klamath Lake and had mid-level depth ranging from 2.4 to 4.2 m through the summer sampling period. Overall, there were fewer days of extreme water quality at Mid-North compared to Mid-Trench, but there were five weekly estimated NH3 concentrations that exceeded 264 μg/L (33 percent of all sites) at MDNU.
The WMR site, the shallowest core site with a depth ranging from 0.7 to 2.5 m, was located at the outlet of the Williamson River near the restored delta, and the RPT site, with a depth ranging from 1.6 to 3.4 m, was located in the southern part of Upper Klamath Lake, about 10 km south of the WMR site. These two shallowest sites of the core group measured the most days of extreme pH; the WMR site had 61 days of pHext (54 percent of all sites) and the RPT site had 27 days of pHext (24 percent of all sites). The relatively high number of days of pHext at the shallowest sites could be due to the vertical volume within which mixing occurred. At the shallowest sites, the volume was fixed by a solid lower boundary, whereas the deeper sites had variable soft boundaries between the upper and lower water column owing to thermal stratification. Overall, the pH time series had similar seasonal patterns between sites each year, and the daily spatial variance in pHavg across all sites was less than 0.2 for 90 percent of days in the study period.
Annual Relations
The annual totals of extreme water temperature did not have a trend from 2005 to 2019. The years with the most days of WText were 2005–06, 2009, 2014–15, and 2017–18, when totals ranged from 4 to 23 days. The annual total days of WText had negligible relations with annual total days of pHext, DOext, or extremely high NH3 over the 15-year study period.
Most days of pHext and DOext occurred in the latter half of the study period. The years with the most days of pHext were 2007–08, 2012–16, and 2018, when totals ranged from 7 to 28 days, and 85 days of pHext (75 percent of total) occurred from 2012 to 2019. The years with the most days of DOext were 2005, 2008–09, and 2012–19, when totals ranged from 7 to 25 days, and 119 days of DOext (77 percent of total) occurred from 2012 to 2019. The annual total days of DOext had a positive relation with annual total days of pHext over 2005–2019 (ρ = 0.43 [p = .11]) but had a stronger, positive relation with the previous year’s annual total days of pHext, with ρ of 0.63 (p = .015). When the combined total days of pHext from the current and previous year were compared to annual total days of DOext, the ρ was 0.66 (p = .010). The positive correlation reflected a potential relation between years with greater productivity in the lake, as measured by pH, and oxygen demand the following year. Increased oxygen demand following a high-production year could be due to extensive decay or other processes occurring on or near the lakebed. Future work could evaluate the lagged WQ effects of decay, nutrient release, and oxygen demand, and potential relations to lake circulation and cyanobacteria assemblages, for example.
Like pH and DO, estimated NH3 had more occurrences of extremely high concentration in the latter half of the study period. The years when at least two weekly estimated NH3 concentrations exceeded 264 μg/L were 2012, 2016–17, and 2019, and 13 weekly estimates of extremely high NH3 concentration (87 percent of total) occurred from 2012 to 2019. High NH3 estimates depended on coincident timing of high total ammonia concentrations and high pH. The days during which estimated NH3 exceeded 264 μg/L corresponded to total ammonia concentrations that ranged from 312 to 873 μg/L with pH that ranged from 9.0 to 10.0 standard units and estimated fractions of NH3 greater than 0.3. The increased occurrence of extreme NH3 concentrations in the latter half of the study period were driven more by increased occurrence of high total ammonia concentrations than increased pH and water temperature. For all sites within the study period, there were more total ammonia measurements higher than 312 μg/L in the second half than the first half of the study period (63 percent from 2012 to 2019), whereas estimated fractions of ammonia greater than 0.3 at the time of sample collection were split more evenly between the first and second halves of the study period (54 percent from 2012 to 2019).
Based on individual WQ variables, different calendar years were considered to have poor water quality. The years that had the most accumulated days of extremely poor WQ (as represented by high temperature, low DO, high pH, or high NH3) were 2012–15 and 2017. Based on this metric, most days of extremely poor water quality occurred in the latter half of the 15-year study period. The years that had the fewest accumulated days of extremely poor WQ conditions across all variables were 2010 and 2011.
References Cited
Burdick, S.M., Hereford, D.M., Conway, C.M., Banet, N.V., Powers, R., Martin, B.A., and Elliott, D.G., 2020a, Mortality of endangered juvenile Lost River suckers associated with cyanobacteria blooms in mesocosms in Upper Klamath Lake, Oregon: Transactions of the American Fisheries Society, v. 149, no. 3, p. 245–265.
Hereford, D.M., Conway, C.M., Burdick, S.M., Elliott, D.G., Perry, T.M., Dolan-Caret, A., and Harris, A.C., 2019, Assessing causes of mortality for endangered juvenile Lost River suckers (Deltistes luxatus) in mesocosms in Upper Klamath Lake, south-central Oregon, 2016: U.S. Geological Survey Open-File Report 2019–1006, 80 p.
R Core Team, 2021, R—A language and environment for statistical computing: Vienna, Austria, R Foundation for Statistical Computing software release, accessed May 2020, at http://www.R-project.org/.
U.S. Geological Survey, 2021, National Water Information System: U.S. Geological Survey web interface, https://doi.org/10.5066/F7P55KJN, accessed March 2021, at https://nwis.waterdata.usgs.gov/nwis.
U.S. Geological Survey, [variously dated], National field manual for the collection of water-quality data: U.S. Geological Survey Techniques of Water-Resources Investigations, book 9, chap. A1–A5m, accessed October 7, 2021, at https://pubs.water.usgs.gov/twri9A.
Wickham, H., 2016, ggplot2—Elegant graphics for data analysis: Springer-Verlag New York, accessed June 2020, at https://ggplot2.tidyverse.org.
Wood, T.M., Hendrixson, H.A., Markle, D.F., Erdman, C.S., Burdick, S.M., and Ellsworth, C.M., 2014, Simulation and validation of larval sucker dispersal and retention through the restored Williamson River Delta and Upper Klamath Lake system, Oregon: U.S. Geological Survey Scientific Investigations Report 2013–5194, 33 p.
Conversion Factors
U.S. customary units to International System of Units
International System of Units to U.S. customary units
Temperature in degrees Celsius (°C) may be converted to degrees Fahrenheit (°F) as follows:
°F = (1.8 × °C) + 32.
Datums
Vertical coordinate information is referenced to the Bureau of Reclamation datum, which is 1.78 feet above National Geodetic Vertical Datum of 1929 (NGVD 29).
Horizontal coordinate information is referenced to the North American Datum of 1927 (NAD 27).
Elevation, as used in this report, refers to distance above the Bureau of Reclamation datum.
Supplemental Information
Specific conductance is given in microsiemens per centimeter at 25 degrees Celsius (µS/cm at 25 °C).
Concentrations of chemical constituents in water are given in either milligrams per liter (mg/L) or micrograms per liter (µg/L).
Abbreviations
AFA
Aphanizomenon flos-aquae
DO
dissolved oxygen
DOavg
daily average dissolved oxygen
DOdev
deviations of daily average dissolved oxygen from Julian day averages
DOext
days when at least 12 hours exceed extreme dissolved oxygen threshold
ELEVavg
daily average lake-surface elevation
ELEVdev
deviations of daily average lake-surface elevation from Julian day averages
IQR
interquartile range
LC50
lethal concentration for 50 percent of a population
MDNL
Mid-North lower core monitoring site
MDNU
Mid-North upper core monitoring site
MDTL
Mid-Trench lower core monitoring site
MDTU
Mid-Trench upper core monitoring site
NH3
un-ionized ammonia
NH4+
ammonium ion
pHavg
daily average pH
pHdev
deviations of daily average pH from Julian day averages
pHext
days when at least 12 hours exceed extreme pH threshold
RPT
Rattlesnake Point core monitoring site
SC
specific conductance
SCavg
daily average specific conductance
SCdev
deviations of daily average specific conductance from Julian day averages
USGS
U.S. Geological Survey
WMR
Upper Klamath Lake at Williamson River outlet core monitoring site
WQ
water quality
WTavg
daily average water temperature
WTdev
deviations of daily average water temperature from Julian day averages
WText
days when when at least 12 hours exceed extreme water temperature threshold
For information about the research in this report, contact
Director, Oregon Water Science Center
U.S. Geological Survey
2130 SW 5th Avenue
Portland, Oregon 97201
https://www.usgs.gov/centers/oregon-water-science-center
Manuscript approved on September 4, 2022
Publishing support provided by the U.S. Geological Survey
Science Publishing Network, Tacoma Publishing Service Center
Suggested Citation
Wherry, S.A., 2022, Summary of extreme water-quality conditions in Upper Klamath Lake, Oregon, 2005–19: U.S. Geological Survey Open-File Report 2022–1080, 29 p., https://doi.org/10.3133/ofr20221080.
ISSN: 2331-1258 (online)
Study Area
| Publication type | Report |
|---|---|
| Publication Subtype | USGS Numbered Series |
| Title | Summary of extreme water-quality conditions in Upper Klamath Lake, Oregon, 2005–19 |
| Series title | Open-File Report |
| Series number | 2022-1080 |
| DOI | 10.3133/ofr20221080 |
| Year Published | 2022 |
| Language | English |
| Publisher | U.S. Geological Survey |
| Publisher location | Reston, VA |
| Contributing office(s) | Oregon Water Science Center |
| Description | vii, |
| Country | United States |
| State | Oregon |
| Other Geospatial | Upper Klamath Lake |
| Online Only (Y/N) | Y |
| Google Analytic Metrics | Metrics page |