

Verification of Multiple Phosphorus Analyzers for Use in Surface-Water Applications
Links
- Document: Report (1.42 MB pdf) , HTML , XML
- Dataset: USGS National Water Information System database —USGS water data for the Nation
- Download citation as: RIS | Dublin Core
Acknowledgments
The Next Generation Water Observing System supported the fieldwork and compilation of the data and writing of this report. The author would like to thank the manufacturers Hach, Sea-Bird Scientific, and YSI Inc. for their cooperation and technical assistance.
The author acknowledges the U.S. Geological Survey Southeast Region for supporting the fieldwork and compilation of the data and writing of this report. The author would also like to acknowledge Aubrey Bunch of the Ohio-Kentucky-Indiana Water Science Center and Paul Reneau of the Upper Midwest Water Science Center for their technical assistance and reviews of the report.
Abstract
The U.S. Geological Survey (USGS) completed a verification study of selected commercially available phosphorus analyzers for their applicability to scientific surface-water applications. In this study, the analyzers were the Hach EZ7800 TOPHO, Hach Phosphax sc, Sea-Bird Scientific HydroCycle-PO4, and the YSI Inc. Alyza IQ PO4. Verification tests included laboratory trials comparing analyzer results to known standards with several known concentrations of dissolved organic matter and waste production estimates. Field trials were completed at the Vermilion River near Danville, Illinois (U.S. Geological Survey station 03339000), where analyzer-measured concentrations were compared against discrete samples across a wide range of environmental conditions from November 2020 to August 2021. Data coverage was closely tracked for analyzer malfunctions and operator errors that caused missing data. Laboratory and field trials indicated that each analyzer is a viable option for scientific surface-water studies depending on environmental conditions. Because of the complexity of the analyzers, a substantial time investiture was required to get maximum data coverage including considerable site infrastructure investments and well-trained technicians. Data coverage was closely related to each analyzer’s ability to handle elevated turbidity levels.
Introduction
Phosphorus is of interest in surface waters because of its role in eutrophication as a potential limiting nutrient (Smith and others, 1999; Elser and others, 2007). As such, phosphorus may be key in understanding degraded surface-water conditions such as harmful algal blooms and fish kills. Phosphorus is introduced into surface waters through several natural processes and anthropogenic sources such as agricultural runoff and wastewater discharge; therefore, continuous phosphorus data would be helpful to gain further insight into these processes and how they may affect surface-water conditions. To assess various phosphorus analyzers, the U.S. Geological Survey (USGS) has begun using them to understand their applicability for a variety of surface-water scientific goals.
Phosphorus cannot be measured via wavelength absorption directly in the solution of interest. Instead, the sample solution must be chemically manipulated. The principles of the first spectrophotometric methods have been largely unchanged over many decades (Murphy and Riley, 1962; Drummond and Maher, 1995; Sequeira and others, 2002; O’Toole and others, 2007; Nagul and others, 2015). Only two methods are used by automated analyzers to determine phosphorus concentrations. The methods are the molybdenum blue method (Murphy and Riley, 1962; Drummond and Maher, 1995) and the vanadomolybdate yellow method (Sequeira and others, 2002; O’Toole and others, 2007). This report defines them as the “blue” and “yellow” methods, respectively. Each method relies on spectrophotometric quantification by chemically manipulating the sample and measuring light absorption at a specific wavelength. The wavelength absorption is then linearly related to phosphorus concentration.
Despite the ease at which phosphorus can be determined in a laboratory setting, transforming these methods into an automated field process has been challenging. A fully automated phosphorus analyzer is too complex to match the accuracy of a laboratory analysis. Because of this, the USGS has begun using commercially available analyzers to determine their applicability to scientific goals (Snazelle, 2018).
Understanding the design of an automated phosphorus analyzer is important because altering filter size, method, or digestion can all change the amount of phosphorus detected. This report documents the laboratory and field verification of the Hach EZ7800 TOPHO, Hach Phosphax sc, and YSI Inc. Alyza IQ PO4, hereinafter, “EZ7800 TOPHO,” “Phosphax,” and “Alyza,” respectively. Additionally, this report incorporates the Sea-Bird Scientific HydroCycle-PO4 (hereinafter, “HydroCycle”) in field trials; however, it already has been extensively studied in laboratory settings, and therefore, those tests are not repeated (Johengen and others, 2017; Snazelle, 2018).
Purpose and Scope
The purpose of this report is to present results from a phosphorus analyzer verification study of selected commercially available phosphorus analyzers for their applicability to scientific surface-water applications. Analyzers used in this study were the EZ7800 TOPHO, Phosphax, HydroCycle, and Alyza. Verification tests included laboratory trials comparing analyzer results to known standards with and without dissolved organic matter and waste production estimates. Field trials were completed at the Vermilion River near Danville, Illinois (USGS station 03339000), where analyzer results were compared against discrete samples across a wide range of environmental conditions.
Analyzer Specifications
The analyzer and its manufacturer-listed specifications are provided in table 1. Accuracy is not listed in this table because it depends on what each measurement is compared to; for example, a manufacturer-stated accuracy is typically the analyzer measurement compared to a known standard. However, it is important to note that the accuracy of each analyzer will change based on matrix-specific conditions. Therefore, accuracy may be completely different in a laboratory setting compared to a field setting. For this reason, some manufacturers do not provide accuracy statements. Manufacturers will typically recommend that accuracy be determined by the user by comparing field measurements to laboratory results.
Table 1.
Manufacturer listed specifications for each analyzer.[mg/L, milligram per liter; μm, micrometer; AC, alternating current; DC, direct current]
When verifying an analyzer, some key parameters warrant consideration, such as targeted analyte, method, and filter size (table 1). Of the four analyzers in this study, three were designed to target orthophosphate (OP), whereas the EZ7800 TOPHO was designed to target total phosphorus (TP). Whether the analyzer uses the blue or yellow method is important because the accuracy and uncertainty associated with each method vary. This includes any modifications made by the manufacturer to each spectrophotometric method. Additionally, each method is likely susceptible to different matrix interferences to various degrees. Finally, filter size is important to determining OP. Surface waters will have varying amounts of phosphorus associated with particulates, and therefore fluctuating proportions of OP and TP. Filtration through a 0.45-micrometer (μm) filter is not a true separation of dissolved or particulate phosphorus forms; however, it is a convenient way of separating analytical techniques and also is conventional for OP analytical methods (Baird and others, 2017).
Hach EZ7800 TOPHO
The EZ7800 TOPHO is different from all the other analyzers because it is the only analyzer designed to target TP. TP requires an additional digestion step to further break down phosphorus-containing compounds such as organics. It should be noted that the EZ7800 TOPHO does not measure TP directly because it has a 100-μm filter, and TP laboratory methods are unfiltered (Patton and Kryskalla, 2003).
The EZ7800 TOPHO uses the blue method and can measure a range of 0–5 milligrams per liter (mg/L) of phosphorus nearly every 23 minutes. For this study, the EZ7800 TOPHO sampled every 30 minutes. It is a cabinet-based analyzer measuring 68.8 centimeters (cm) tall, 46 cm wide, and 34 cm deep and weighing about 25 kilograms (kg), depending on analyzer options. For surface waters, the analyzer requires the addition of the EZ9020 fast loop filtration system. This filtration system is a continuous flow cell with a stainless steel 100-μm filter mounted inside of it and requires the use of compressed air, which is used to backflush the filter. The sample is drawn from a small, continuously circulating side vessel and sent to the EZ7800 TOPHO’s digestion chamber, where the persulfate digestion takes place. The digestion uses heat and pressure to boil the sample and reagent mixture. To cool the sample back down for absorbance measurements, the analyzer required the use of continuously circulating cold water. Typically, this would be done with continuously flowing tap water at a municipal plant; however, tap water was not available at the testing site. To compensate for this, a water chiller was installed to continuously supply cooling water to the EZ7800 TOPHO. Because of the large amounts of reagent required, the reagent was supplied by the operator and mixed according to manufacturer specifications (Hach, 2019). The analyzer has manual cleaning and calibration settings with a variety of communication options. For this study, Modbus TCP was used in conjunction with a Campbell Scientific CR6 datalogger.
Hach Phosphax sc
The Phosphax is a cabinet style orthophosphate analyzer originally designed for use at municipal water treatment facilities (Hach, 2021). The cabinet is 72 cm tall, 54 cm wide, and 37 cm deep; it weighs 29 kg and can be adapted to a wide variety of environmental conditions. For surface waters, the Phosphax requires the addition of the Filtrax, which is a filtration unit that feeds sample water to the Phosphax. The Filtrax is a separate cabinet measuring 53 cm tall, 43 cm wide, and 22 cm deep and weighing 22 kg. The Filtrax continuously switches between pulling samples from two different 0.45-μm filters equipped with water circulation. The maximum head difference between the filters and Filtrax is about 3 meters (m) with clean filters. This analyzer uses the yellow method and can sample every 5 minutes; however, for this study, it was set to a 15-minute interval. The analyzer has automatic cleaning that was run daily as recommended by the manufacturer. The Phosphax was controlled with a Hach SC4200 and equipped with Claros–Mobile Sensor Management, which allowed for cellular communication. For datalogging purposes, the Phosphax was additionally connected to a Campbell Scientific CR6 datalogger via Modbus TCP.
Sea-Bird Scientific HydroCycle-PO4
The HydroCycle is different from cabinet-based analyzers. It is the only self-contained analyzer that does not have a separate filtration unit and is specifically designed to be deployed in situ. It is a wet-chemical analyzer that uses the blue method to supply continuous orthophosphate measurements. The instrument range is 0–0.3 mg/L of phosphorus, but the upper range can be increased to 1.2 mg/L if validated with user samples. The analyzer is cylindrical, measuring 56 cm tall with an 18-cm diameter weighing about 7.6 kg with the protective casing. The sample is drawn through the bottom of the analyzer through a coarse copper mesh screen and then through a 5–10-μm filter. This analyzer is the only one without a heated reaction chamber, and therefore, the only one with a variable reaction time with a mean of 15 minutes per sample. Additionally, the analyzer has a calibration standard check that it performs at an operator-specified interval. This standard check is for operator sample verification and does not change the output values of the analyzer. The calibration standard check was run at the manufacturer-recommended interval of every six samples. For this study, the Hydrocycle was run every hour to increase the lifespan of the filter and length between required maintenance. The analyzer was controlled via SDI–12 communications by a Campbell Scientific CR6 for this study.
YSI Inc. Alyza IQ PO4
The Alyza is an online, cabinet-style analyzer originally designed for the continuous monitoring of orthophosphate at municipal water treatment facilities (YSI, 2021). The cabinet is about 77.5 cm tall, 67.5 cm wide, and 44.5 cm deep. It weighs about 37 kg (depending on the equipment) and can be equipped for a wide variety of environmental conditions. The sample is drawn into the analyzer through an onboard pump via a large rectangular 0.45-μm filter that measures about 36.6 cm tall and 25.5 cm wide. With a clean filter, a total head difference of about 2 m is possible between the filter and main cabinet. The onboard pump runs continuously, pumping water through the filter into a small interior reservoir from which the sample is collected. The sample is analyzed using the yellow method by detecting the change in absorbance at a wavelength of 400 nanometers (nm). The analyzer can sample every 5 minutes but was set to a 15-minute interval for this study. It was also set to automatically clean and complete a two-point calibration daily. The analyzer is controlled by the IQ Sensor Net, which offers a wide variety of communication options. For this study, the analyzer was set up for Modbus RTU communications with a Campbell Scientific CR6.
Site Description
The equipment was installed at the Vermilion River near Danville, Illinois (USGS station 03339000; fig. 1). The watershed is about 3,700 square kilometers (km2), and agriculture is the primary land use (Yang and others, 2018). The site was chosen for its accessibility, availability of alternating current power, and wide range of environmental conditions. The site is also part of an existing study examining nutrient loading, where continuously monitored (15-minute interval) and discrete samples have been collected regularly since 2015 (Hodson and others, 2021). The maximum, minimum, and median conditions for several water properties for the 2015–20 water years (October 1–September 30) are listed in table 2, and a summary of discrete data is documented in table 3. The data from previous years are available in the USGS National Water Information System database (U.S. Geological Survey, 2021b).
Table 2.
Continuously monitored water properties measured at the Vermilion River near Danville, Illinois (U.S. Geological Survey station 03339000) for the 2015–20 water years (U.S. Geological Survey, 2021b).[Temp., temperature; °C, degree Celsius; SC, specific conductance; μS/cm, microsiemens per centimeter; DO, dissolved oxygen; mg/L, milligram per liter; FNU, formazin nephelometric unit; <, less than]
Table 3.
Concentrations determined in discrete water samples collected from the Vermilion River near Danville, Illinois (U.S. Geological Survey station 03339000) for the 2015–20 water years (U.S. Geological Survey, 2021b).[mg/L, milligram per liter]
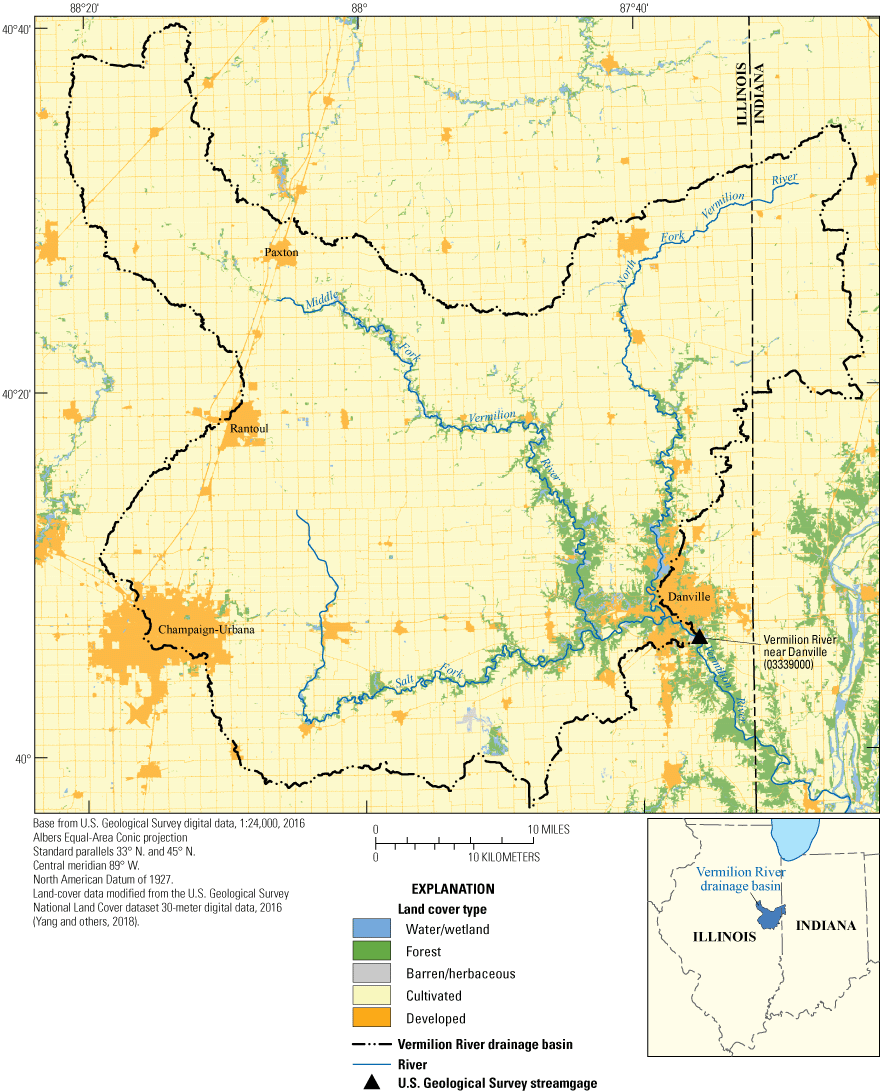
Map of the Vermilion River Basin showing land use and Vermillion River near Danville, Illinois (U.S. Geological Survey station 03339000).
A pumping system was constructed in 2017 to draw water from the river via a submersible pump into various tanks and flowing water chambers. The pumped water has about a 9-m maximum head difference and a 28-m run to the gage house. The pumping system was necessary to meet the flow requirements of all the analyzers while keeping them safely out of the river’s flood zone. The pumped water is distributed from a custom manifold to two tanks and a flow cell. A 30-gallon (gal) induction tank housed the Alyza filter and the Sea-Bird HydroCycle. The EZ7800 TOPHO has the EZ9020 filtration unit that is designed as a flow cell through which water continuously flows. The Phosphax filters were housed in a 12-gal plating tank. All tanks and cells had continuous flow at a minimum of 5 gallons per minute (gal/min), depending on river stage. The building where all the instrumentation was housed was heated during the winter months to prevent freezing.
Methods
Field and laboratory trials were designed to verify analyzer results. The verification methods used are as follows:
-
Laboratory trials were designed to verify the analytical methods of each analyzer across a large selection of known dissolved phosphorus concentrations. Criteria in the verification include the following:
-
Field testing was devised to verify the analyzers in a surface-water environment that represented conditions typical in many midwestern watersheds. Criteria in the verification include the following:
Laboratory standards and discrete samples were sent to the USGS National Water Quality Laboratory (NWQL) for analysis. Discrete water-quality samples were collected during maintenance visits, during scheduled routine sampling, or with an automated sampler. These samples allowed for quality assurance of laboratory standards and direct comparisons to each analyzer. Analytical method information for the discrete water quality samples is provided in table 4. Discrete samples were collected directly from the pump line supplying the analyzers with river water. The automated sampler intake was inside the 30-gal induction tank. Discrete and analyzer data collected at the Vermilion River near Danville, Illinois (USGS station 03339000) are available from the USGS National Water Information System database (U.S. Geological Survey, 2021a). Additional data on laboratory standards analyzed by NWQL are in appendix 1.
Table 4.
Analytical method information for discrete water-quality samples.[H2SO4, sulfuric acid; <, less than; mg/L, milligram per liter; µm, micrometer]
| Constituent | Preservation | Analysis method | Limit detection method |
|---|---|---|---|
| Total phosphorus | Chilled, H2SO4 acid to pH<2 | Colorimetry, alkaline persulfate digestion (Patton and Kryskalla, 2003) | 0.01 mg/L |
| Orthophosphate | Filtered (0.45 µm), chilled, dark bottle | Colorimetry, phosphomolybdate reduction (Fishman, 1993) | 0.004 mg/L |
Laboratory Trials
Laboratory trials were designed to verify each analyzer’s accuracy and precision across a large selection of known phosphorus concentrations. Additionally, standard tests with dissolved organics were performed because they are a known source of interference. Other laboratory tests, such as temperature or turbidity, were not performed. Although temperature affects the rate of the chemical reaction in the blue and yellow methods (Nagul and others, 2015; Baird and others, 20171), the three analyzers used in the laboratory trials all compensate for this by heating the reaction chamber; therefore, manufacturers can more reliably predict the rate of a sample reaction. Previous laboratory testing for the Sea-Bird Hydrocycle showed no clear pattern of the temperature’s effect on accuracy (Johengen and others, 2017). Turbidity was also not considered in laboratory testing because a wide range of turbidity values was expected in field trials.
Standards Verification
Phosphorus standard concentrations were 0.06, 0.25, 1, 2.5, and 5 mg/L of phosphorus. These standards were chosen based on the manufacturer-stated ranges of the EZ7800 TOPHO, Phosphax, and Alyza. The lowest concentration of 0.06 mg/L was limited by the Phosphax, and the highest concentration of 5 mg/L was limited by the EZ7800 TOPHO. Although the range of each analyzer is slightly different, it was deemed preferable to have comparable results among analyzers rather than the extreme ends of each analyzer’s range. Additionally, the lower range of values can be examined in field trials.
Standards were made on the day of testing using a 16.31 mg/L plus or minus (±) 0.5-percent Hach brand National Institute of Standards and Technology traceable stock phosphorus concentration (catalog number 17149, lot number A0170, expiration June 2025). The stock concentration was diluted to the desired concentration using Type I 18.2 megohm ultrapure deionized water (DIW). Quality control tests on the Type I DIW did not detect any phosphorus; therefore, additional phosphorus from the Type I DIW was considered negligible. Aliquots of each standard were sent to the USGS NWQL for quality control and analysis, and results are included in appendix 1. Differences in OP and TP NWQL tests are due to analytical error or uncertainty in the analysis. All phosphorus used in the standards testing was in the dissolved form; however, tests for both OP and TP were performed as a precaution.
All analyzers ran the same standard simultaneously for about 12 hours. Cleaning and (or) calibration cycles were run before and after each standard depending on manufacturer-recommended practices. The operation of these cycles allowed for analyzer stabilization effects, numerous samples, and possible drift while staying within the manufacturers’ recommendations for cleaning regiments.
Dissolved Organic Matter Verification
Dissolved organic matter (DOM) was verified using the 0.25 mg/L phosphorus standard and various amounts of the Suwannee River natural organic matter (catalog number 2R101N) from the International Humic Substances Society (IHSS). The 0.25 mg/L phosphorus standard was chosen based on median environmental conditions of the site while being within each analyzer’s stated range. An elemental compositional analysis of the organic matter indicates phosphorus was not detected. Three DOM concentrations were made using 10, 50, and 250 mg/L of Suwannee River natural organic matter. Each DOM standard was passed through a 0.45-μm capsule filter as a precaution to avoid damage to the analyzers. An aliquot of each standard was collected in triplicate and sent to the NWQL for verification of the phosphorus concentration. The mean OP for each DOM concentration was compared against analyzer results. Results are provided in appendix 1 (table 1.2).
Waste Production
The measurement of phosphorus requires chemical manipulation using toxic heavy metals and strong acids. Waste in this study was disposed of properly according to local regulations; however, it is important to note that regulatory requirements vary from State to State. Reagent chemical concentrations for each analyzer are not available because they are typically considered proprietary information by manufacturers. However, volumes of total waste and reagent usage are available. Total waste production is defined as the total amount of liquid passed through the analyzer and includes reagents, samples, and rinse water. Reagent volumes are defined as the volumes that contain heavy metals and strong acids. Total waste volumes were not directly measured because manufacturers frequently adjusted reagent, rinse, and sample volumes to improve analyzer performances. For this reason, it is advised that volumes in this report only be used as approximations.
Field Verifications
Field verifications took place at the Vermilion River near Danville, Illinois (USGS station 03339000) from November 20, 2020, to August 12, 2021. During this time, the analyzers were verified for accuracy, matrix considerations, and maintenance needs. Analyzers were compared to NWQL samples under a wide variety of site conditions to assess accuracy. The river matrix was verified based on turbidity effects on the analyzers. Maintenance needs were performed according to manufacturer recommendations, and data gaps were tracked.
Field Data Quality
Typical USGS practices for optical sensors involve regular fouling and calibration checks to verify proper sensor operation and data quality (Wagner and others, 2006). These practices are not feasible with most phosphorus analyzers due to the required wet chemistry. Manufacturers recognize these shortcomings and most implement some sort of regular cleaning and (or) calibration cycles. Problems arise because these processes are automated, and errors may not be immediately known. Analyzers typically have quality control alerts to inform the user of poor calibration or cleaning performance, but this also means the calibration and cleaning cycles themselves are a source of error. Whether or not the manufacturers take these automated cycles into account when reporting analyzer accuracy is unclear.
Data Gaps
Analyzer malfunctions and operator errors are costly and cause data gaps that are detrimental to the study’s scientific goals. Data gaps can be directly related to environmental conditions, the complexity of operating the analyzer, and the extent of maintenance requirements. Documenting these issues is an important step in understanding what causes data gaps and what can be done to mitigate them.
Analyzer malfunctions are defined as problems that can be attributed to the analyzer itself. Typically, these malfunctions are the result of a component failure, such as hardware or software malfunctions. These complications are usually more costly because they require a larger time investment by the user to diagnose the issue and repair it or send the analyzer to the manufacturer for repair. Such repairs involve constant communication with the manufacturer for guidance and support. The magnitude of the failure and the ability of the manufacturer to assist in a timely manner usually determine the amount of data lost during these periods.
Operator errors are equally as disruptive as analyzer errors but typically not as severe because they can often be quickly rectified. Examples of operator errors include reagents running out; not performing recommended part replacements in a timely manner; and more commonly, human errors. Operator errors also include site-specific errors that equally affect all analyzers, such as the failure of a water pump that supplied the analyzers with river water. Operator errors are subjective but give a sense of the difficulty in effectively maintaining and operating an analyzer.
Laboratory Verification Results
Laboratory testing of each phosphorus analyzer was completed in February 2021, which was near the beginning of the study to minimize the effects of analyzer maintenance needs regarding laboratory results. Any error caused by analyzer maintenance requirements are included in the field trials. Laboratory verification was performed using known standards with and without IHSS natural organic materials. Additionally, waste production was estimated based on manufacturer-supplied information.
Accuracy and Precision
Laboratory testing results of various phosphorus standard concentrations analyzed using the EZ7800 TOPHO, Phosphax, and Alyza are provided in table 5 and figure 2. Residuals were calculated by subtracting the mean concentration determined by NWQL from the concentration measured by the analyzer for the same standard. Accuracy and precision decreased as the phosphorus concentration increased for all analyzers. It should be noted that NWQL results for standards 2.5 and 5.0 mg/L of phosphorus are from TP tests because NWQL OP results were about 9 and 7 percent higher than TP for the 2.5 and 5 mg/L of phosphorus standards, respectively. Having OP results higher than TP is impossible by definition because OP is a part of TP, meaning that there was an unknown source of error in the NWQL OP analysis of the 2.5 and 5 mg/L of phosphorus standards.
Table 5.
Laboratory trial statistics of phosphorus concentrations for each analyzer by standard.[All concentrations are in milligrams per liter of phosphorus; NWQL, National Water Quality Laboratory]
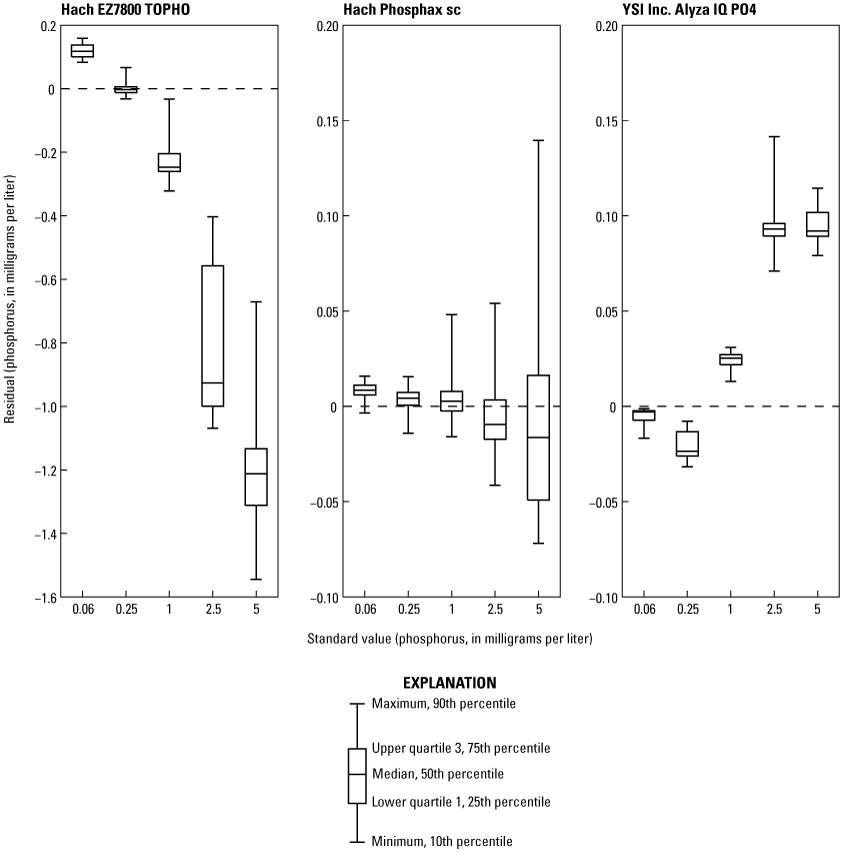
Residual phosphorus concentrations for each analyzer and standard. Residual concentrations were determined by subtracting the phosphorus concentration determined by the National Water Quality Laboratory (NWQL) from the phosphorus concentration measured by the analyzer.
As the EZ7800 TOPHO does not have a stated accuracy by the manufacturer, discrete samples are recommended to determine data quality. The EZ7800 TOPHO had substantial issues performing calibrations and deviated substantially from standard values. The range of absolute differences between the mean analyzer concentration and the National Water Quality Laboratory concentration were 0.003–1.187 mg/L of phosphorus. The problem was determined to be sample contamination from the previous run, meaning the analyzer was not draining or rinsing effectively. After working with the manufacturer, it was determined to be a design flaw. The sample contamination was most problematic with large, consecutive changes in concentration, such as the recommended 0 and 5 mg/L concentrations for calibration. The EZ7800 TOPHO uses a two-point calibration where the mean of three measurements of each standard is used to determine the linear regression coefficients. It is possible to manually change the EZ7800 TOPHO’s linear regression coefficients, and several attempts were made using the standard results to develop a linear regression as shown in figure 3. To minimize the effects of sample contamination, the analyzer was run for more than 12 hours, and the first sample results were removed as the analyzer stabilized. Linear regressions using the 0 and 5 mg/L standards as in the EZ7800 TOPHO’s calibration procedure or incorporating all standards produced regressions with various levels of bias depending on standard concentration. The only regression that caused all results to vary about zero was a quadratic regression, which is not how the analyzer was designed. All calibration regressions showed poor data quality and each regression showed bias, which is evident in figure 3. The factory calibration was kept as the final regression to avoid manipulating the analyzer in a way the manufacturer did not intend.
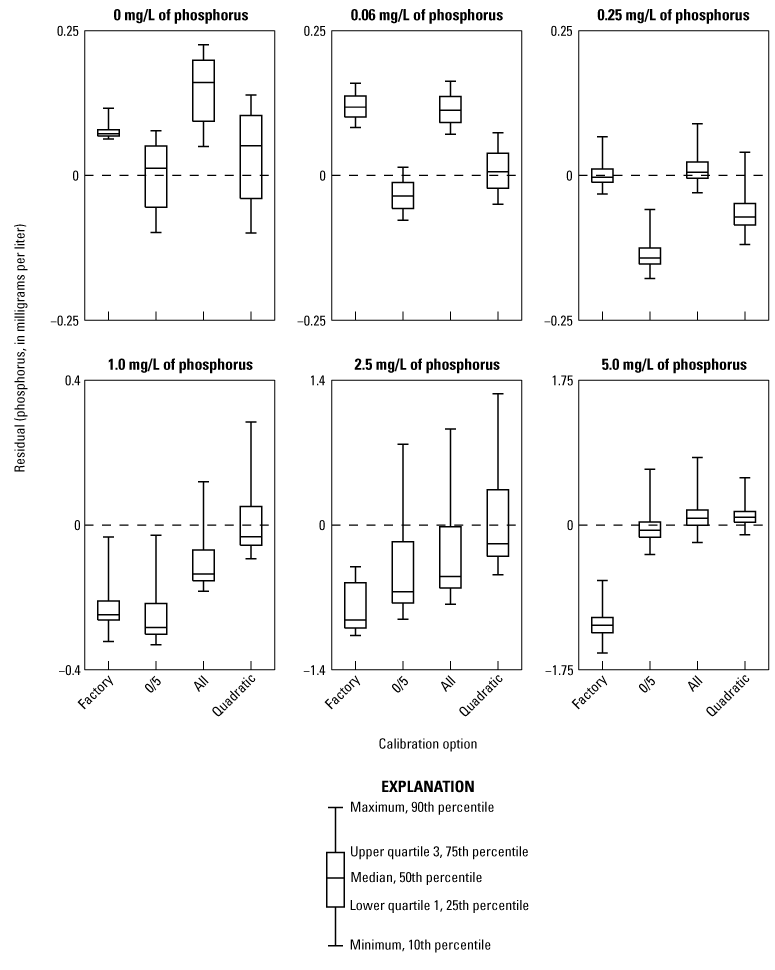
Residual phosphorus concentrations for tested calibration options for the Hach EZ7800 TOPHO. Residual concentrations were determined by subtracting the phosphorus concentration determined by the National Water Quality Laboratory (NWQL) from the phosphorus concentration measured by the analyzer. [Factory, factory default calibration; 0/5, linear regression using only 0 and 5 milligrams per liter of phosphorus standards; All, linear regression using all standards; Quadratic, quadratic regression using all standards]
The manufacturer-stated accuracy for phosphorus concentrations measured by the Phosphax is 2 percent ± 0.05 mg/L. For all standards tested, the Phosphax measurements were within the manufacturer-stated accuracy. The range of absolute differences between the mean analyzer concentration and the National Water Quality Laboratory concentration were 0.003–0.008 mg/L of phosphorus. The analyzer had a downward pattern in median values as the concentration of the standard increased (fig. 2, table 5), which is likely due to a bias in the calibration values. This analyzer does not have automatic calibrations; only automatic cleanings that were performed daily. Additionally, it is evident that precision decreases as the concentration of the standard increases, whereas the standard deviation increased from 0.004 mg/L for the 0.06-mg/L standard to 0.047 mg/L for the 5.0-mg/L standard (table 5).
The mean concentrations (table 5) for standards 1.0 and 2.5 mg/L measured by the Alyza were higher than the manufacturer-stated accuracy of 2 percent or ±0.02 mg/L (whichever is higher) at 2.4 and 3.6 percent, respectively. However, for the 0.06-, 0.25-, and 5-mg/L standards, mean phosphorus concentrations measured by the Alyza fell within these bounds. It is likely that this extra source of error resulted from the daily cleaning and calibration cycles being completed between standard runs. Evidence for this conclusion is provided in figure 2, where no patterns exist, and none of the boxplots for any of the standards is associated with the zero line. This highlights the importance of the automated cleaning and calibration cycles and their effect on the data quality from the Alyza. The range of absolute differences between the mean analyzer concentration and the National Water Quality Laboratory concentration were 0.006–0.094 mg/L of phosphorus. No patterns in precision were observed with a standard deviation of 0.005 mg/L (table 5).
Dissolved Organic Matter Response
The effects of three concentrations of IHSS Suwannee River natural organic matter on analyzer-measured phosphorus concentrations are shown in figure 4 and table 6. The EZ7800 TOPHO and Phosphax indicated a decrease in precision as DOM concentrations increased, and their standard deviations were about three times higher on the 250-mg/L DOM standard concentration when compared to the 50-mg/L DOM standard concentration (table 6). It is unclear why the EZ7800 TOPHO appears to have performed better at the 50-mg/L DOM concentration, but it may be related to the number of samples processed; it had 12 runs completed for the 10-mg/L DOM standard compared to 32 runs for the 50-mg/L DOM standard. The standard deviation of the first 16 runs was more than double the latter 16 runs, indicating a long stabilization period. The Alyza indicated a considerable bias in accuracy at the 250-mg/L DOM concentration, where the mean value of the 250-mg/L standard is more than double the 10-and 50-mg/L DOM standards. This analyzer does have an additional background correction setting for interferences caused by elevated levels of organic matter, which was active during testing.
Table 6.
Laboratory trial statistics for phosphorus concentrations measured by each analyzer for three standard concentrations of dissolved organic matter.[DOM, dissolved organic matter; mg/L, milligram per liter; NWQL, National Water Quality Laboratory]
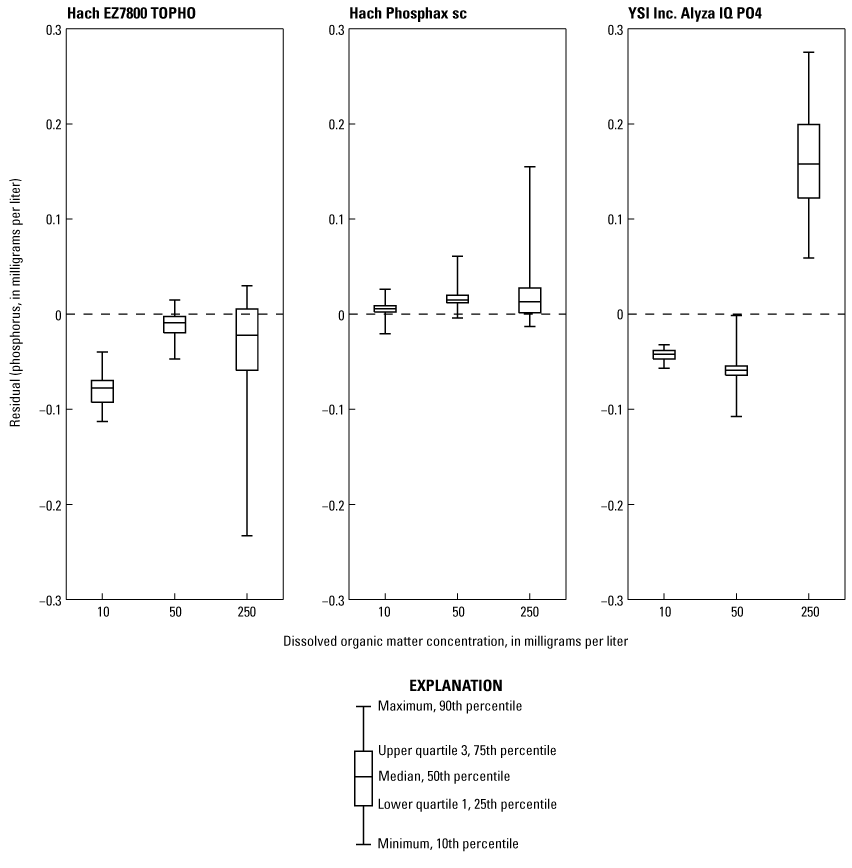
Residual phosphorus concentrations for each analyzer for three dissolved organic matter concentrations made using a 0.25 milligram per liter phosphorus standard mixed with several concentrations of Suwannee River natural organic matter. Residual concentrations were determined by subtracting the phosphorus concentration determined by the National Water Quality Laboratory (NWQL) from the phosphorus concentration measured by the analyzer.
Waste Production
Manufacturer-specified total volume and reagent volume is listed in table 7. A wide variety of total and reagent volumes exists among analyzers per sample. The EZ7800 TOPHO uses the most total and reagent volumes, whereas the Alyza uses the least. It is important to note that analyzer design typically determines waste volumes. For example, the EZ7800 TOPHO was designed to target total phosphorus and, as a result, has a large digestion vessel that would require special design considerations, including larger volumes. The Alyza targets orthophosphate and uses microfluidics and separate waste tubing to reduce total waste and reagent volumes.
Field Verification Results
Field data were gathered from November 20, 2020, through August 12, 2021. Time series data are shown in figure 5, and a discrete data summary is listed in table 8. All analyzers typically had the same patterns, and the largest differences were from the EZ7800 TOPHO in June and July. Seasonal patterns are also evident with higher orthophosphate concentrations during the winter months. Discrete data indicate OP and TP concentrations were comparable to previous years (table 3).
Table 8.
Summary of concentrations determined in discrete samples collected from the Vermilion River near Danville, Illinois (U.S. Geological Survey station 03339000) during the study period (November 20, 2020–August 12, 2021). (Data summarized from U.S. Geological Survey, 2021b)[mg/L, milligram per liter]
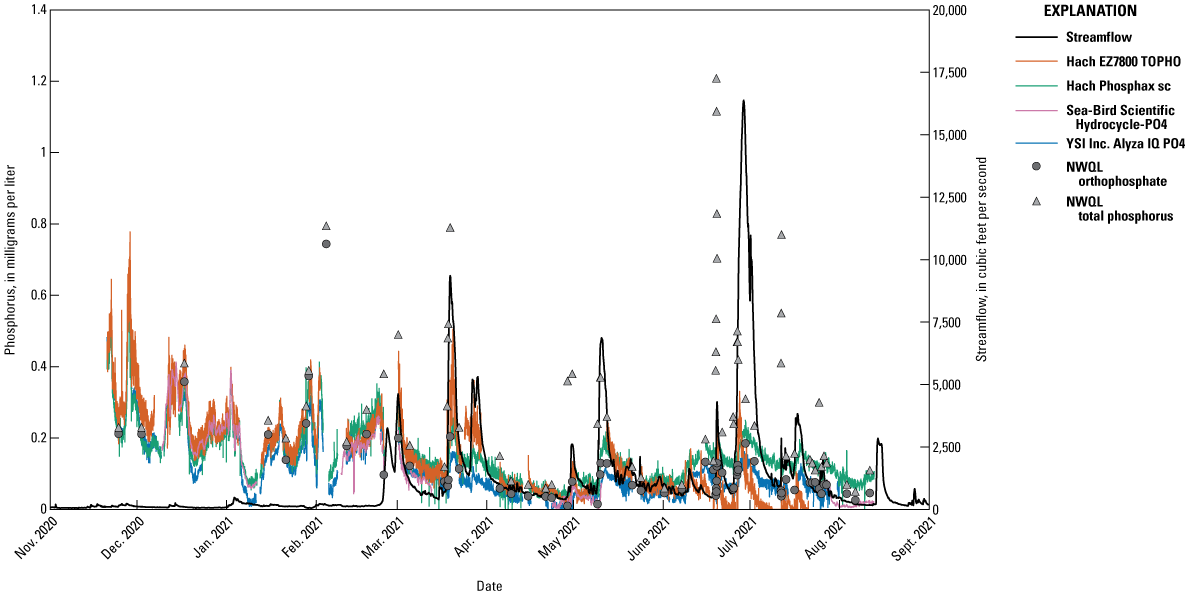
Timeseries of continuously measured phosphorus concentrations by each analyzer at the Vermilion River near Danville, Illinois (U.S. Geological Survey station 03339000) and orthophosphate and total phosphorus concentrations determined by the National Water Quality Laboratory (NWQL) in discrete samples collected from the Vermillion River at the same site. (Data from U.S. Geological Survey, 2021b)
Analyzer and Discrete Data Quality
Linear regressions between OP discrete samples and each analyzer are shown in figure 6. Strong correlations (coefficient of determination equal to or greater than 0.9) were observed from the Alyza, Phosphax, and Hydrocycle, along with a moderate correlation (coefficient of determination of 0.47) for the EZ7800 TOPHO. Regressions between OP concentrations in discrete samples and the difference (residual) in OP concentrations between the analyzer and discrete samples are shown in figure 7. Weak but statistically significant linear relations (p-values less than 0.001 based on 95-percent confidence interval) exist for the Phosphax and Alyza but not for the EZ7800 TOPHO or Sea-Bird Scientific HydroCycle-PO4.
All analyzers in the study used some combination of automated cleaning or calibration. Because of the complexity and importance of these processes, discrete samples become paramount to verifying accuracy and proper operation of the analyzer. This can be problematic because most operators send verification samples to laboratories for analysis, and it may take weeks to receive results. Additionally, multiple check samples are usually required to conclude whether or not there is a problematic pattern. Combined, these issues indicate that long periods of poor data quality are likely before a problem is diagnosed.
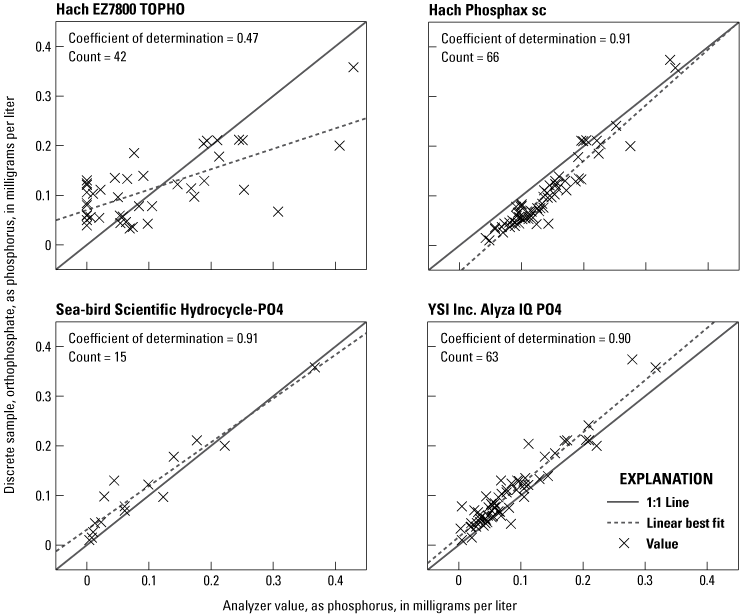
Linear regressions for each analyzer showing relation between orthophosphate concentrations measured by the analyzer and orthophosphate concentrations determined by the National Water Quality Laboratory in discrete samples collected from the Vermilion River near Danville, Illinois (U.S. Geological Survey station 03339000).
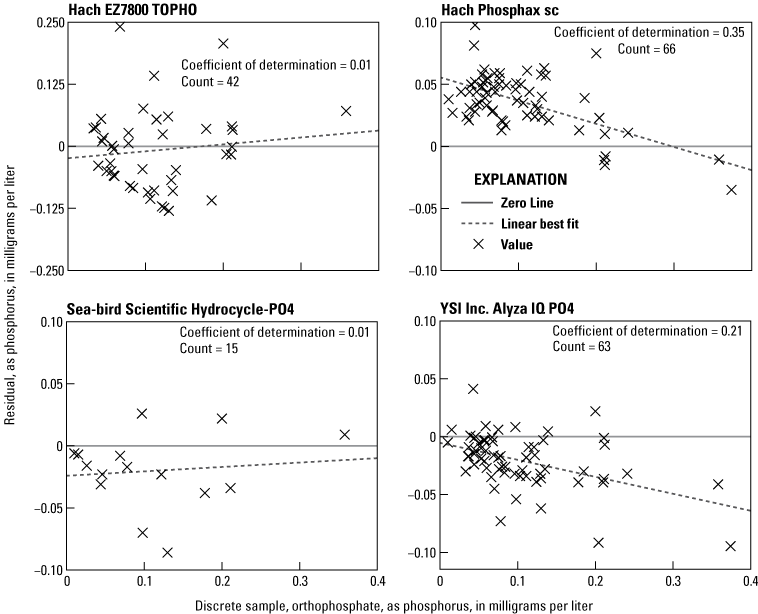
Concentrations of orthophosphate in discrete samples determined by the National Water Quality Laboratory regressed against the difference between analyzer-measured concentrations and discrete sample concentrations in samples collected from the Vermilion River near Danville, Illinois (U.S. Geological Survey station 03339000).
The phosphorus concentrations measured by the EZ7800 TOPHO had a moderate relation with OP discrete samples (fig. 6), and no bias with discrete OP concentration (fig. 7). This analyzer was designed to target TP with its large 100-μm pore size filter and persulfate digestion. However, the EZ7800 TOPHO had no relation with TP with a coefficient of determination of 0.01. It is unclear why the phosphorus concentration measured by the EZ7800 TOPHO did not indicate any relation with TP although it is likely procedural and related to the sample contamination problem described in the “Laboratory Verification Results” section.
The OP concentrations measured by the Phosphax had a consistent high bias compared to OP concentrations determined in discrete samples and a significant negative linear correlation with increasing concentration (figs. 6 and 7). The Hach Phosphax does not have automated calibrations; it only has cleaning cycles, so it is likely that the initial calibration was slightly off even though it was within the stated analyzer accuracy. However, this revelation led to noticeable biases in the dataset, which demonstrated how critical the initial calibration correction is for this analyzer.
The OP concentrations measured using the Sea-Bird Scientific Hydrocycle-PO4 had a strong regression with OP concentrations determined in discrete samples (fig. 6), and residuals indicate no correlation with concentration (fig. 7). This analyzer does have a slight low bias (fig. 6), and this has been a consistent finding through multiple studies (Johengen and others, 2017; Snazelle, 2018). All discrete sample concentrations with one exception were within the manufacturer’s stated range for the Hydrocycle; however, all concentrations were within the theoretical operating limits (table 1).
The OP concentrations measured by the Alyza have a strong linear regression with orthophosphate concentrations in discrete samples and has a consistent low bias that increases with concentration (figs. 6 and 7). Reasons for the strong regression and low bias are unclear, but it is hypothesized that the problem is in the daily calibration correction procedure, which would be expected to have nullified any bias. This may be related to the laboratory findings indicating the daily calibration correction-induced error in the measurements.
Turbidity Response
A large portion of phosphorus is associated with particulates in the Vermilion River. Discrete sample data indicate that the mean OP concentration is about 63 percent of TP concentration at turbidities less than 100 formazin nephelometric units (FNUs) but only about 17 percent at turbidities greater than 100 FNUs. Additionally, TP concentrations have a moderately strong relation with turbidity (fig. 8). Regression results between analyzers and turbidity did not indicate any relation (coefficient of determinations less than 0.1), and neither did the regressions between the difference in analyzer discrete OP concentrations and turbidity (coefficients of determination less than 0.05). This is an unexpected finding because the EZ7800 TOPHO and the Sea-Bird Scientific HydroCycle-PO4 had filter pore sizes larger than the conventional 0.45 μm, and therefore, were expected to have OP concentrations greater than those in the discrete samples because they were analyzing more particulate phosphorus.
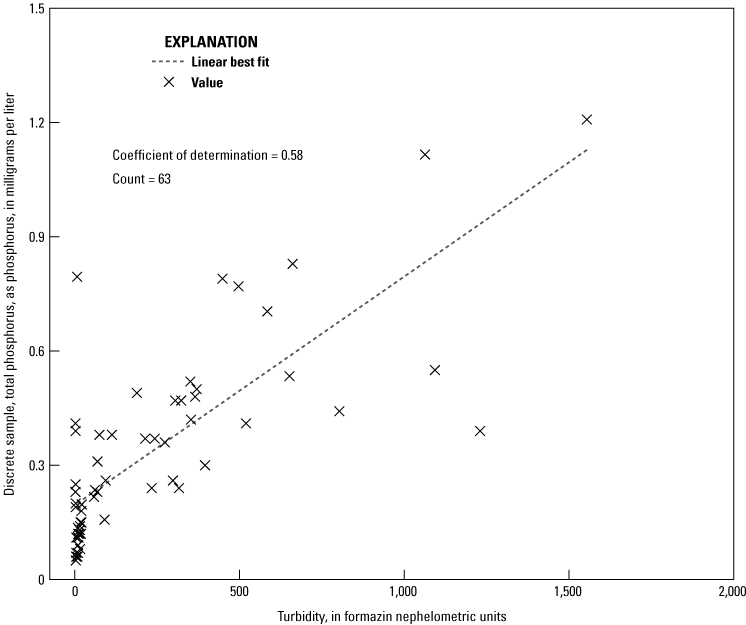
Regression of turbidity and total phosphorus concentrations determined by the National Water Quality Laboratory in discrete samples collected from the Vermilion River near Danville, Illinois (U.S. Geological Survey station 03339000). (Data from U.S. Geological Survey, 2021b)
The EZ7800 TOPHO has a filter with a mean pore size of 100 μm and an added persulfate digestion. Although the EZ7800 TOPHO does not measure a true TP concentration, this analyzer is designed to analyze more particulates and break down phosphorus-containing compounds to make its analysis more comparable to TP. The EZ7800 TOPHO had no relation with any other properties except OP. This includes turbidity, which did have a moderately strong coefficient of determination with TP (fig. 8). Reasons why the EZ7800 TOPHO did not relate with turbidity or TP likely result from an issue with turbidity because it did not meet manufacturer specifications when turbidity was greater than 100 FNUs. For the 26 discrete samples that had turbidity values greater than 100 FNUs, the EZ7800 TOPHO was functional for 16 of them and measured 0 mg/L of phosphorus for 9 out of these 16 samples. Further investigation indicates that TP concentrations for discrete samples have a moderate correlation (coefficient of determination=0.45) with the TP concentrations measured by the EZ7800 TOPHO for turbidity values less than 100 FNUs. These conditions also exist when OP makes up a larger part of TP. This evidence indicates that turbidity or another characteristic associated with higher turbidity levels is interfering with the operation of this analyzer.
The filter for the Sea-Bird Scientific Hydrocycle-PO4 has a mean pore size of 7.5 μm, which is more than 10 times larger than the 0.45-μm filter used to determine OP. The larger filter size was hypothesized to have caused this analyzer to have a high bias when compared to discrete OP samples because it allowed more particulate-associated phosphorus into its analysis. That relation had been observed previously with Cycle-PO4, the predecessor to this analyzer (Terrio and others, 2015). This finding was not observed with the Sea-Bird Scientific Hydrocycle-PO4, and OP data showed a low bias (fig. 6) and no correlation with turbidity.
The Sea-Bird Scientific Hydrocycle-PO4 has extensive quality control software that allows the user to analyze sample runs. One of those tools has the ability to analyze light absorption during the chemical reaction of each sample. Using this tool, it is hypothesized that the full color development may not always be present during the correct part of its analysis. An example of the problem with an onboard calibration standard check is shown in figure 9. This run was chosen because the analyzer had just been serviced by the manufacturer before the deployment, and a discrete OP sample was collected within the hour of the analyzer sample for comparison. The spike just before minute eight in figure 9 indicates the part of the reaction in question. According to the user’s manual, in this section, the analyzer should be rinsing and preparing for the next sample. However, additional light absorption is present, which may indicate further color development. A second calibration check that does not have this issue was included for comparison (fig. 9). By not allowing full color development, the analyzer will underestimate light absorption and in turn underestimate OP concentration. From direct communications with the manufacturer, it was agreed that the spike is an unknown solution that is outside the optical chamber during the reaction phase, but then was swept through during the final flushing phase resulting in the spike. The manufacturer has not performed an analysis on what that spike may be, but it is accepted as normal behavior of the analyzer at the time of writing. It is unclear if the Hydrocycle would have indicated any correlation with turbidity had this potential issue not existed.
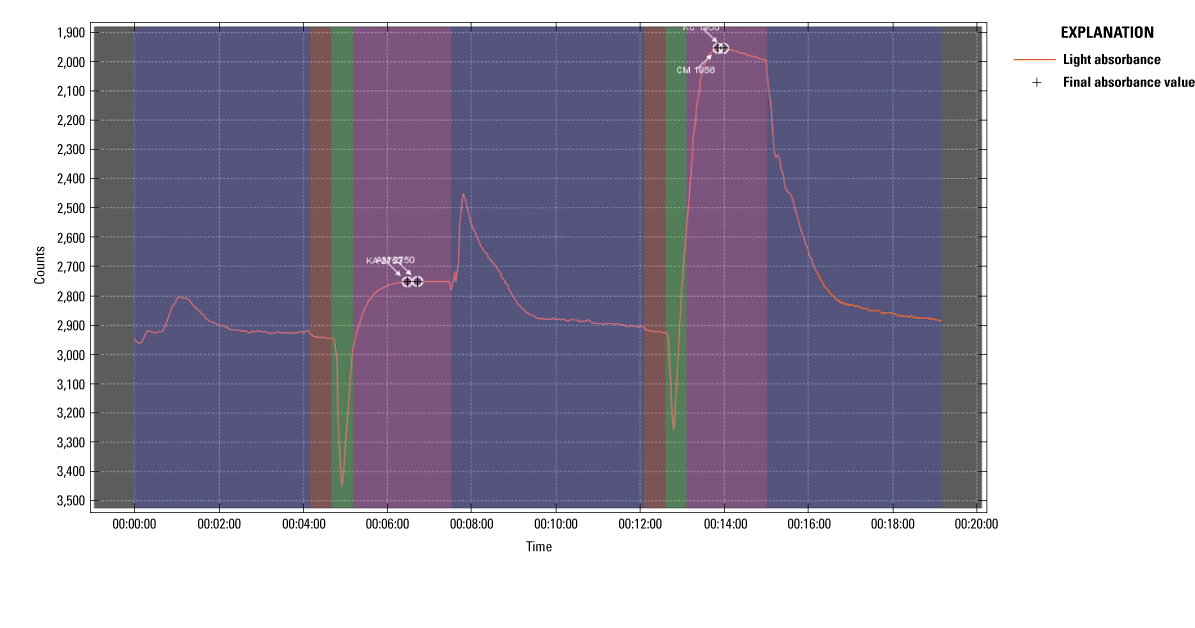
Example of reaction curve issue from Sea-Bird Scientific Hydrocycle-PO4 software.
Data Coverage and Maintenance
Data coverage is listed in table 9. Missing data because of laboratory trials was not included in the total possible data points. Differences in the total possible data points are the result of the removed standards testing periods and analyzer sample intervals. It should be noted that the EZ7800 TOPHO and Phosphax were serviced quarterly by Hach personnel onsite. YSI Inc. and Sea-Bird Scientific did not have onsite service available at the time of the study. All analyzers experienced user error and various malfunctions during the study period, which resulted in data loss.
The EZ7800 TOPHO had 76-percent data coverage. Despite quarterly servicing, the tubing was subject to clogging, meaning the daily cleanings were not effective. The operator error was much higher largely because of the amount of reagent consumption. From table 7, the amount of reagent consumption per run is much higher than the other analyzers requiring more frequent replacement. Replacement rates depend on several factors including container size, operator- or manufacturer-supplied reagents, and transportation and site storage safety considerations.
The Phosphax had 95-percent data coverage. Most of the missing data were from a period where internal leaking took place and needed repair. Additionally, the communications hardware malfunctioned, but the analyzer was able to continue sampling during this period, which allowed the data to be recoverable. If the data had not been recoverable, the Phosphax would have had about 86-percent data coverage during the study. Many internal components were replaced quarterly, which likely resulted in the high percentage of data coverage.
The Sea-Bird Scientific Hydrocycle-PO4 had 33-percent data coverage. The Hydrocycle initially operated above the recommended range of 0.3 mg/L of phosphorus, but within the hypothetical manufacturer extended range of 1.2 mg/L of phosphorus (table 1, fig. 5). It became clear that the operator could not adequately clean the analyzer at 2-week intervals, with several trial-and-error periods from March through May 2021 trying to diagnose and fix the problem. During this time, the analyzer produced very little usable data. The analyzer was sent back to the manufacturer for analysis and repair in June 2021. After repair, the analyzer was fully functional and put back into normal operation in July 2021. It is unclear what river matrix characteristics caused the analyzer’s function to degrade because the degradation slowly became apparent during the months of usage. In addition, the analyzer could have benefitted from a more frequent cleaning interval. This is the only analyzer in the study that relied on manual cleaning by the operator rather than an automated cleaning procedure.
The Alyza had 78-percent data coverage. Hardware malfunctions were mainly related to clogged parts and halted further analysis until the issue was rectified. It is possible the daily cleaning should have been run more frequently to help with hardware issues. Annual maintenance, which includes hardware replacement, was not done because the study period was less than a year. Many of the hardware solutions were part of the annual maintenance routine, indicating the Vermilion River may be harsher than the environment intended for the analyzer. The analyzer also had several software malfunctions related to communication errors between different parts of the analyzer. These were often fixed by resetting the analyzer or firmware upgrades.
Summary
Phosphorus is an important aspect of nutrient research because of its association with impaired waters. More frequent phosphorus data would be beneficial to meet surface-water scientific goals, and several analyzers can be used to continuously measure phosphorus concentrations. Phosphorus analyzers use complex automated wet-chemistry reactions to determine phosphorus concentrations, with most being designed for use in municipal water treatment facilities. This report presents the results of an analyzer verification study of selected commercially available phosphorus analyzers for their applicability to scientific surface-water applications. Analyzers in this study were the Hach EZ7800 TOPHO (hereafter referred to as “EZ7800 TOPHO”), Hach Phosphax sc (hereafter referred to as “Phosphax”), Sea-Bird Scientific HydroCycle-PO4 (hereafter referred to as “Hydrocycle”), and the YSI Inc. Alyza IQ PO4 (hereafter referred to as “Alyza”).
The analyzers were assessed using multiple laboratory and field tests. Laboratory trials were designed to assess each analyzer’s accuracy and precision with and without dissolved organic matter (DOM), as well as an estimation of waste production. Standard values of 0.06, 0.25, 1.0, 2.5, and 5.0 milligrams per liter (mg/L) of phosphorus were used for accuracy and precision trials. The DOM trials used a 0.25-mg/L phosphorus standard with 10, 50, and 250 mg/L of natural organic matter added. Field trials were designed to investigate each analyzer’s response to a typical midwestern river by analyzing discrete samples, turbidity response, and data coverage.
Laboratory trials indicate that accuracy and precision typically decreased as concentration increased across all analyzers. Ranges of absolute differences between the mean analyzer concentration and the National Water Quality Laboratory concentration were 0.006–0.094, 0.003–0.008, and 0.003–1.187 mg/L of phosphorus for the Alyza, Phosphax, and EZ7800 TOPHO, respectively. Standard deviations ranged from 0.005 to 0.009, 0.004 to 0.047, and 0.022 to 0.234 mg/L of phosphorus for the Alyza, Phosphax, and EZ7800 TOPHO, respectively. Additionally, the automated cleaning and calibration procedures likely affect analyzer accuracy positively and negatively. Laboratory standard tests revealed issues with the calibration procedure of the EZ7800 TOPHO. Responses to increased DOM concentrations were observed at the 250-mg/L concentration, where the standard deviation was about three times higher for the Hach Phosphax and EZ7800 TOPHO compared to the 10- and 50-mg/L standards. The measured mean phosphorus concentration of the Alyza more than doubled when comparing the 250-mg/L standard to the 50- and 10-mg/L DOM concentrations. Waste production ranged from about 100 milliliters to less than 1 milliliter per analyzer sample run.
Field verification was completed at Vermilion River near Danville, Illinois (U.S. Geological Survey station 03339000). The analyzers were evaluated for accuracy, turbidity response, and data coverage. Strong correlations (coefficient of determination equal to or greater than 0.9) were observed from the Alyza, Phosphax, and Hydrocycle. In addition, a moderate correlation (coefficient of determination of 0.47) was observed for the EZ7800 TOPHO when phosphorus concentrations measured by the analyzer were regressed against orthophosphate (OP) concentrations determined in discrete samples. Discrete concentration data revealed potential systematic errors in the EZ7800 TOPHO that affected accuracy. Regression results between the analyzers and turbidity did not indicate any relation, and neither did the difference between the analyzer-measured OP concentration and the discrete sample OP concentration that was regressed against turbidity despite the larger filter pore size of the HydroCycle and EZ7800 TOPHO. Maintenance frequency and analyzer malfunctions were most affected by elevated turbidity levels across all analyzers. High turbidity levels were a challenge because of tubes clogging and the impairment of optical chambers. How each analyzer handled turbidity was the largest single indicator of analyzer performance. Discrete samples ensure proper analyzer performance but require additional processing. Several discrete samples were required to diagnose problematic patterns resulting in poor data quality.
Laboratory and field tests indicate that each phosphorus analyzer could be a viable tool for scientific goals depending on the surface water of interest. Because of the complexity of the analyzers, they require a substantial time investiture to operate effectively and would likely require an experienced and well-trained technician. Additionally, three of the four analyzers were designed for usage in municipal water treatment facilities and required substantial infrastructure upgrades to adapt them to surface-water applications.
References Cited
Drummond, L., and Maher, W., 1995, Determination of phosphorus in aqueous solution via formation of the phosphoantimonylmolybdenum blue complex—Re-examination of optimum conditions for the analysis of phosphate: Analytica Chimica Acta, v. 302, no. 1, p. 69–74. [Also available at https://doi.org/10.1016/0003-2670(94)00429-P.]
Elser, J.J., Bracken, M.E.S., Cleland, E.E., Gruner, D.S., Harpole, W.S., Hillebrand, H., Ngai, J.T., Seabloom, E.W., Shurin, J.B., and Smith, J.E., 2007, Global analysis of nitrogen and phosphorus limitation of primary producers in freshwater, marine and terrestrial ecosystems: Ecology Letters, v. 10, no. 12, p. 1135–1142. [Also available at https://doi.org/10.1111/j.1461-0248.2007.01113.x.]
Fishman, M.J., 1993, Methods of analysis by the U.S. Geological Survey National Water Quality Laboratory—Determination of inorganic and organic constituents in water and fluvial sediments: U.S. Geological Survey Open-File Report 93–125, 217 p., accessed August 2021 at https://doi.org/10.3133/ofr93125.
Hach, 2019, EZ7850 series—Total phosphorus and phosphate: Hach, 9 p., accessed October 2020 at https://www.hach.com/ez7822-total-phosphorus-analyzer-0-01-2-mg-l-tp/product-downloads?id=62617481027&callback=pf.
Hach, 2021, PHOSPHAX sc, PHOSPHAX indoor sc user manual (7th ed.): Hach, 106 p., accessed July 2021 at https://www.hach.com/asset-get.download.jsa?id=7639982973.
Hodson, T.O., Terrio, P.J., Peake, C.S., and Fazio, D.J., 2021, Continuous monitoring and Bayesian estimation of nutrient and sediment loads from Illinois watersheds, for water years 2016–2020: U.S. Geological Survey Scientific Investigations Report 2021–5092, 40 p. [Also available at https://doi.org/10.3133/sir20215092.]
Johengen, T., Purcell, H., Tamburri, M., Loewensteiner, D., Smith, G.J., Schar, D., McManus, M., and Walker, G., 2017, Performance verification statement for Seabird Scientific HydroCycle phosphate analyzer: Alliance for Coastal Technologies, ACT VS, 17–06, 46 p. [Also available at https://www.act-us.info/Download/Evaluations/NextGenNutrient/SeaBird/SeaBird.pdf.]
Murphy, J., and Riley, J.P., 1962, A modified single solution method for the determination of phosphate in natural waters: Analytica Chimica Acta, v. 27, p. 31–36. [Also available at https://doi.org/10.1016/S0003-2670(00)88444-5.]
Nagul, E.A., McKelvie, I.D., Worsfold, P., and Kolev, S.D., 2015, The molybdenum blue reaction for the determination of orthophosphate revisited—Opening the black box: Analytica Chimica Acta, v. 890, p. 60–82. [Also available at https://doi.org/10.1016/j.aca.2015.07.030.]
O’Toole, M., Lau, K.T., Shepherd, R., Slater, C., and Diamond, D., 2007, Determination of phosphate using a highly sensitive paired emitter-detector diode photometric flow detector: Analytica Chimica Acta, v. 597, no. 2, p. 290–294. [Also available at https://doi.org/10.1016/j.aca.2007.06.048.]
Patton, C.J., and Kryskalla, J.R., 2003, Methods of analysis by the U.S. Geological Survey National Water Quality Laboratory—Evaluation of alkaline persulfate digestion as an alternative to Kjeldahl digestion for determination of total and dissolved nitrogen and phosphorus in water: U.S. Geological Survey Water-Resources Investigations Report 2003–4174, accessed August 2021 at https://doi.org/10.3133/wri034174.
Sequeira, M., Bowden, M., Minogue, E., and Diamond, D., 2002, Towards autonomous environmental monitoring systems: Talanta, v. 56, no. 2, p. 355–363. [Also available at https://doi.org/10.1016/S0039-9140(01)00601-4.]
Smith, V.H., Tilman, G.D., and Nekola, J.C., 1999, Eutrophication—Impacts of excess nutrient inputs on freshwater, marine, and terrestrial ecosystems: Environmental Pollution, v. 100, no. 1-3, p. 179–196. [Also available at https://doi.org/10.1016/S0269-7491(99)00091-3.]
Snazelle, T.T., 2018, Laboratory evaluation of the Sea-Bird Scientific HydroCycle-PO4 phosphate sensor: U.S. Geological Survey Open-File Report 2018–1120, 10 p. [Also available at https://doi.org/10.3133/ofr20181120.]
Terrio, P.J., Straub, T.D., Domanski, M.M., and Siudyla, N.A., 2015, Continuous monitoring of sediment and nutrients in the Illinois River at Florence, Illinois, 2012–13: U.S. Geological Survey Scientific Investigations Report 2015–5040, 61 p. [Also available at https://doi.org/10.3133/sir20155040.]
U.S. Geological Survey, 2021a, USGS water data for the Nation: U.S. Geological Survey National Water Information System database, accessed August 2021 at https://doi.org/10.5066/F7P55KJN.
U.S. Geological Survey, 2021b, Water-year summary for site 03339000, in USGS water data for the Nation: U.S. Geological Survey National Water Information System database, accessed August 2021 at https://doi.org/10.5066/F7P55KJN. [Site information directly accessible at https://waterdata.usgs.gov/nwis/wys_rpt/?site_no=03339000&agency_cd=USGS.]
Wagner, R.J., Boulger, R.W., Jr., Oblinger, C.J., and Smith, B.A., 2006, Guidelines and standard procedures for continuous water-quality monitors—Station operation, record computation, and data reporting: U.S. Geological Survey Techniques and Methods, book 1, chap. D3, 53 p., accessed August 2021 at https://doi.org/10.3133/tm1D3.
Yang, L., Jin, S., Danielson, P., Homer, C., Gass, L., Case, A., Costello, C., Dewitz, J., Fry, J., Funk, M., Grannemann, B., Rigge, M., and Xian, G., 2018, A new generation of the United States National Land Cover Database—Requirements, research priorities, design, and implementation strategies: ISPRS Journal of Photogrammetry and Remote Sensing, v. 146, p. 108–123. [Also available at https://doi.org/10.1016/j.isprsjprs.2018.09.006.]
YSI, 2021, Alyza IQ PO4 Operations manual: YSI, 174 p., accessed November 2020 at https://www.ysi.com/File Library/Documents/Manuals/ba76201-Alyza-IQ-PO4.PDF.
Appendix 1. Laboratory Standard Values
Table 1.1.
National Water Quality Laboratory verification results for standards used in laboratory testing.[mg/L, milligram per liter, DIW, deionized water]
Table 1.2.
National Water Quality Laboratory verification results for dissolved organic matter standards testing. Designed phosphorus concentration was 0.25 milligram per liter of phosphorus for all samples. Samples were collected in triplicate.[DOM, dissolved organic matter; mg/L, milligram per liter]
Reference Cited
U.S. Geological Survey, 2021, USGS water data for the Nation: U.S. Geological Survey National Water Information System database, accessed August 2021 at https://doi.org/10.5066/F7P55KJN.
Conversion Factors
International System of Units to U.S. customary units
Temperature in degrees Celsius (°C) may be converted to degrees Fahrenheit (°F) as follows:
°F = (1.8 × °C) + 32.
Supplemental Information
Phosphorus concentrations are given as milligrams per liter (mg/L) of phosphorus.
A water year is the period from October 1 to September 30 and is designated by the year in which it ends; for example, water year 2021 was from October 1, 2020, to September 30, 2021.
For more information about this publication, contact:
Director, USGS Central Midwest Water Science Center
405 North Goodwin
Urbana, IL 61801
217–328–8747
For additional information, visit: https://www.usgs.gov/centers/cm-water
Publishing support provided by the
Rolla and Lafayette Publishing Service Centers
Suggested Citation
Peake, C.S., 2022, Verification of multiple phosphorus analyzers for use in surface-water applications: U.S. Geological Survey Open-File Report 2022–1100, 23 p., https://doi.org/10.3133/ofr20221100.
ISSN: 2331-1258 (online)
Study Area
| Publication type | Report |
|---|---|
| Publication Subtype | USGS Numbered Series |
| Title | Verification of multiple phosphorus analyzers for use in surface-water applications |
| Series title | Open-File Report |
| Series number | 2022-1100 |
| DOI | 10.3133/ofr20221100 |
| Year Published | 2022 |
| Language | English |
| Publisher | U.S. Geological Survey |
| Publisher location | Reston, VA |
| Contributing office(s) | Central Midwest Water Science Center |
| Description | Report: viii, 23 p.; Dataset |
| Country | United States |
| State | Illinois, Indiana |
| Other Geospatial | Vermilion River Basin |
| Online Only (Y/N) | Y |
| Google Analytic Metrics | Metrics page |