

Bathymetric Contour Maps, Surface Area and Capacity Tables, and Bathymetric Change Maps for Selected Water-Supply Lakes in Northwestern Missouri, 2019 and 2020
Links
- Document: Pamphlet (1.90 MB pdf) , HTML , XML
- Sheets:
- Sheet 1 (1.38 MB pdf) —Bathymetric contour map, surface area and capacity table, and bathymetric change map for Hamilton Reservoir near Hamilton, Missouri, 2019
- Sheet 2 (1.50 MB pdf) —Bathymetric contour map, surface area and capacity table, and bathymetric change map for King City South Lake near King City, Missouri, 2019
- Sheet 3 (1.73 MB pdf) —Bathymetric contour map, surface area and capacity table, and bathymetric change map for Willow Brook Lake near Maysville, Missouri, 2019
- Sheet 4 (1.71 MB pdf) —Bathymetric contour map, and surface area and capacity table for Bethany New City Lake near Bethany, Missouri, 2020
- Sheet 5 (1.05 MB pdf) —Bathymetric contour map, and surface area and capacity table for Old Bethany City Lake near Bethany, Missouri, 2019
- Sheet 6 (1.77 MB pdf) —Bathymetric contour map, surface area and capacity table, and bathymetric change map for Middle Fork Grand River Reservoir near Stanberry, Missouri, 2019
- Sheet 7 (2.36 MB pdf) —Bathymetric contour map, surface area and capacity table, and bathymetric change map for Lake Viking near Gallatin, Missouri, 2019
- Sheet 8 (1.86 MB pdf) —Bathymetric contour map, and surface area and capacity table for Harrison County Lake near Bethany, Missouri, 2019
- Sheet 9 (1.23 MB pdf) —Bathymetric contour map, and surface area and capacity table for King City Reservoir system near King City, Missouri, 2019
- Sheet 10 (1.87 MB pdf) —Bathymetric contour map, surface area and capacity table, and bathymetric change map for Maysville Reservoir near Maysville, Missouri, 2019
- Sheet 11.1 (1.81 MB pdf) —Bathymetric contour map, and surface area and capacity table for Mozingo Lake near Maryville, Missouri, 2020
- Sheet 11.2 (2.12 MB pdf) —Bathymetric contour map, and surface area and capacity table for Mozingo Lake near Maryville, Missouri, 2020
- Sheet 12 (1.28 MB pdf) —Bathymetric contour map, and surface area and capacity table for Maryville Reservoir near Maryville, Missouri, 2020
- Data Release: USGS data release —Bathymetric and supporting data for various water supply lakes in northwestern Missouri, 2019 and 2020 (ver. 1.1, September 2021)
- Download citation as: RIS | Dublin Core
Abstract
Bathymetric data were collected at 12 water-supply lakes in northwestern Missouri by the U.S. Geological Survey, in cooperation with the Missouri Department of Natural Resources and in collaboration with various local agencies, as part of a multiyear effort to establish or update the surface area and capacity tables for the surveyed lakes. Ten of the lakes were surveyed from July to September 2019, one of the original 10 was resurveyed in March 2020, and two lakes of high interest near Maryville were surveyed in June 2020. Six of the lakes had been surveyed by the U.S. Geological Survey before, and the recent surveys were compared to the earlier surveys to document the changes in the bathymetric surface and capacity of the lake and to produce a bathymetric change map.
Bathymetric data were collected using a high-resolution multibeam mapping system mounted on a boat. Supplemental depth data were collected in shallow areas with an acoustic Doppler current profiler on a remote-controlled boat. At Hamilton Reservoir, a Global Navigation Satellite System survey receiver was used to collect additional bathymetric data at several points across four transects and around the perimeter of a substantial shallow area filled with aquatic vegetation upstream from a low-clearance bridge on the northern arm.
Data points from the various sources were exported at a gridded data resolution appropriate to each lake. Data outside the multibeam echosounder survey extent and greater than the surveyed water-surface elevation generally were obtained from data collected using aerial light detection and ranging point cloud data, 1/9 arc-second National Elevation Dataset data based on aerial light detection and ranging data, or both. A linear enforcement technique was used to add points to the dataset in areas of sparse data (the upper ends of coves where the water was shallow or aquatic vegetation precluded data acquisition) based on surrounding multibeam and upland data values. The various point datasets were used to produce a three-dimensional triangulated irregular network surface of the lake-bottom elevations for each lake. A surface area and capacity table was produced from the three-dimensional surface showing surface area and capacity at specified lake water-surface elevations. Various quality-assurance tests were conducted to ensure quality data were collected with the multibeam, including beam angle checks and patch tests. Additional quality-assurance tests were conducted on the gridded bathymetric data from the survey, the bathymetric surface created from the gridded data, and the contours created from the bathymetric survey.
If data from a previous bathymetric survey existed at a given lake, a bathymetric change map was generated from the elevation difference between the previous survey and the 2019 bathymetric survey data points. After applying any vertical elevation changes to the previous survey data to ensure a match to the 2019 survey datum, coincident points between the surveys were found, and a bathymetric change map was generated using the coincident point data.
A decrease in capacity was observed at all the lakes for which a previous survey existed. The decrease in capacity at the primary spillway or intake elevation ranged from 0.8 percent at Lake Viking to 21.4 percent at Middle Fork Grand River Reservoir. The mean bathymetric change ranged from 0.33 foot at Willow Brook Lake to 1.18 feet at Middle Fork Grand River Reservoir. The computed sedimentation rate generally ranged from 0.54 to 4.19 acre-feet per year at Maysville Lake and Middle Fork Grand River Reservoir, respectively; however, Lake Viking had the largest sedimentation rate of 14.9 acre-feet per year, despite having the smallest decrease in capacity at the spillway elevation of only 0.8 percent and a mean bathymetric change of only 0.4 foot. Evidence of dredging was observed in the bathymetric surface for Lake Viking. Some changes observed in some bathymetric change maps are hypothesized to result from the difference in data collection equipment and techniques between the previous and present bathymetric surveys. Certain erosional features around the perimeter of certain lakes may be the result of wave action during low-water years.
Introduction
Managers of water-supply lakes need an accurate estimate of the lake capacity to ensure that enough water is available for uses such as providing consistent recreation pool levels, preserving downstream aquatic habitat, flood abatement, water supply, and power generation. Lake capacity is particularly important for managers of water-supply lakes during periods of drought, unexpected population growth, or exceptionally high water use in the area supplied by the lake. Sedimentation, primarily from runoff into the lake, decreases storage capacity as a lake ages; as a result, the capacity table for the lake (if one exists) will overestimate the actual capacity. Lake bathymetric changes can be monitored through periodic surveying, and rates of sediment accumulation can be calculated so that managers can better regulate and use the water supply.
In cooperation with several Federal, State, and local agencies, the U.S. Geological Survey (USGS) completed bathymetric surveys of several water-supply lakes in Missouri in the early 2000s (Richards, 2013) to determine the capacity of the lakes. All but the survey at Clearwater Lake in 2009 were completed using a boat-mounted, survey-grade, single-beam echosounder and Differential Global Positioning System (DGPS) equipment. Beginning in 2008, the USGS began using multibeam echosounders (MBES) and a multibeam mapping system (MBMS) to survey river and lake bathymetry (see Huizinga and others, 2010; Clearwater Lake in Richards, 2013; Richards and others, 2019; Huizinga, 2010, 20204). MBMS collect bathymetric data at much higher resolution and density than single-beam echosounders (Huizinga and Heimann, 2018). In September 2018, the USGS, in cooperation with the Missouri Department of Natural Resources (MDNR) and the City of Moberly, Missouri, used a MBMS to survey Sugar Creek Lake to prepare an updated bathymetric map and a surface area and capacity table (Richards and Huizinga, 2019; Richards and others, 2019). The 2018 survey also was compared with the previous survey in 2003 to document the changes in the bathymetric surface of the lake and produce a bathymetric change map.
Beginning in 2019, the USGS, in cooperation with the MDNR and in collaboration with various local agencies, began a project to resurvey many of the water-supply lakes from the previous study (Richards, 2013), as well as to survey several lakes that had not been previously surveyed. From July to September 2019, 10 lakes in northwestern Missouri were surveyed to prepare new or updated bathymetric maps and surface area and capacity tables for those lakes (fig. 1; table 1). These surveys are the first in a 5-year series to create or update the surface area and capacity tables for the surveyed lakes. Bethany New City Lake near Bethany, Mo. (lake 4), was resurveyed on March 18, 2020, because of substantial errors discovered in the original survey on July 30, 2019; however, this lake and all those surveyed in 2019 will hereinafter be collectively referred to as the “2019” lakes or surveys. If a previous survey was completed at a given lake (Richards, 2013), that survey was compared with the 2019 survey to document the changes in the bathymetric surface of the lake and produce a bathymetric change map.
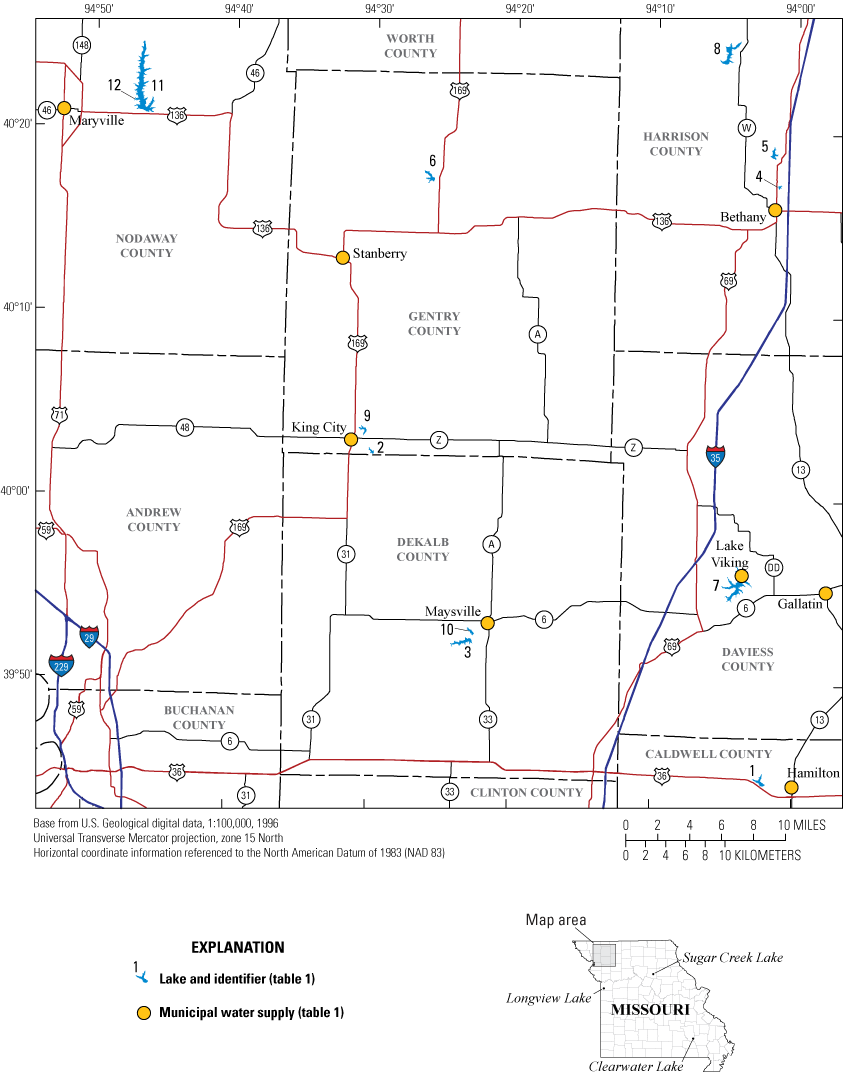
Location of water-supply lakes in northwestern Missouri surveyed in 2019 and 2020.
Table 1.
Water-supply lakes in northwestern Missouri surveyed in 2019 and 2020.[Dates are shown as month/day/year. All elevations are referenced to the North American Vertical Datum of 1988. GNIS, Geographic Names Information System; --, no data/not applicable]
| Lake name | Lake number (fig. 1) | County | Municipal water supply | Survey date(s) | Previous survey date(s) | Average water-surface elevation at time of survey, in feet | Primary spillway/intake elevation, in feet | Emergency/ overflow spillway elevation,a in feet | Sheet number |
|---|---|---|---|---|---|---|---|---|---|
| Hamilton Reservoir | 1 | Caldwell | Hamilton | 07/16/2019 | 07/11/2000 | 926.24 | 926.45b | 929.45 | 1 |
| King City South Lake (not in GNIS) | 2 | Gentry | King City | 07/17/2019 | 07/19/2000 | 1,028.49 | 1,028.61 | 1,031.91 | 2 |
| Willow Brook Lake (not in GNIS) | 3 | DeKalb | Maysville | 07/18/2019–07/19/2019 | 07/25/2000 | 907.99 | 908.48 | 916.54 | 3 |
| Bethany New City Lake | 4 | Harrison | Bethany | 03/18/2020c | -- | 920.65 | 921.60 | 921.60 | 4 |
| Old Bethany City Lake | 5 | Harrison | Bethany | 07/31/2019 | -- | 900.32 | 902.88b | 906.57 | 5 |
| Middle Fork Grand River Reservoir (Stanberry Lake in previous study, not in GNIS) | 6 | Gentry | Stanberry | 07/31/2019–08/01/2019 | 07/26/2000 | 888.90 | 889.43 | 893.43 | 6 |
| Lake Viking | 7 | Daviess | Lake Viking | 08/20/2019–08/22/2019 | 03/22/2006–03/23/2006 | 863.83 | 864.43 | 870.30 | 7 |
| Harrison County Lake | 8 | Harrison | Bethany | 09/04/2019–09/05/2019 | -- | 960.79 | 960.40 | 970.80 | 8 |
| King City Reservoir, Upper | 9d | Gentry | King City | 09/06/2019 | -- | 1,051.24 | 1,052.00 | 1,052.00 | 9 |
| King City Reservoir, Middle | 9d | Gentry | King City | 09/06/2019 | -- | 1,035.34 | 1,035.34b | 1,037.88d | 9 |
| King City Reservoir, Lower | 9d | Gentry | King City | 09/06/2019 | -- | 1,034.74d | 1,034.74d | 1,037.88d | 9 |
| Maysville Reservoir (Maysville West Lake in previous study) | 10 | DeKalb | Maysville | 09/07/2019 | 03/21/2006 | 898.09 | 898.56b | 900.45 | 10 |
| Mozingo Lakee (not in GNIS) | 11 | Nodaway | Maryville | 06/23/2020–06/26/2020 | -- | 1,060.32 | 1060.11 | 1,067.00 | 11.1, 11.2 |
| Maryville Reservoire (not in GNIS) | 12 | Nodaway | Maryville | 06/25/2020 | -- | 1,061.19 | 1,061.23 | 1,067.40 | 12 |
Emergency/overflow spillway elevation is the elevation at which uncontrolled overflow occurs as opposed to flow into an intake drop structure. If the primary and emergency/overflow spillway elevations are the same, the lake did not have an intake structure or did not have a clear indication of an intake lip.
Bethany New City Lake was originally surveyed on July 30, 2019, but substantial errors were discovered in the original survey. The lake was resurveyed on March 18, 2020, but is still considered a “2019” lake.
The King City Reservoir system includes three lakes (upper, middle, and lower), and the upper and middle impoundments flow into the lower impoundment. The primary/emergency spillway for the lower impoundment controls the middle and lower impoundments. Although the emergency spillway elevation is 1,037.88 feet, the storage capacity of this system of impoundments is questionable above an elevation of 1,036.4 feet because of the transient nature of the capacity.
In June 2020, the USGS, in cooperation with the MDNR and in collaboration with various local agencies, began the next set of surveys at water-supply lakes. These surveys are the second set in the 5-year series to create or update the surface area and capacity tables for the surveyed lakes. High interest was expressed regarding the survey at Mozingo Lake (lake 11; fig. 1) near Maryville, Mo., because this bathymetric survey is the first survey of this lake since being built in the early 1990s. Whereas the other lakes surveyed in the 2020 season primarily are in central Missouri, Mozingo Lake and Maryville Reservoir (lakes 11 and 12; fig. 1) are used by the city of Maryville in northwestern Missouri and had not been previously surveyed. Therefore, because of the interest in the bathymetric data and the proximity to the other lakes surveyed in 2019, the bathymetric data and surface area and capacity tables for these two lakes are included in this report.
Purpose and Scope
The purpose of this map report is to document the results of bathymetric surveys using an MBMS completed at water-supply lakes in northwestern Missouri during the summer of 2019, as well as one lake resurveyed in March 2020 and two high-interest lakes in northwestern Missouri surveyed in June 2020 during the 2020 survey season (fig. 1; table 1). Equipment and methods used to process and quality assure the data are described. Sheets for each lake are presented, each containing the bathymetric surface contours from the survey at each lake, as well as the surface area and capacity table of the surveyed lake. Lakes previously surveyed, as documented in Richards (2013), were compared to the most recent MBMS survey data, and results are provided on the appropriate sheets. Data collected during the surveys in 2019 and 2020 discussed in this map report are available in a USGS data release (Huizinga and others, 2021).
Description of Study Area
The study area for this report includes 12 water-supply lakes in northwestern Missouri (fig. 1; table 1). The King City Reservoir system (lake 9; fig. 1) includes three impoundments of similar size that are hydraulically connected, so they are analyzed together and presented on a single map sheet; nevertheless, three individual surface area and capacity tables were developed for that system. Mozingo Lake and Maryville Reservoir (lakes 11 and 12; fig. 1) are part of the 2020 survey season but are of high interest and also are hydraulically connected; however, these two lakes are of disparate sizes, so they were analyzed separately and presented on separate map sheets, each having individual surface area and capacity tables.
Methods
Bathymetric surveys for the lakes in northwestern Missouri included in this report were done from July 16 to September 7, 2019, March 18, 2020, and June 23–26, 2020 (table 1), using similar methods to the survey at Clearwater Lake near Piedmont, Mo., in 2017 (Richards and Huizinga, 2018; fig. 1) and Sugar Creek Lake near Moberly, Mo., in 2018 (Richards and others, 2019; fig. 1). The average water-surface elevation of each lake during the 2019 surveys is shown in table 1. Bethany New City Lake near Bethany, Mo. (lake 4; fig. 1; table 1), originally was surveyed on July 30, 2019; however, substantial positional errors were observed during postprocessing, so that lake was resurveyed on March 18, 2020. A bathymetric surface and a bathymetric contour map were created from the survey data for each lake. For lakes at which a previous survey had been completed (Richards, 2013), a bathymetric change map was created from the survey data.
Bathymetric Data Collection
Bathymetric data (water depths and positions) were collected using an MBMS mounted on a boat (fig. 2A). Two different boats were used for the 2019 and 2020 surveys: larger lakes with a concrete ramp were surveyed using a 22-foot (ft) flat-bottom cabin boat (fig. 2B), and smaller lakes without a concrete ramp generally were surveyed using an 18-ft cargo canoe (fig. 2C) that could be more-easily launched and retrieved from the bank of a lake. Supplemental depth data were collected in shallow areas with an acoustic Doppler current profiler (ADCP) on a remote-controlled boat. The various components of the MBMS used for this study are described in more detail in reports about studies on the Missouri and Mississippi Rivers in Missouri (for example, see Huizinga, 2010, 2020; Huizinga and others, 2010). The survey methods used to obtain the data for the 2019 lakes were similar to these river studies and for the study at Sugar Creek Lake near Moberly, Mo. (Richards and others, 2019), as were the methods used to ensure data quality. A brief description of the equipment and methods follows.
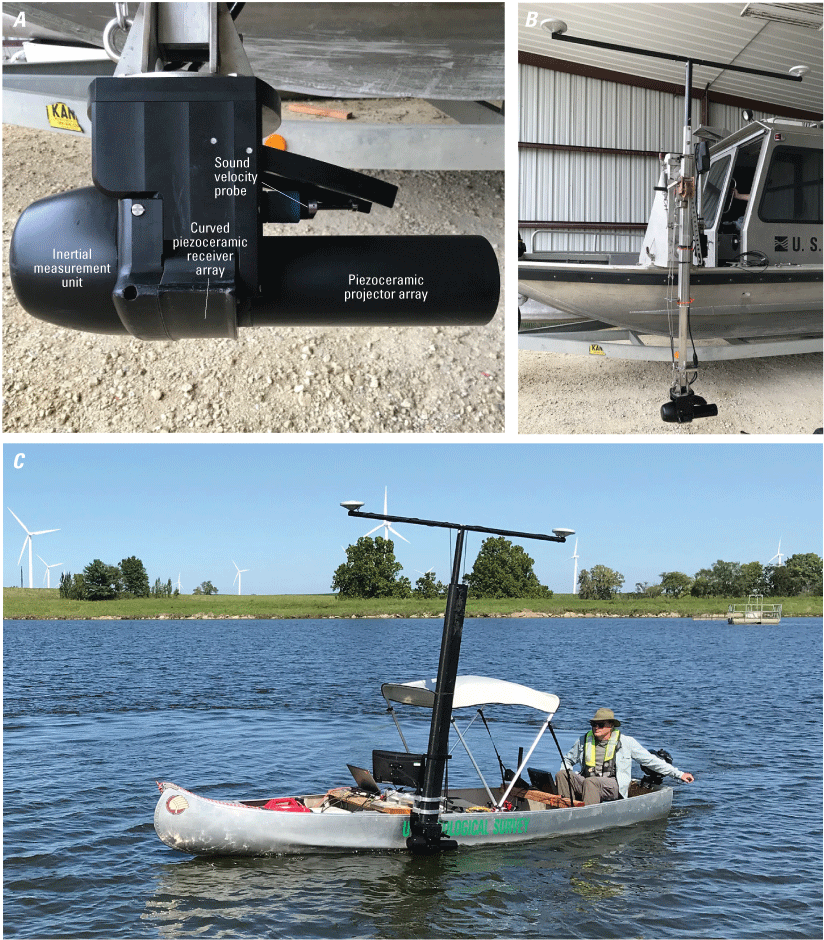
The Norbit iWBMSh multibeam echosounder. A, Viewed from the side. B, Mounted on the port side of the U.S. Geological Survey 22-foot cabin boat. C, Deployed on the port side of the 18-foot cargo canoe.
An MBMS is an integration of several individual components: the MBES, an inertial navigation system (INS), and a data-collection and data-processing computer. The INS provides position in three-dimensional space and measures the heave, pitch, roll, and heading of the vessel (and, thereby, the MBES) to accurately position the data received by the MBES. The MBES used was the Norbit iWBMSh, operated at a frequency of 400 kilohertz (fig. 2A). The iWBMSh is similar in operation to the MBES systems used in other previous studies in Missouri, except that it has a curved receiver array, which enables bathymetric data to be collected throughout a swath range of 210 degrees. Optimum data usually are collected in a swath of less than 160 degrees (80 degrees on each side of nadir, or straight down below the MBES); nevertheless, the swath can be electronically rotated to either side of nadir, enabling data along sloping banks to be captured up to a depth just below the water surface.
Real-time kinematic (RTK) corrections for the INS came from cellular communication with the Missouri Department of Transportation Global Navigation Satellite System (GNSS) real-time network for the real-time navigation and tide solution as much as possible during the 2019 and 2020 surveys. When a cellular link could not be established because of poor cellular coverage in an area, real-time navigation used a DGPS solution. However, all the navigation information from the lake surveys was postprocessed using the POS-Pac Mobile Mapping Suite (MMS) software (Applanix Corporation, 2019) to mitigate any effects of degraded positional accuracy of the vessel from a DGPS solution. POS-Pac MMS provides tools to identify and compensate for sensor and environmental errors and computes an optimally blended navigation solution from the GNSS and inertial measurement unit (IMU) raw data from the INS. The location solution was further enhanced by collecting static GNSS data with a GNSS base receiver set up over a temporary reference mark near each survey launch area, the coordinates for which were determined using techniques detailed in Rydlund and Densmore (2012) and included in the data release for these lakes (Huizinga and others, 2021). The blended navigation solution (called a “smoothed best estimate of trajectory” or “SBET” file) generated by postprocessing the daily navigation data was applied to the respective day of data collection in the survey.
Most of the bathymetric survey data within each lake were collected with the swath range limited to 140 degrees, 70 degrees on each side of nadir. Along the banks and in the shallow areas at the upstream ends of lake arms, however, the swath range was widened to 160 degrees to cover a wider swath of the bottom. In these areas the swath also was electronically tilted to port or starboard as needed to enhance acquisition of bathymetric data in the shallow areas near the banks, in coves, and in the upper reaches of the lake arms. The electronically tilted swath generally was about 140 to 160 degrees, extending about 5 degrees above horizontal on the bankward side of the survey vessel to 45 to 65 degrees past nadir below the vessel.
The bathymetric data were collected along transect lines oriented longitudinally in the main lake area. In the main body of the lake, the transect lines were spaced to create about 10- to 25-percent overlap of the survey swaths to attempt to ensure complete coverage of the lake bottom and minimize sonic shadows. Data along the shoreline were collected by navigating the boat parallel to the shore while overlapping the data collected in the main body of the lake. Cove data were collected by navigating into a cove along the approximate centerline of the cove as far as practical (usually, the point at which forward progress was blocked by vegetation, or water depth below the MBES decreased to less than about 3 ft), pivoting the boat 180 degrees, and egressing the cove along the ingress line.
In a lake, it is not unusual for the speed of sound in the water to vary with time and location. The speed of sound also typically varies vertically through the water column because of water temperature variations with depth. Although sound velocity data are collected at the MBES head throughout the survey to mitigate these variations near the water surface, the changes in the speed of sound with depth needs to be known to accurately determine the depths acquired by the MBES. Sound velocity profiles, therefore, were measured with an AML Oceanographics Base X2 sound velocity probe at various locations throughout each survey day and applied during postprocessing in the HYPACK/HYSWEEP software (HYPACK, Inc., 2018).
Preparation for the bathymetric survey was done in HYPACK/HYSWEEP. To collect the survey data, a computer onboard the survey vessel ran HYPACK/HYSWEEP data acquisition software. After completing the surveys, the acquired depth data were processed further to apply sound velocity profiles and to remove data spikes and other spurious points in the MBES swath trace often caused by fish and submerged woody debris and other vegetation. The data were georeferenced using the navigation and position solution data from the SBET file from POS-Pac MMS and visualized in HYPACK/HYSWEEP as a triangulated irregular network (TIN) surface or a point cloud. The georeferenced data were output to a comma-delimited file that was filtered and reduced to a data resolution appropriate to the size of the lake, or no more than about 3 million gridded points per lake (table 2).
Table 2.
Summary of gridded and selected bathymetric data points from surveys at water-supply lakes in northwestern Missouri, July 16, 2019, through June 26, 2020.[LPC, light detection and ranging (lidar) point cloud data; NED, 1/9 arc-second National Elevation Dataset data; --, no data]
| Lake name | Lake number (fig. 1) | Gridded data resolution, in feet | Number of gridded points in multibeam bathymetric dataset | Number of supplemental points from sources other than multibeam | Mapping point minimum point spacing, in feet | Number of mapping points selected from the gridded bathymetric dataset used to make the bathymetric surface | Number of mapping quality-assurance points randomly selected from gridded bathymetric dataset | Upland data source |
|---|---|---|---|---|---|---|---|---|
| Hamilton Reservoir | 1 | 1.64 | 983,672 | 343a | 3.28 | 185,212 | 33,456 | LPC, NED |
| King City South Lake | 2 | 0.82 | 1,071,281 | 541 | 1.64 | 203,299 | 35,775 | LPC, NED |
| Willow Brook Lake | 3 | 1.64 | 1,606,449 | 948 | 3.28 | 303,035 | 53,985 | LPC, NED |
| Bethany New City Lake | 4 | 0.82 | 3,188,276 | -- | 1.64 | 661,693 | 104,950 | LPC |
| Old Bethany City Lake | 5 | 0.82 | 917,682 | -- | 1.64 | 172,944 | 30,844 | LPC, NED |
| Middle Fork Grand River Reservoir | 6 | 1.64 | 1,068,257 | -- | 3.28 | 200,430 | 36,225 | LPC, NED |
| Lake Viking | 7 | 3.28 | 1,990,931 | 5,590 | 6.56 | 374,565 | 67,458 | LPC, NED |
| Harrison County Lake | 8 | 1.64 | 2,581,234 | 1,974 | 3.28 | 489,816 | 87,199 | LPC, NED |
| King City Reservoir, Upper | 9 | 0.82 | 216,170 | -- | 1.64 | 40,750 | 7,344 | LPC |
| King City Reservoir, Middle | 9 | 0.82 | 546,075 | -- | 1.64 | 102,177 | 18,425 | LPC |
| King City Reservoir, Lower | 9 | 0.82 | 1,610,903 | -- | 1.64 | 299,174 | 55,414 | LPC |
| Maysville Reservoir | 10 | 0.82 | 1,785,296 | -- | 1.64 | 337,318 | 60,287 | LPC |
| Mozingo Lake | 11 | 3.28 | 3,177,710 | 1,307 | 6.56 | 599,951 | 107,170 | LPC |
| Maryville Reservoir | 12 | 0.82 | 532,291 | -- | 1.64 | 102,490 | 18,099 | LPC |
At a few of the surveyed lakes, an ADCP mounted on a remote-controlled boat was used to collect bathymetric data in shallow areas that were inaccessible to the MBMS boats but were not filled with aquatic vegetation. Data from the so-called “bottom-track” average of the four velocity beams of the ADCP were combined with position and elevation information provided by a DGPS receiver on the top of the boat to provide the equivalent of single-beam echosounder data in these otherwise inaccessible areas. Because the surveys were conducted in summer months (June through September), aquatic vegetation often confounded this data collection technique; nevertheless, useable (albeit lower quality) bathymetric point data were collected.
At Hamilton Reservoir (lake 1; fig. 1), a substantial shallow area filled with aquatic vegetation exists upstream from a low-clearance bridge on the northern lake arm. An RTK GNSS survey receiver was used to collect bathymetric data at several points across four transects and around the perimeter of the area at this lake to define this area, using RTK GNSS techniques detailed in Rydlund and Densmore (2012), and similar to the land-surface elevation data collected around the perimeter of lakes in previous surveys as detailed in Wilson and Richards (2006).
Bathymetric Surface and Contour Map Creation
Data points from the MBMS, as well as any supplemental ADCP or GNSS points, were exported at the gridded data resolution shown in table 2 from the raw data collected in the 2019 and selected 2020 surveys (Huizinga and others, 2021). The vertical datum for the surveys was the North American Vertical Datum of 1988, using the geoid model GEOID12b for the 2019 surveys (including the re-survey of Bethany New City Lake in March 2020) and using the geoid model GEOID18 for the selected 2020 surveys. The horizontal datum was the North American Datum of 1983. Geographic information system (GIS) software was used to filter the bathymetric data points so that the points would be no closer than the mapping minimum point spacing shown in table 2.
Data outside the MBES survey extent and greater than the surveyed water-surface elevation generally were obtained from data collected using aerial light detection and ranging (lidar) point cloud data, 1/9 arc-second National Elevation Dataset (NED) data based on aerial lidar data, or both (https://prd-tnm.s3.amazonaws.com/LidarExplorer/index.html#/; table 2). Only points classified as “ground” were used from the lidar point cloud data, and 1/9 arc-second data were used (when available) to fill gaps. These upland data points were resampled to a linear distance that matched the mapping minimum point spacing of the bathymetric data (table 2) using GIS software (when needed for the larger lakes) and used to define the upland areas of the lake.
Using the linear enforcement techniques described in Wilson and Richards (2006), points were added to the dataset based on surrounding MBES and upland data values. These data were added to anchor the surface in areas of sparse data in the upper ends of coves where the water was too shallow for the MBES equipment or aquatic vegetation precluded data acquisition with the MBES or ADCP.
The preceding point datasets were used to produce a three-dimensional TIN surface of the lake-bottom elevations for each lake. A surface area and capacity table was produced from the three-dimensional TIN surface showing surface area and capacity at specified lake water-surface elevations. Each lake surface was contoured at an interval that was cartographically appropriate for the area and vertical relief of the lake (2, 4, or 5 ft, depending on lake size) using GIS software, and the contours were cartographically smoothed and edited to create a bathymetric contour map for each lake (sheets 1 through 12, which includes figures 2 through 56 and tables 3 through 16; sheets available for download at https://doi.org/10.3133/sim3486) using the techniques of Wilson and Richards (2006).
As indicated in the “Description of Study Area” section above, the King City Reservoir system (lake 9; sheet 9) encompasses a system of three impoundments of similar size that are hydraulically connected, so they were analyzed together. Individual surface area and capacity tables were developed for each impoundment (tables 11, 12, and 13 on sheet 9); however, the middle and lower impoundments are connected across a low spillway at an elevation of 1,035.34 ft (table 1). For elevations above the low spillway between these two impoundments, the individual area or capacity of the two impoundments (tables 12 and 13 on sheet 9) should be added together for the total area and capacity. Furthermore, although the emergency spillway elevation for the middle and lower impoundments is 1,037.88 ft, the storage capacity of this system of impoundments is questionable above an elevation of 1,036.4 ft because of the transient nature of the capacity; therefore, the area and capacity tables for the middle and lower impoundments do not go above this elevation (table 1; tables 12 and 13 on sheet 9).
Bathymetric Change Map Creation
If data from a previous bathymetric survey existed at a given lake, a bathymetric change map was generated from the difference between the previous survey and the 2019 bathymetric survey data points where they were coincident (Mozingo Lake and Maryville Reservoir, surveyed in 2020, were not previously surveyed, and are not included in this discussion). Although the previous surveys were “internally consistent” such that the bathymetric surface produced from the surveyed data provide the correct area and capacity for lake-surface elevations referenced to survey control at the lake at the time of the survey, a common vertical reference system is necessary to be able to compare the previous survey with the current survey. At nearly all the lakes, a point of coincident location was identified, and the elevation was surveyed (such as the reference mark from the previous survey or the spillway crest) using RTK GNSS techniques detailed in Rydlund and Densmore (2012). Because of the advances in GNSS surveying techniques and accuracy since the previous surveys, it was assumed that the 2019 elevation was the more accurate value. The vertical offsets between the surveys are listed in table 17.
Table 17.
Summary of adjustments to previous survey elevation to match 2019 surveys at water-supply lakes in northwestern Missouri, July 16, 2019, through September 7, 2019.| Lake name | Lake number (fig. 1) | Elevation adjustment to previous survey,a in feet | Coincident bathymetry point search radius, in feet |
|---|---|---|---|
| Hamilton Reservoir | 1 | 3.04 | 2.46 |
| King City South Lakeb | 2 | 0.00 | 1.15 |
| Willow Brook Lake | 3 | –1.56 | 3.28 |
| Middle Fork Grand River Reservoir | 6 | 0.05 | 1.64 |
| Lake Viking | 7 | –0.56 | 4.92 |
| Maysville Reservoir | 10 | –0.77 | 3.28 |
Contour information and surface area and capacity tables for previous surveys in Richards (2013) need to be adjusted by the elevation adjustment value to be comparable to the 2019 data.
A coincident point between the surveys was not found at King City South Lake (lake 2; sheet 2) because the previous reference mark was not found in 2019 and no other features that had been surveyed in the previous effort were stable and well defined. However, an analysis of a series of points on the top of the dam in the previous survey compared to the elevation of the top of the dam obtained from the 1/9 arc-second NED data implied no vertical adjustment was needed to align the surveys at this site.
After applying the vertical shift to the previous survey data to ensure a match to the 2019 survey datum, coincident points between the surveys were found. A 2019 survey map point was considered coincident when it was within a given horizontal distance from a previous survey data point (the “coincident bathymetry point search radius” in table 17), and a bathymetric change TIN was generated using the difference in elevation of the coincident point datasets. The TIN was converted to a raster surface with a spacing that matched the mapping minimum point spacing of the 2019 surveys (table 2) for use in further analysis and creation of the map. The bathymetric change map was limited to the intersection of the previous and 2019 MBES survey extents so that only bathymetric data that were in the area in common to both surveys were compared. In areas of steeper slope (observed in the contour maps as areas where the contours are closely spaced), raster cells that had a 2019 slope greater than 25 degrees were removed from the bathymetric change raster because sediment deposition was assumed to be relatively minor in these areas. Masking the areas of high slope helps limit the areas where minor horizontal positional offsets between coincident points in the two surveys sometimes create erroneous bathymetric change results.
Bathymetric Data Collection Quality Assurance
For the MBMS, the principal quality-assurance measures were assessed in real time during the survey. The MBMS operator continuously assessed the quality of the data collected during the survey by making observations of across-track swaths (such as convex, concave, or skewed bed returns in flat, smooth bottoms), noting data quality flags and alarms from the MBES and the INS, and inspecting comparisons between adjacent overlapping swaths. In addition to the real-time quality-assurance assessments during the survey, beam angle checks and a suite of patch tests were done at various times throughout the surveys to ensure quality data were acquired from the MBMS. These tests generally were completed in the deepest part of a given lake, near the dam, and over a submerged feature such as the old channel or a submerged roadway.
Beam Angle Check
A beam angle check is used to determine the accuracy of the depth readings obtained by the outer beams (greater than 25 degrees from nadir) of the MBES (U.S. Army Corps of Engineers, 2013), which may change with time because of inaccurate sound velocities, physical configuration changes, and water depth. A beam angle check was done at Longview Lake (fig. 1) near Kansas City on August 12, 2019, and the results were within the recommended performance standards used by the U.S. Army Corps of Engineers for hydrographic surveys for all the representative angles below 55 degrees (U.S. Army Corps of Engineers, 2013; table 18), permitting the use of the central 110 degrees the sound navigation and ranging (sonar) swath. Points acquired outside of the central 100–110 degrees of the swath generally had overlap with adjacent swaths, which increases the quality of the survey in the overlapped areas because of duplication.
Table 18.
Results of a beam angle check from two check lines over a reference surface at Longview Lake near Kansas City, Missouri, on August 12, 2019.[<, less than; --, no data]
Performance standard check values are from U.S. Army Corps of Engineers (2013, table 17–1) for soft sand/silt bottoms.
Another beam angle check was done at Mozingo Lake near Maryville on June 23, 2020, as part of the 2020 survey season, and the results were within the recommended performance standards used by the U.S. Army Corps of Engineers for hydrographic surveys for all the representative angles below 70 degrees, except an outlier at 50 degrees, which was 2 percent greater than the performance standard (U.S. Army Corps of Engineers, 2013; table 19), permitting the use of the full 140 degrees of the sonar swath. As indicated in the previous paragraph, points acquired outside of the central 100–110 degrees of the swath generally had overlap with adjacent swaths, which increases the quality of the survey in the overlapped areas because of duplication.
Table 19.
Results of a beam angle check from two check lines over a reference surface at Mozingo Lake near Maryville, Missouri, on June 23, 2020.[<, less than; --, no data]
Performance standard check values are from U.S. Army Corps of Engineers (2013, table 17-1) for soft sand/silt bottoms.
Patch Tests
Patch tests are a series of dynamic calibration tests that are used to check for subtle variations in the orientation and timing of the MBES with respect to the INS and real-world coordinates (fig. 57). The patch tests are used to determine timing offsets caused by latency between the MBES and the INS, and angular offsets to roll, pitch, and yaw caused by the alignment of the transducer head (Huizinga, 2020). These offsets have been observed to be essentially constant for a given survey, barring an event that causes the mount to change such as striking a floating or submerged object (see Huizinga, 2020). The offsets determined in the patch test are applied when processing the data collected during a survey. Patch tests were completed at various times in various lakes during the surveying projects during the summer of 2019 and 2020 (table 20), and angular offsets were updated in the data collection software as appropriate.
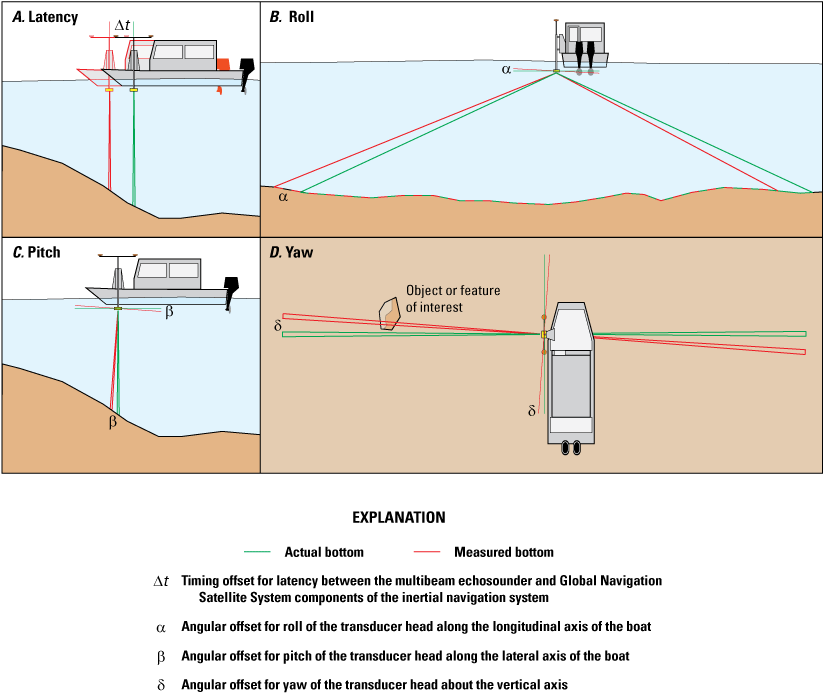
Generalized effects on data from a multibeam echosounder. A, Timing offset for latency. B, Angular offset for roll. C, Angular offset for pitch. D, Angular offset for yaw.
Table 20.
Patch test results at a few locations in Missouri from July 17, 2019, to June 25, 2020.[Dates are shown as month/day/year]
With the Norbit iWBMSh, the INS and sonar are considered to be tightly coupled because the IMU of the INS is mounted on the same mounting bracket (fig. 2A); therefore, there was no measured timing offset and no measured angular offset for pitch, which is consistent with latency and pitch test results for this equipment configuration used in other surveys (Richards and others, 2019; Huizinga, 20204). The measured offset for yaw changed from 0 to 0.50 degree and back to 0 degree (table 20); the yaw is a measure of the alignment of the GNSS receivers relative to the IMU of the INS on the sonar head, and a relatively major strike of a submerged tree occurred at Harrison County Lake. The measured angular offset for roll appeared to be –0.37 degree midway through the summer 2019 surveys, based on the results at Longview Lake just before some surveys on the Missouri River in Kansas City (Huizinga, 2022; table 20); however, the measured angular offset for roll was –0.30 degree for the patch tests before and after the Kansas City area surveys (table 20). Furthermore, using a roll angle offset of –0.37 degree during processing of the Missouri River surveys indicated this offset was incorrect, and a roll angle offset of –0.30 degree was used for the Kansas City area bridge surveys with better overall results (Huizinga, 2022). Therefore, the roll results from Longview Lake were considered to be in error and were not used. In the earliest work with the MBMS in Missouri (Huizinga, 2010), a sensitivity analysis of the four offsets indicated that the ultimate position of surveyed points in three-dimensional space was least sensitive to the angular offset for yaw, whereas the ultimate position was most sensitive to the angular offset for roll. Processing all the data for the lakes detailed in this report with an angular offset of roll of –0.30 degree, and no angular offset for pitch or yaw, generally yielded good results with no noticeable artifacts caused by incorrect offsets.
Uncertainty Estimation
Similar to the previous studies of bathymetry in Missouri (Huizinga, 2010, 2020; Richards and others, 2019), uncertainty in the multibeam survey was estimated for each survey-grid cell in the surveyed area using the Combined Uncertainty and Bathymetry Estimator (CUBE) method (Calder and Mayer, 2003) as implemented in the MBMax processing package of the HYPACK/HYSWEEP software (HYPACK, Inc., 2018). The CUBE uncertainty is a measure of the variability of the individual points in the cell used to determine the CUBE-derived elevation for the cell. Statistics of gridded uncertainty for each of the surveyed lakes are shown in table 21, and the spatial distribution of uncertainty observed in each lake is shown on the appropriate sheet for that lake (sheets 1 through 12). The CUBE uncertainty data were output and combined with the three-dimensional bathymetric data included in the USGS data release associated with this study (Huizinga and others, 2021). Data from the ADCP or GNSS did not have an associated CUBE uncertainty.
Table 21.
Uncertainty results for gridded bathymetric data from surveys at water-supply lakes in northwestern Missouri, July 16, 2019, through June 26, 2020.| Lake name | Lake number (fig. 1) | Maximum value of uncertainty, in feet | Average value of uncertainty, in feet | Median value of uncertainty, in feet | Standard deviation of uncertainty, in feet | Percentage of bathymetric points with uncertainty value less than a given threshold | |||
|---|---|---|---|---|---|---|---|---|---|
| 1.00 foot | 0.50 foot | 0.25 foot | 0.10 foot | ||||||
| Hamilton Reservoir | 1 | 1.25 | 0.04 | 0.03 | 0.04 | 99.99 | 99.88 | 99.18 | 96.34 |
| King City South Lake | 2 | 1.97 | 0.12 | 0.10 | 0.11 | 99.82 | 98.35 | 91.77 | 61.41 |
| Willow Brook Lake | 3 | 1.87 | 0.06 | 0.03 | 0.07 | 99.94 | 99.59 | 98.20 | 94.43 |
| Bethany New City Lake | 4 | 2.79 | 0.31 | 0.26 | 0.20 | 99.11 | 85.44 | 47.91 | 10.53 |
| Old Bethany City Lake | 5 | 8.04 | 0.22 | 0.13 | 0.38 | 96.74 | 91.98 | 81.48 | 43.43 |
| Middle Fork Grand River Reservoir | 6 | 1.87 | 0.04 | 0.03 | 0.05 | 99.97 | 99.77 | 98.96 | 96.27 |
| Lake Viking | 7 | 1.54 | 0.09 | 0.07 | 0.09 | 99.98 | 99.20 | 96.32 | 79.36 |
| Harrison County Lake | 8 | 2.13 | 0.08 | 0.07 | 0.07 | 99.96 | 99.54 | 96.80 | 86.36 |
| King City Reservoir, Upper | 9 | 1.44 | 0.11 | 0.07 | 0.12 | 99.70 | 98.15 | 92.06 | 78.86 |
| King City Reservoir, Middle | 9 | 1.71 | 0.10 | 0.07 | 0.11 | 99.69 | 98.45 | 92.96 | 83.05 |
| King City Reservoir, Lower | 9 | 2.36 | 0.14 | 0.13 | 0.11 | 99.63 | 98.31 | 94.54 | 35.95 |
| Maysville Reservoir | 10 | 1.80 | 0.10 | 0.10 | 0.06 | 99.99 | 99.77 | 97.78 | 66.81 |
| Mozingo Lake | 11 | 1.84 | 0.08 | 0.07 | 0.09 | 99.96 | 99.03 | 96.01 | 81.73 |
| Maryville Reservoir | 12 | 5.05 | 0.13 | 0.13 | 0.13 | 99.68 | 98.70 | 94.55 | 49.97 |
Most of the uncertainty values (more than 85 percent) were less than 0.50 ft, which is within the specifications for a “Special Order” survey, the most-stringent survey standard of the International Hydrographic Organization (International Hydrographic Organization, 2020). The largest average uncertainty value for the surveys was 0.31 ft, and the largest median uncertainty value was about 0.26 ft (table 21). The largest uncertainty from all surveys was about 8.04 ft; however, uncertainty values of this magnitude typically are found near high-relief features, such as near vertical surfaces such as an intake structure or submerged banks that may exist on some parts of the lake (fig. 25 on sheet 5). The uncertainty values were larger near moderate-relief features (steep banks and submerged channels and ridges (the old channel is visible in fig. 39 on sheet 8). The uncertainty values also were sometimes larger in the outermost beam extents of the MBES swath in the overlap with an adjacent swath, particularly when the swath was tilted for the survey lines along the banks or widened in the upper extent of a lake (fig. 25 on sheet 5; fig. 39 on sheet 8).
Bathymetric Surface, Contour Map, and Bathymetric Change Quality Assurance
Accuracy of the bathymetric surface and contours is a function of the survey data accuracy, density of the survey data, and the processing steps involved in the surface and contour creation. The process of data reduction done to obtain the gridded dataset (at a given grid resolution) from the raw survey data likely degraded the accuracy of the gridded dataset relative to the raw data. At least one area of each lake was resurveyed after the main survey, generally in a direction 45 to 90 degrees to the main survey, to collect a dataset (hereinafter referred to as a “cross-check line”) that could be used to estimate the accuracy of the gridded dataset used to produce the bathymetric surface (table 22). If the survey spanned more than 1 day, at least one cross-check line was collected each day. Raw points in the cross-check lines that were within a set horizontal distance of a gridded point (the “quality-assurance point search radius” in table 22) were selected as cross-check quality-assurance data points, and the elevation values of these cross-check line points were compared to the gridded points. The quality-assurance point search radius was varied by lake to permit a reasonable number of comparison points between the gridded and cross-check data, without introducing a bias caused by too many raw points being compared to a given gridded point in areas with higher-density raw data. The selected raw cross-check line points were compared to the gridded points by testing the data at a vertical accuracy at a 95-percent confidence level (table 22); the median absolute vertical error of each survey also is shown in table 22.
Table 22.
Summary of cross-check line results used for quality-assurance of gridded bathymetric data from surveys at water-supply lakes in northwestern Missouri, July 16, 2019, through June 26, 2020.| Lake name | Lake number (fig. 1) | Number of raw quality-assurance points in cross-check line dataset | Quality-assurance point search radius, in feet | Number of points in comparison dataset | Tested vertical accuracy at a 95-percent confidence level, in feet | Median absolute vertical error, in feet |
|---|---|---|---|---|---|---|
| Hamilton Reservoir | 1 | 6,643,691 | 0.066 | 9,212 | 0.46 | 0.20 |
| King City South Lake | 2 | 1,242,378 | 0.066 | 8,606 | 0.62 | 0.31 |
| Willow Brook Lake | 3 | 7,027,909 | 0.082 | 19,069 | 0.69 | 0.33 |
| Bethany New City Lake | 4 | 379,908 | 0.164 | 26,693 | 0.49 | 0.24 |
| Old Bethany City Lake | 5 | 2,838,079 | 0.066 | 27,855 | 0.44 | 0.21 |
| Middle Fork Grand River Reservoir | 6 | 4,834,998 | 0.082 | 11,957 | 0.61 | 0.30 |
| Lake Viking | 7 | 7,379,809 | 0.164 | 28,845 | 0.59 | 0.18 |
| Harrison County Lake | 8 | 2,237,931 | 0.098 | 7,493 | 0.48 | 0.23 |
| King City Reservoir systema | 9 | 2,578,631 | 0.033 | 12,899 | 0.60 | 0.30 |
| Maysville Reservoir | 10 | 880,172 | 0.066 | 5,053 | 0.44 | 0.20 |
| Mozingo Lake | 11 | 3,581,819 | 0.33 | 17,199 | 0.48 | 0.13 |
| Maryville Reservoir | 12 | 252,746 | 0.16 | 17,172 | 0.47 | 0.23 |
A mapping quality-assurance dataset was used to evaluate the bathymetric surface and included data points selected at random from the gridded data points at each lake. Points that were used to create the bathymetric surface were not included as bathymetric surface quality-assurance points. The three-dimensional bathymetric surface was tested against the surface quality-assurance dataset from a given lake to determine the vertical accuracy of the surface using methods described in Wilson and Richards (2006). The surface of each lake tested at a vertical accuracy shown in table 23 at the 95-percent confidence level; the median absolute vertical error of each surface is shown in table 23. The three-dimensional bathymetric surface of each lake was used as the source for the computation of the surface area and capacity values for the lake and the source for the development of the bathymetric contour map for each lake.
Table 23.
Summary of bathymetric surface quality-assurance results from surveys at water-supply lakes in northwestern Missouri, July 16, 2019, through June 26, 2020.| Lake name | Lake number (fig. 1) | Number of points in quality-assurance dataset (table 2) | Tested vertical accuracy at a 95-percent confidence level, in feet | Median absolute vertical error, in feet |
|---|---|---|---|---|
| Hamilton Reservoir | 1 | 33,456 | 0.04 | 0.01 |
| King City South Lake | 2 | 35,775 | 0.03 | 0.01 |
| Willow Brook Lake | 3 | 53,985 | 0.08 | 0.01 |
| Bethany New City Lake | 4 | 104,924 | 0.44 | 0.02 |
| Old Bethany City Lake | 5 | 30,844 | 1.04 | 0.02 |
| Middle Fork Grand River Reservoir | 6 | 36,225 | 0.24 | 0.02 |
| Lake Viking | 7 | 67,458 | 0.25 | 0.03 |
| Harrison County Lake | 8 | 87,199 | 0.05 | 0.01 |
| King City Reservoir, Upper | 9 | 7,344 | 0.15 | 0.01 |
| King City Reservoir, Middle | 9 | 18,425 | 0.20 | 0.01 |
| King City Reservoir, Lower | 9 | 55,414 | 0.15 | 0.01 |
| Maysville Reservoir | 10 | 60,287 | 0.09 | 0.01 |
| Mozingo Lake | 11 | 107,170 | 0.23 | 0.03 |
| Maryville Reservoir | 12 | 18,099 | 0.16 | 0.02 |
The process of smoothing and cartographic editing of the bathymetric contours to produce an aesthetic map degrades the positional and vertical accuracy of the contours; however, the contours are used primarily for visualization of the surface in an illustration, so some accuracy degradation is expected. The bathymetric contours for a given lake were tested with the same quality-assurance dataset used to evaluate the bathymetric surface. A point was considered a contour elevation evaluation point if it was within a certain horizontal distance of a given contour line (the “contour quality-assurance point search tolerance” in table 24). The contour quality-assurance point search tolerance was chosen such that most of the quality-assurance points could be reasonably considered to be a match to the contour, and less than one-half of the approximate minimum horizontal distance between contours. The contours of each lake tested at a vertical accuracy shown in table 24 at the 95-percent confidence level; the median absolute vertical error of the contours for each lake also is shown in table 24.
Table 24.
Summary of bathymetric contour quality-assurance results from surveys at water-supply lakes in northwestern Missouri, July 16, 2019, through June 26, 2020.| Lake name | Lake number (fig. 1) | Number of points in quality-assurance dataset (table 2) | Contour quality-assurance point search tolerance, in feet | Number of points in contour-to-point comparison | Tested vertical accuracy at a 95-percent confidence level, in feet | Median absolute vertical error, in feet |
|---|---|---|---|---|---|---|
| Hamilton Reservoir | 1 | 33,456 | 0.33 | 2,044 | 0.15 | 0.03 |
| King City South Lake | 2 | 35,775 | 0.33 | 2,956 | 0.10 | 0.02 |
| Willow Brook Lake | 3 | 53,985 | 0.33 | 3,652 | 0.26 | 0.03 |
| Bethany New City Lake | 4 | 104,924 | 0.08 | 6,314 | 0.30 | 0.03 |
| Old Bethany City Lake | 5 | 30,844 | 0.33 | 4,279 | 0.22 | 0.04 |
| Middle Fork Grand River Reservoir | 6 | 36,225 | 0.33 | 3,567 | 0.34 | 0.06 |
| Lake Viking | 7 | 67,458 | 0.30 | 3,544 | 0.59 | 0.08 |
| Harrison County Lake | 8 | 87,199 | 0.33 | 7,436 | 0.44 | 0.05 |
| King City Reservoir, Upper | 9 | 7,344 | 0.16 | 388 | 0.10 | 0.02 |
| King City Reservoir, Middle | 9 | 18,425 | 0.33 | 1,024 | 0.12 | 0.02 |
| King City Reservoir, Lower | 9 | 55,414 | 0.33 | 5,312 | 0.12 | 0.02 |
| Maysville Reservoir | 10 | 60,287 | 0.82 | 5,256 | 0.18 | 0.03 |
| Mozingo Lake | 11 | 107,170 | 0.33 | 13,023 | 0.39 | 0.00 |
| Maryville Reservoir | 12 | 18,099 | 0.08 | 1,310 | 0.49 | 0.08 |
Quality-assurance data were used to evaluate the bathymetric surface accuracy of Lake Viking (lake 7; fig. 35 on sheet 7) and Maysville Reservoir (lake 10; fig. 48 on sheet 10) in the previous surveys at these lakes (Wilson and Richards, 2006). These same data were used to estimate the accuracy of the bathymetric change raster in the comparisons with the current surveys for these two lakes. The differences between the elevations of the previous survey quality-assurance data points and the 2019 bathymetric mapping points at coincident locations (using a selection search radius of 4.92 ft for Lake Viking and 3.77 ft for Maysville Reservoir) were compared at 3,575 locations for Lake Viking (of 4,458 original quality-assurance points; fig. 35 on sheet 7) and at 965 locations for Maysville Reservoir (of 1,099 original quality-assurance points; fig. 48 on sheet 10). The bathymetric change raster for Lake Viking tested at a vertical accuracy of 1.01 ft at the 95-percent confidence level; the median absolute error for the comparison was 0.25 ft. The bathymetric change raster for Maysville Reservoir tested at a vertical accuracy of 1.00 ft at the 95-percent confidence level; the median absolute error for the comparison was 0.19 ft.
Bathymetry, Capacity, and Bathymetric Change
A bathymetric surface was created from the current (2019 or 2020) surveyed data and used to produce a bathymetric contour map for each lake (sheets 1 through 12). The bathymetric maps are similar to maps produced from the earlier surveys (Wilson and Richards, 2006; appendix of Richards, 2013). The lake bathymetric contours generally show that when a defined river channel was present before lake impoundment, that submerged river channel is still present and visible in some areas (fig. 19 on sheet 4; fig. 27 on sheet 6; fig. 32 on sheet 7; fig. 37 on sheet 8; fig. 50 on sheet 11). Evidence of a river channel becomes more muted with time as sediment accumulates over the lake bottom in a particular area and diminishes the sharp channel bank features evident in a nonsubmerged channel (for example, fig. 4 on sheet 1; fig. 9 on sheet 2; fig. 14 on sheet 3; fig. 45 on sheet 10).
A surface area and capacity table was computed at a 2-ft interval for each lake from the bathymetric surface TIN, and is on the respective map plate for each lake. The surface area and capacity values for each lake at the primary spillway or intake elevation are summarized in table 25.
Table 25.
Summary of surface area and capacity at the listed spillway or intake elevation from surveys at water-supply lakes in northwestern Missouri, July 16, 2019, through June 26, 2020.[All elevations are referenced to the North American Vertical Datum of 1988]
| Lake name | Lake number (fig. 1) | Primary spillway/intake elevation, in feet | Surface area, in acres | Capacity, in acre-feet |
|---|---|---|---|---|
| Hamilton Reservoir | 1 | 926.45 | 86.6 | 800 |
| King City South Lake | 2 | 1,028.61 | 28.7 | 199 |
| Willow Brook Lake | 3 | 908.48 | 136 | 1,250 |
| Bethany New City Lake | 4 | 921.60 | 75.2 | 1,260 |
| Old Bethany City Lake | 5 | 902.88 | 17.3 | 214 |
| Middle Fork Grand River Reservoir | 6 | 889.43 | 97.5 | 764 |
| Lake Viking | 7 | 864.43 | 548 | 11,900 |
| Harrison County Lake | 8 | 960.40 | 247 | 2,350 |
| King City Reservoir, Upper | 9 | 1,052.00 | 4.70a | 31.8a |
| King City Reservoir, Middle | 9 | 1,035.34 | 11.4 | 64.2 |
| King City Reservoir, Lower | 9 | 1,034.74 | 27.6 | 311 |
| Maysville Reservoir | 10 | 898.56 | 37.8 | 223 |
| Mozingo Lake | 11 | 1,060.11 | 957b | 17,400b |
| Maryville Reservoir | 12 | 1,061.23 | 11.2 | 124 |
When a previous survey exists for a lake, the new area and capacity table generally is similar to the previous survey; however, the capacity generally is less in the 2019 table compared to the previous table at corresponding elevations because of sedimentation. Table 26 lists the capacity at the primary spillway or intake elevation at each lake for which a previous survey exists. The capacity value shown for the previous survey has been corrected for any elevation discrepancy between the surveys listed in table 17.
Table 26.
Summary of surface area and capacity changes at the listed primary spillway elevation from surveys at water-supply lakes in northwestern Missouri, July 16, through September 7, 2019, and previous surveys.[Dates are shown as month/day/year. All elevations are referenced to the North American Vertical Datum of 1988]
| Lake name | Lake number (fig. 1) | Primary spillway/intake elevation, in feet | Previous survey | 2019 capacity, in acre-feet | Capacity loss, in percent | |
|---|---|---|---|---|---|---|
| Date(s) | Capacity,a in acre-feet | |||||
| Hamilton Reservoir | 1 | 926.45 | 07/11/2000 | 952 | 800 | 16.0 |
| King City South Lake | 2 | 1,028.61 | 07/19/2000 | 211 | 199 | 5.9 |
| Willow Brook Lake | 3 | 908.48 | 07/25/2000 | 1,290 | 1,250 | 3.5 |
| Middle Fork Grand River Reservoir | 6 | 889.43 | 07/26/2000 | 972 | 764 | 21.4 |
| Lake Viking | 7 | 864.43 | 03/22/2006–03/23/2006 | 12,000 | 11,900 | 0.8 |
| Maysville Reservoir | 10 | 898.56 | 03/21/2006 | 250 | 223 | 10.8 |
The capacity values shown for previous surveys are from the area and capacity tables from Richards (2013); elevations were adjusted to account for datum discrepancies found between the previous and current surveys detailed in table 17.
The bathymetric change maps for the lakes with previous surveys (sheets 1, 2, 3, 6, 7, and 10) show erosional as well as depositional areas (table 27). Deposition is predominant, and generally seems to be relatively uniform across a given lake area with some localized erosion near the edges of the lake. Notable exceptions include a clear ridge of erosion on the south side of Hamilton Reservoir near the fork between the two arms (fig. 7 on sheet 1) and pronounced ridges of alternating substantial deposition and minor deposition to erosion at several locations in Lake Viking (most visibly near the first large lake arm to the east upstream (south) from the dam in the main body of the lake; fig. 35 on sheet 7). Areas of substantial erosion in the upper parts of each of the lake arms in Lake Viking (fig. 35 on sheet 7) correspond to dredging work planned in early 2019 before the survey per the Lake Viking Dredging Plan (Lake Viking, 2019).
Table 27.
Summary of bathymetric change statistics computed from the bathymetric change raster at water-supply lakes in northwestern Missouri, July 16, through September 7, 2019.| Lake name | Lake number (fig. 1) | Maximum value of erosion, in feet | Maximum value of deposition, in feet | Mean bathymetric change, in feet | Area of bathymetric change raster, in acres | Volume of sediment, in acre-feet | Time between surveys, in years | Sedimentation rate, in acre-feet per year |
|---|---|---|---|---|---|---|---|---|
| Hamilton Reservoir | 1 | 0.95 | 2.62 | 1.07 | 61.9 | 66.2 | 19.0 | 3.48 |
| King City South Lake | 2 | 0.78 | 2.06 | 0.55 | 18.6 | 10.2 | 19.0 | 0.54 |
| Willow Brook Lake | 3 | 2.23 | 2.75 | 0.33 | 101 | 33.6 | 19.0 | 1.77 |
| Middle Fork Grand River Reservoir | 6 | 1.02 | 3.88 | 1.18 | 67.6 | 79.8 | 19.0 | 4.19 |
| Lake Viking | 7 | 1.75 | 2.49 | 0.40 | 499 | 200 | 13.4 | 14.9 |
| Maysville Reservoir | 10 | 1.21 | 2.20 | 0.39 | 28.9 | 11.3 | 13.5 | 0.84 |
A decrease in capacity was observed at all the lakes for which a previous survey existed (table 26). The decrease in capacity at the primary spillway elevation ranged from 0.8 percent at Lake Viking to 21.4 percent at Middle Fork Grand River Reservoir. The mean bathymetric change ranged from 0.33 ft at Willow Brook Lake to 1.18 ft at Middle Fork Grand River Reservoir (table 27). The sedimentation rate was determined from the average bathymetric change times the area of the bathymetric change raster, divided by the duration between the surveys (table 27). The sedimentation rate generally ranged from 0.54 to 4.19 acre-feet per year at King City South Lake and Middle Fork Grand River Reservoir, respectively; however, Lake Viking had the largest sedimentation rate of 14.9 acre-feet per year (table 27), despite having the smallest decrease in capacity at the spillway elevation (only 0.8 percent [table 26]) and a mean bathymetric change of only 0.4 ft (table 27).
The pronounced ridges noted at Hamilton Reservoir (sheet 1) and Lake Viking (sheet 7) seem to coincide with the single-beam transect locations from the previous survey and may be the result of erroneous position or depth readings in the previous surveys. Unlike data from an MBMS, which has an INS to record the position and motion of the survey boat with a reasonably high degree of accuracy, data in the previous surveys were collected with a single-beam sonar system, which used a DGPS position solution and did not have any correction for other movements of the boat. As indicated in the “Patch Test” section above, errors in position and angular offsets for pitch and roll can make a difference in the depth values obtained by a sonar system (fig. 57). Although the angular offset for yaw is not an issue for a single-beam sonar (no swath width to be skewed as shown in fig. 57D) and roll is for a single, nadir point below the sonar rather than a swath as shown in figure 57B, angular offsets based on boat movement for pitch and roll (and not recorded by the single-beam sonar system) could result in erroneous submerged point placement. Inaccurate DGPS position data results in an offset similar to the latency offset indicated in figure 57A. As mentioned in the “Bathymetric Change Map Creation” section above, masking the areas of high slope likely helps limit the areas where minor horizontal positional offsets between coincident points in the two surveys sometimes create erroneous bathymetric change results. Nevertheless, these positional artifacts may persist in other locations of the bathymetric change maps.
Other areas of erosion in various areas of the bathymetric change maps are not easy to explain. Often, these areas are in the shallows along the margins of the lakes (fig. 7 on sheet 1; fig. 12 on sheet 2; fig. 48 on sheet 10) where shallow water wave action might affect sediment deposition with fluctuating lake levels during low-water years. These same lakes generally have substantial deposition in the deeper parts of the lake.
An implied sedimentation rate also can be computed from the capacity changes at the primary spillway or intake shown in table 26. For instance, at Middle Fork Grand River Reservoir, the loss of capacity at the primary spillway elevation is 208 acre-feet (table 26), and dividing this value over the 19.0 years between the surveys (table 27) implies a sedimentation rate of about 10.9 acre-feet per year. This implied sedimentation rate is substantially higher than the sedimentation rate computed from the bathymetric change raster of 4.19 acre-feet per year for this lake (table 27). However, sediment tends to accumulate more quickly at the upper ends of a lake, where the sediment-laden streamflow initially meets the slack water of the lake and the heavier sediment settles out of suspension. These upper ends of the lake also tend to be where multibeam data cannot be acquired due to the resulting shallow water, and the sedimentation rate computed from the bathymetric change raster (table 27) may not fully account for deposition in these areas. On the other hand, the implied sedimentation rate of table 26 may exaggerate the sedimentation and overall loss of volume of the lake throughout the full range of elevations because it only represents loss at the primary spillway or intake elevation. Therefore, the implied sedimentation rates of table 26 and the computed sedimentation rates of table 27 likely bracket the sedimentation rate of each lake.
Summary
Bathymetric data were collected at 12 water-supply lakes in northwestern Missouri by the U.S. Geological Survey (USGS) in cooperation with the Missouri Department of Natural Resources and in collaboration with various local agencies. These surveys are the first in a 5-year series to establish or update the surface area and capacity tables for the surveyed lakes. Ten of the lakes were surveyed from July to September 2019, one of the first 10 was resurveyed in March 2020, and two lakes of high interest near Maryville, Missouri, were surveyed in June 2020. Six of the lakes had been surveyed by the USGS before, and the recent surveys were compared to the earlier surveys to document the changes in the bathymetric surface and capacity of the lake and produce a bathymetric change map.
Bathymetric data were collected using a high-resolution multibeam mapping system (MBMS) mounted on a boat. Two different boats were used for the 2019 and 2020 surveys: larger lakes with a concrete ramp were surveyed using a 22-foot flat-bottom cabin boat, and smaller lakes without a concrete ramp generally were surveyed using an 18-foot cargo canoe, which could be more-easily launched and retrieved from the bank of a lake. The bathymetric data were collected along transect lines oriented longitudinally in the main lake area, using about 10- to 25-percent overlap of the adjacent survey swaths, to attempt to ensure complete coverage of the lake bottom and minimize sonic shadows. Data along the shoreline were collected by navigating the boat parallel to the shore while overlapping the data collected in the main body of the lake. Supplemental depth data were collected in shallow areas with an acoustic Doppler current profiler (ADCP) on a remote-controlled boat. At Hamilton Reservoir, a substantial shallow area filled with aquatic vegetation existed upstream from a low-clearance bridge on the northern arm; a Global Navigation Satellite System (GNSS) survey receiver was used to collect bathymetric data at several points across four transects and around the perimeter of that area at the lake.
Data points from the MBMS, as well as any supplemental ADCP or GNSS points, were exported at a gridded data resolution appropriate to each lake. Geographic information system (GIS) software was used to filter the gridded bathymetric data points to create a dataset that had a minimum point spacing that was about twice that (that is, lower resolution) of the gridded data resolution. Data outside the MBES survey extent and greater than the surveyed water-surface elevation generally were obtained from data collected using aerial light detection and ranging (lidar) point cloud data, 1/9 arc-second National Elevation Dataset (NED) data based on aerial lidar data, or both. These data points were resampled to a linear distance that matched the map resolution of each lake using GIS software and used to define the upland areas of the lake. A linear enforcement technique was used to add points to the dataset in areas of sparse data (the upper ends of coves where the water was too shallow for the MBES equipment or aquatic vegetation precluded data acquisition with the MBES or ADCP) based on surrounding MBES and upland data values. The various point datasets (MBMS, ADCP, GNSS, upland data, and linear enforcement) were used to produce a three-dimensional triangulated irregular network (TIN) surface of the lake-bottom elevations for each lake. A surface area and capacity table was produced from the three-dimensional TIN surface showing surface area and capacity at specified lake water-surface elevations.
If data from a previous bathymetric survey existed at a given lake, a bathymetric change map was generated from the difference between the previous survey and the 2019 bathymetric survey data points where they were coincident. Comparing the results of the previous survey to the 2019 survey required both datasets to be at a common elevation datum, so a point of coincident location and elevation from the previous survey was surveyed again in 2019 (such as the reference mark from the previous survey or the spillway crest) using GNSS techniques. If a difference existed between the 2019 and the previous elevation, it was assumed that the 2019 elevation was the more accurate value. After applying any vertical elevation changes to the previous survey data to ensure a match to the 2019 survey datum and position, coincident points between the surveys were found, and a bathymetric change TIN was generated using the difference in elevation between the coincident point data.
Various quality-assurance tests were conducted to ensure quality data were collected with the MBMS, including beam angle checks and patch tests. Additional quality-assurance tests were conducted on the various datasets from these surveys. The gridded bathymetric data from the MBMS survey were compared to raw data collected along at least one cross-check line at each lake to quantify the vertical accuracy of the gridded data at a 95-percent confidence level. A second quality-assurance dataset was used to evaluate the bathymetric surface and contours and included data points selected at random from the gridded data points at each lake. Points that were used to create the bathymetric surface were not included as bathymetric surface quality-assurance points. The bathymetric surface and contours were tested to quantify the vertical accuracy of each at a 95-percent confidence level.
A decrease in capacity was observed at all the lakes for which a previous survey existed. The decrease in capacity at the primary spillway or intake elevation ranged from 0.8 percent at Lake Viking to 21.4 percent at Middle Fork Grand River Reservoir. The mean bathymetric change ranged from 0.33 foot at Willow Brook Lake to 1.18 feet at Middle Fork Grand River Reservoir. The sedimentation rate generally ranged from 0.54 to 4.19 acre-feet per year at Maysville Lake and Middle Fork Grand River Reservoir, respectively; however, Lake Viking had the largest sedimentation rate of 14.9 acre-feet per year, despite having the smallest decrease in capacity at the spillway elevation of only 0.8 percent and a mean bathymetric change of only 0.4 foot. Evidence of dredging was observed in the bathymetric surface for Lake Viking. Some changes observed in some bathymetric change maps are believed to result from the difference in data collection equipment and techniques between the surveys. Certain erosional features around the perimeter of certain lakes may be the result of wave action during low-water years.
Acknowledgments
The authors wish to gratefully acknowledge the assistance of several current and former colleagues at the U.S. Geological Survey Central Midwest Water Science Center for their assistance in collecting and processing the data for this project. Jarrett Ellis (former employee), Austin Kochis, Roger (Buddy) Beam, E. Scott Southern, and Eric Reiss were instrumental in helping collect the data for the surveys detailed in this report.
References Cited
Calder, B.R., and Mayer, L.A., 2003, Automatic processing of high-rate, high-density multibeam echosounder data: Geochemistry, Geophysics, Geosystems (G3), v. 4, no. 6, 22 p. [Also available at https://doi.org/10.1029/2002GC000486.]
Huizinga, R.J., 2010, Bathymetric surveys at highway bridges crossing the Missouri River in Kansas City, Missouri, using a multibeam echo sounder, 2010: U.S. Geological Survey Scientific Investigations Report 2010–5207, 61 p. [Also available at https://doi.org/10.3133/sir20105207.]
Huizinga, R.J., 2020, Bathymetric and velocimetric surveys at highway bridges crossing the Missouri and Mississippi Rivers on the periphery of Missouri, July–August 2018: U.S. Geological Survey Scientific Investigations Report 2020–5088, 100 p. [Also available at https://doi.org/10.3133/sir20205088.]
Huizinga, R.J., 2022, Bathymetric and velocimetric surveys at highway bridges crossing the Missouri River near Kansas City, Missouri, August 2019, August 2020, and October 2020: U.S. Geological Survey Scientific Investigations Report 2021–5098, 112 p. [Also available at https://doi.org/10.3133/sir20215098.]
Huizinga, R.J., Elliott, C.M., and Jacobson, R.B., 2010, Bathymetric and velocimetric survey and assessment of habitat for pallid sturgeon on the Mississippi River in the vicinity of the proposed Interstate 70 Bridge at St. Louis, Missouri: U.S. Geological Survey Scientific Investigations Report 2010–5017, 28 p. [Also available at https://doi.org/10.3133/sir20105017.]
Huizinga, R.J., and Heimann, D.C., 2018, Hydrographic surveys of rivers and lakes using a multibeam echosounder mapping system: U.S. Geological Survey Fact Sheet 2018–3021, 6 p. [Also available at https://doi.org/10.3133/fs20183021.].
Huizinga R.J., Rivers, B.C., and Oyler, L.D., 2021, Bathymetric and supporting data for various water supply lakes in northwestern Missouri, 2019 and 2020 (ver. 1.1, September 2021): U.S. Geological Survey data release, https://doi.org/10.5066/P92M53NJ.
HYPACK, Inc., 2018, HYPACK hydrographic survey software user manual: Middletown, Conn., HYPACK, Inc., 2,434 p., accessed January 2022 at https://www.hypack.com/file%20library/resource%20library/manuals/2018/2018-hypack-user-manual.pdf.
International Hydrographic Organization, 2020, IHO standards for hydrographic surveys (6th ed.): Monaco, International Hydrographic Bureau, Special publication no. 44, 41 p., accessed January 2022 at https://iho.int/uploads/user/pubs/standards/s-44/S-44_Edition_6.0.0_EN.pdf.
Lake Viking, 2019, Lake dredging plan: Lake Viking, Mo., accessed January 2022 at https://lakevikingmo.com/2019/06/07/2019-lake-dredging-plan/.
Richards, J.M., 2013, Bathymetric surveys of selected lakes in Missouri—2000–2008: U.S. Geological Survey Open-File Report 2013–1101, 9 p. with appendix. [Also available at https://doi.org/10.3133/ofr20131101.]
Richards, J.M., and Huizinga, R.J., 2018, Bathymetric contour map, surface area and capacity table, and bathymetric difference map for Clearwater Lake near Piedmont, Missouri, 2017: U.S. Geological Survey Scientific Investigations Map 3409, 1 sheet. [Also available at https://doi.org/10.3133/sim3409.]
Richards, J.M., and Huizinga, R.J., 2019, Bathymetric and supporting data for Sugar Creek Lake near Moberly, Missouri, 2018: U.S. Geological Survey data release, https://doi.org/10.5066/P9XDVRMT.
Richards, J.M., Huizinga, R.J., and Ellis, J.T., 2019, Bathymetric contour map, surface area and capacity table, and bathymetric change map for Sugar Creek Lake near Moberly, Missouri, 2018: U.S. Geological Survey Scientific Investigations Map 3431, 1 sheet. [Also available at https://doi.org/10.3133/sim3431.]
Rydlund, P.H., Jr., and Densmore, B.K., 2012, Methods of practice and guidelines for using survey-grade global navigation satellite systems (GNSS) to establish vertical datum in the United States Geological Survey: U.S. Geological Survey Techniques and Methods, book 11, chap. D1, 102 p. with appendixes. [Also available at https://doi.org/10.3133/tm11D1.]
U.S. Army Corps of Engineers, 2013, Engineering and design—Hydrographic surveying: Washington, D.C., U.S. Army Corps of Engineers, manual no. EM 1110–2–1003, 560 p., accessed January 2022, at: https://www.publications.usace.army.mil/Portals/76/Publications/EngineerManuals/EM_1110-2-1003.pdf?ver=gDGVUj_0XR2sXHiIpQZv2Q%3d%3d.
Wilson, G.L., and Richards, J.M., 2006, Procedural documentation and accuracy assessment of bathymetric maps and area/capacity tables for small lakes: U.S. Geological Survey Scientific Investigations Report 2006–5208, 24 p. [Also available at https://doi.org/10.3133/sir20065208.]
Conversion Factors
U.S. customary units to International System of Units
Datum
Vertical coordinate information is referenced to the North American Vertical Datum of 1988 (NAVD 88), using the geoid model GEOID12b (2019 lakes) or GEOID18 (2020 lakes).
Horizontal coordinate information is referenced to the North American Datum of 1983 (NAD 83).
Supplemental Information
Frequency is given in kilohertz (kHz).
Data were collected, processed, and output in the International System of Units, and converted to U.S. customary units for presentation in the maps at the request and for the convenience of the cooperator.
Abbreviations
[Some abbreviations are only used once but are used and included here for the convenience of the cooperator and end users, who often are more familiar with the abbreviation than the definition]
ADCP
acoustic Doppler current profiler
CUBE
Combined Uncertainty and Bathymetry Estimator
DGPS
Differential Global Positioning System
GIS
geographic information system
GNSS
Global Navigation Satellite System
IMU
inertial measurement unit
INS
inertial navigation system
lidar
light detection and ranging
MBES
multibeam echosounder
MBMS
multibeam mapping system
MMS
Mobile Mapping Suite
MDNR
Missouri Department of Natural Resources
NED
National Elevation Dataset
RTK
real-time kinematic
SBET
smoothed best estimate of trajectory
sonar
sound navigation and ranging
TIN
triangulated irregular network
USGS
U.S. Geological Survey
For more information about this publication, contact:
Director, USGS Central Midwest Water Science Center
1400 Independence Road
Rolla, MO 65401
573–308–3667
For additional information, visit: https://www.usgs.gov/centers/cmwater
Publishing support provided by the
Rolla Publishing Service Center
Suggested Citation
Huizinga, R.J., Oyler, L.D., and Rivers, B.C., 2022, Bathymetric contour maps, surface area and capacity tables, and bathymetric change maps for selected water-supply lakes in northwestern Missouri, 2019 and 2020: U.S. Geological Survey Scientific Investigations Map 3486, 12 sheets, includes 21-p. pamphlet, https://doi.org/10.3133/sim3486.
ISSN: 2329-132X (online)
Study Area
| Publication type | Report |
|---|---|
| Publication Subtype | USGS Numbered Series |
| Title | Bathymetric contour maps, surface area and capacity tables, and bathymetric change maps for selected water-supply lakes in northwestern Missouri, 2019 and 2020 |
| Series title | Scientific Investigations Map |
| Series number | 3486 |
| DOI | 10.3133/sim3486 |
| Year Published | 2022 |
| Language | English |
| Publisher | U.S. Geological Survey |
| Publisher location | Reston, VA |
| Contributing office(s) | Central Midwest Water Science Center |
| Description | Pamphlet: vi, 21 p.; 13 Sheets: 44.00 x 34.00 inches or smaller; Data Release |
| Country | United States |
| State | Missouri |
| Online Only (Y/N) | Y |
| Additional Online Files (Y/N) | Y |
| Google Analytic Metrics | Metrics page |