

Bathymetric Map and Surface Area and Capacity Table for Table Rock Lake near Branson, Missouri, 2020
Links
- Document: HTML , XML
- Sheets:
- Data Release: USGS data release —Bathymetric and supporting data for Table Rock Lake near Branson, Missouri, 2020
- Download citation as: RIS | Dublin Core
Introduction
Table Rock Lake was completed in 1958 on the White River in southwestern Missouri and northwestern Arkansas (fig. 1) for flood control, hydroelectric power, public water supply, and recreation. The surface area of Table Rock Lake is about 42,400 acres (table 1), and about 715 miles of shoreline are at the conservation pool level (915 feet [ft] above the North American Vertical Datum of 1988; U.S. Army Corps of Engineers, 2022). Sedimentation in reservoirs can result in reduced water storage capacity and a reduction in usable aquatic habitat; therefore, accurate and up-to-date estimates of reservoir water capacity are important for managing pool levels, power generation, recreation, and downstream aquatic habitat. Many of the lakes operated by the U.S. Army Corps of Engineers are periodically surveyed to monitor bathymetric changes that affect water capacity. In October and November 2020, the U.S. Geological Survey (USGS), in cooperation with the U.S. Army Corps of Engineers, completed one such survey of Table Rock Lake using a multibeam echosounder (MBES). The echosounder data were combined with USGS 1/3 arc-second digital elevation model (DEM) data and light detection and ranging (lidar) data, where present, to prepare a bathymetric map and a surface area and capacity table.
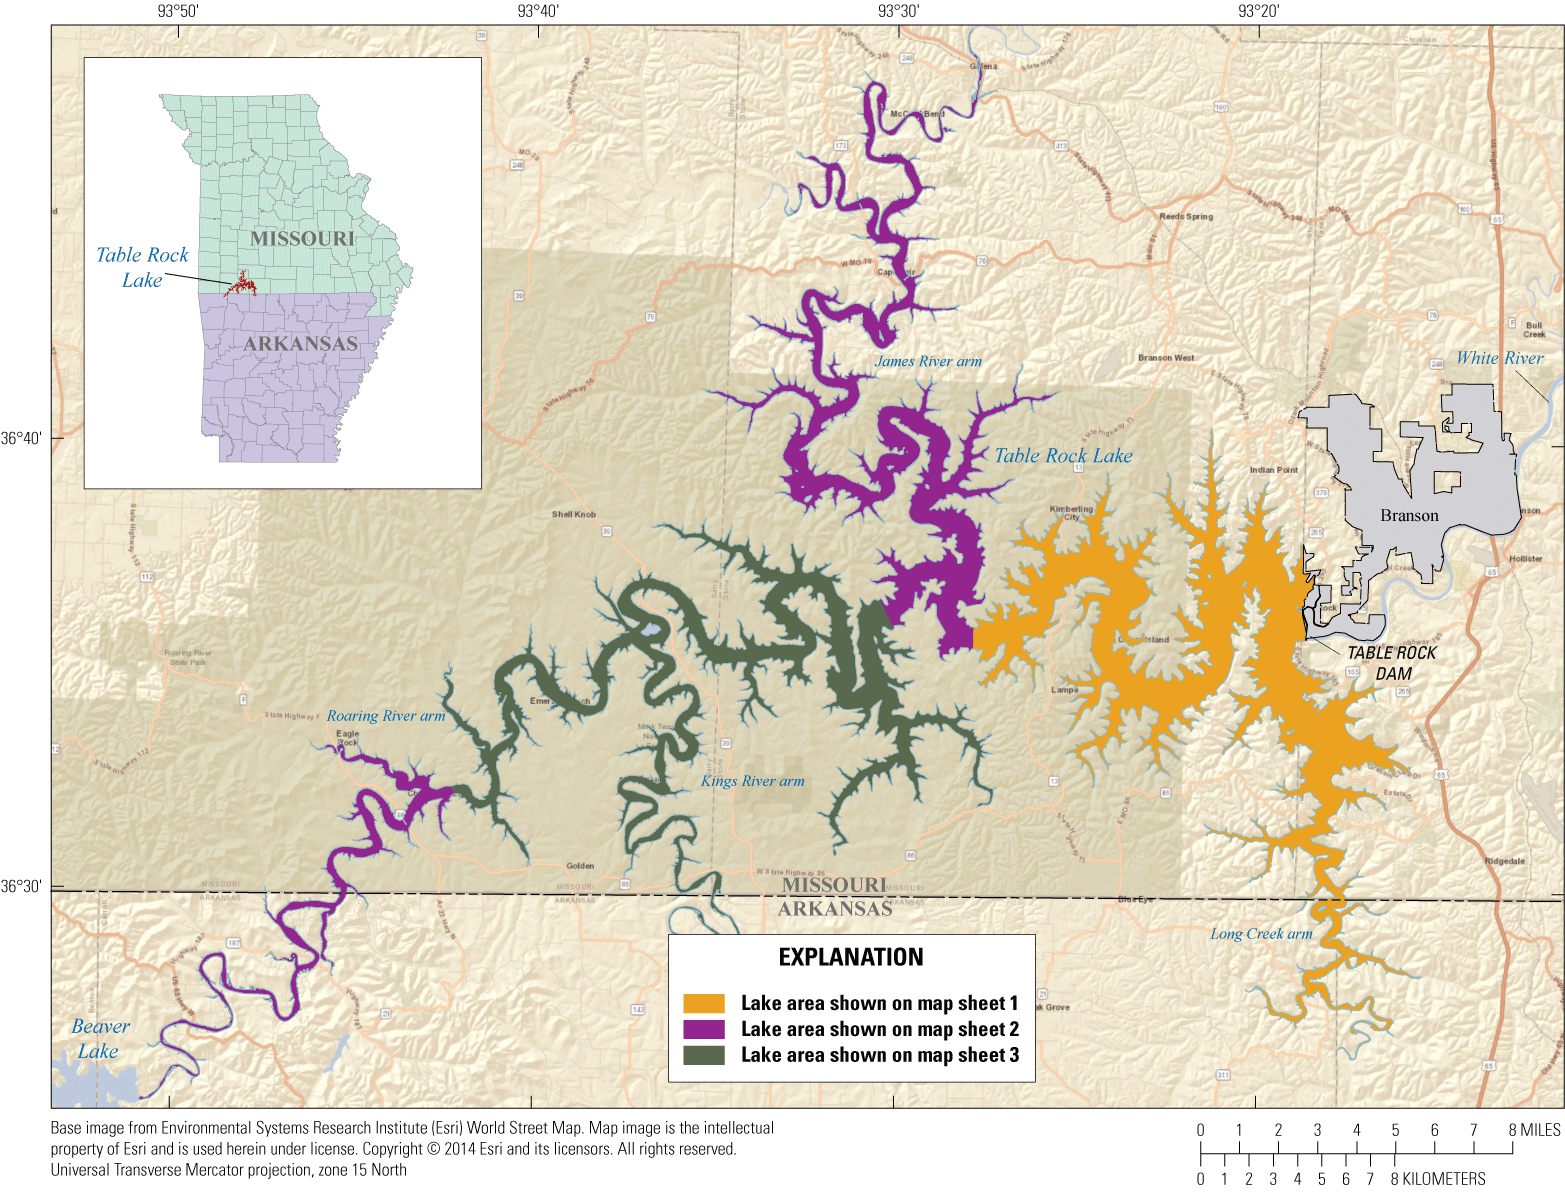
Location of Table Rock Lake near Branson, Missouri.
Table 1.
Surface area and capacity at specified water-surface elevations for Table Rock Lake near Branson, Missouri, from a survey on October 13 to November 11, 2020.[The average water-surface elevation during the survey was 915.5 feet, the conservation pool elevation is 915 feet (row shaded blue in the table), the flood pool elevation is 931 feet, and the upper vertical limit of the survey is 931 feet; --, no data; all elevations are referenced to the North American Vertical Datum of 1988]
Methods
A bathymetric survey of Table Rock Lake was completed between October 13 and November 11, 2020, using methods similar to those described by Richards and others (2019). The average water-surface elevation of Table Rock Lake during the survey was about 915.5 ft. A bathymetric surface and a surface area and capacity table were created from a combination of the bathymetric survey data with the DEM data for the upland area above the average water-surface elevation.
Bathymetric Data Collection
Bathymetric data (water depths and positions; fig. 2) were collected using high-resolution multibeam mapping systems (MBMSs). The data were collected concurrently by four boats surveying different sections of Table Rock Lake. The various components of the MBMSs used for this study are described in more detail in reports on the Missouri and Mississippi Rivers in Missouri (not shown; Huizinga, 2010, 2022; Huizinga and others, 2010) and Sugar Creek water supply lake near Moberly, Missouri (not shown; Richards and others, 2019). The survey methods used to obtain the data for Table Rock Lake were similar to these studies, as were the methods used to ensure data quality.
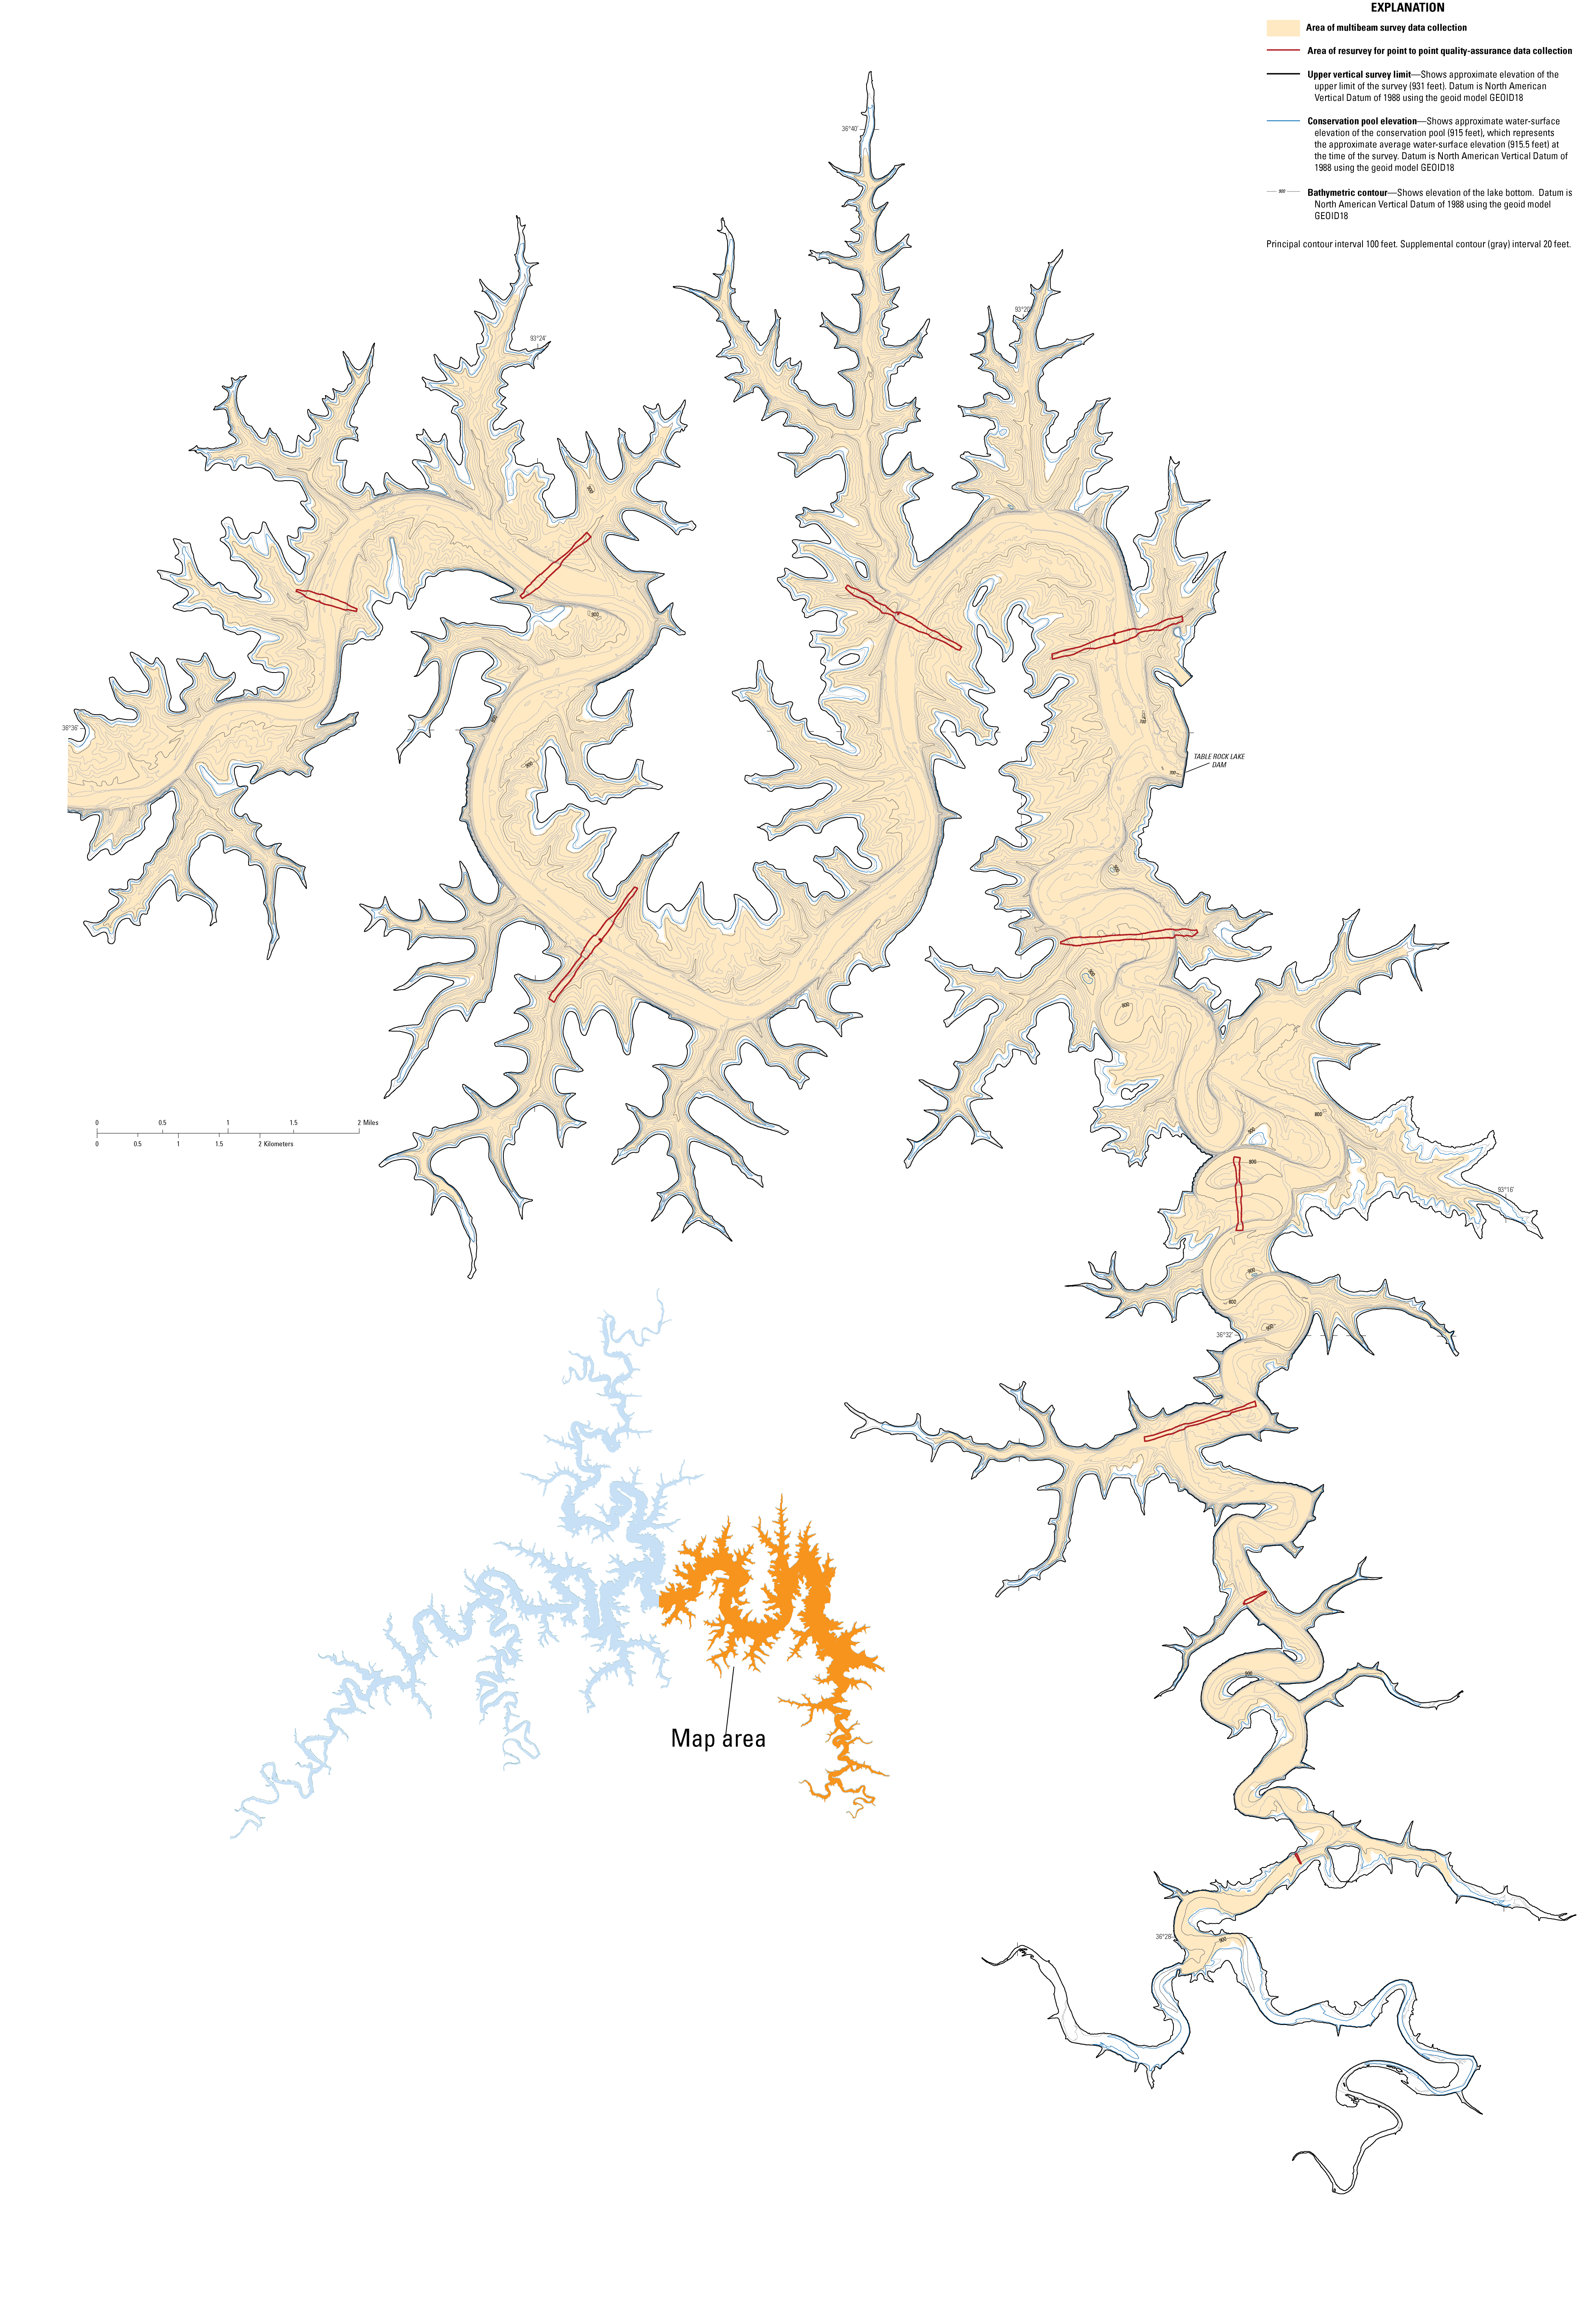

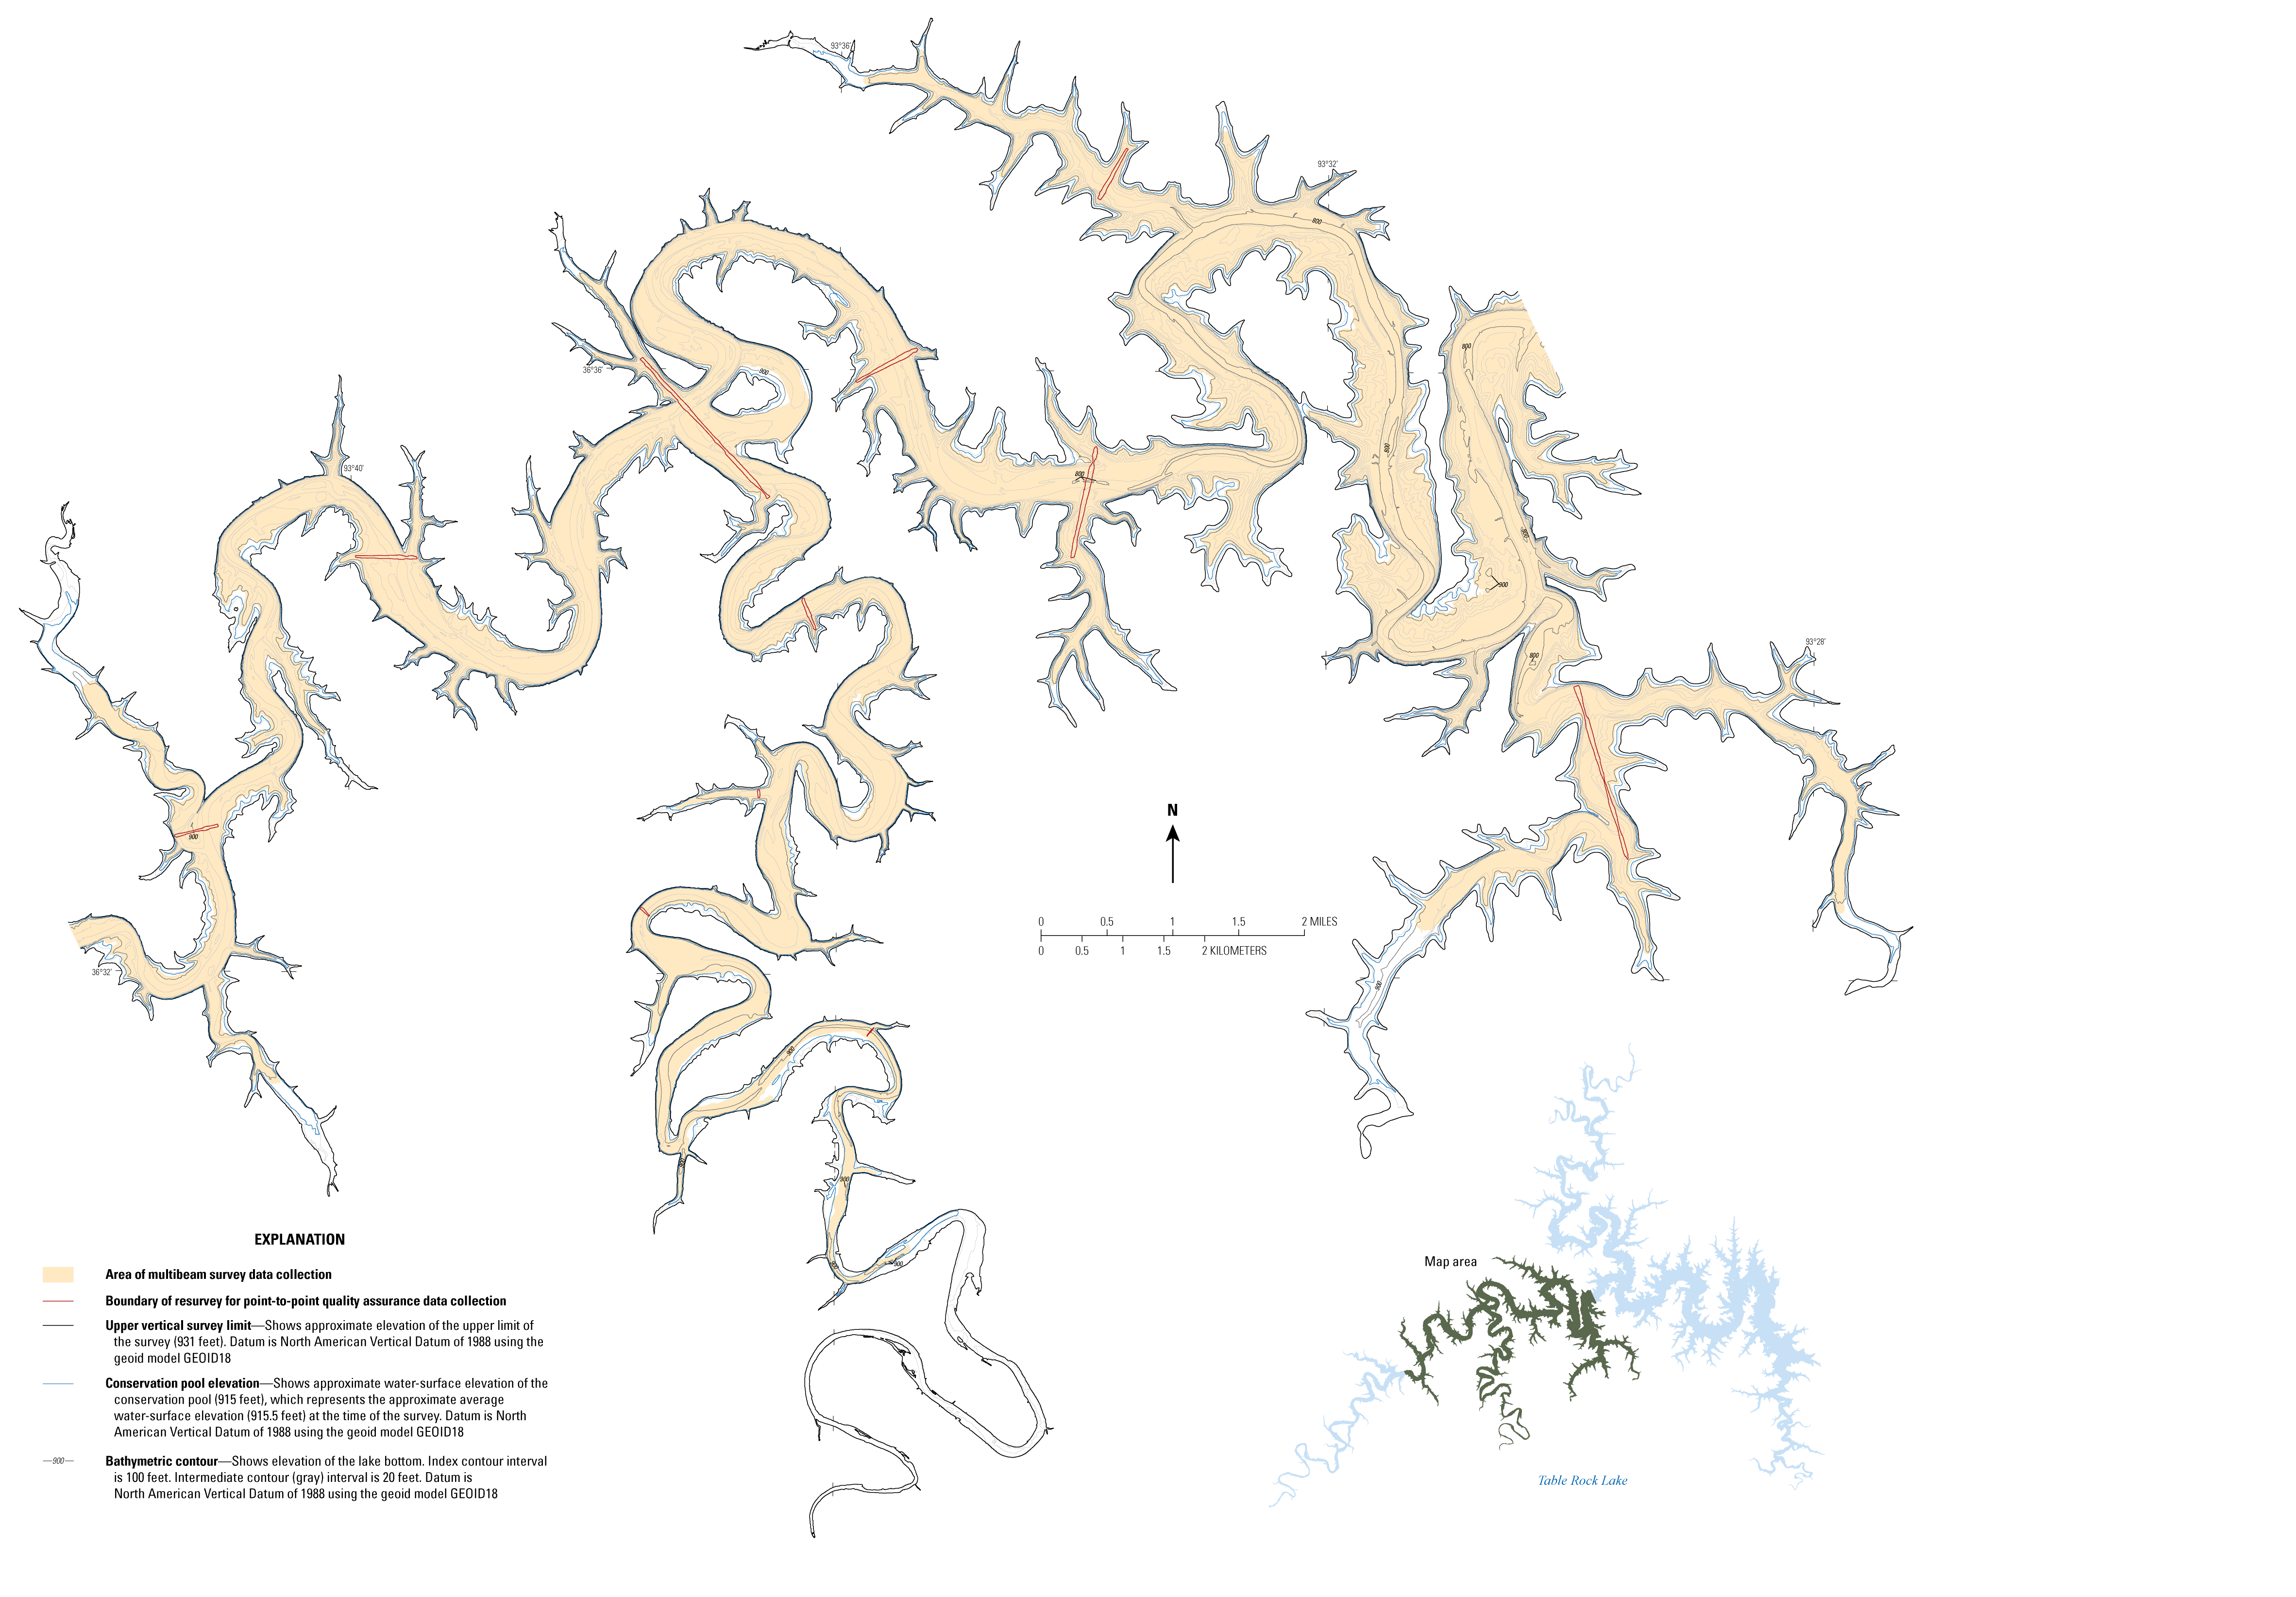
Bathymetric contours for Table Rock Lake near Branson, Missouri, resulting from a survey on October 13 to November 11, 2020.
An MBMS is an integration of several individual components—the MBES, an inertial navigation system (INS), and a data-collection and data-processing computer. The MBES systems used were the NORBIT iWBMSh, the NORBIT iWBMSc, and the R2Sonic 2024, all operated at a frequency of 400 kilohertz (NORBIT, 2020; R2Sonic LLC, 2014). The iWMBSh and R2Sonic 2024 are similar in performance and operation to the MBES systems used in previous studies in Missouri (Huizinga, 2010, 2022; Huizinga and others, 2010, 2022; Richards and others, 2019). The iWBMSc also is similar to systems used in previous studies but has a less accurate INS.
The NORBIT MBES systems have a curved receiver array that enables bathymetric data to be collected throughout a swath range of 210 degrees. Optimum data generally are collected in a swath of less than 160 degrees (80 degrees on each side of nadir, or straight down below the MBES); nevertheless, the swath can be electronically rotated to either left or right of nadir, enabling data to be captured along sloping banks up to a depth just below the water surface. The R2Sonic system has a flat receiver array and is limited to a swath range of 160 degrees (80 degrees on each side of nadir) but can be physically tilted to enable data to be collected along sloping banks. The INS—Applanix OceanMaster for the iWBMSh and R2Sonic (Applanix Corporation, 2017) and NovAtel MarineSPAN with OEM–STIM300 for the iWBMSc (NovAtel, 2021)—provides position in three-dimensional space and measures the heave, pitch, roll, and heading of the vessel (and, thereby, the MBES) to accurately position the data received by the MBES. Survey data were collected using HYPACK/HYSWEEP software (HYPACK, Inc., 2020).
Real-time navigation during the survey used a real-time kinematic differential global positioning system solution. The navigation information from the iWBMSh and R2Sonic systems was postprocessed using the POSPac Mobile Mapping Suite software (Applanix Corporation, 2021). The iWBMSc navigation information was postprocessed with the Waypoint Inertial Explorer software (NovAtel, 2019). POSPac Mobile Mapping Suite and Waypoint Inertial Explorer provide tools to identify and compensate for sensor and environmental errors. These programs compute an optimally blended navigation solution from the global navigation satellite systems (GNSSs) and inertial-measurement unit raw data from the INS. The location solution was further enhanced by collecting static GNSS data with a GNSS base receiver set up over a temporary reference mark near Table Rock Lake, the coordinates for which were determined using techniques detailed in Rydlund and Densmore (2012), corresponding to a Level I survey. The blended navigation solution (called a smoothed best estimate of trajectory, or SBET, file) generated by postprocessing the daily navigation data was applied to the corresponding daily survey data.
Most of the bathymetric survey data within Table Rock Lake were collected with the swath range limited to 140 degrees (70 degrees on each side of nadir); however, along the banks and in the shallow areas at the upstream ends of the lake arms, the swath range was widened to 160 degrees to cover a wider swath of the bottom. The receiver array also was electronically or physically tilted to port or starboard as needed to enhance acquisition of bathymetric data in the shallow areas near the shoreline, in coves, and in the upper reaches of the lake arms. The electronically tilted swath from the NORBIT systems was generally about 160 degrees wide, extending from about 10 degrees above horizontal on the landward side of the survey vessel to about 60 degrees past nadir below the vessel.
The bathymetric data generally were collected along longitudinal transect lines in the main lake area, following the dominant valley orientation. The transects were spaced to create about 10- to 25-percent overlap of the survey swaths to ensure complete coverage of the lake bottom and minimize sonic shadows. Data along the shoreline were collected by navigating the boat parallel to the shore while overlapping the data collected in the main body of the lake. Cove data were collected by navigating into a cove along the approximate centerline of the cove as far as practical (generally the point at which forward progress was blocked by vegetation or water depth decreased to less than about 10 ft [or 3.0 meters]), pivoting the boat 180 degrees, and egressing the cove along the ingress line.
The speed of sound in water needs to be known to accurately determine the depths acquired by an MBES. In a lake, the speed of sound in the water commonly varies in space and time. To mitigate variations in sound speed near the water surface, sound velocity data are collected at the MBES head continuously throughout the survey; however, the speed of sound also can vary over the water column because of water temperature variations with depth. Therefore, sound velocity profiles were measured with a sound velocity probe at various locations throughout each survey day and were applied during postprocessing in the HYPACK/HYSWEEP software.
Preparation for the bathymetric survey, data collection during the survey, and postprocessing were done in HYPACK/HYSWEEP software (HYPACK, Inc., 2020). During postprocessing, the data were georeferenced using the navigation and position solution data in the SBET file and visualized in HYPACK/HYSWEEP as a triangulated irregular network (TIN) surface or a point cloud. The acquired depth data were processed further to apply sound velocity profiles, to apply patch test corrections, and to remove data spikes and other spurious points, often caused by fish and submerged woody debris. The georeferenced point data were then filtered and reduced to a 6.56-ft (2-meter) data resolution and exported to a comma-delimited text file.
Bathymetric Surface and Contour Map Creation
About 38,000,000 data points, spaced 6.56-ft horizontally, were exported from the raw data collected during the 2020 survey (Rivers and others, 2022). For the survey, the vertical datum was the North American Vertical Datum of 1988 using the geoid model GEOID18, and the horizontal datum was the North American Datum of 1983. Geographic information system (GIS) software was used to filter the 6.56-ft spaced bathymetric data points so that the points would be spaced about 19.7 ft (6 meters) apart. The data reduction retained about 4,370,000 surveyed data points from the 2020 MBES survey.
Data outside the MBES survey extent (fig. 2) and between about 915 and 940 ft in elevation (hereinafter referred to as “upland data”) were obtained from the USGS National Elevation Dataset (U.S. Geological Survey, 2017). The upland data were sourced from USGS 1/3 arc-second DEM data and, where present, lidar data collected in 2010 and 2017 were combined and resampled to a 19.7-ft (6-meter) spacing. About 1,710,000 upland data points were used.
In addition to the MBES and upland data, additional data in bathymetric surface analyses were developed using the linear enforcement techniques described in Wilson and Richards (2006). About 208,000 points were created based on surrounding MBES, DEM, and lidar data values to anchor the bathymetric surface in areas of sparse data along some shoreline areas and in the upper ends of coves where the water was too shallow for the MBES equipment.
The MBES, DEM, lidar, and linearly enforced point datasets (a total of about 6,290,000 points) were used to produce a three-dimensional TIN surface (also referred to as a “bathymetric surface”) of the lake-bottom elevations. A surface area and capacity table at specified lake water-surface elevations was produced from the three-dimensional TIN surface (table 1). The surface was contoured at a 20-ft interval using GIS software, and the contours were cartographically smoothed and edited to create a bathymetric contour map (fig. 2) using the techniques of Wilson and Richards (2006).
Bathymetric Data-Collection Quality Assurance
The principal quality-assurance measures for the MBMS were assessed in real time during the survey. The MBMS operator continuously assessed the quality of the data collected during the survey by making observations of across-track swaths (such as convex, concave, or skewed bed returns in flat, smooth bottoms), noting data-quality flags and alarms from the MBES and the INS, and inspecting comparisons between adjacent overlapping swaths. In addition to the real-time quality-assurance assessments during the survey, a suite of patch tests was done for each MBMS during the survey to ensure that quality data were acquired from the MBMS. Beam-angle checks also were done for each MBMS.
Patch Tests
Patch tests are a series of dynamic calibration tests that are used to check for subtle variations in the orientation and timing of the MBES with respect to the INS and real-world coordinates. The patch tests are used to determine timing offsets caused by latency between the MBES and the INS and angular offsets to roll, pitch, and yaw caused by the alignment of the transducer head (Huizinga and others, 2010). These offsets have been observed to be essentially constant for a given survey, barring an event that causes the mount to change such as striking a floating or submerged object (see Huizinga, 2022). The offsets determined in the patch test are applied when processing the data collected during a survey. Patch tests were completed for each MBMS at various times during the Table Rock Lake survey, and angular offsets were determined to be constant for a given system throughout the survey and entered in the data-collection software as appropriate. This study did not have any measured timing offsets for any system, which is consistent with latency test results for survey boats and for similar equipment configurations used in other surveys (Huizinga, 2010, 2022; Huizinga and others, 2010, 2022).
Beam-Angle Checks
A beam-angle check is used to determine the accuracy of the depth readings obtained by the outer beams (greater than 25 degrees from nadir) of the MBES (U.S. Army Corps of Engineers, 2013). The accuracy of the outer beams may change with time because of inaccurate sound velocities, physical configuration changes, and water depth. A beam-angle check was done for each MBMS during the survey; the R2Sonic system check was done on October 13, 2020; the Missouri iWBMSh system check was done on October 21, 2020; the Oklahoma iWBMSh system check was done on November 10, 2020; and the iWBMSc system check was done on November 11, 2020. Each test included a sound velocity cast to document and quantify any stratification in the water column near the reference surface. The results of the R2Sonic beam-angle check were within the recommended performance standards used by the U.S. Army Corps of Engineers for hydrographic surveys for all the representative angles less than 70 degrees (U.S. Army Corps of Engineers, 2013); therefore, the central 140 degrees of the echosounder swath for that system could be used with confidence. The results of the Missouri iWBMSh beam-angle check were determined to be outside the recommended performance standards used by the U.S. Army Corps of Engineers for hydrographic surveys for all the representative angles because the depth of the beam-angle check area was substantially deeper than the recommended depth of 100 ft in the standards. However, a beam-angle check for the Missouri iWBMSh system had been done on June 23, 2020, at Mozingo Lake near Maryville, Mo. (not shown; Huizinga and others, 2022), with depths of less than 100 ft, and the results of that beam-angle check were within the recommended performance standards for all the representative angles less than 70 degrees, permitting the use of the central 140 degrees of the echosounder swath with confidence. The results of the Oklahoma iWBMSh system and the iWBMSc system checks were determined to be within the recommended performance standards for all the representative angles less than 55 degrees, permitting the use of the central 110 degrees of the echosounder swath with confidence for these systems. Points acquired outside of the central 100–110 degrees of the echosounder swath (regardless of the system) generally had overlap with adjacent swaths, which increases the quality of the survey in the overlapped areas because of duplication.
Uncertainty Estimation
Similar to the previous studies of bathymetry in Missouri (Huizinga, 2010, 2022; Richards and others, 2019), uncertainty in the multibeam survey was estimated for each 6.56-ft survey-grid cell in the surveyed area using the Combined Uncertainty and Bathymetry Estimator (CUBE) method (Calder and Mayer, 2003) as implemented in the MBMax processing package of the HYPACK/HYSWEEP software (HYPACK, Inc. 2020). The CUBE uncertainty is a measure of the variability of the individual points in the cell used to determine the CUBE-derived elevation for the cell. The CUBE uncertainty data were output and combined with the three-dimensional bathymetric data and are included with metadata in the USGS data release associated with this study (Rivers and others, 2022).
Most of the uncertainty values (more than 95 percent) were less than 0.60 ft, which is within the specifications for a “special order” survey, the most stringent survey standard of the International Hydrographic Organization (International Hydrographic Organization, 2020). The median uncertainty value of the data was about 0.10 ft, and the mean value was about 0.29 ft. The largest uncertainty in this survey was about 65.6 ft; however, uncertainty values of this magnitude typically are near high-relief features—near vertical surfaces such as bridge abutments or submerged cliffs that may exist on some parts of Table Rock Lake (figs. 2 and 3). The uncertainty values were larger near moderate-relief features (steep banks and submerged channels and ridges; figs. 2 and 3). The uncertainty values also were larger in the outermost beam extents of the MBES swath in the overlap with an adjacent swath, particularly when the swath was tilted for the survey lines along the banks or widened in the upper extent of the lake (fig. 3).
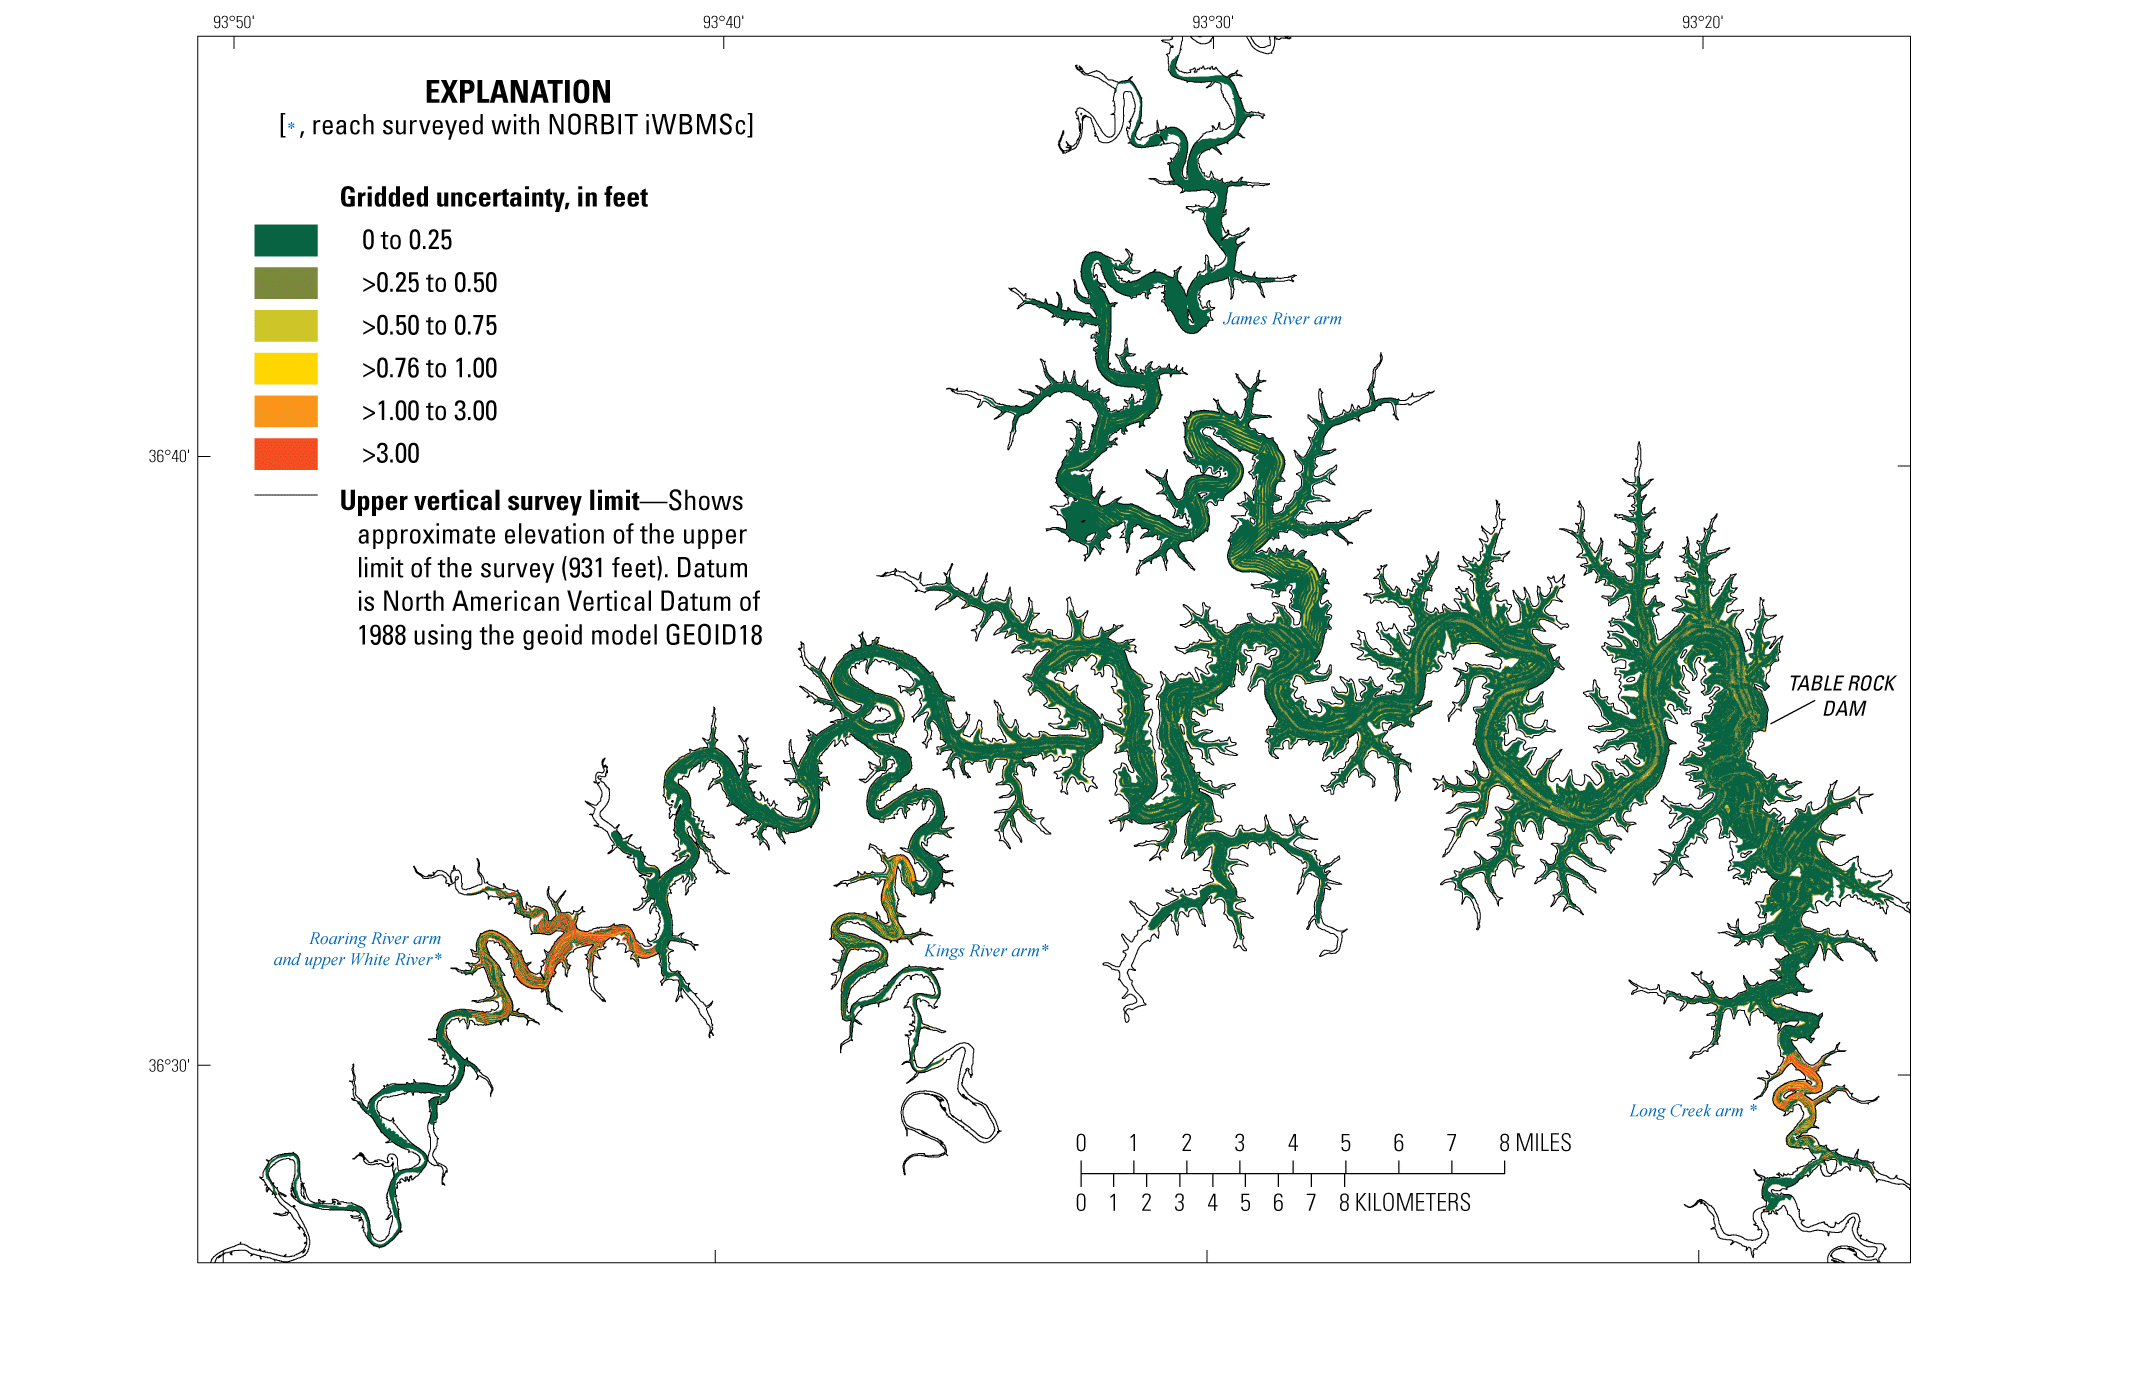
Gridded uncertainty of bathymetric data from the survey of Table Rock Lake near Branson, Missouri, 2020.
The less accurate INS of the NORBIT iWBMSc system also resulted in larger uncertainties. The iWBMSc was used in shallower survey areas because the INS is less sensitive to movement, resulting in larger error and uncertainty in deeper water. Therefore, larger uncertainties are apparent in areas with greater depth where the iWBMSc system was used on the upper end of the Long Creek arm south of the Arkansas State line (figs. 1 and 3), the upper end of the Kings River arm (figs. 1 and 3), and a part of the upper White River near the Roaring River and on the Roaring River arm (figs. 1 and 3).
The James River arm (fig. 1) was surveyed with the Oklahoma NORBIT iWBMSh system, which is exactly like the Missouri NORBIT iWBMSh system used on the White River in the main body of the lake; however, the gridded CUBE uncertainties for the James River arm were about two orders of magnitude (100 times) larger than the uncertainties on the White River near the James River arm. The MBES instrument settings, data-collection methods, and data-processing methods were the same as for the main body of the lake, so the substantially larger uncertainties were deemed erroneous. The computed uncertainties for the James River arm were divided by 100 to bring them into better agreement with the neighboring White River data (fig. 3). The points with adjusted uncertainties are flagged with “100” (original uncertainty value divided by 100) whereas the points with unadjusted uncertainties are flagged with “1” (uncertainty divided by 1, or unchanged) in the bathymetric data in the USGS data release associated with this study (Rivers and others, 2022). Some residual larger uncertainties are nonetheless evident in the James River arm (fig. 3). The mean and median uncertainty values reported earlier in this section use the adjusted uncertainties on the James River arm.
Bathymetric Surface and Contour Quality Assurance
Accuracy of the bathymetric surface and contours is a function of the survey data accuracy, the density of the survey data, and the processing steps involved in the surface and contour creation. The process of data reduction to obtain the 6.56-ft gridded dataset from the raw survey data likely degraded the accuracy of the 6.56-ft gridded dataset relative to the raw data. To collect a dataset (hereinafter referred to as a “cross-check line”) that could be used to estimate the accuracy of the 6.56-ft gridded dataset, 42 areas of Table Rock Lake were resurveyed after the main survey, generally in a direction 45 to 90 degrees to the main body survey (fig. 2). The 42 cross-check lines had a combined total of about 29,000,000 raw survey points (Rivers and others, 2022). Raw points in the cross-check lines that were within a horizontal distance of 0.16 ft of a 6.56-ft gridded point were selected as cross-check quality-assurance data points, and the elevation values of these cross-check line points were compared to the 6.56-ft gridded points. About 63,000 selected raw points were compared to 6.56-ft gridded points, and the data tested at a vertical accuracy of 1.26 ft at a 95-percent confidence level; the median absolute vertical error was about 0.16 ft (Rivers and others, 2022). Although the point-to-point comparison is not an exact measure of bathymetric survey repeatability, the cross-check line vertical accuracy, as calculated here, represents the degradation of vertical accuracy introduced when converting the raw MBES data to a 6.56-ft set of gridded data using the CUBE method for this survey at this lake.
The vertical accuracy and median absolute vertical error also were calculated for the bathymetric surface, which was used to calculate the surface area and capacity values in table 1 and to generate the bathymetric contour map (fig. 2). The mapping quality-assurance dataset used to evaluate the bathymetric surface included about 700,000 data points selected at random from the about 38 million 6.56-ft data points (Rivers and others, 2022). Points that were used to create the bathymetric surface were not included as quality-assurance points. The three-dimensional bathymetric surface was tested against the quality-assurance dataset to determine the vertical accuracy of the surface using methods described in Wilson and Richards (2006). The surface tested at a vertical accuracy of 1.44 ft at the 95-percent confidence level; the median absolute vertical error was 0.10 ft. A map of the vertical accuracy of the bathymetric surface is shown in figure 4.
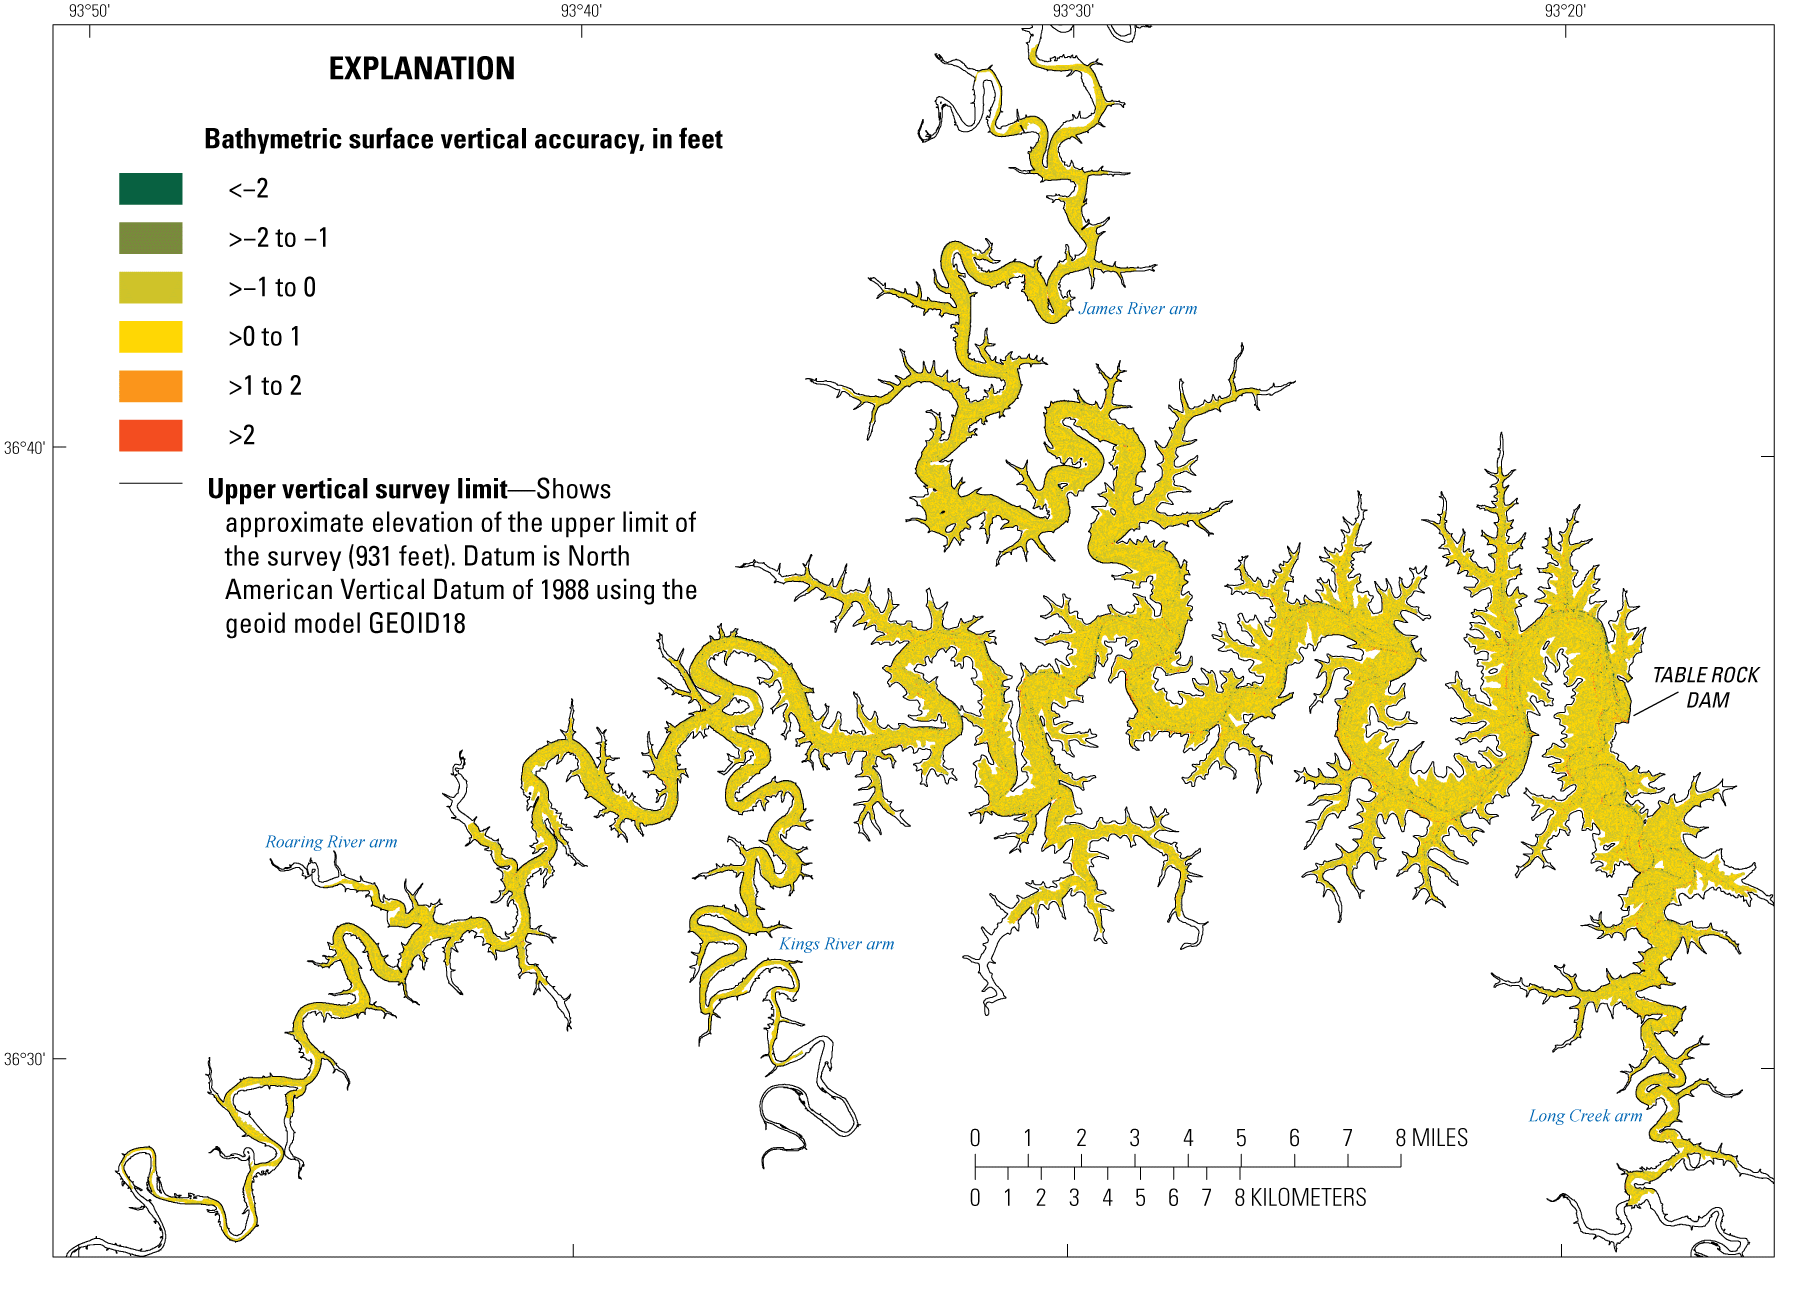
Vertical accuracy of the bathymetric surface of Table Rock Lake near Branson, Missouri.
The process of smoothing and cartographic editing of the bathymetric contours to produce an aesthetic map degrades the positional and vertical accuracy of the contours; however, the contours are used primarily for visualization of the surface in an illustration, so some accuracy degradation is expected. The bathymetric contours (fig. 2) were tested with the dataset used to create the bathymetric surface (Rivers and others, 2022). A point was considered a contour elevation evaluation point if the point was within a horizontal distance of 0.82 ft of a given contour line. Of the nearly 4,370,000 bathymetric surface mapping points, about 72,500 points were selected as evaluation points for the contour lines, and the contour vertical accuracy was computed to be 3.37 ft at the 95-percent confidence level; the median absolute vertical error was about 0.34 ft.
Bathymetry and Surface Area and Capacity
The bathymetric surface TIN was used to produce a bathymetric contour map (fig. 2). The meandering form of the submerged White River channel is clearly visible throughout Table Rock Lake (fig. 2). Submerged channels of several tributaries also were evident in some areas. A surface area and capacity table (table 1) was computed from the bathymetric surface TIN. At the conservation pool elevation of 915 ft, the surface area of the lake was about 42,400 acres and the capacity was about 2,640,000 acre-feet (table 1). At the flood pool elevation of 931 ft, the surface area of the lake was about 52,000 acres and the capacity was about 3,390,000 acre-feet (table 1).
Acknowledgments
The data collection and processing of the survey information for Table Rock Lake was a large group effort, and the authors wish to gratefully acknowledge colleagues at the U.S. Geological Survey Central Midwest, Lower Mississippi-Gulf, and Oklahoma-Texas Water Science Centers for their assistance in collecting and processing the data for this project. Daniel V. Grant, David J. Fazio, Evan M. Lindroth, and Aaron L. Walsh from the Central Midwest Water Science Center; Kevin M. Hubbs and Amanda R. Whaling from the Lower Mississippi-Gulf Water Science Center; and Stephen C. Bradford, Kyle R. Cothren, Shelby L. Hunter, Marty L. Phillips, Kevin A. Smith, and Zachary S. Bordovsky (former employee) from the Oklahoma-Texas Water Science Center helped collect the data for the surveys detailed in this report. Amanda R. Whaling and Kevin A. Smith also were instrumental in preliminary processing of the survey data.
References Cited
Applanix Corporation, 2017, POS MV OceanMaster specifications: Richmond Hill, Ontario, Canada, Applanix Corporation, 2 p., accessed June 28, 2022, at https://www.applanix.com/downloads/products/specs/posmv/POSMV_OCEANMASTER.pdf.
Calder, B.R., and Mayer, L.A., 2003, Automatic processing of high-rate, high-density multibeam echosounder data: Geochemistry, Geophysics, Geosystems (G3), v. 4, no. 6, 22 p. [Also available at https://doi.org/10.1029/2002GC000486.]
Huizinga, R.J., 2010, Bathymetric surveys at highway bridges crossing the Missouri River in Kansas City, Missouri, using a multibeam echo sounder, 2010: U.S. Geological Survey Scientific Investigations Report 2010–5207, 61 p., accessed August 29, 2022, at https://doi.org/10.3133/sir20105207.
Huizinga, R.J., 2022, Bathymetric and velocimetric surveys at highway bridges crossing the Missouri River near Kansas City, Missouri, August 2019, August 2020, and October 2020: U.S. Geological Survey Scientific Investigations Report 2021–5098, 112 p., accessed August 29, 2022, at https://doi.org/10.3133/sir20215098.
Huizinga, R.J., Elliott, C.M., and Jacobson, R.B., 2010, Bathymetric and velocimetric survey and assessment of habitat for pallid sturgeon on the Mississippi River in the vicinity of the proposed Interstate 70 Bridge at St. Louis, Missouri: U.S. Geological Survey Scientific Investigations Report 2010–5017, 28 p., accessed August 29, 2022, at https://doi.org/10.3133/sir20105017.
Huizinga, R.J., Oyler, L.D., and Rivers, B.C., 2022, Bathymetric contour maps, surface area and capacity tables, and bathymetric change maps for selected water-supply lakes in northwestern Missouri, 2019 and 2020: U.S. Geological Survey Scientific Investigations Map 3486, 12 sheets, includes 21-p. pamphlet, accessed August 29, 2022, at https://doi.org/10.3133/sim3486.
HYPACK, Inc., 2020, HYPACK user manual: Middletown, Conn., HYPACK, Inc., 2,602 p., accessed June 28, 2022, at https://www.hypack.com/File%20Library/Resource%20Library/Manuals/2020/2020-HYPACK-User-Manual.pdf.
International Hydrographic Organization, 2020, International Hydrographic Organization standards for hydrographic surveys (6th ed.): Monaco, International Hydrographic Bureau, Special publication no. 44, 41 p., accessed January 2022 at https://iho.int/uploads/user/pubs/standards/s-44/S-44_Edition_6.0.0_EN.pdf.
NovAtel, 2019, Inertial Explorer 8.80 user manual, ver. 7: Calgary, Alberta, Canada, OM–20000166, 216 p., accessed June 28, 2022, at https://hexagondownloads.blob.core.windows.net/public/Novatel/assets/Documents/Manuals/Waypoint-Software-User-Manual-OM-20000166/Waypoint_8.80_Software_User_Manual_OM-20000166.pdf.
NovAtel, 2021, OEM–IMU–STIM300 product sheet: Calgary, Alberta, Canada, 2 p., accessed June 28, 2022, at https://hexagondownloads.blob.core.windows.net/public/Novatel/assets/Documents/Papers/OEM-STIM300-PS/OEM-STIM300-PS.pdf.
Richards, J.M., Huizinga, R.J., and Ellis, J.T., 2019, Bathymetric contour map, surface area and capacity table, and bathymetric change map for Sugar Creek Lake near Moberly, Missouri, 2018: U.S. Geological Survey Scientific Investigations Map 3431, 1 sheet, accessed August 29, 2022, at https://doi.org/10.3133/sim3431.
Rydlund, P.H., Jr., and Densmore, B.K., 2012, Methods of practice and guidelines for using survey-grade global navigation satellite systems (GNSS) to establish vertical datum in the United States Geological Survey: U.S. Geological Survey Techniques and Methods, book 11, chap. D1, 102 p., with appendixes. [Also available at https://doi.org/10.3133/tm11D1.]
U.S. Army Corps of Engineers, 2013, Engineering and design—Hydrographic surveying: Washington D.C., U.S. Army Corps of Engineers, manual no. EM 1110–2–1003, 560 p. [Also available at https://www.publications.usace.army.mil/Portals/76/Publications/EngineerManuals/EM_1110-2-1003.pdf?ver=gDGVUj_0XR2sXHilpQZv2Q%3d%3d.]
U.S. Army Corps of Engineers, 2022, Table Rock Lake / Dam and lake information: U.S. Army Corps of Engineers web page, accessed June 27, 2022, at https://www.swl.usace.army.mil/Missions/Recreation/Lakes/Table-Rock-Lake/Dam-and-Lake-Information/.
U.S. Geological Survey, 2017, Lidar Point Cloud—USGS National Map 3DEP downloadable data collection: U.S. Geological Survey digital data, accessed August 29, 2022, at https://www.sciencebase.gov/catalog/item/4f70ab64e4b058caae3f8def.
Wilson, G.L., and Richards, J.M., 2006, Procedural documentation and accuracy assessment of bathymetric maps and area/capacity tables for small reservoirs: U.S. Geological Survey Scientific Investigations Report 2006–5208, 24 p, accessed August 29, 2022, at https://doi.org/10.3133/sir20065208.
For more information about this publication, contact:
Director, USGS Central Midwest Water Science Center
1400 Independence Road
Rolla, MO 65401
573–308–3667
For additional information, visit: https://www.usgs.gov/centers/cm-water
Publishing support provided by the
Rolla Publishing Service Center
Suggested Citation
Huizinga, R.J., Rivers, B.C., and Richards, J.M., 2022, Bathymetric map and surface area and capacity table for Table Rock Lake near Branson, Missouri, 2020: U.S. Geological Survey Scientific Investigations Map 3499, 3 sheets, https://doi.org/10.3133/sim3499.
ISSN: 2329-132X (online)
Study Area
| Publication type | Report |
|---|---|
| Publication Subtype | USGS Numbered Series |
| Title | Bathymetric map and surface area and capacity table for Table Rock Lake near Branson, Missouri, 2020 |
| Series title | Scientific Investigations Map |
| Series number | 3499 |
| DOI | 10.3133/sim3499 |
| Year Published | 2022 |
| Language | English |
| Publisher | U.S. Geological Survey |
| Publisher location | Reston, VA |
| Contributing office(s) | Central Midwest Water Science Center |
| Description | 3 Sheets: 40.00 × 48.00 inches or smaller; Data Release |
| Country | United States |
| State | Missouri |
| City | Branson |
| Other Geospatial | Table Rock Lake |
| Online Only (Y/N) | Y |
| Google Analytic Metrics | Metrics page |