

The Water Quality of Selected Streams in the Catskill and Delaware Water-Supply Watersheds in New York, 1999–2009
Links
- Document: Report (6.70 MB pdf) , HTML , XML
- Download citation as: RIS | Dublin Core
Acknowledgments
This work was funded by the New York City Department of Environmental Protection, the U.S. Environmental Protection Agency’s Long-Term Monitoring Network, and the U.S. Geological Survey. Appreciation is extended to watershed residents who allowed streamgaging and water-quality sampling equipment to be located on their property.
Abstract
From October 1, 1999, through September 30, 2009, water-quality samples were collected, and discharge was measured at 13 streamgages within the Catskill and Delaware watersheds of the New York City water supply system. The Catskill and Delaware watersheds supply about 90 percent of the water needed by 9 million customers. On average, 59 water-quality samples were collected at each station during each year of the study and analyzed for major ions and nutrients. At six stations, suspended-sediment samples were collected during 2001–09, and turbidity samples were collected during 2003–09. Surficial geology exerted a strong influence on the water quality of streams in the region. Stations in the Cannonsville Reservoir watershed, which has a high percentage of glacial till, had circumneutral stream water, whereas stations in the Neversink Reservoir watershed, which has a high percentage of sedimentary bedrock outcrops, had acidic stream water. All stations showed significant decreases in stream water sulfate concentrations during the study period; however, only the most acidic watersheds showed decreases in hydrogen-ion concentration. Two of the most acidic stations, East Branch Neversink River northeast of Denning and Rondout Creek above Red Brook at Peekamoose also had significant decreasing trends in inorganic monomeric aluminum concentrations, a form of aluminum that is toxic to some aquatic biota at concentrations greater than 0.05 milligram per liter. Three stations in the Neversink Reservoir watershed had inorganic monomeric aluminum concentrations that commonly exceeded 0.05 milligram per liter during the study period. At the West Branch Neversink River at Winnisook Lake near Frost Valley station concentrations of inorganic monomeric aluminum exceeded 0.3 milligram per liter at the beginning of the study, but never exceeded that level during the last 2 water years of the study. The East Branch Neversink River northeast of Denning and Rondout Creek above Red Brook at Peekamoose stations also showed decreases in inorganic monomeric aluminum concentrations during the study. The reduction in inorganic monomeric aluminum concentrations were the result of reductions in stream acidity. The reductions in stream acidity were driven by reductions in sulfate concentrations in precipitation in response to emission regulations included in title IV of the Clean Air Act Amendments of 1990 (42 USC §7651).
Results indicated increasing trends in sodium and chloride concentrations for all stations with high road density relative to other stations included in the study, which could be a future water-quality concern in the region. The Town Brook watershed southeast of Hobart, the only study watershed that contained dairy farms, had a significant decreasing trend in total dissolved phosphorus concentration that may have been a result of agricultural best management practices implemented on farms by the Watershed Agricultural Program. The watershed with the second highest total phosphorus and total dissolved phosphorus concentrations was a completely forested, but previously agricultural, watershed (Town Brook tributary southeast of Hobart) that had not been actively farmed in about 80 years. The phosphorus concentrations at the Town Brook tributary southeast of Hobart station indicated that previously agricultural watersheds may continue to leach phosphorus to streams for many decades after farming has ceased.
At six of the study watersheds, samples of suspended-sediment and turbidity were also collected. The watersheds with the highest suspended-sediment concentrations and turbidity also had the strongest relations between discharge and suspended-sediment concentrations. In general, the relations between discharge and turbidity were not as strong as the relations between discharge and suspended-sediment concentrations. Results indicated strong relations between suspended-sediment concentrations and turbidity levels at each station; however, relations were less strong in the agricultural watersheds. Suspended-sediment concentrations appeared to decrease at the Stony Clove Creek below Ox Clove at Chichester station following a stream stabilization project completed during the study period. However, we were unable to directly attribute the decrease to the stabilization project; there were many complicating variables that made a direct attribution difficult, such as a series of large storms shortly after the stabilization project was completed and differences in flow conditions before and after the project. However, the results have led to additional monitoring within the watershed specifically designed to determine the effectiveness of stream stabilization projects for reducing suspended-sediment concentrations and turbidity in the upper Esopus Creek watershed, the primary source of water to the Ashokan Reservoir. Water quality in the Catskill and Delaware watersheds is generally improving, and although sodium and chloride concentrations increased at some of the stations from 1999 to 2009, the concentrations in 2009 were still well below U.S. Environmental Protection Agency drinking water standards.
Introduction
The New York City water supply system provides daily drinking water to 9 million customers (New York City Department of Environmental Protection, 2020). Approximately 90 percent of the water is supplied by the Catskill and Delaware watersheds which includes six surface-water reservoirs in the Catskill Mountains in southeastern New York (fig. 1). The Catskill and Delaware watersheds are two of only a few of their size in the United States to provide drinking water from an unfiltered surface-water source (Pires, 2004). The New York City Department of Environmental Protection (NYCDEP) has obtained a series of filtration avoidance determinations from the U.S. Environmental Protection Agency (EPA) and the New York State Department of Health, the most recent renewal issued in December 2017 (New York State Department of Health, 2017). The initial filtration avoidance determination was issued in 1997 as a memorandum of understanding between New York City, New York State, the EPA, numerous local governments, and environmental organizations and laid out a watershed management plan that is the basis for continued filtration avoidance (Pires, 2004). The primary objectives of the watershed management plan were land acquisition, water supply rules and regulations, and watershed protection and partnership programs.
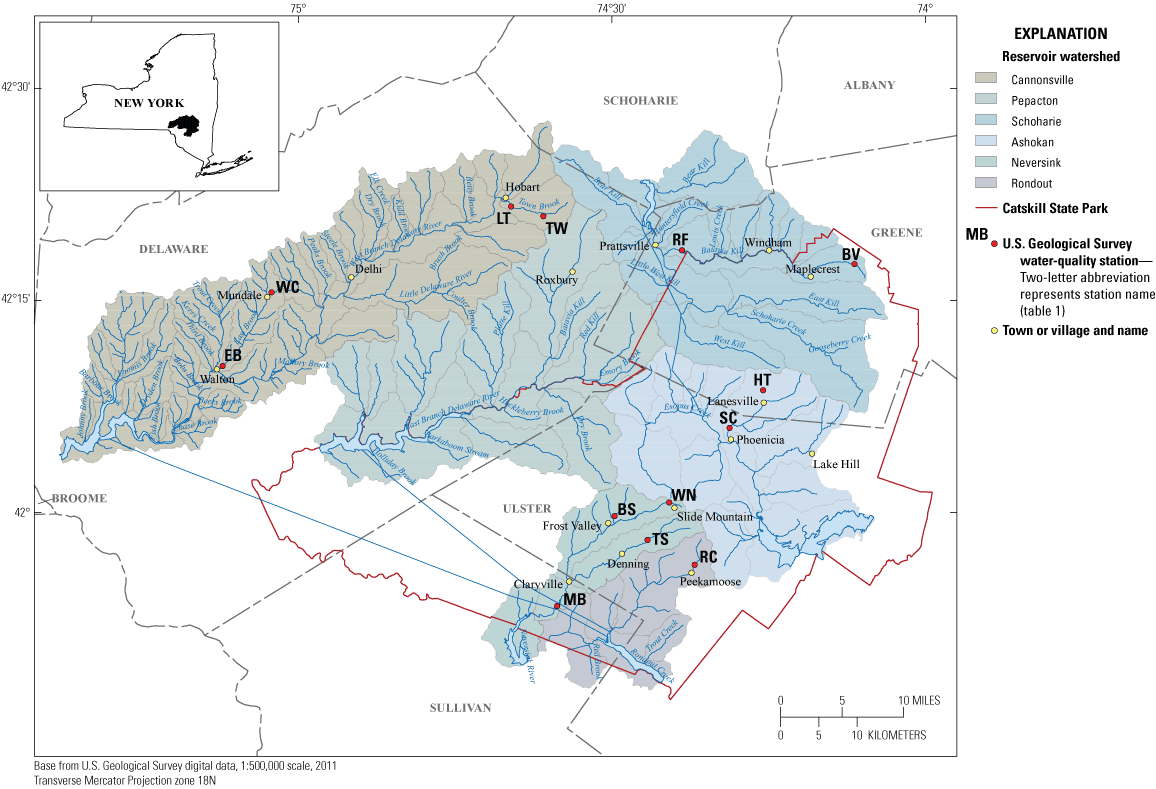
Water-quality stations on selected streams in the Catskill and Delaware watersheds in New York.
The watershed protection and partnership programs include whole farm plans and forest management plans enacted by private landowners with assistance from the Watershed Agricultural Council. The plans include best management practices that are aimed at reducing water-quality degradation from agriculture and timber harvesting. More than 90 percent of eligible farms in the Delaware watershed part of the Catskill and Delaware watersheds participate in an agricultural best management practices program (Kratzer and others, 2006).
A key to maintaining high quality water in the Catskill and Delaware watersheds is the relation between water quality and land use and land cover (referred to as land use for the purposes of this report) in the watersheds that drain into the Catskill and Delaware water-supply reservoirs. A better understanding of the relation between water quality and land use will help land managers implement the watershed management plan.
Water quality in the Catskill and Delaware watersheds is affected by the percentage of agricultural and developed land use in the watersheds (Mehaffey and others, 2005; Dow and others, 2006; Kratzer and others, 2006). Nutrient concentrations in streams have a significant positive relation with the percentage of agricultural land use, and chloride and potassium have a significant positive relation with the percentage of agricultural and developed land use (Mehaffey and others, 2005; Dow and others, 2006). As the percentage of agriculture in the watersheds has decreased over time, by approximately 5 percent between the mid-1970s and late 1990s, the influence of agriculture on water quality has also lessened (Mehaffey and others, 2005). The remaining agricultural land tends to be concentrated along stream channels in the Catskill and Delaware watersheds, as are developed areas (Arscott and others, 2006).
Streams draining forested watersheds tend to have lower nutrient and major-ion concentrations than streams draining agricultural or developed land use but are not immune to water-quality degradation from human activities. Streams in the Neversink watershed (fig. 1) are episodically and chronically acidic, with elevated nitrate and inorganic monomeric aluminum concentrations caused by long-term inputs of acidic deposition (Lawrence, 2002). In addition, nitrate export from forested watersheds is associated with variation in tree species composition (Lovett and others, 2002). For example, forests dominated by sugar maple (Acer saccharum) leach more nitrate than forests dominated by northern red oak (Quercus rubra) or red maple (Acer rubrum).
Suspended-sediment concentrations (SSC) and turbidity levels are also water-quality concerns within the Catskill and Delaware watersheds. Agricultural land use, glacial lacustrine deposits, and bedrock type are all potential sources of suspended sediment and turbidity to streams. Bank erosion in streams that contact glacial lacustrine deposits can account for 60 percent of the sediment load of those streams, and watersheds underlain by shale bedrock tend to have higher bank erosion rates than those underlain by sandstone bedrock (Nagle and others, 2007).
Previous studies of water-quality and land use relations in the Catskill and Delaware water supply system focused on base-flow sampling and short-term sampling surveys. This study employed a sampling strategy that targeted sampling during all seasons and through the range in discharge at each sampling station. Samples were collected at fewer stations than in previous short-term sampling surveys in the region (Dow and others, 2006; Kratzer and others, 2006); however, sampling was more frequent and for a much longer period (13 stations for a period of 10 years). These data can be used to investigate patterns in stream solute concentrations among sampling stations, the influence of land use on water quality, and trends in water quality caused by changes in atmospheric deposition, climate, and land use.
The purpose of this study was to evaluate water chemistry data from the Catskill and Delaware water-quality network during October 1, 1999, through September 30, 2009 (water years1 1999 through 2009). The study objectives were to:
A water year is the 12-month period from October 1 through September 30 and is designated by the year in which it ends.
-
evaluate the effects of land use on the water quality of streams in the network.
-
identify potential sources of stream water-quality impairment.
-
quantify trends in water quality throughout the network.
-
quantify SSC and turbidity levels at six water-quality and streamflow stations in the Catskill and Delaware watersheds.
-
evaluate the relations between turbidity and SSC at each station.
Catskill and Delaware Water-Quality Network Description
In the mid-1990s, the U.S. Geological Survey (USGS), in cooperation with the NYCDEP and other agencies, operated a network of 40 streamgages throughout the New York City water supply system’s Catskill and Delaware watersheds. The network was used to quantify the amount and the timing of water entering the reservoirs. In 1997, 13 of the stations were selected for a water-quality network to provide water-quality data at locations throughout the Catskill and Delaware watersheds (table 1). The water-quality network used a nested design with small, forested watersheds (upper nodes) nested in larger multiple land-use watersheds (lower nodes). The effect of land use on water quality can be assessed by examining differences in water quality between the upper and lower nodes as affected by the intervening land use. The Rondout Creek above Red Creek at Peekamoose, N.Y. station (USGS station number 01364959) is a headwater upper node without a corresponding lower node. Water-quality stations were located in five of the six Catskill and Delaware reservoir watersheds (fig. 1). The period of record for water-quality sampling differed among the water-quality stations. Some stations had been sampled since the early 1980s or 1990s as part of the EPA’s Long-Term Monitoring Network, whereas the NYCDEP stations were added from 1997 to 1999. For the purposes of this report, a common period of record of October 1, 1999, through September 30, 2009, was used for all stations. Hydrologic and water-quality data for the 13 stations discussed in this report are available from the USGS National Water Information System (NWIS) database (U.S. Geological Survey, 2011). All percent land use and land cover values provided in this report are taken from the 2001 National Land Cover Database (Homer and others, 2007).
Table 1.
Characteristics for water-quality stations in or associated with the U.S. Geological Survey Catskill and Delaware water-quality network in the Catskill Mountains in New York.[Land use percentages were calculated using the 2001 National Land Use and Land Cover Database (Homer and others, 2007). In July 2007, the Stony Clove Creek near Phoenicia, N.Y. station (USGS streamgage 01362380) was moved upstream and renamed Stony Clove Creek below Ox Clove at Chichester, N.Y. (USGS streamgage 01362370); this revised name is used in this table. mi2, square mile; ft, foot]
Catskill and Delaware Watersheds
Bedrock in the Catskill region consists primarily of nearly flat-lying siltstone, shale, conglomerate, and sandstone and is relatively consistent in composition throughout the region (Rich, 1934; Arscott and others, 2006). Unconsolidated deposits include alluvial deposits, outwash and kame sand and gravel, glacial-lake silt and clay, and till (fig. 2; Rich, 1934; Nagle and others, 2007). Alluvial deposits, outwash, kame deposits, and till moraines primarily are along stream channels. Bedrock outcrops are most often in the southern part of the study area, and glacial till are in the western part. Soils are primarily moderately to highly acidic Inceptisols (Arscott and others, 2006).
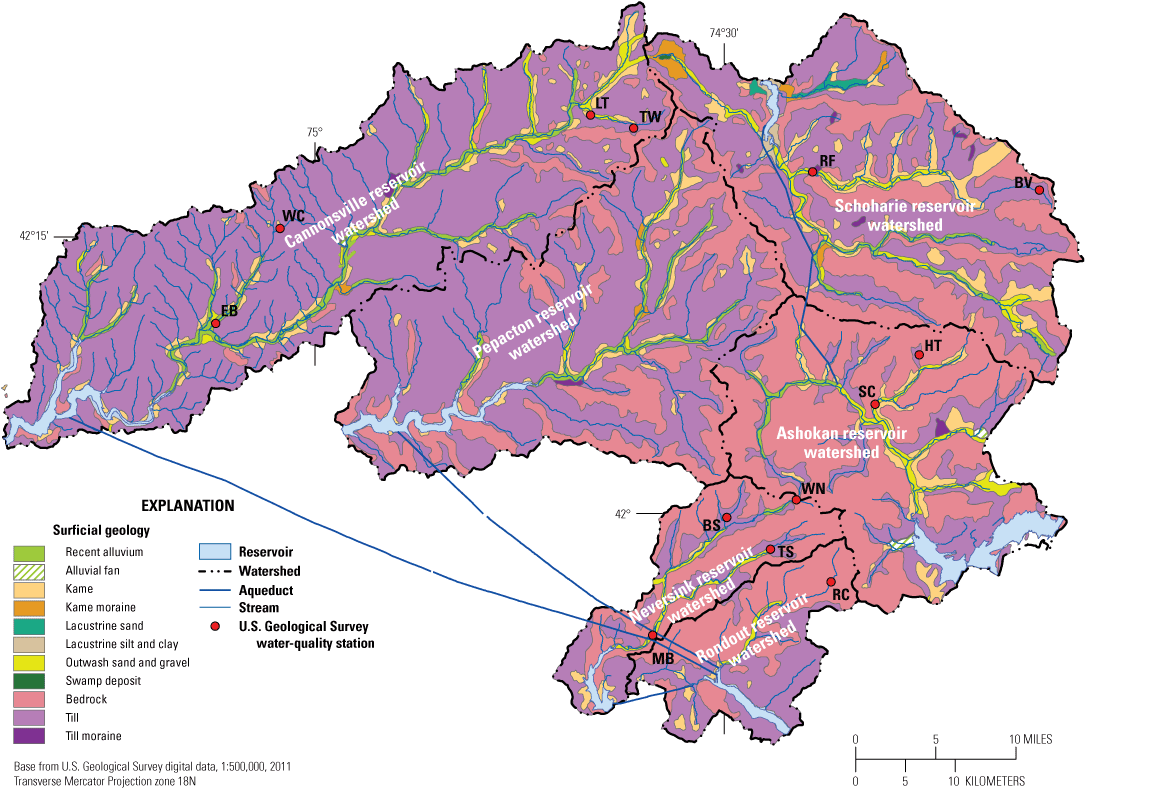
Surficial geology of the Catskill and Delaware watersheds in New York; modified from Cadwell (1989).
Prior to European settlement, the majority of the study area had been covered by mixed hardwood and hardwood-conifer forests (Arscott and others, 2006), but by the mid-1800s, up to 90 percent of the area had been cleared for agriculture (Kudish, 2000). When New York State began to acquire land in the late 1800s and the forest preserve was established in 1885, much of the cleared land was returned to forest (Kudish, 2000). In 2001, the Catskill and Delaware watersheds were approximately 85 percent forested (fig. 3). Mixed oak forests dominated by northern red oak were the primary forest type at elevations below 1,640 feet (ft; Lovett and others, 2000). The midlevel elevations (1,640 to 3,445 ft) were dominated by northern hardwoods such as sugar maple, yellow birch (Betula alleghaniensis), red maple, American beech (Fagus grandifolia), black cherry (Prunus serotina), and some eastern hemlock (Tsuga canadensis) stands. Ridge tops at elevations greater than 3,445 ft were dominated (Lovett and others, 2000) by balsam fir (Abies balsamea), red spruce, and interspersed with paper birch (Betula papyrifera). Small areas of first growth forest primarily were located at high elevations or in deep gorges in the headwaters of the Ashokan Reservoir, Neversink Reservoir, and Schoharie Reservoir watersheds (Kudish, 2000).
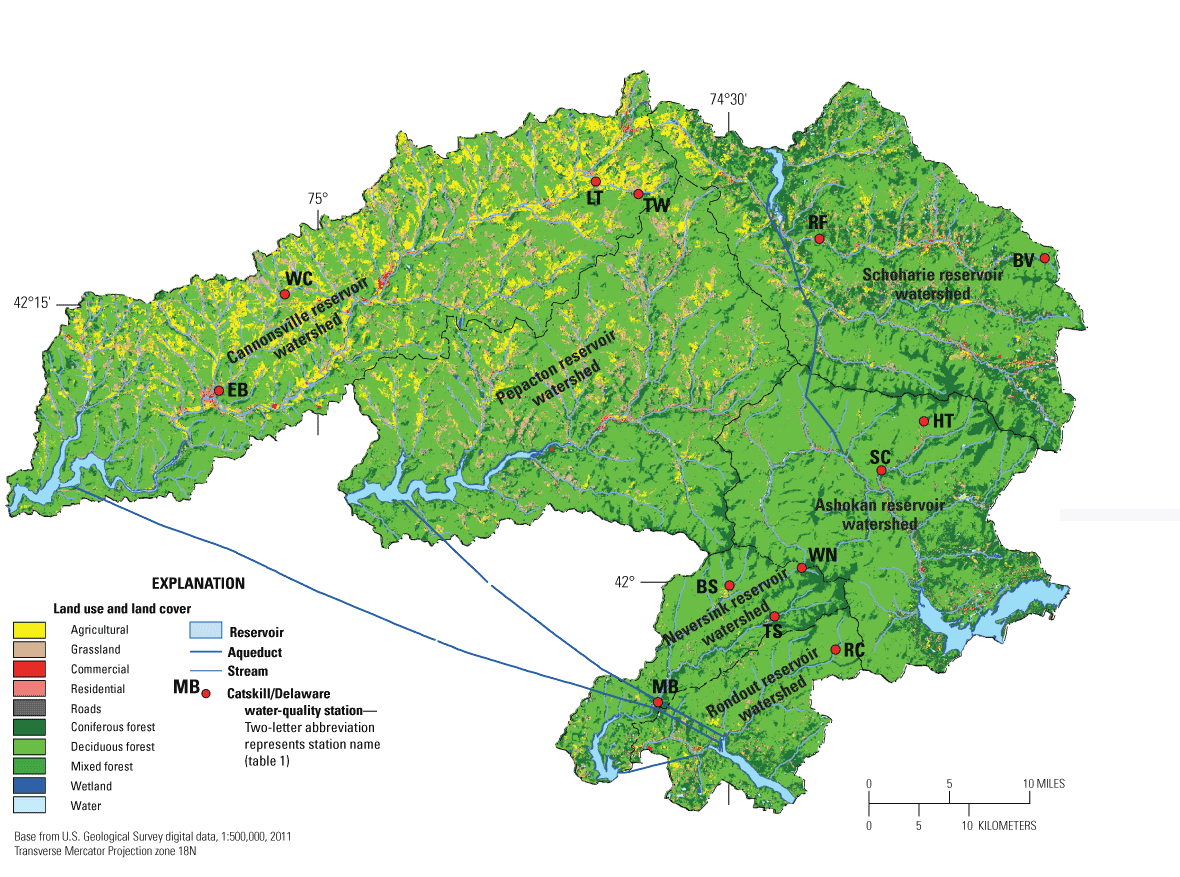
Land use and land cover in the Catskill and Delaware watersheds in New York in 2001; data from Homer and others (2007).
Schoharie Reservoir Watershed
Two water-quality stations were on Batavia Kill that drains to Schoharie Creek about 3 miles (mi) upstream from the Schoharie Reservoir (fig. 1; table 1). The lower node station was Batavia Kill at Red Falls near Prattsville, N.Y. (USGS station number 01349950, abbreviation RF), and the corresponding upper node station was Batavia Kill near Maplecrest, N.Y. (USGS station number 01349840, abbreviation BV). For the purposes of this report, the Batavia Kill at Red Falls near Prattsville, N.Y. station will be referred to as the Red Falls station, and the Batavia Kill near Maplecrest, N.Y. station will be referred to as the Batavia Kill station.
The Red Falls station, which began operation in October 1997, is in Greene County, 2.2 mi southeast of Prattsville (fig. 1). The Batavia Kill at Red Falls watershed ranges in elevation from approximately 1,260 to 4,000 ft and covers 68.6 square miles (mi2). The watershed is 85 percent forested, of which 52 percent is deciduous, 26 percent is coniferous, and 7 percent is mixed forest types (fig. 3; table 1). Agricultural land accounts for 6 percent of the total land use within the watershed and consists primarily of pasture. Grasslands account for 4 percent of the watershed area. Residential and commercial areas, primarily in the town of Windham, account for 3 percent of the land use within the watershed. Water and wetlands account for less than 2 percent, and other land uses, such as the Windham Ski Resort and the Windham Country Club golf course, account for less than 1 percent of the land use in the watershed. The surficial geology of the watershed consists of 45 percent glacial till, 33 percent bedrock, 17 percent kame deposits, and 5 percent outwash sand and gravels and till moraines (fig. 2).
The Batavia Kill station, which also began operation in October 1997, is in Greene County 4.1 mi northeast of Maplecrest, N.Y. (fig. 1). The Batavia Kill near Maplecrest watershed ranges in elevation from approximately 2,160 to 4,000 ft and covers 2.03 mi2. The watershed is 100 percent forested, most of which is designated as New York State forest preserve, and consists of 63 percent deciduous, 28 percent coniferous, and 9 percent mixed forest types (fig. 3). The surficial geology of the watershed consists of 56 percent bedrock and 44 percent glacial till (fig. 2).
Ashokan Reservoir Watershed
There were two water-quality stations in the Ashokan Reservoir watershed (fig. 1). The lower node station was Stony Clove Creek near Phoenicia, N.Y. (USGS station number 01362380); however, after July 2007, the lower node station was moved to Stony Clove Creek below Ox Clove at Chichester, N.Y. (USGS station number 01362370, abbreviation SC; fig. 1; table 1). The discharge data for the stations are considered equivalent records. The corresponding upper node station was Hollow Tree Brook at Lanesville, N.Y. (USGS station number 01362342, abbreviation HT; fig. 1; table 1). For the purposes of this report, the Stony Clove Creek below Ox Clove at Chichester, N.Y. station will be referred to as the Stony Clove station, and the Hollow Tree Brook at Lanesville, N.Y. station will be referred to as the Hollow Tree Brook station.
The Stony Clove Creek station, which began operation in February 1997, is in Ulster County approximately 1.3 mi upstream from Phoenicia, N.Y., and about 1.5 mi upstream from the confluence of Stony Clove Creek and Esopus Creek (fig. 1). The station was moved 0.5 mi upstream in August 2007 because of streambank instability. Based on the watershed area after the station was moved, the Stony Clove Creek watershed ranges in elevation from approximately 900 to 4,000 ft and covers 31.5 mi2. The watershed is 98 percent forested, of which 68 percent is deciduous, 25 percent coniferous, and 5 percent mixed forest types. The remaining 2 percent of the watershed includes agricultural land, grasslands, residential and commercial areas, open water, and wetlands. The surficial geology of the watershed consists of 86 percent bedrock, with the remaining area covered by kame deposits, outwash sand and gravel, and glacial till. A streambank stabilization and restoration project was completed along a 1,700-ft reach in Stony Clove upstream from the station in 2005.
The Hollow Tree Brook station, which began operation in October 1997, is in Greene County 1 mi upstream from the confluence of Hollow Tree Brook and Stony Clove Creek (fig. 1). The Hollow Tree Brook watershed ranges in elevation from approximately 1,480 to 4,000 ft and covers 1.95 mi2. The watershed is 100 percent forested, and consists of 60 percent deciduous, 34 percent coniferous, and 6 percent mixed forest types (fig. 3). The surficial geology of the watershed consists of 92 percent bedrock and 8 percent glacial till (fig. 2).
Cannonsville Reservoir Watershed
There were four water-quality stations in the Cannonsville Reservoir watershed (fig. 1). Two of the stations were in the headwaters: the lower node Town Brook southeast of Hobart, N.Y. (USGS station number 01421618, abbreviation LT; fig. 1; table 1) and the upper node station Town Brook tributary southeast of Hobart, N.Y. (USGS station number 01421614, abbreviation TW). Further down the West Branch Delaware River valley in Delaware County, East Brook enters the West Branch Delaware River in the village of Walton, N.Y. The two water-quality stations in the East Brook watershed are the lower node station East Brook east of Walton, N.Y. (USGS station number 01422747, abbreviation EB) and the upper node station Wolf Creek at Mundale, N.Y. (USGS station number 01422738, abbreviation WC). For the purposes of this report, the Town Brook southeast of Hobart, N.Y. station will be referred to as the Town Brook station, the Town Brook tributary southeast of Hobart, N.Y. station will be referred to as the Town Brook tributary station, the East Brook east of Walton, N.Y. station will be referred to as the East Brook station, and the Wolf Creek at Mundale, N.Y. station will be referred to as the Wolf Creek station.
The Town Brook station, which began operation in October 1997, is in Delaware County 1.4 mi upstream from the confluence of Town Brook and the West Branch Delaware River (fig. 1). The Town Brook watershed ranges in elevation from approximately 1,670 to 3,200 ft and covers 14.3 mi2. The watershed is 64 percent forested, which consists of 49 percent deciduous, 11 percent coniferous, and 4 percent mixed forest types (fig. 3). Agriculture accounts for 26 percent and grasslands 8 percent of the land use in the watershed. The agriculture is associated with small family-owned dairy farms and consists of pasture, row crops, and hay. In the Town Brook watershed, there are many residences, which account for 1 percent of the land use, but no towns or villages. Water and wetlands account for less than 1 percent of the land use in the watershed. The surficial geology of the watershed consists of 66 percent glacial till, 26 percent bedrock, and 8 percent kame deposits and outwash sand and gravel (fig. 2).
The Town Brook tributary station was 0.3 mi upstream from the confluence with Town Brook; the Town Brook watershed ranges in elevation from approximately 1,900 to 3,000 ft and covers 0.76 mi2 (fig. 1). The watershed is 100 percent forested, which consists of 94 percent deciduous, 2 percent coniferous, and 4 percent mixed forest types (fig. 3). Past agricultural land use is evident in the watershed, but there has been no farming for about 80 years. A small water supply reservoir that has been completely silted-in was less than 100 yards downstream from the station on Town Brook Tributary. The surficial geology of the watershed consists of 83 percent bedrock and 17 percent glacial till (fig. 2).
The East Brook station, which began operation in October 1998, is 0.55 mi upstream from the mouth of the stream and within the village of Walton (fig. 1). The East Brook watershed ranges in elevation from approximately 1,220 to 2,300 ft and covers 24.7 mi2. The watershed is 64 percent forested, which consists of 54 percent deciduous, 7 percent coniferous, and 3 percent mixed forest types (fig. 3). Land use in the watershed consists of 25 percent agricultural land. Most of the agricultural land is used for pasture, 7 percent is grassland, 2 percent is residential, and 1 percent is water or wetlands. The surficial geology of the watershed consists of 83 percent glacial till and 17 percent alluvium, kame deposits, and bedrock (fig. 2).
The Wolf Creek watershed in the headwaters of East Brook ranges in elevation from approximately 1,760 to 2,250 ft and covers 0.61 mi2 (fig. 1). The Wolf Creek station was 8 mi northeast of Walton, about 0.3 mi from the mouth of Wolf Creek. The Wolf Creek watershed is 68 percent forested, which consists of 60 percent deciduous, 5 percent coniferous, and 3 percent mixed forest types (fig. 3). Agricultural land accounts for 14 percent, and grasslands account for 13 percent of the land use in the Wolf Creek watershed. Wolf Creek station is the only upper node station with more than 3 percent agricultural land use. The surficial geology of the watershed consists of 100 percent glacial till (fig. 2).
Neversink Reservoir Watershed
There were four water-quality stations in the Neversink Reservoir watershed (fig. 1). The lower node station is Neversink River near Claryville, N.Y. (USGS station number 01435000, abbreviation MB; fig. 1; table 1). The three upper node stations are Biscuit Brook above Pigeon Brook at Frost Valley, N.Y. (USGS station number 01434025, abbreviation BS), West Branch Neversink River at Winnisook Lake near Frost Valley, N.Y. (USGS station number 01434021, abbreviation WN), and East Branch Neversink River northeast of Denning, N.Y. (USGS station number 0143400680, station abbreviation TS). For the purposes of this report, the Neversink River near Claryville, N.Y. station will be referred to as the Neversink River station, the Biscuit Brook above Pigeon Brook at Frost Valley, N.Y. station will be referred to as the Biscuit Brook station, the West Branch Neversink River at Winnisook Lake near Frost Valley station will be referred to as the Winnisook station, and the East Branch Neversink River Northeast of Denning station will be referred to as the Tisons station.
Water-quality sampling at the Neversink River station began in 1952. The station is 2.2 mi downstream from the confluence of the East and West Branches and about 3.2 mi upstream from the Neversink Reservoir (fig. 1). The Neversink River watershed ranges in elevation from approximately 1,520 to 4,100 ft. The Neversink River watershed includes the highest peak in the Catskill Mountains, Slide Mountain, and also 11 of the Catskill High Peaks (mountains higher than 3,500 ft). The watershed is 66.6 mi2 and 97 percent is forested, which consists of 69 percent deciduous, 22 percent coniferous, and 6 percent mixed forest types (fig. 3). The remaining 3 percent of the land use in the watershed consists of agriculture; water or wetlands; a few residences; and a 6,000-acre residential camping, environmental education, and conference center. The surficial geology of the watershed consists of 64 percent bedrock, 28 percent glacial till, and 7 percent outwash sand and gravel and alluvium (fig. 2).
The three upper node watersheds associated with the Neversink River near Claryville lower node station are 100 percent forested. The Biscuit Brook station has been in operation since 1983 and is within the 6,000-acre residential camping complex, 0.6 mi upstream of the mouth of the brook (fig. 1). The Biscuit Brook watershed ranges in elevation from approximately 2,060 to 3,600 ft and covers 3.72 mi2. The forest types within the watershed consist of 72 percent deciduous, 22 percent coniferous, and 6 percent mixed forest types (fig. 3). The surficial geology of the watershed consists of 61 percent bedrock and 39 percent glacial till (fig. 2).
The Winnisook station, which has been in operation since 1991, is about 4.5 mi northeast of the Biscuit Brook station (fig. 1). The Winnisook watershed ranges in elevation from approximately 2,680 to 4,100 ft and covers 0.77 mi2. The station measures drainage from the northern face of Slide Mountain. The forest in the Winnisook watershed consists of 10 percent deciduous, 84 percent coniferous, and 6 percent mixed forest types (fig. 3). The surficial geology of the watershed consists of 98 percent bedrock and 2 percent glacial till (fig. 2).
The Tisons watershed drains the headwaters of the East Branch Neversink River, including the southern slopes of Slide Mountain. The Tisons station has been in operation since 1990 and is 9.6 mi upstream from the confluence of the East and West Branches (fig. 1). The watershed ranges in elevation from approximately 2,140 to 4,100 ft and covers 8.93 mi2. The forest in the Tisons watershed consists of 47 percent deciduous, 46 percent coniferous, and 7 percent mixed forest types (fig. 3). The surficial geology of the watershed consists of 87 percent bedrock and 13 percent glacial till (fig. 2).
The Neversink watershed is the only watershed in the network that has multiple upper node stations associated with one lower node station. The Neversink watershed has been a focus of acid rain research since the early 1980s and is the most acidic of the Catskill and Delaware Reservoir watersheds. The three upper node stations in the Neversink watershed also are part of the Long-Term Monitoring Network operated by the USGS, in cooperation with the EPA. Data from the Long-Term Monitoring Network are used to measure changes in water quality of streams in response to reductions in acidic deposition as a result of title IV of the Clean Air Act Amendments of 1990 (42 USC §7651). The additional data collected for the Long-Term Monitoring Network were added to the data collected for the Catskill and Delaware water-quality network. As a result, baseline water-quality data in the Neversink watershed have been well characterized, and trends in water quality caused by trends in atmospheric deposition or changes in the climate are well documented. Wet-only atmospheric deposition is collected at a National Atmospheric Deposition Program (NADP) collector 0.14 mi from the Biscuit Brook station (fig. 1). Samples are collected weekly and shipped to the NADP Central Analytical Laboratory for analyses of major ions and nutrients (National Atmospheric Deposition Program, 2014).
Rondout Reservoir Watershed
The station in the Rondout Reservoir watershed, Rondout Creek above Red Brook at Peekamoose, N.Y. (USGS station number 01364959, station abbreviation RC; fig. 1; table 1) has been in operation since 1996. The Rondout Creek watershed ranges in elevation from approximately 1,740 to 3,800 ft and covers 5.36 mi2. The watershed is 100 percent forested and is on New York State forest preserve land. The forest consists of 85 percent deciduous, 12 percent conifer, and 3 percent mixed forest types (fig. 3). The surficial geology of the watershed consists of 100 percent bedrock. For the purposes of this report, the Rondout Reservoir watershed, Rondout Creek above Red Brook at Peekamoose, N.Y. station will be referred to as the Rondout Creek station (fig. 2).
Climate Summary
From 1971 to 2000, at the Slide Mountain meteorological station (on Slide Mountain, at elevation 2,647 ft), the 30-year mean annual temperature was 41.4 degrees Fahrenheit (°F), and the mean annual (water year) precipitation was 63.8 inches (in.); during the same period, at the Delhi meteorological station (in Delhi, N.Y., at elevation 1,417 ft), the mean annual temperature was 45.0 °F, and the mean annual precipitation was 43.3 in. (National Climatic Data Center, 2011). The Slide Mountain meteorological station is in the Neversink Reservoir watershed, and the Delhi meteorological station is in the Cannonsville Reservoir watershed. During the study period, the mean annual air temperature at Slide Mountain was 43.0 °F; the coolest water year was 2003 at 41.2 °F, and the warmest water years were 2006 and 2008 at 43.5 °F. The mean annual total precipitation was 66.9 in., and mean annual total snowfall was 103.5 in.; water year 2003 was the driest with 44.9 in. of precipitation, and water year 2006 was the wettest with 84.6 in. of precipitation. The most snow (134.6 in.) fell during water year 2009, and the least snow (59.1 in.) fell during water year 2000.
In 2006, there was a severe flood in the study area beginning June 26 and lasting through June 29. The Slide Mountain and Delhi meteorological stations recorded storm totals of more than 7.8 in. of rainfall, and the East Brook station, within the Cannonsville watershed, recorded a storm with more than 13 in. of rainfall (Suro and others, 2009). The peak discharge measured at many stations across the network exceeded the 1 percent annual exceedance probability discharge (100-year flood) and set a new period of record maximums for discharge at the time.
Methods
This section presents a description of the field, laboratory, and statistical methods used for this study. Water-quality samples were collected at each station every 2 weeks and during storms. During the 10-year study period, an average of 59 samples were collected annually at each station. During water year 2001, sediment monitoring was added to the water-quality parameters collected at each study station; however, the monitoring was discontinued after 1 year at seven of the stations because little sediment was detected at the stations. Suspended-sediment monitoring continued at six of the stations, and turbidity monitoring was added to those stations at the end of March 2003 (table 2).
Table 2.
Median suspended-sediment concentration and turbidity for selected stations within the U.S. Geological Survey Catskill and Delaware water-quality network in the Catskill Mountains in New York.[The period of record for sediment monitoring was during October 1, 2001, through September 30, 2009; the period of record for turbidity monitoring was from March 2003 through September 30, 2009. SCC, suspended-sediment concentration; mg/L, milligram per liter; NTU, nephelometric turbidity unit]
Field Methods
All water-quality sampling and field data collection were by USGS personnel following standard USGS data collection protocols (U.S. Geological Survey, variously dated). Stream stage was recorded at 15-minute intervals using a data logger and discharge measurements were made at 8-week intervals and during high flow. Stage-discharge relations were developed for each station to compute the discharge (Rantz and others, 1982a, b).
Water-quality samples were collected every 2 weeks at each station. Grab samples were collected in 1-liter acid-washed polypropylene bottles from the center of the channel or from the streambank. The bottles were rinsed three times with stream water, filled, and stored on ice until delivered to the Soil and Low-Ionic-Strength Water-Quality Laboratory where samples were refrigerated at 4 degrees Celsius until analyzed. Each station also was equipped with a stage-activated automated sampler that collected water-quality samples during storms and winter thaws. In general, five to six samples were collected for the six largest storms each year; however, in some cases, storm peak samples were collected for smaller storms. When possible, automated samples were retrieved and processed within 24 hours of collection; however, there were times when some samples were processed 48 hours after collection. All sample filtering and preservation was done in the laboratory. Field quality assurance and quality control were assessed through collection of triplicate samples.
Laboratory Methods
All analyses were conducted at the Soil and Low-Ionic-Strength Water-Quality Laboratory, with two exceptions: suspended sediment was analyzed at the Sediment Laboratory of the USGS Kentucky Water Science Center in Louisville, Kentucky, and all phosphorus fractions were analyzed at the USGS National Water Quality Laboratory in Denver, Colorado. Ion chromatography was used for the analysis of chloride, sulfate, and nitrate. Inductively coupled plasma-optical emission spectrometry was used for the analysis of calcium, magnesium, silicon, and total dissolved aluminum. Atomic absorption spectrophotometry was used for the analysis of sodium and potassium. Dissolved organic carbon (DOC) was analyzed with a Dohrmann carbon analyzer. A pH electrode was used to determine pH, and an autotitrator was used to determine acid neutralizing capacity (Lawrence and others, 1995). Total dissolved nitrogen was analyzed using an automated colorimetric reaction on a dual-channel flow injection analyzer and an inline alkaline persulfate ultraviolet digestion and cadmium reduction. Ammonium was analyzed using an automated colorimetric reaction on a flow-injection analyzer. Turbidity was measured with a Hach Model 2100AN turbidimeter, which employs a tungsten-filament lamp. Suspended sediment concentration was determined using the ASTM International D3977–97 standard test methods for determining sediment concentration in water samples (Guy, 1969; ASTM International, 2013). Speciated aluminum was determined by complexation with pyrocatechol violet, according to a two-channel flow-injection method (Henshaw and others, 1988). The first channel yields total monomeric aluminum on an untreated aliquot, and the second channel yields organic monomeric aluminum after the sample passes through a cation exchange resin. Total phosphorus (TP) aliquots were acidified with 1 milliliter of 4.5-normal2 sulfuric acid and analyzed using semiautomated colorimetry. Total dissolved phosphorus (TDP) and orthophosphate (soluble reactive phosphorus [SRP]) were filtered through 0.4-micrometer (µm) polycarbonate filters and analyzed using colorimetry (Fishman, 1993). DOC samples were filtered through nominal 0.7-µm glass fiber filters before analysis. Sample aliquots for major cations (calcium, magnesium, sodium, and potassium), major anions (chloride, sulfate, and nitrate), and aluminum species (total dissolved aluminum, total monomeric aluminum, and organic monomeric aluminum) were filtered through 0.4-µm polycarbonate filters before analysis. Inorganic monomeric aluminum was calculated by subtracting the organic fraction (organic monomeric aluminum) from the monomeric fraction (total monomeric aluminum).
Normality is the gram-equivalent weight of a solution in a solution.
Laboratory activities at the Soil and Low-Ionic-Strength Water-Quality Laboratory were subjected to the quality assurance and quality control procedures of the USGS Watershed Research Program reviewed by the EPA Office of Research and Development. The Soil and Low-Ionic-Strength Water-Quality Laboratory also has been certified by the Environmental Laboratory Accreditation Program. The laboratory quality-assurance program includes quality-control samples, sample blanks, blind-audit samples, and sample triplicates. A detailed description of the laboratory quality-assurance program is detailed in Lincoln and others (2009).
Statistical Methods
All statistical analyses were for the same period of record (October 1, 1999, to September 30, 2009) for all water-quality stations to ensure comparability among watersheds. However, not every storm was sampled at every station, and the particular storms sampled at each station differed based on the hydrologic response of each watershed. These factors should be taken into account when interpreting the data and making comparisons among stations. Median concentrations were calculated for each water-quality parameter. For constituents that included censored values (values below the laboratory reporting limit) medians were estimated using the Kaplan-Meier statistic if fewer than 50 percent of the values were censored (Helsel, 2005). Constituents that included censored values were TP, TDP, SRP, and SSC. The maximum likelihood estimation method was used if 50 to 80 percent of the data were censored (Helsel, 2005). For stations with greater than 80 percent censored values, no summary statistics were calculated. Water-quality samples were collected through the range in discharge at each station to provide an accurate estimate of each water-quality constituent.
Trends in water quality were calculated with the seasonal Kendall test (Hirsch and others, 1982), a modification of the nonparametric Mann-Kendall test (Mann, 1945; Kendall, 1975). The test is used to analyze monotonic trends in water-quality data, which are commonly nonnormally distributed and may contain outliers, missing values, and censored data (Hirsch and others, 1982). Each year was divided into 12 seasons (months) using the median monthly value for each month for each station. Trends were calculated on the residuals of a discharge-concentration regression for each constituent using either a hyperbolic (Johnson and others, 1969) or a natural log fit. Results of the residual trend tests were considered statistically significant at a calculated probability (p) value less than (<) 0.05. When the discharge-concentration relation was not significant, trends were calculated on the raw concentrations.
Regression analysis was used to evaluate the relation between SSC and turbidity levels at each of the six stations where SSC and turbidity levels were measured (table 2). Maximum likelihood estimation was used to calculate regression statistics for stations with greater than 5 percent censored values (Helsel, 2005).
A flow duration analysis was completed for each water-quality station by calculating the exceedance probability for every daily mean discharge value for the study period. This analysis was used to identify high- and low-flow conditions at each station and to determine whether samples were collected through the range in discharge at each station. Low flow conditions were defined as the discharge that was exceeded 90 percent of the time (Q90) and high-flow conditions were defined as the discharge that was exceeded 5 percent of the time (Q5).
Results and Discussion
The water-quality data discussed in this report consist of nutrients, major ions, SSC, and turbidity. The effects of land use on water quality are discussed with a focus on the effects of agricultural land use on water quality because forest and agriculture are the two primary land uses within the study watersheds (fig. 3). The effects of land use on water quality are also focused on phosphorus concentrations (TP, TDP, and SRP) because phosphorus could cause eutrophication of New York City water supply reservoirs (New York City Department of Environmental Protection, 2006). Trend analyses were performed for all nutrients, major ions, and SSC for the study period. Turbidity trends were not computed because the data collection period for turbidity was only 6 years. Suspended sediment and turbidity are discussed separately from other water-quality parameters because these two parameters are of particular concern for the New York City water supply system. Turbidity is one of the critical analytes in the EPA’s surface water treatment rule because turbidity is aesthetically unpleasing, reduces the effectiveness of drinking water disinfection, and may indicate the presence of bacteria and viruses. As a result, turbidity control is directly addressed in New York State Department of Health (2017).
The Effect of Land Use on Water Quality
One of the main goals of this study was to examine the effect of land use on water quality within the Catskill and Delaware watersheds. The NYCDEP has implemented many best management practices to minimize the effect of agricultural practices and erosion on the surface-water quality within the water supply system. Several studies examined the effect of land use and best management practices on water quality in the region during the early 2000s (Bishop and others, 2005; Mehaffey and others, 2005; Dow and others, 2006; Kaplan and others, 2006; Newbold and others, 2006; Bryant and others, 2008). The current study focuses on the relation between land use and select water-quality parameters in the Catskill and Delaware watersheds during a much longer period than previous studies and examines 10-year trends in water quality at each station as well.
As described in the “Field Methods” section, grab samples were collected every 2 weeks, and storm samples were collected using stage-activated automated samplers. Flow duration curves were developed for each station for the 10-year study period. The four stations (Biscuit Brook [period of record 1983–2009], Winnisook Creek [period of record 1991–2009], Tisons Creek [period of record 1990–2009], and Neversink River [period of record 1937–2009]) that had much longer periods of discharge record were used to put the study period into historical context. Flow duration analyses for the entire period of record at the four stations showed that the study period was somewhat wetter than normal. The flow duration analyses for the study period were also used to evaluate how effective the sampling strategy was for capturing samples through the range in discharge. For each station, discharge was divided into 10-percent flow exceedance classes. The classes are interpreted as the amount of time a certain discharge is exceeded at a station; for example, Q90 is the discharge at a given station that is exceeded 90 percent of the time and thus represents low-flow conditions, whereas Q10 is the discharge that is exceeded only 10 percent of the time and therefore represents high-flow conditions. Samples were then divided into each discharge class based on the discharge at the time the sample was collected, and the percentage of samples collected in each discharge class was tabulated for each station (table 3). The results of the flow duration analysis indicated that samples were collected through the range in discharge; the largest percentage of samples was collected during high-flow conditions, which was a target of the sampling strategy because high-flow conditions are when the majority of sediment and many dissolved constituents are mobilized within watersheds. The effectiveness of the sampling strategy was also evaluated based on seasonal sampling with the seasons defined as fall (September, October, November), winter (December, January, February), spring (March, April, May), and summer (June, July, August). Samples were collected during every season throughout the study period (table 4). The smallest percentage of samples was collected during the winter when discharge is typically low and stable compared with other seasons. The greatest percentage of samples was collected during the spring, which was a target of the sampling strategy because spring discharge accounted for an average of 37 percent of total annual discharge at each station throughout the study period (table 4).
Table 3.
Mean percentage of samples collected in each flow class for all stations in the Catskill and Delaware water-quality network in the Catskill Mountains in New York, October 1, 1999, through September 30, 2009.[Flow classes are defined as the percentage of mean daily discharge values that exceeded a given discharge (Q) value; for example, for Q10, 10 percent of the mean daily discharge values exceeded that value during the period of record. Q10 represents high-flow conditions, and Q90 represents low-flow conditions. All values except numbers of samples are in percent; totals may not equal 100 percent because of rounding. Stations are defined in tables 1 and 2 of this report. RF, Batavia Kill at Red Falls near Prattsville, N.Y.; BV, Batavia Kill near Maplecrest, N.Y.; LT, Town Brook southeast of Hobart, N.Y.; TW, Town Brook tributary southeast of Hobart, N.Y.; SC, Stony Clove Creek below Ox Clove at Chichester, N.Y.; HT, Hollow Tree Brook at Lanesville, N.Y.; EB, East Brook east of Walton, N.Y.; WC, Wolf Creek at Mundale, N.Y.; MB, Neversink River near Claryville, N.Y.; BS, Biscuit Brook above Pigeon Brook at Frost Valley, N.Y.; TS, East Branch Neversink River northeast of Denning, N.Y.; WN, West Branch Neversink River at Winnisook Lake near Frost Valley, N.Y.; RC, Rondout Creek above Red Brook at Peekamoose, N.Y.]
Table 4.
Mean percentage of samples collected during each season for all stations in the Catskill and Delaware water-quality network in the Catskill Mountains in New York, October 1, 1999, through September 30, 2009.[Seasons are defined as fall (September through November), winter (December through February), spring (March through May), and summer (June through August). Stations are defined in tables 1 and 2 of this report. All values except numbers of samples are in percent; totals may not equal 100 percent because of rounding. RF, Batavia Kill at Red Falls near Prattsville, N.Y.; BV, Batavia Kill near Maplecrest, N.Y.; LT, Town Brook southeast of Hobart, N.Y.; TW, Town Brook tributary southeast of Hobart, N.Y.; SC, Stony Clove Creek below Ox Clove at Chichester, N.Y.; HT, Hollow Tree Brook at Lanesville, N.Y.; EB, East Brook east of Walton, N.Y.; WC, Wolf Creek at Mundale, N.Y.; MB, Neversink River near Claryville, N.Y.; BS, Biscuit Brook above Pigeon Brook at Frost Valley, N.Y.; TS, East Branch Neversink River northeast of Denning, N.Y.; WN, West Branch Neversink River at Winnisook Lake near Frost Valley, N.Y.; RC, Rondout Creek above Red Brook at Peekamoose, N.Y.]
Median concentrations were calculated for each water-quality parameter for each station for the study period. The results of the summary statistics describe the general water quality of each study watershed and how the watersheds compare with one another (table 5). The station water quality spanned a wide range in acidity from a median pH of 4.7 at Winnisook to 7.1 at Town Brook and an acid neutralizing capacity of −14.6 microequivalents per liter (µeq/L) at Winnisook to 354.2 µeq/L at Town Brook (fig. 4). The station water quality also spanned a wide range in base cation concentrations (fig. 5). The water quality at forested stations was consistently more acidic than the watersheds with mixed land use or the watersheds with substantial agricultural land use (figs. 4 and 5; table 1). Relations between (calcium and magnesium) and (calcium and sulfate) were similar among the stations (figs. 5 and 6). Forested stations, particularly the stations in the Neversink Reservoir watershed, had the lowest calcium and sulfate concentrations, whereas stations in the Schoharie Reservoir and Cannonsville Reservoir watersheds had the highest calcium and sulfate concentrations (fig. 6).
Table 5.
Median concentrations of chemical constituents for all stations in the Catskill and Delaware water-quality network in the Catskill Mountains of New York, October 1, 1999 through September 30, 2009.[See figure 1 for station locations. pH is reported as the negative log of the hydrogen ion concentration; turbidity is reported in nephelometric turbidity units; all other constituents are reported in milligrams per liter. Stations are defined in tables 1 and 2 of this report. ANC, acid neutralizing capacity; Ca2+, calcium ion; Mg2+, magnesium ion; K+, potassium ion; Na+, sodium ion; NO3−, nitrate ion; NH4+, ammonium ion; Cl−, chloride ion; SO42−, sulfate ion; DOC, dissolved organic carbon; Si, silicon; Altd, total dissolved aluminum; Almono, total monomeric aluminum; Alorg, organic monomeric aluminum; SSC, suspended-sediment concentration; TP, total phosphorus; TDP, total dissolved phosphorus; SRP, soluble reactive phosphorus; RF, Batavia Kill at Red Falls near Prattsville, N.Y.; BV, Batavia Kill near Maplecrest, N.Y.; LT, Town Brook southeast of Hobart, N.Y.; TW, Town Brook tributary southeast of Hobart, N.Y.; SC, Stony Clove Creek below Ox Clove at Chichester, N.Y.; HT, Hollow Tree Brook at Lanesville, N.Y.; EB, East Brook east of Walton, N.Y.; WC, Wolf Creek at Mundale, N.Y.; MB, Neversink River near Claryville, N.Y.; BS, Biscuit Brook above Pigeon Brook at Frost Valley, N.Y.; TS, East Branch Neversink River northeast of Denning, N.Y.; WN, West Branch Neversink River at Winnisook Lake near Frost Valley, N.Y.; RC, Rondout Creek above Red Brook at Peekamoose, N.Y.]
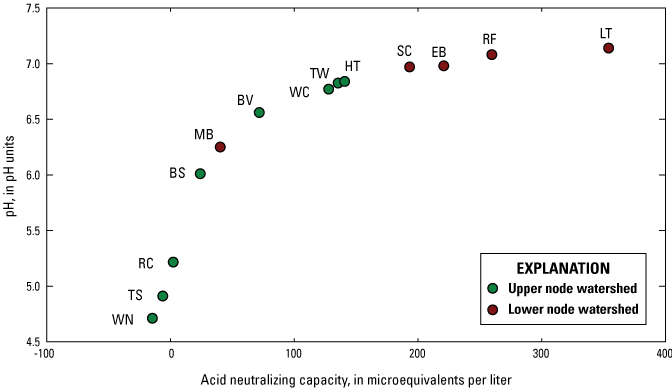
Median concentrations of acid neutralizing capacity and pH of selected streams in the Catskill and Delaware watersheds in New York, October 1, 1999, through September 30, 2009. Two-letter abbreviations represent station names (table 1).
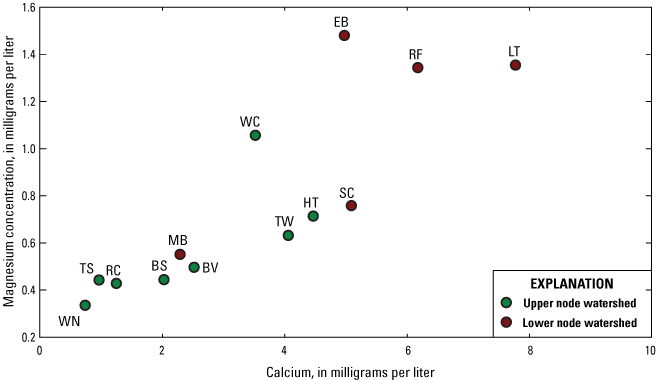
Median concentrations of calcium and magnesium of selected streams in the Catskill and Delaware watersheds in New York, October 1, 1999, through September 30, 2009. Two-letter abbreviations represent station names (table 1).
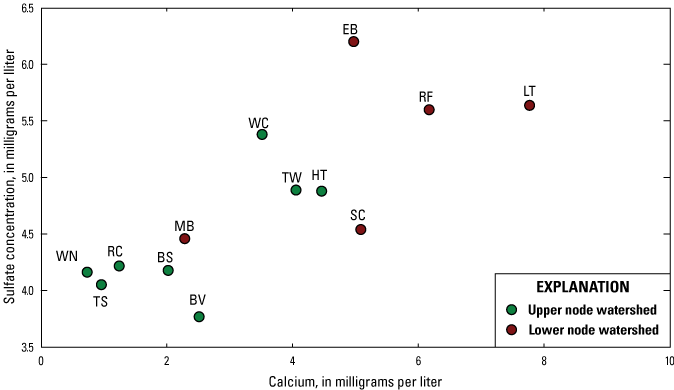
Median concentrations of calcium and sulfate of selected streams in the Catskill and Delaware watersheds in New York, October 1, 1999, through September 30, 2009. Two-letter abbreviations represent station names (table 1).
The differences in surface-water base cation concentrations among the stations reflect the differences in surficial geology. There is a sharp divide in the surficial geology across the region, where the northwestern area of the network is dominated by glacial till and the southeastern area of the network is dominated by rock outcrops (fig. 2). The difference in surficial geology is evident in the streams (figs. 4, 5, and 6). The highest surface-water base cation concentrations were measured at watersheds with the greatest amount of glacial till, whereas the lowest base cation concentrations were measured at watersheds with the greatest amount of bedrock outcrops (fig. 2). These results agree with results from a survey of 301 streams throughout the Catskills that determined the Neversink Reservoir watershed had the largest number of acidic streams with the lowest pH, whereas the Cannonsville and Pepacton watersheds had the fewest number of acidic streams (Siemion and others, 2014). The differences in surficial geology have also affected soil chemistry. Siemion and others (2014) reported the lowest soil calcium concentrations and base saturation for the Neversink and Rondout Reservoir watersheds based on sampling from 200 soil pits throughout the Catskills. Acidic soils have been identified as contributing to the decline of sugar maple and red spruce (Picea rubens) in the northeastern United States (Shortle and others, 1997; Long and others, 2009). Soil calcium depletion and its contribution to stream acidification is also a concern because of its negative effects on fish species distribution (Baldigo and Lawrence, 2000). Soil calcium depletion has also been determined as a cause for high stream inorganic monomeric aluminum concentrations and brook trout (Salvelinus fontinalis) mortality following forest harvesting in the Neversink watershed (Baldigo and others, 2005; McHale and others, 2007).
Another contrast between forested watersheds and mixed land use and agricultural watersheds is shown by the relation between median sodium and chloride concentrations. All lower node watersheds had much higher sodium and chloride concentrations than their paired forested upper nodes (fig. 7). This seems to indicate that there is an influence of road salt on water quality at every lower node station with the smallest influence within the 98-percent forested Neversink River watershed. There was a moderately strong relation between road density and median sodium and chloride concentrations (coefficient of determination [r2]=0.58). When the Wolf Creek at Mundale station was removed from the dataset, the relation improved to r2=0.86. Wolf Creek has a high road density relative to other upper node watersheds because of its small size but has low sodium and chloride concentrations most likely because several of the roads in the watershed are not paved. The Red Falls station had the highest sodium and chloride concentrations and the greatest road density. Windham, which represents a focus of road salt application, is in the Batavia Kill watershed, as are two wastewater treatment plants that may be a source of high chloride concentrations measured during low flow at the Red Falls station.
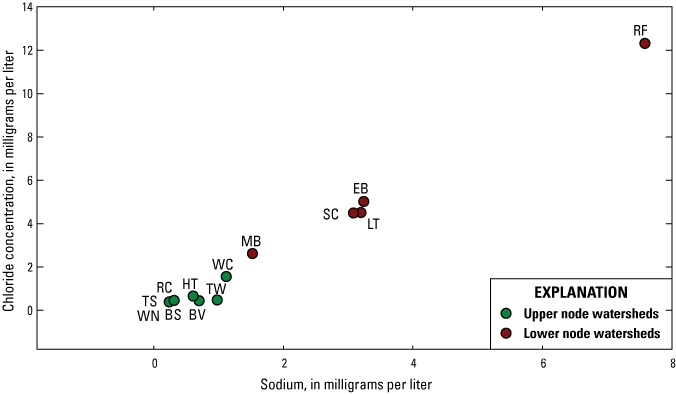
Median concentrations of sodium and chloride of selected streams in the Catskill and Delaware watersheds in New York, October 1, 1999, through September 30, 2009. Two-letter abbreviations represent station names (table 1).
High concentrations of nutrients in stream water are a main concern related to agricultural land use in the Catskill and Delaware watersheds because elevated nutrient concentrations in surface waterbodies can cause eutrophication and algal blooms. There is a large amount of variability in nitrogen concentration throughout the Catskill and Delaware watershed (fig. 8). The likely cause of the variability is the variety of nitrogen sources across the landscape and the fact that nitrogen is highly mobile in its most common oxygenated form (nitrate). Disturbances such as forest harvesting and insect defoliations as well as point and nonpoint sources such as agriculture, lawn fertilization, and wastewater treatment plants all affect the concentrations of nitrogen measured in stream water and complicate regional interpretation of nitrogen patterns in stream water. The watersheds with the highest percentage of agricultural land use (table 1) did not have the highest median dissolved nitrogen concentrations (fig. 8). Hollow Tree Brook, the forested upper node in the Stony Clove watershed, had high dissolved nitrogen concentrations throughout the study period. There was a marked increase in nitrate concentrations of stream water at Stony Clove Creek and Hollow Tree Brook during the early to mid-2000s that was caused by a multiyear insect defoliation (fig. 9). The Town Brook tributary upper node forested watershed had the second highest median nitrate concentrations of any in the study, the timing of which coincides with a selective tree harvest within the watershed during fall 2006 (fig. 8). Nitrate concentration increased substantially after the harvest, but the highest concentrations did not occur until 1 year after the harvest in fall 2007 (fig. 10).
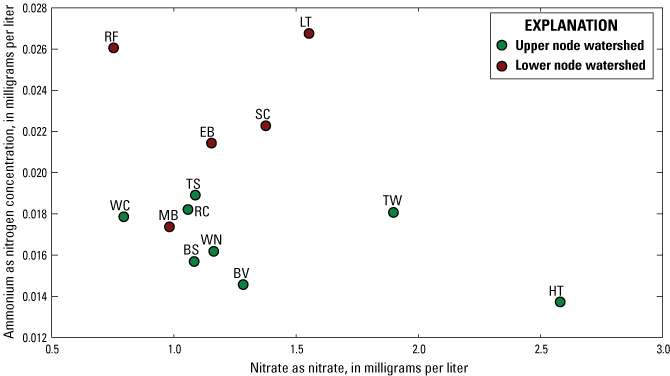
Median concentrations of nitrate as nitrate and ammonium as nitrogen of selected streams in the Catskill and Delaware watersheds in New York, October 1, 1999, through September 30, 2009. Two-letter abbreviations represent station names (table 1).
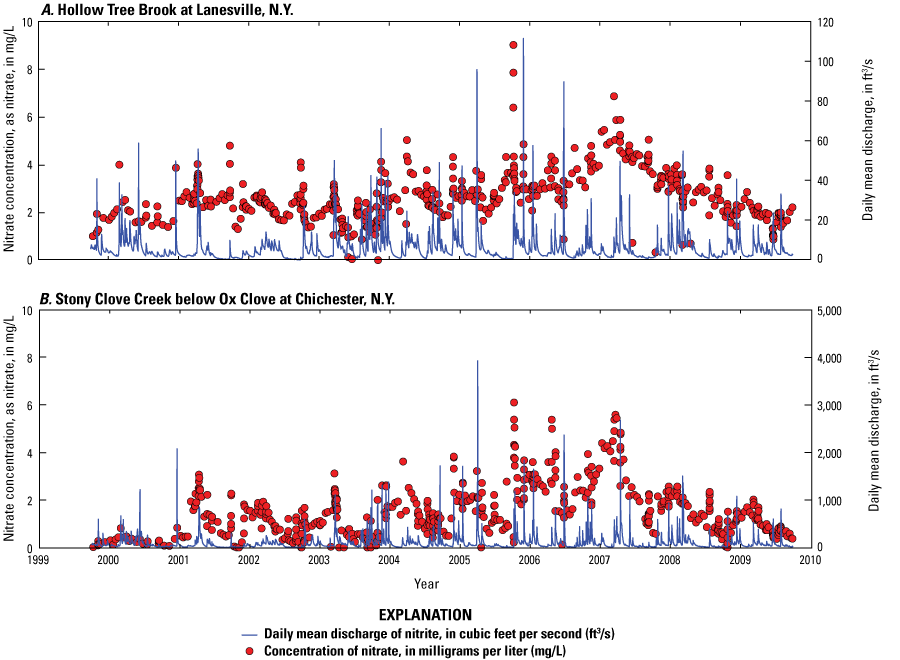
Median nitrate concentrations and daily mean discharge at A, Hollow Tree Brook at Lanesville, N.Y. and B, Stony Clove Creek below Ox Clove at Chichester, N.Y., October 1, 1999, through September 30, 2009.
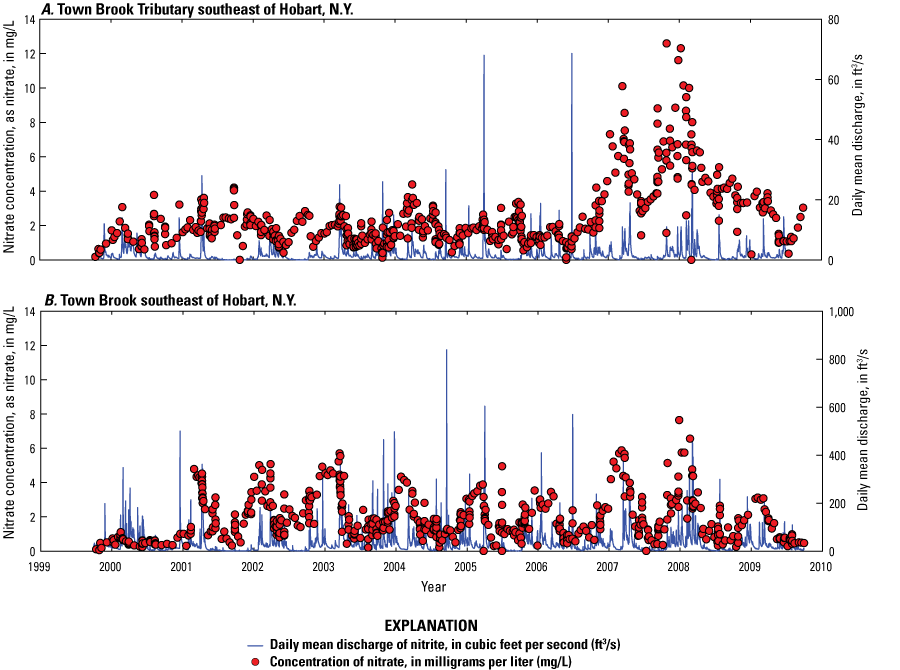
Median nitrate concentrations and daily mean discharge at A, Town Brook tributary southeast of Hobart, N.Y. and B, Town Brook southeast of Hobart, N.Y., October 1, 1999, through September 30, 2009.
In contrast to nitrogen, phosphorus is less mobile and patterns in phosphorus concentration are generally easier to identify. The amount of phosphorus that is delivered to New York City drinking water reservoirs by watershed streams and rivers is a particular concern because primary productivity in the reservoirs is typically phosphorus limited (Auer and others, 1998). Phosphorus inputs to the reservoirs, especially during the growing season, could cause an increase in primary productivity and subsequent algal blooms within the reservoirs (Bott and others, 2006). Algal blooms can cause turbidity, unpleasant odors, and anoxia and, by increasing the organic matter in the reservoirs, can cause the formation of trihalomethanes when the water is chlorinated (Latifoglu, 2003; van Leeuwen and others, 2005). Trihalomethanes are a suspected carcinogen (Palmstrom and others, 1988). Sediment within freshwater bodies can become a major internal source of bioavailable phosphorus in stratified water bodies with anoxic hypolimnia (Nürnberg, 1988). This type of feedback loop can result in additional algal blooms. Beyond the potential effects of eutrophication on drinking water quality, degradation of water quality by eutrophication can change the composition of aquatic species in a water body and affect the services provided such as recreation and therefore have substantial economic effects (Carpenter and others, 1998; Smith and others, 1999).
In areas of intensive agricultural land use, inputs of phosphorus from fertilizer and manure can exceed phosphorus requirements for crop and animal production that can result in phosphorus loss from fields to streams (Sharpley and others, 1994; Gburek and Sharpley, 1998). Agricultural land use was not intensive in the Catskill and Delaware watersheds; nonetheless, direct discharge of milk-house waste and barnyard runoff to streams was creating the potential for high concentrations of phosphorus to be delivered to Catskill streams (Bishop and others, 2005). In 1992, the NYCDEP established the Watershed Agricultural Program (WAP) because of concerns about high phosphorus concentrations in streams. The WAP is a voluntary partnership between NYCDEP and farmers in the Catskill and Delaware watersheds designed to manage nonpoint sources of waterborne pathogens, nutrients, and sediment. The WAP has planned and implemented whole farm plans and agricultural best management practices on more than 85 percent of farms within the watershed (New York City Department of Environmental Protection, 2006). A paired watershed study in the Cannonsville Reservoir watershed demonstrated significant reductions in loads of TP (43 percent) and TDP (29 percent) in response to agricultural best management practices when implemented on a farm in the watershed (Bishop and others, 2005).
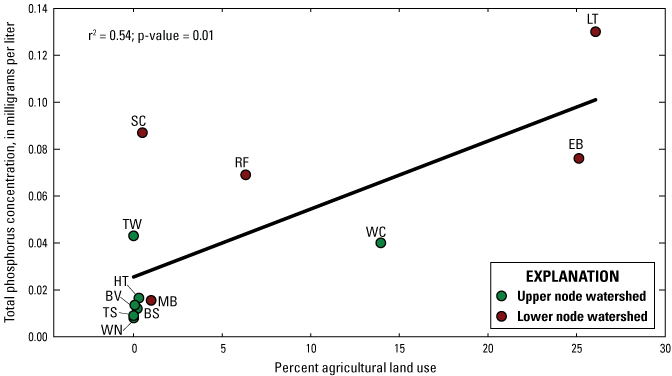
A previous survey of 30 Catskill and Delaware watershed streams at baseflow during a 3-year period determined that no single ion or nutrient was a strong indicator of land use within the region (Dow and others, 2006). The current study sampled fewer streams, but the streams were sampled much more intensively and throughout the range in discharge. There was a statistically significant positive relation between the median TP concentration at each station and the percent agricultural land use for each station (r2=0.50; p=0.01; fig. 11). There was also a significant positive relation between median TDP concentration and percent agricultural land use at each station (r2=0.54; p=0.01; fig. 12). The relations were stronger during high-flow conditions (samples at or above the 95th percentile of mean daily discharge; figs. 13 and 14), but the relations were not significant for low flow conditions (samples collected at or below the 10th percentile of mean daily discharge [data not shown]).
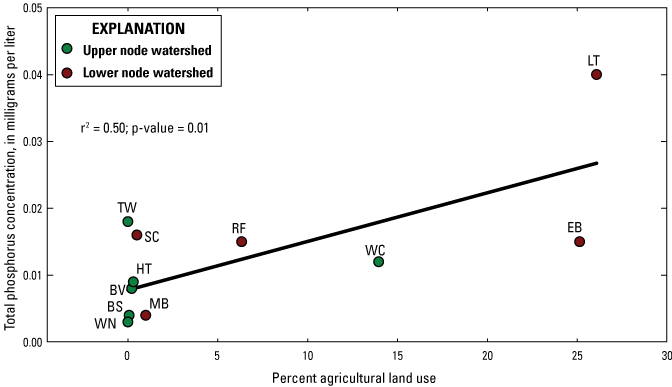
Relation between percent agricultural land use and median concentrations of total phosphorus for samples from water-quality stations in the Catskill and Delaware watersheds in New York, October 1, 1999, through September 30, 2009. Two-letter abbreviations represent station names (table 1). r2, coefficient of determination; p-value, probability value.
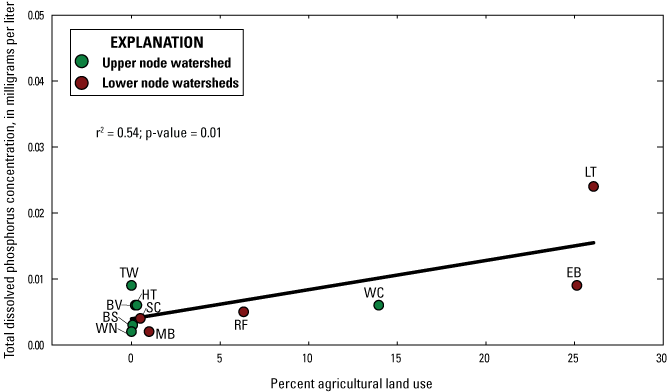
Relation between percent agricultural land use and median concentrations of total dissolved phosphorus for samples from water-quality stations in the Catskill and Delaware watersheds in New York, October 1, 1999, through September 30, 2009. Two-letter abbreviations represent station names (table 1). r2, coefficient of determination; p-value, probability value.
Relation between percent agricultural land use and median concentrations of total phosphorus for high-flow samples (samples at or above the 95th percentile of mean daily flow) from water-quality stations in the Catskill and Delaware watersheds in New York, October 1, 1999, through September 30, 2009. Two-letter abbreviations represent station names (table 1). r2, coefficient of determination; p-value, probability value.
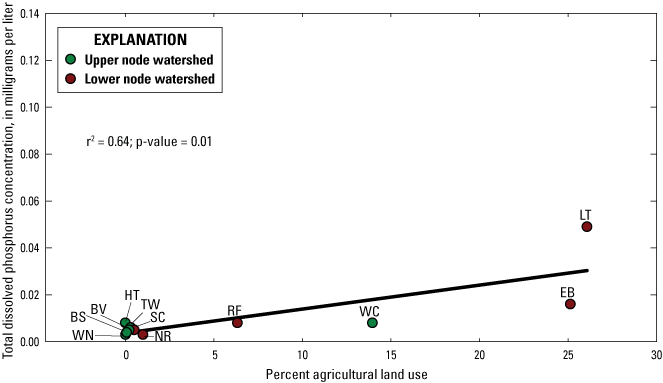
Graph showing relation between percent agricultural land use and median concentrations of total dissolved phosphorus for high-flow samples (samples at or above the 95th percentile of mean daily flow) from water-quality stations in the Catskill and Delaware watersheds in New York, October 1, 1999, through September 30, 2009. Two-letter abbreviations represent station names (table 1). r2, coefficient of determination; p-value, probability value.
Median phosphorus concentrations were similar between upper and lower nodes during low flow conditions at all stations (fig. 15). In the forested watersheds, the differences between nodes remained small during high-flow conditions; however, in the agricultural watersheds, phosphorus concentrations increased markedly between the upper and lower nodes during high flow. The influence of agricultural land use on phosphorus concentrations was evident during all flow conditions; however, the influence was less apparent during low flow especially for TP (fig. 15). Total phosphorus is typically bound to sediment and therefore is more closely linked to flow conditions. The greatest differences in phosphorus concentrations between forested upper node stations and downstream lower node stations were measured in the Town Brook watershed. Interestingly, the forested upper node within the Town Brook watershed (Town Brook Tributary) had the second greatest median phosphorus concentrations (TP was 0.018 milligram per liter [mg/L], and TDP was 0.009 mg/L) measured at any of the stations (fig. 16). The Town Brook Tributary watershed is 100 percent forested and although there is evidence of past agricultural land use in the watershed (old stone walls used to separate fields), the watershed does not appear to have been farmed during the past 50 to 80 years. There appears to have been a small increase in TP concentrations at the Town Brook Tributary station following the 2006 selective harvest; however, it also appears that the high phosphorus concentrations, relative to other study watersheds, are typical for the watershed (fig. 17). During low flow conditions at Town Brook Tributary, TP concentrations were similar to the other stations, but TDP and SRP concentrations were higher than any other stations with the exception of the Town Brook lower node station. The results seem to indicate that past agricultural land use can affect stream water phosphorus concentrations for many decades after agricultural activity has ceased. However, the effect in the Town Brook Tributary watershed appeared to be confined to TDP and SRP during low flow conditions. For example, during high-flow conditions the two stations with the greatest amount of agricultural land use (Town Brook and East Brook) had the greatest TDP and SRP concentrations and the Town Brook Tributary station had concentrations similar to the other stations (fig. 15).
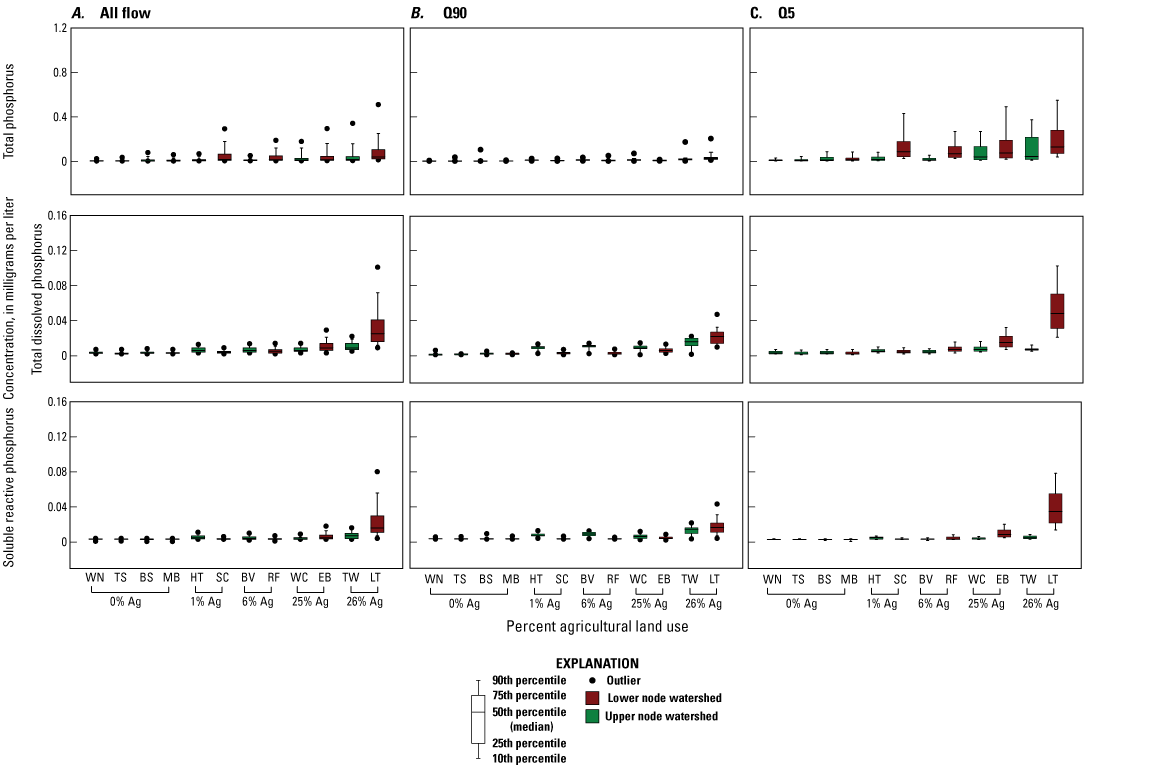
Phosphorus concentrations for samples collected from water-quality stations in the Catskill and Delaware watersheds in New York during A, all, B, low- (Q90), and C, high- (Q5) flow conditions, October 1, 1999, through September 30, 2009. Two-letter abbreviations represent station names (table 1). %, percent; Ag, agricultural land cover.
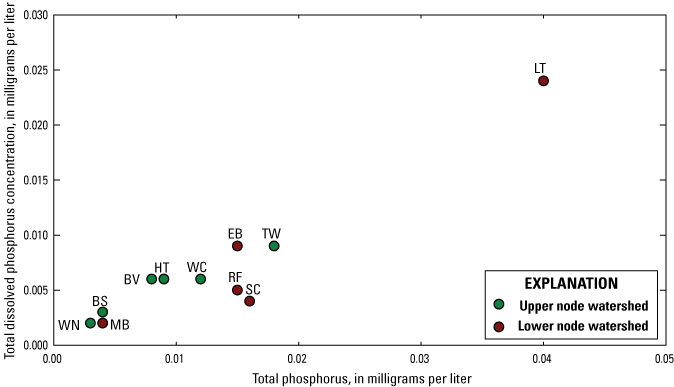
Median concentrations of total phosphorus and total dissolved phosphorus for water-quality stations in the Catskill and Delaware watersheds in New York, October 1, 1999, through September 30, 2009. Two-letter abbreviations represent station names (table 1).
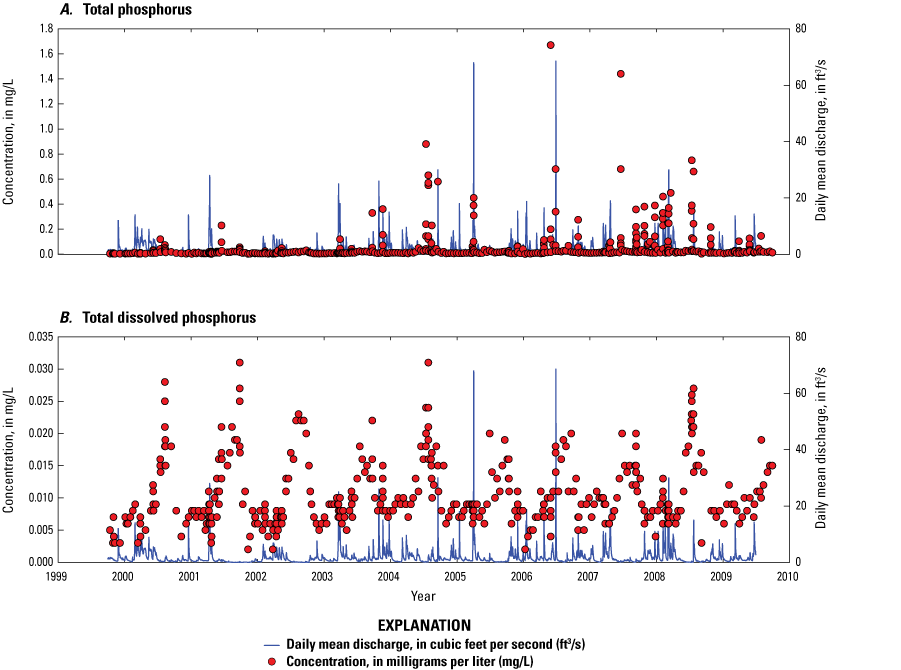
Total A, phosphorus and B, dissolved phosphorus concentrations and daily mean discharge and at the Town Brook tributary southeast of Hobart, N.Y., station, October 1, 1999, through September 30, 2009.
Legacy phosphorus, phosphorus stores that have accumulated in watershed soils and water bodies during years of agricultural land use, has been identified as an impediment to the effectiveness of best management practices to improve water quality in agricultural watersheds in the United States, Canada, and Europe (Sharpley and others, 2013). Legacy phosphorus can continue to impair water quality of streams for years, decades, or even centuries after best management practices are implemented or farming has ceased (Jarvie and others, 2013; Sharpley and others, 2013). Legacy phosphorus is of particular concern for the Catskill and Delaware watersheds because the highest concentrations of dissolved phosphorus were measured during low flow. Elevated dissolved phosphorus concentrations during summer low flows can adversely affect water quality in reservoirs by contributing to algal blooms. At the Town Brook station median TP concentrations were 0.13 mg/L, about one half of the median TP concentrations measured at agricultural watersheds in other areas of the country (0.26 mg/L), and about four times the national background concentrations for streams (0.034 mg/L) (Dubrovsky and others, 2010). The phosphorus concentrations measured at the Town Brook Tributary station were typically less than half of the phosphorus concentrations measured at the Town Brook station (fig. 16). The issue of legacy phosphorus is especially pertinent in the Catskill and Delaware watersheds because of the large amount of previous agricultural land that the NYCDEP has acquired and is actively acquiring through a land acquisition program in the Catskill and Delaware watersheds.
Although the East Brook watershed has approximately the same percentage of agricultural land use as the Town Brook watershed, phosphorus concentrations were much lower at the East Brook station. The 2001 land use and land cover dataset does not distinguish among types of agriculture. However, the agriculture within the Town Brook watershed is composed mainly of small family-owned dairy farms that include a considerable amount of row crops, whereas the agriculture within the East Brook watershed is composed of horse farms that include mainly pasture and no row crops. Although the difference in the type of agriculture is not evident from the 2001 land use land cover database, the difference in the type of agriculture likely has a marked effect on stream water phosphorus concentrations between the two watersheds.
In addition to land use, stream discharge also affected stream phosphorus concentrations (figs. 13, 14, and 15). Discharge had a strong influence on phosphorus concentrations, especially in the agricultural watersheds. For example, at the Town Brook station, high-flow median concentrations were greater than low flow concentrations by 0.09 mg/L for TP, 0.04 mg/L for TDP, and 0.03 mg/L for SRP. Nonetheless, the influence of discharge on phosphorus concentrations was only a fraction of that resulting from agricultural land use. There were two to fivefold increases in median phosphorus concentrations between high- and low-flow conditions (fig. 15), but median phosphorus concentrations were an order of magnitude greater between the 100 percent forested Neversink River watershed and the 26-percent agricultural Town Brook watershed. The combined effects of the percentage of agricultural land use and discharge produced the greatest increases in phosphorus concentrations between upper and lower nodes, and the correlations between the percentage of agricultural land use and phosphorus concentrations were the strongest during high-flow conditions (figs. 13 and 14).
Trends in Water Quality
The purpose of this section is to describe temporal trends in water quality at the stations included in this study and attribute those trends to changes in land use or changes in atmospheric deposition where possible. Previous studies of trends in water chemistry at streams in the Catskill Mountains have focused primarily on forested stations to minimize influences from land use activities (Murdoch and Stoddard, 1993; Burns and others, 2006; McHale and others, 2017; Siemion and others, 2018). Trend analyses in the region have typically focused on evaluating the effects of reductions in sulfur and nitrogen emissions mandated by title IV of the Clean Air Act Amendments of 1990 (42 USC §7651) because the Catskills have been subjected to high levels of acid deposition for several decades and watersheds in the region are sensitive to the effects of acid deposition (Omernik and Powers, 1983; Brakke and others, 1988). Trend analyses are often focused on forested watersheds because the relatively small changes in discharge and water chemistry caused by changes in climate and reductions in acid deposition are difficult to distinguish from the much larger trends caused by human activity in watersheds with substantial human influence (Murdoch and Stoddard, 1993; Burns and others, 2006; Burns and others, 2007). Of the 13 watersheds included in this study, nine had forest cover of 98 percent or greater; three had agricultural land use of 14 to 26 percent; and although five watersheds had some residential land use, none had more than 4 percent (table 1).
Sulfate is an acidic anion that was, and in many areas continues to be, the primary cause of acidity in stream water in acid-sensitive systems such as the Catskill Mountains. In watersheds with low soil calcium concentrations and base saturation, soil water acidity can result in aluminum mobilization. Inorganic monomeric aluminum is a form of aluminum toxic to some aquatic biota, particularly at concentrations greater than 0.05 mg/L, and therefore a primary concern related to watershed acidity in the Catskills (Baldigo and Murdoch, 1997; Baldigo and others, 2005; McHale and others, 2017). At the three most acidic watersheds stations included in this study (Winnisook, Tisons, and Rondout Creeks) inorganic monomeric aluminum concentrations commonly exceeded 0.05 mg/L during the study period. At the Winnisook station concentrations of inorganic monomeric aluminum exceeded 0.3 mg/L frequently early in the study period but did not exceed that level during the last 2 water years of the study. The Tisons and Rondout Creek stations also showed a decrease in inorganic monomeric aluminum concentrations during the study period. Although inorganic monomeric aluminum concentration exceeded 0.15 mg/L early in the study period at those two stations, concentrations remained below 0.15 mg/L during the last 3 years of the study. McHale and others (2017) reported small but significant decreasing trends in inorganic monomeric aluminum at all three stations from water years 1992 through 2014.
All of the network stations showed significant decreasing trends in sulfate (fig. 18). The largest sulfate trends were calculated for the Town Brook, Town Brook Tributary, East Brook, Wolf Creek, and Hollow Tree Brook stations located in the least acidic watersheds. The smallest trends were calculated for the Red Falls station and the stations in the Neversink River watershed (fig. 18). Since data collection began in 1983, significant reductions in sulfate deposition have been computed for the Biscuit Brook National Atmospheric Deposition Station, but the slope of the trends has decreased through time (Burns and others, 2006; McHale and others, 2017). Sulfur is not an essential nutrient like nitrogen or phosphorus, and sulfur is not added to streams through human activity like chloride is through road salting and wastewater treatment facilities. Therefore, land use appears to have little effect on sulfate concentrations in stream water. The decrease in atmospheric sulfur deposition has resulted in decreases in stream sulfate concentrations throughout the Catskill and Delaware watersheds.
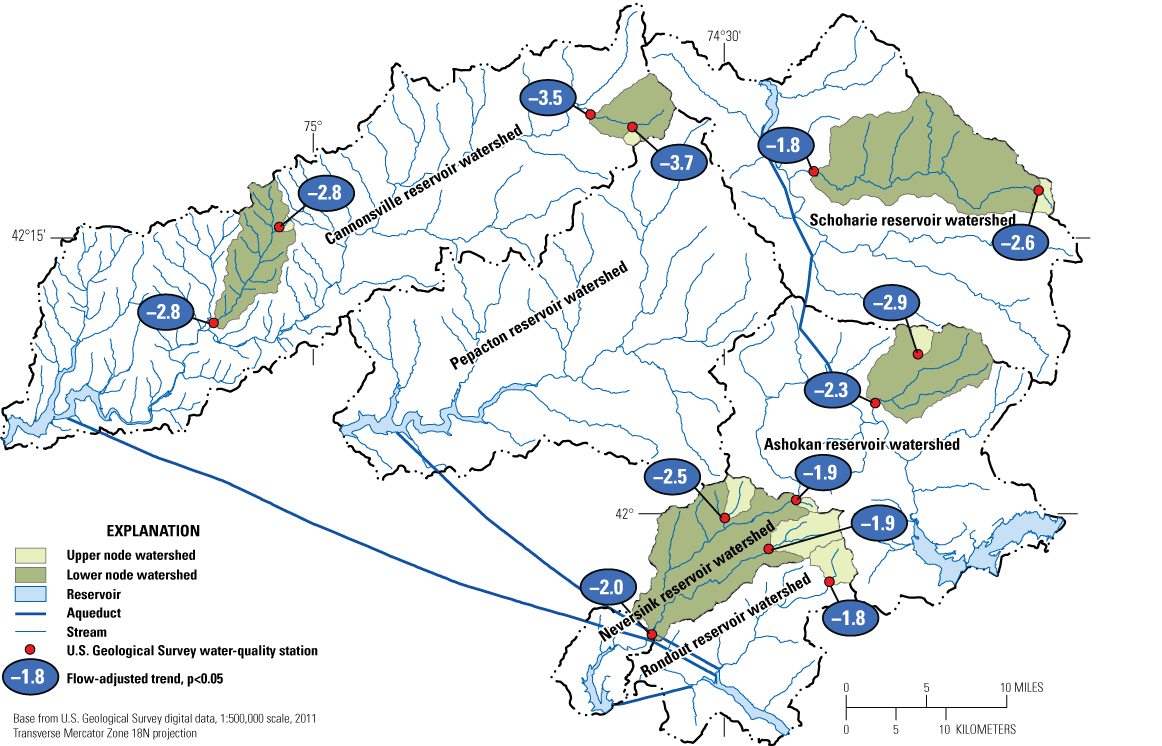
Slope of significant trends in sulfate concentration, in microequivalents per liter per year, for water-quality stations in the Catskill and Delaware watersheds in New York, October 1, 1999, through September 30, 2009.
Reductions in stream sulfate concentrations might be expected to result in reductions in hydrogen ion concentrations and increases in acid neutralizing capacity, and the most acidic streams in the region are most likely to show signs of recovery from decreases in acid deposition (Driscoll and others, 2001, 2003; Stoddard and others, 2003; Kahl and others, 2004; Burns and others, 2006; McHale and others, 2017; Siemion and others, 2018). For the present study, only the most acidic streams—Winnisook, Tisons, and Rondout Creeks—showed significant decreasing trends in hydrogen-ion concentrations (fig. 19). Indeed, the decreased levels of acidity in Tisons and Rondout Creeks resulted in reductions in inorganic monomeric aluminum (a decrease of 0.08 and 0.07 micromole per liter per year (µmol/L/yr) for Tisons and Rondout Creeks, respectively). Base-cation concentrations decreased in streams across the region in response to reductions in sulfate concentrations (figs. 20 and 21). A similar response has been shown previously for the Catskill and Adirondack regions of New York State (Driscoll and others, 2001; Driscoll and others, 2003; Stoddard and others, 2003; Burns and others, 2006; McHale and others, 2017; Siemion and others, 2018). The reduced levels of acid anions in stream water require fewer base cations to balance the acidity. In base poor watersheds like the Neversink River watershed, stream water calcium concentrations decrease with decreasing sulfate concentrations; however, because little calcium is available, the decreases are typically small (Burns and others, 2006; McHale and others, 2017). The most acidic watersheds (Winnisook, Tisons, and Rondout Creeks) with the lowest calcium concentrations showed significant, though small, decreases in stream water calcium concentrations (fig. 20). The moderately acidic watersheds (Biscuit Brook and Batavia Kill near Maplecrest), with moderate calcium concentrations (compared to the other watersheds in the network), showed larger decreases in calcium concentrations. The least acidic watershed (Town Brook), with the highest calcium concentrations, showed no significant trends in calcium concentrations (fig. 20). However, calcium trend results were mixed among the sites with pH greater than 6.5 with some showing fairly large downward trends in calcium (Stony Clove and Red Falls) and others showing no significant trends (East Brook, Wolf Creek, Town Brook Tributary, and Town Brook).
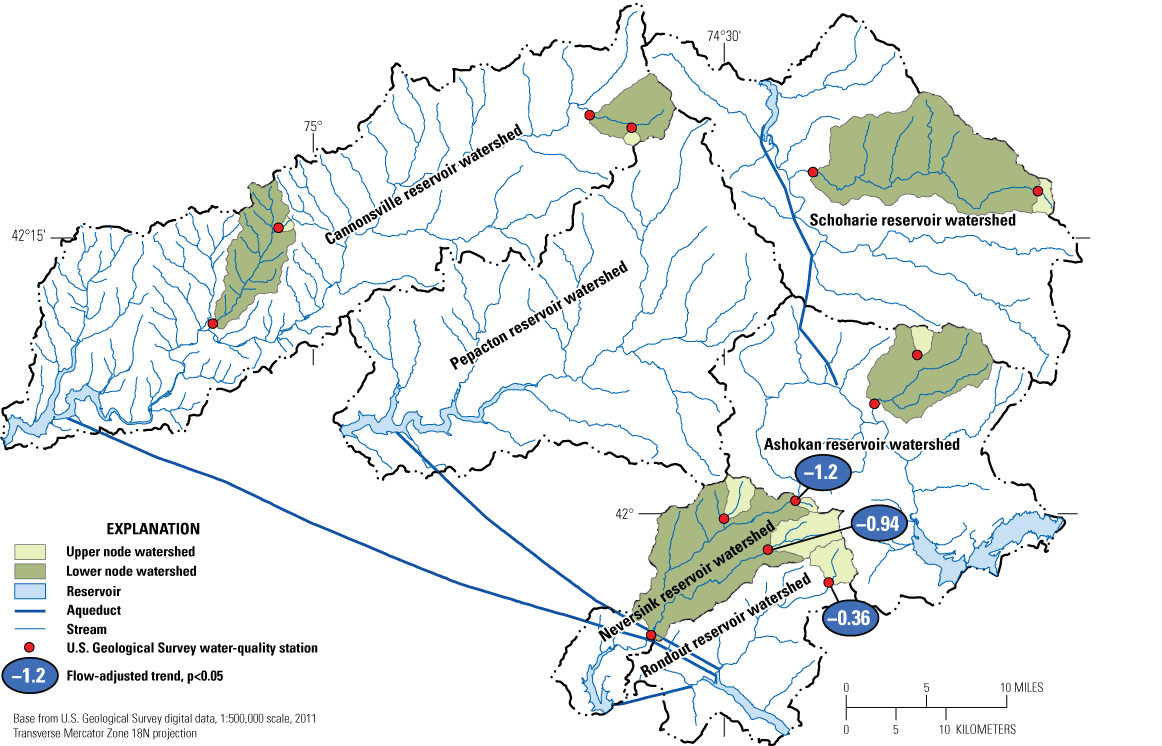
Slope of significant trends in hydrogen ion concentration, in microequivalents per liter per year, for water-quality stations in the Catskill and Delaware watersheds in New York, October 1, 1999, through September 30, 2009.
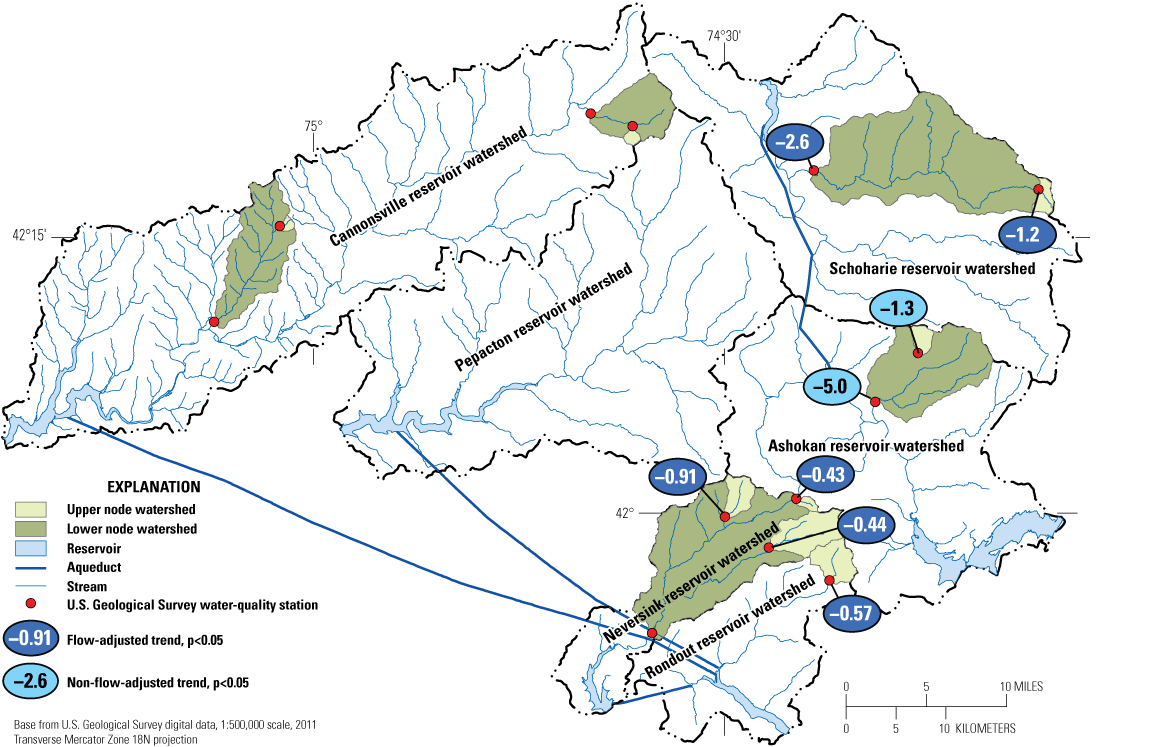
Slope of significant trends in calcium concentration, in microequivalents per liter per year, for water-quality stations in the Catskill and Delaware watersheds in New York, October 1, 1999, through September 30, 2009.
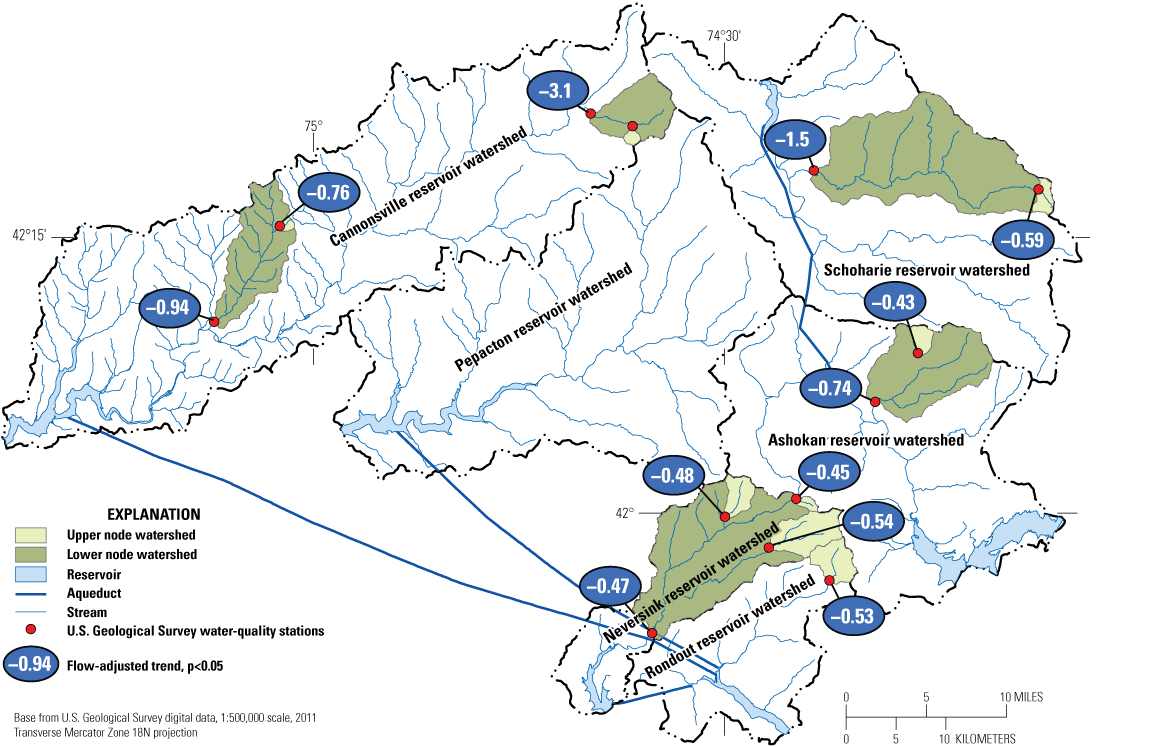
Slope of significant trends in magnesium concentration, in microequivalents per liter per year, for water-quality stations in the Catskill and Delaware watersheds in New York, October 1, 1999, through September 30, 2009.
During the study period, magnesium responded more consistently than calcium to reductions in stream water sulfate concentrations, and 12 of the 13 study watersheds showed significant decreasing trends in magnesium concentrations (fig. 21). Magnesium concentrations were several times lower than calcium concentrations in the study region (fig. 5; table 5), and the variability of magnesium concentrations was also much lower than calcium concentrations. The variability of concentrations appeared to have a strong influence on whether significant trends were measured at each station. For example, although the absolute change in calcium concentrations was greater at the stations with the highest calcium concentrations, the variability was also greater; therefore, the trends were not significant. The stations with lower calcium concentrations also had lower variability; therefore, the trends were significant. For magnesium, all of the trends decreased significantly because all of the stations, with the exception of Town Brook Tributary, had low concentrations and low variability. Stream water calcium and magnesium concentrations in the study region were related to surficial geology. The greatest calcium and magnesium concentrations were measured in areas with high percentages of glacial till (Red Falls and Town Brook) and the lowest concentrations were measured in areas with high percentages of bedrock outcrops (Winnisook, Tisons, and Rondout Creeks; figs. 2 and 5).
Acid neutralizing capacity is essentially the sum of all inorganic acidifying and buffering processes that take place in the watershed and in stream water; therefore, acid neutralizing capacity is often used to measure the recovery of acid-sensitive systems to reductions in acid deposition. Acid neutralizing capacity and the acidity of stream water (as expressed by pH) are related; therefore, the expectation is that the stations with trends in hydrogen ion concentration would also show trends in acid neutralizing capacity. At Winnisook and Tisons Creeks, which were the two most acidic stations with the largest decreasing trends in hydrogen ion (H+), acid neutralizing capacity increased at a similar rate as the decrease in H+ (figs. 19 and 22). Sulfate (fig. 18); calcium (fig. 20) and magnesium (fig. 21) all decreased and the sum of those changes amounted to an increase in acid neutralizing capacity at both stations, likely related to reductions in acid deposition in the region as has been suggested previously (Burns and others, 2006; McHale and others, 2017). At Stony Clove Creek, there was a fairly large decrease in acid neutralizing capacity despite a significant decrease in sulfate concentration (figs. 18 and 22). The decrease in acid neutralizing capacity at the Stony Clove Creek station appeared to be caused mainly by a significant increase in nitrate and a large decrease in calcium (figs. 20 and 23). Magnesium and sulfate also decreased at the Stony Clove Creek station although sulfate decreased at three times the rate of magnesium that contributed to the decrease in acid neutralizing capacity at the station. The cause of the nitrate increase was a large insect defoliation centered in the eastern Catskills during the mid-2000s. There was a small but statistically significant decrease in acid neutralizing capacity at the Batavia Kill station, a completely forested upper node (fig. 22). The cause of the decrease is unclear because the trends in anions and cations nearly balance one another. However, the watershed also experienced a partial insect defoliation that contributed to the increasing trend in nitrate (fig. 23) and likely also contributed to the decrease in acid neutralizing capacity. Wolf Creek showed a large increasing trend in acid neutralizing capacity that was coincident with a large decrease in chloride concentration; the reason for the decrease in chloride is not clear.
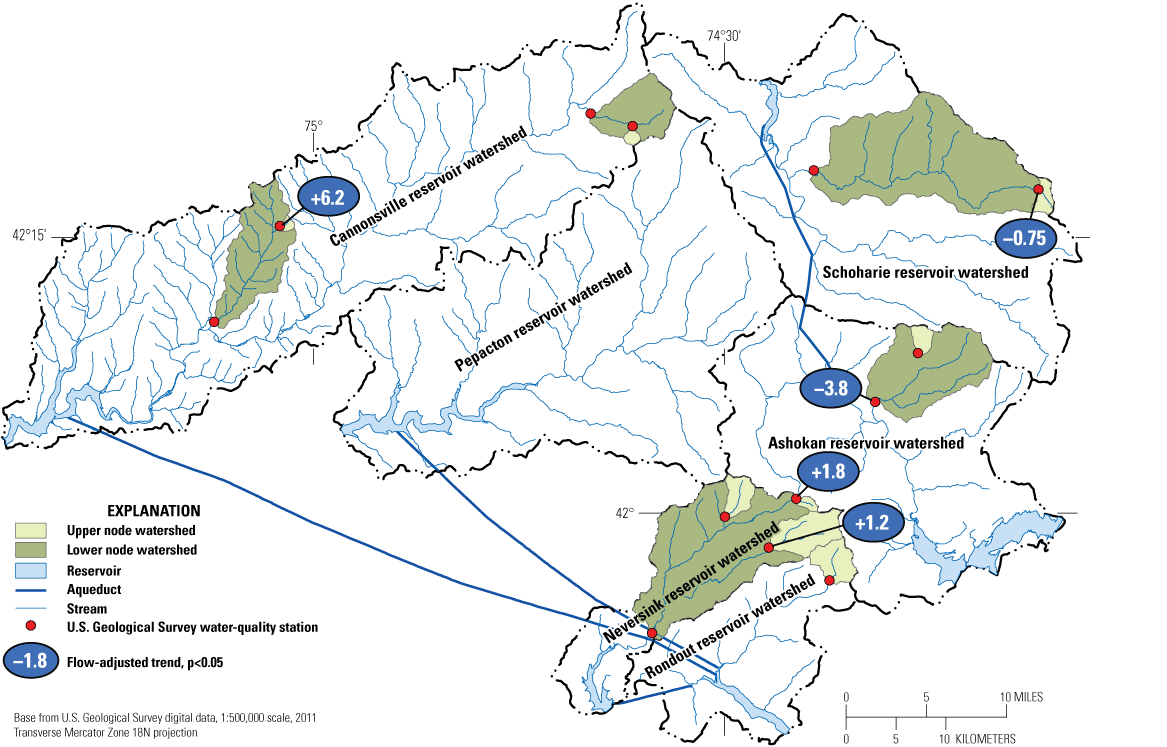
Slope of significant trends in acid neutralizing capacity, in microequivalents per liter per year, for water-quality stations in the Catskill and Delaware watersheds in New York, October 1, 1999, through September 30, 2009.
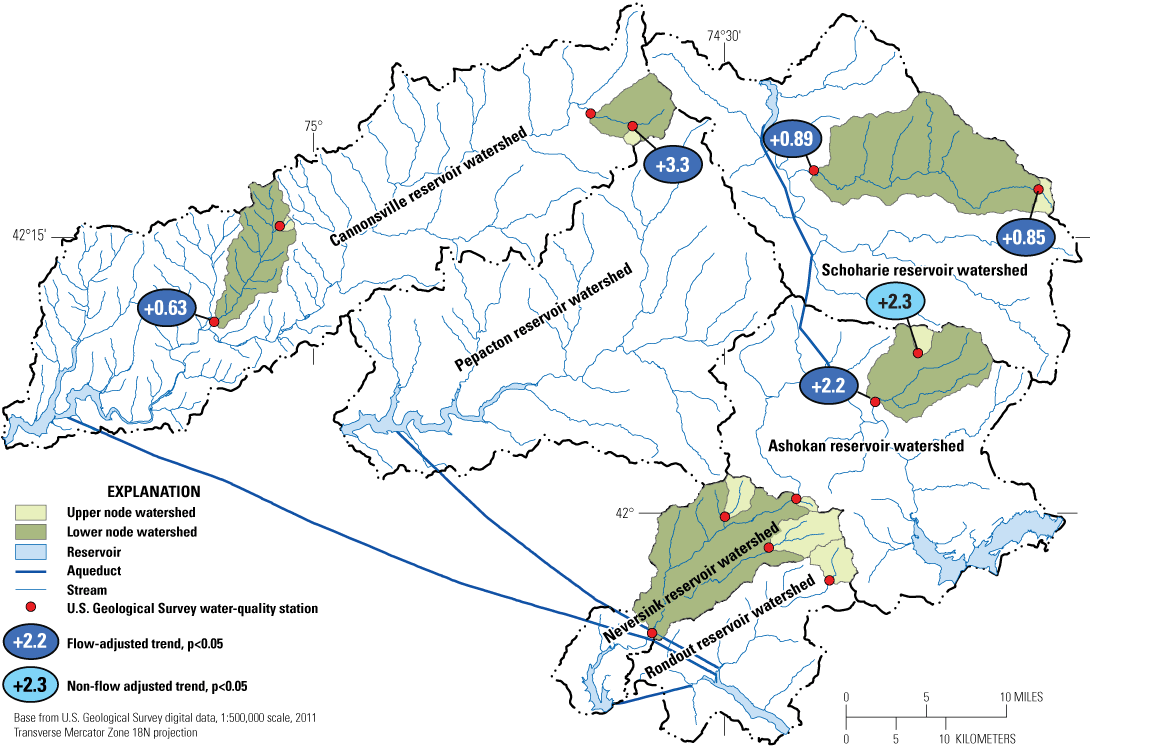
Slope of significant trends in nitrate concentration, in microequivalents per liter per year, for water-quality stations in the Catskill and Delaware watersheds in New York, October 1, 1999, through September 30, 2009.
There were increasing trends in stream nitrate concentrations in 6 of the study watersheds (fig. 23). The largest nitrate trend, which was likely caused by the selective forest harvest discussed in the previous section, was measured in the Town Brook Tributary watershed. Although the trend is reported for the 10-year study period, the increase in nitrate concentration at the Town Brook Tributary took place during the 3-year period following the harvest (2006–9). As discussed previously, there were also significant trends in nitrate concentrations in the eastern Catskills that coincided with watersheds that experienced the greatest amount of insect defoliation during the mid-2000s. The nitrate response lasted for about a 3-year period following the disturbance and was most pronounced at the Hollow Tree Brook and Stony Clove stations (fig. 9). The nitrate response coincided with the greatest amount of disturbance based on visual inspection of foliage throughout the Catskill and Delaware watersheds.
Dissolved organic carbon in surface water can be a concern for several reasons. The first reason is that DOC concentrations are related to the formation of carcinogenic disinfection byproducts when drinking water is chlorinated (Stevens and others, 1976). DOC can also affect the color of the water, which affects the penetration of light and therefore the primary productivity in streams and surface-water bodies (Keller and others, 2003; Burns and others, 2006). Dissolved organic carbon is also a form organic acidity that can affect stream water pH and acid neutralizing capacity (Kullberg and others, 1993; Burns and others, 2006). Burns and others (2006) documented increasing trends in DOC concentrations in the 4 study stations in the Neversink River watershed and Rondout Creek for the period of 1992 to 2001. The mean slope of the DOC trend line for the five watersheds was 4.7 µmol/L/yr (Burns and others, 2006). In contrast, no significant positive trends were detected in DOC concentrations at any of the study stations between 1999 and 2009 (fig. 24). In fact, two of the stations (Neversink River and Town Brook) showed decreasing trends in DOC concentrations during the study. The increasing DOC trends reported by Burns and others (2006) appear to have been influenced by increasing concentrations early in the study period that did not persist.
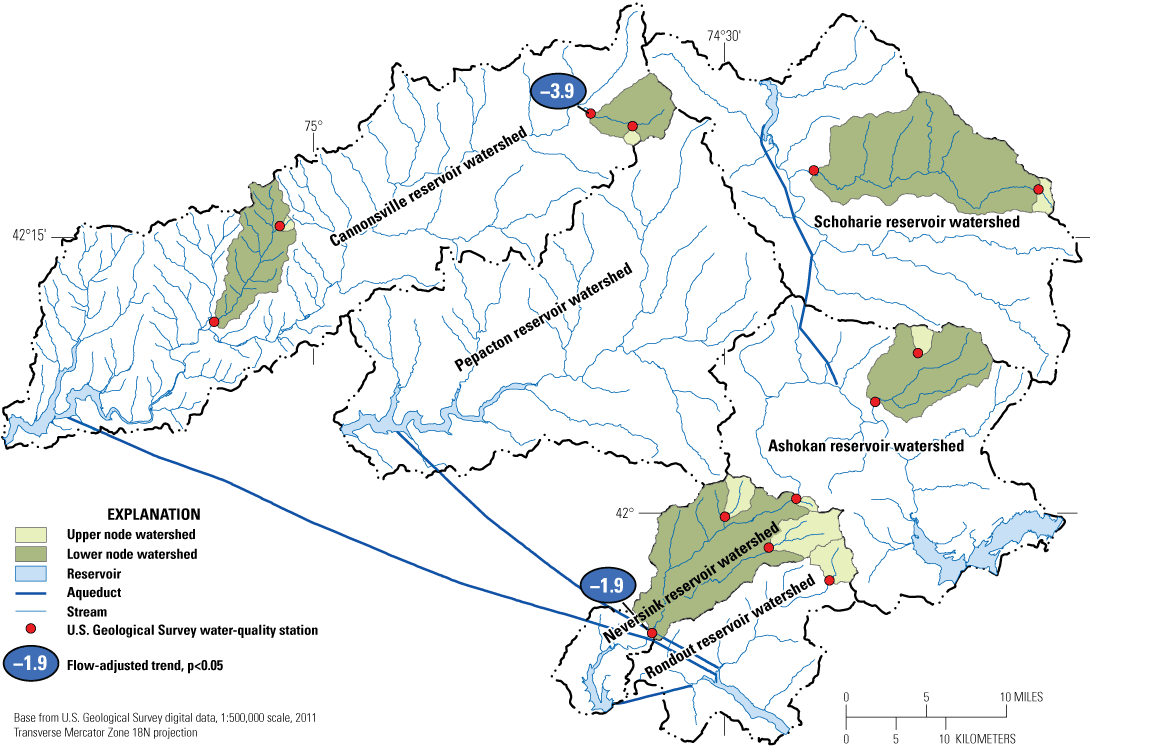
Slope of significant trends in dissolved organic carbon concentration, in micromoles per liter per year, for water-quality stations in the Catskill and Delaware watersheds in New York, October 1, 1999, through September 30, 2009.
Results indicated a marked difference in sodium and chloride trends between upper and lower node stations (figs. 25 and 26). Of the eight upper node stations, seven stations showed decreasing trends in sodium concentrations and none showed increasing trends. Of the five lower node stations, three showed increasing sodium trends (fig. 25), and none showed decreasing trends. Similarly, all of the upper node stations showed decreasing chloride trends, whereas increasing trends were calculated for two of the five lower node stations (fig. 26). One lower node station, Town Brook, had a significant decreasing trend in chloride. The results indicated that background concentrations of sodium and chloride, as represented by the upper node stations, decreased across the region; however, intervening land use between upper and lower nodes generally negated or reversed those trends. Increasing trends in sodium and chloride have been reported previously for a small rural watershed in the region (Kelly and others, 2008). In that small rural watershed, much of the increase in concentration through time was attributed to a buildup of sodium and chloride in the shallow groundwater system. The buildup of sodium and chloride was caused by long-term road salt use that contributed to increases in base-flow concentrations of sodium and chloride rather than by an increase in use of road salt through time.
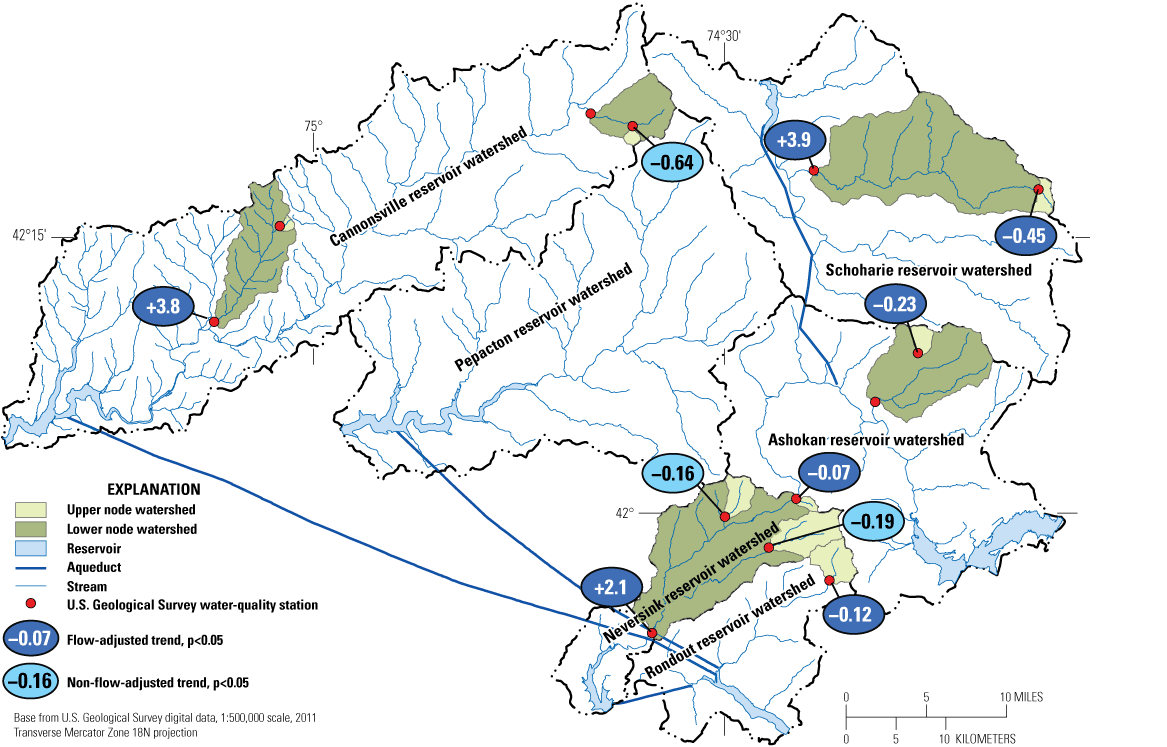
Slope of significant trends in sodium concentration, in microequivalents per liter per year, for water-quality stations in the Catskill and Delaware watersheds in New York, October 1, 1999, through September 30, 2009.
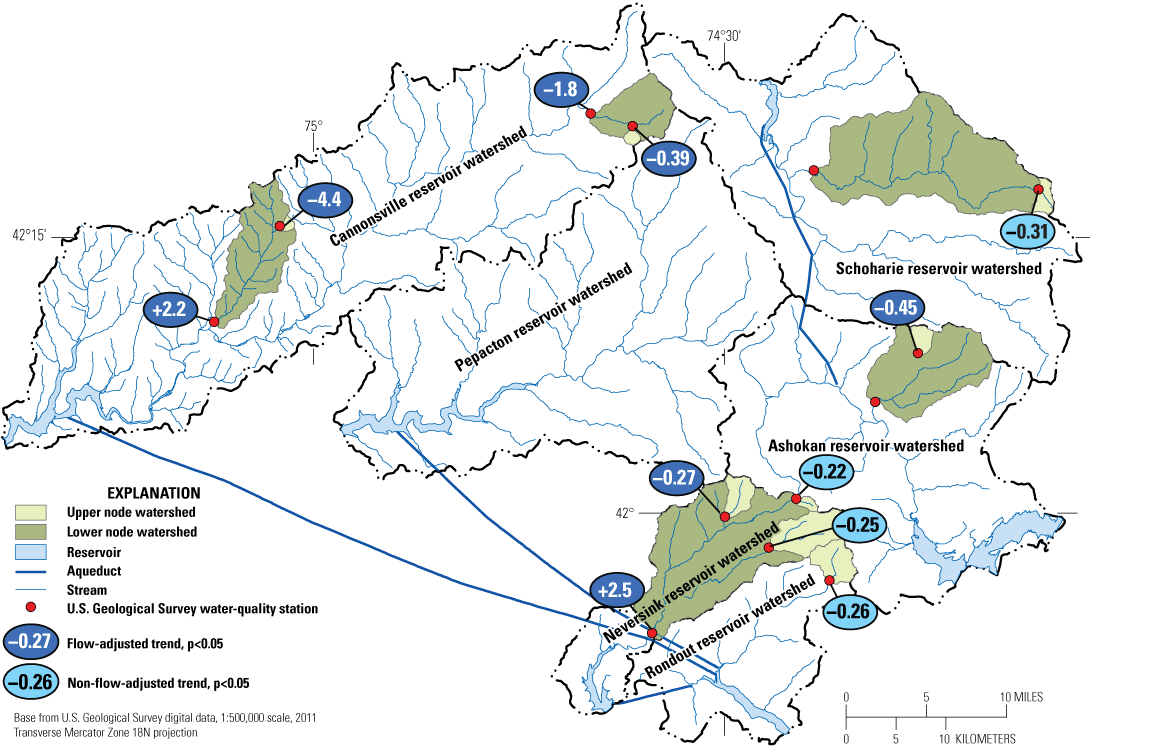
Slope of significant trends in chloride concentration, in microequivalents per liter per year, for water-quality stations in the Catskill and Delaware watersheds in New York, October 1, 1999, through September 30, 2009.
For the watersheds included in this study, the contrast between increasing sodium and chloride concentrations at lower nodes and decreasing concentrations at upper nodes indicates that the trends are also probably caused by road salt application. The increasing trends in sodium and chloride concentrations at the Neversink River station, where road salt application is one of the primary human influences, supports this inference. The highest concentrations of sodium and chloride for individual samples were measured during low flow conditions at the Neversink River and Red Falls stations; however, even the highest concentrations of chloride (40 to 65 mg/L) were well below the EPA drinking water standard (250 mg/L for chloride). Sodium concentrations exceeded the EPA drinking water standard (20 mg/L) twice during the study at the Red Falls station; however, dilution of that stream water when it entered the Schoharie Reservoir eliminated any human health concern.
There were three statistically significant non-discharge-adjusted trends for phosphorus concentrations (data not shown). The Batavia Kill station had a slightly increasing trend in TDP of 0.003 microequivalent per liter per year (µeq/L/yr); the Stony Clove station had an increasing TDP concentration of 0.03 µeq/L/yr and the Wolf Creek station had an increasing TDP concentration of 0.02 µeq/L/yr. Discharge-adjusted trends in phosphorus concentrations were only significant within the Town Brook and the Hollow Tree Brook watersheds (data not shown). There was a small, but statistically significant increasing trend in TDP for the Hollow Tree Brook station of 0.006 µeq/L/yr. At the Town Brook Tributary station there was an increasing discharge-adjusted trend in TP concentration of 0.045 µeq/L/yr. The trend probably was related to the selective harvest that mobilized sediment for about a year following the harvest (see the “Sediment and Turbidity” section). There was no significant trend in TDP at the Town Brook Tributary station. Downstream at the Town Brook station, there was no significant trend in TP, but there was a significant decreasing trend in TDP of 0.022 µeq/L/yr. The WAP implemented a series of whole farm plans and agricultural best management practices within the Town Brook watershed during the study period. The farm plans and best management practices included re-routing milk-house waste from discharging into streams to vegetative filter strips, fencing stream corridors to limit livestock access to streams, making improvements to barnyards, routing barnyard runoff away from streams, better rotation of crops, planting winter cover crops in corn fields, and establishing riparian buffer strips around streams. The improvements appear to have had a positive effect on water quality in the Town Brook watershed. A reduction of 0.022 µeq/L/yr equates to 0.007 mg/L during the 10-year study period, a reduction of about a third of the median TDP concentration in Town Brook.
Sediment and Turbidity
Suspended sediment and turbidity are a particular concern for the New York City water supply. The strategies for reducing sediment loads and turbidity levels in New York City’s drinking water reservoirs differ from mitigation strategies for other water-quality parameters. New York State Department of Health (2017) set specific criteria for NYCDEP to control turbidity within the Catskill water supply watershed (New York State Department of Health, 2017). The Ashokan Reservoir is a particular focus of concern because of high SSC and turbidity in watershed streams and within the Ashokan Reservoir (New York City Department of Environmental Protection, 2008). The NYCDEP is engaging in several actions to reduce turbidity in the upper Esopus Creek watershed that supplies water to the Ashokan Reservoir (New York City Department of Environmental Protection, 2008, 2017). Turbidity is identified as a source of water-quality impairment in the Upper Esopus Creek Management Plan (Cornell Cooperative Extension Ulster County, New York City Department of Environmental Protection, and U.S. Army Engineer Research Development Center, 2007) because turbidity is aesthetically unpleasing, reduces the effectiveness of drinking water disinfection, and may indicate elevated levels of bacteria and viruses. The three sources of turbidity to the upper Esopus Creek are The Shandaken Tunnel, which delivers water from the Schoharie Reservoir to Esopus Creek; surface runoff from terrestrial portions of the watershed; and stream bank and stream bed erosion. One of the primary sources of turbidity in the Schoharie and Ashokan watersheds is believed to be erosion of clay-rich sediments from glacial lake deposits.
The Stony Clove station consistently had the highest SSC and turbidity levels of any of the six sediment monitoring stations (figs. 27 to 32). In the Batavia Kill and Town Brook watersheds, the forested upper nodes had similar ranges in SSC and turbidity to those measured at the lower node stations (figs. 27 to 30); however, high SSC and turbidity levels were measured at the lower node stations more frequently. In contrast, the Hollow Tree Brook upper node station had a much lower range in SSC and turbidity than the corresponding lower node, Stony Clove Creek (figs. 31 and 32). The results indicated that much of the sediment and turbidity measured at the Stony Clove station is generated within the stream valley rather than in the forested uplands. In fact, the Stony Clove stream management plan (Greene County Soil and Water Conservation District and New York City Department of Environmental Protection, 2005) identified several areas of considerable bank erosion along Stony Clove Creek that prompted the NYCDEP to initiate the Lanesville Stream Stabilization Project within the watershed in 2003, which was completed in 2005. The goal of the project was to stabilize a 1,700-ft-long stream reach and develop a stable channel slope to decrease bank erosion and ultimately decrease SSC and turbidity in Stony Clove Creek. Minor repairs were made to the project in 2008 after a series of large storms and high stream discharge took place during 2005–06. A large increase in SSC and turbidity was measured at the Stony Clove station during 2006–08 (fig. 32). By 2008, concentrations returned to pre-2005 levels and continued to decrease in 2009 (fig. 32).
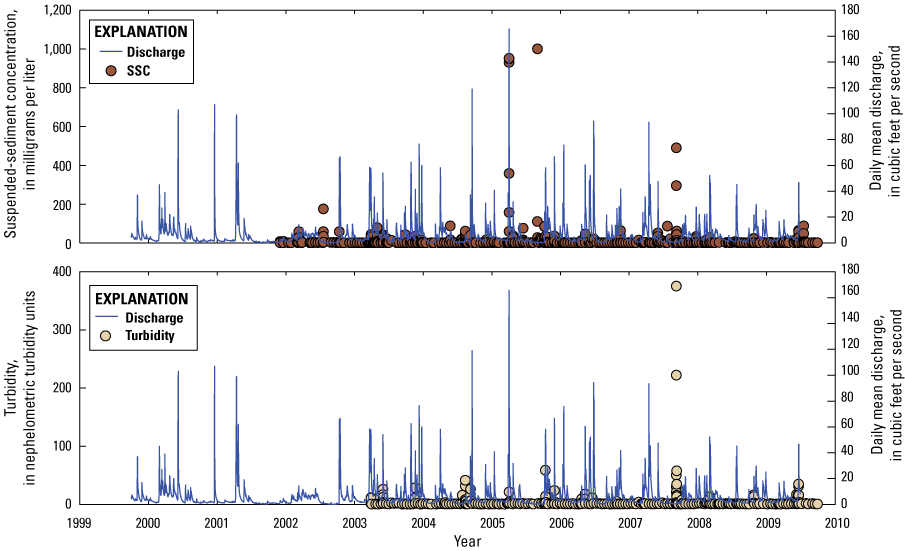
Suspended-sediment concentration (SSC), turbidity, and daily mean discharge at the Batavia Kill near Maplecrest, N.Y., station, October 1, 1999, through September 30, 2009.
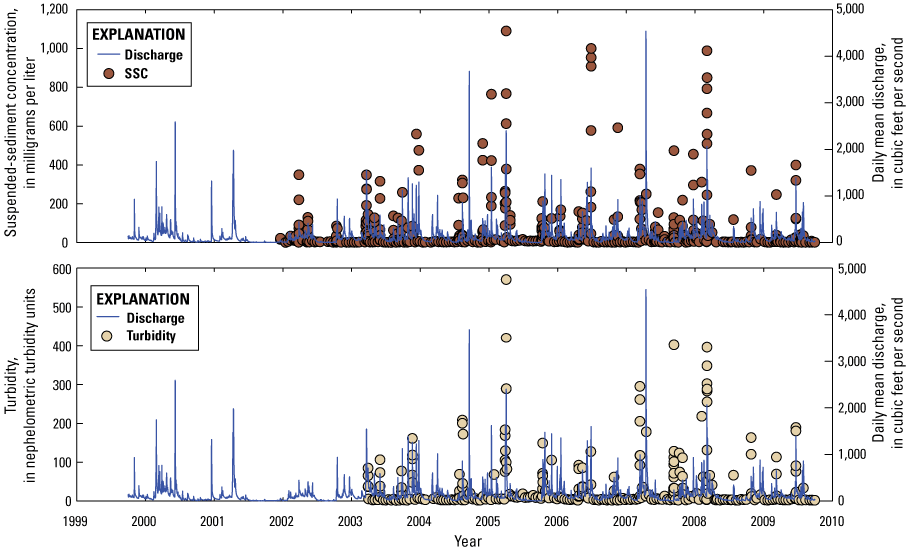
Suspended-sediment concentration (SSC), turbidity, and daily mean discharge for Batavia Kill at the Red Falls near Prattsville, N.Y., station, October 1, 1999, through September 30, 2009.
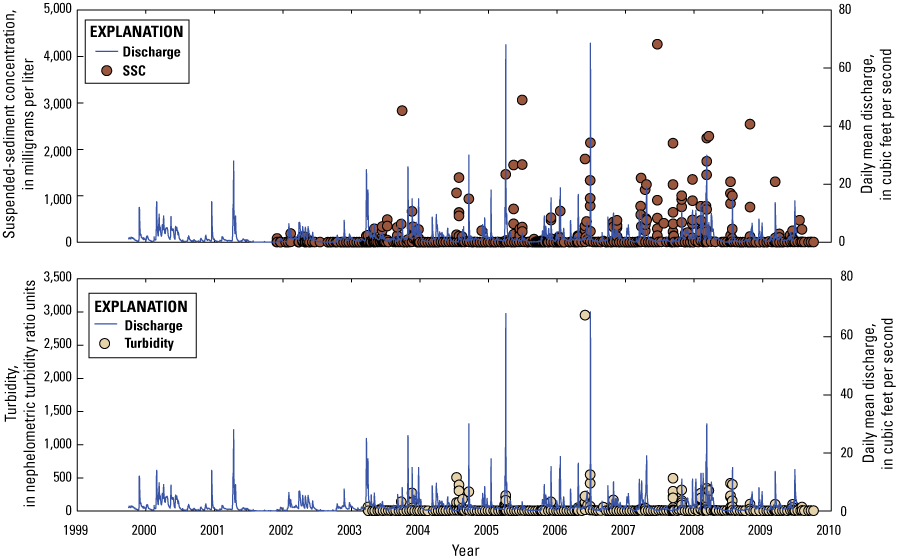
Suspended-sediment concentration (SSC), turbidity, and daily mean discharge at the Town Brook tributary southeast of Hobart, N.Y., station, October 1, 1999, through September 30, 2009.
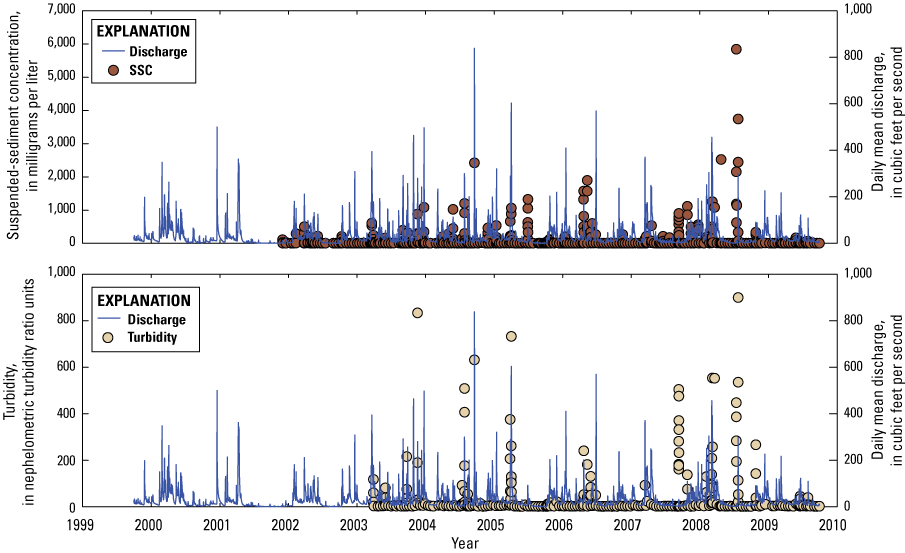
Suspended-sediment concentration (SSC), turbidity, and daily mean discharge at the Town Brook southeast of Hobart, N.Y., station, October 1, 1999, through September 30, 2009.
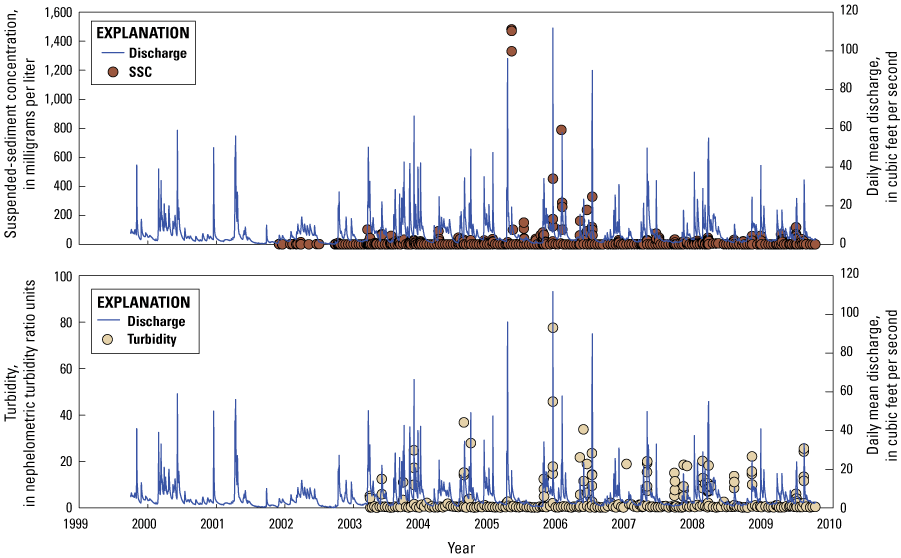
Suspended-sediment concentration (SSC), turbidity, and daily mean discharge for Hollow Tree Brook at Lanesville, N.Y., station, October 1, 1999, through September 30, 2009.
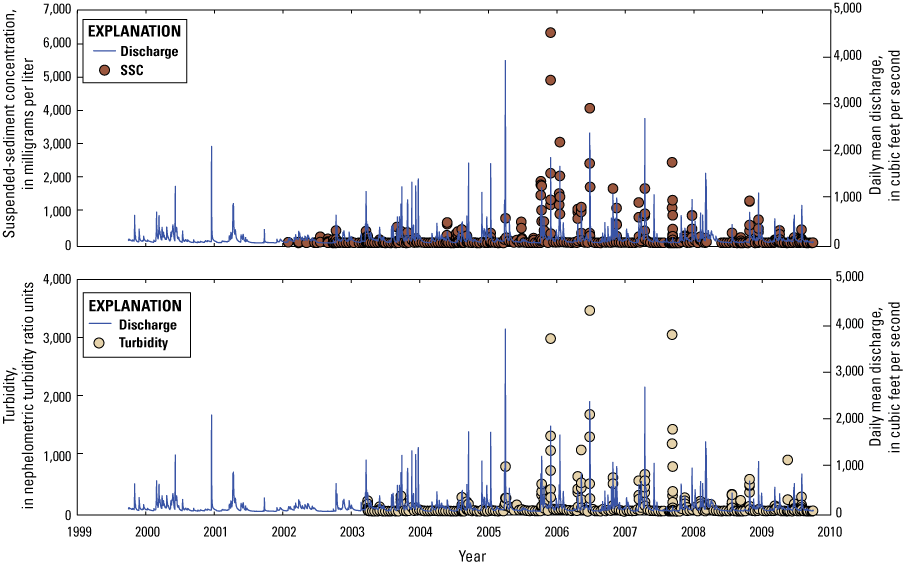
Suspended-sediment concentration (SSC), turbidity, and daily mean discharge at the Stony Clove below Ox Clove at Chichester, N.Y., station, October 1, 1999, through September 30, 2009.
A recent study used dynamic linear modeling and data from the upper Esopus Creek watershed, to which Stony Clove is a tributary, to investigate the changing relation between SSC and discharge through time (Ahn and others, 2017). The study concluded that large storms were typically followed by periods of months when turbidity was elevated and then gradually decreased. The results of that research suggest that the decreases in SSC and turbidity in Stony Clove Creek from 2006 to 2009 should probably be described as the typical response of the watershed after a large storm rather than as a result of the Lanesville Stream Stabilization Project. However, since the completion of data collection for the current study, additional research has shown a significant decrease of SSC and sediment loads within the Stony Clove watershed following additional stream stabilization projects within the Stony Clove Creek watershed (Siemion and others, 2016). Monitoring of SSC and turbidity is ongoing within the Stony Clove watershed and throughout the upper Esopus Creek watershed and additional stream stabilization projects are planned to further reduce SSC and turbidity (New York City Department of Environmental Protection, 2017).
Sediment-discharge relations were calculated for the six SSC monitoring stations and significant relations (p<0.05) were detected at the three lower node stations (Red Falls, Town Brook, and Stony Clove). Red Falls and Stony Clove had no censored SSC values and Town Brook had only 13 of 473 censored values or less than 3 percent. The strongest relation was detected at the Red Falls station (r2=0.73; p<0.05), for Stony Clove the relation was not as strong (r2=0.54; p<0.05), whereas at Town Brook the relation was rather weak (r2=0.27; p<0.05). At two of the upper node stations, Batavia Kill at Maplecrest and Hollow Tree Brook, SSC varied little through a wide range in discharge (figs. 27 and 31); therefore, no relation between discharge and SSC was determined. The Town Brook Tributary and Town Brook stations had similar ranges in SSC; however, at the upper node Town Brook Tributary station, SSC and discharge were poorly related. Before the selective harvest, SSC at the Town Brook Tributary was consistently low with only a few samples exceeding 500 mg/L. However, after the selective harvest in 2006, SSC exceeded 500 mg/L more frequently, particularly in response to storms, although the effect diminished through time (fig. 29). Throughout the period of record, the change in the relation between discharge and SSC at the Town Brook Tributary station contributed to the poor relation between discharge and SSC. A wide range in SSC during low flow conditions at the Town Brook station probably related to agricultural activity in the watershed. Although there were changes in SSC at Town Brook Tributary and at all three lower node stations during the period of record, no significant trends in SSC were detected at any of the stations. These poor relations between discharge and SSC (no r2 value greater than 0.73 for any of stations) are likely a result of the dynamic relation between SSC and discharge through time and in response to natural- and human-induced disturbance (Ahn and others, 2017).
Turbidity is a constituent of regulation within the New York City water supply; therefore, there is a strong incentive to decrease turbidity levels within the Catskill and Delaware watersheds. Turbidity control, particularly within the Catskill watershed, is a primary goal of the Schoharie and Esopus Watershed Management Plans (Cornell Cooperative Extension Ulster County, New York City Department of Environmental Protection, and U.S. Army Engineer Research Development Center, 2007). Of the six streams monitored for this study, five had significant linear relations between discharge and turbidity; however, only Batavia Kill at Red Falls had an r2 value greater than 0.5 (r2=0.66; p<0.001). The relation was not significant for the Town Brook Tributary and the r2 was only 0.07 at Batavia Kill at Maplecrest. The other three stations all had r2 values close to 0.4 (p<0.001). Stony Clove Creek had the highest turbidity levels; however, there was not a strong relation between turbidity and discharge at the station because high turbidity levels were often measured at low flows (fig. 32). The frequency that high turbidity levels were measured at low flows in Stony Clove Creek indicate that there are chronic sources of turbidity to the stream that contribute turbidity to the stream during all flow conditions. These sources of SSC and turbidity have been identified as stream bank failures often related to exposures of glaciolacustrine sediments in the stream bed and banks (Greene County Soil and Water Conservation District and New York City Department of Environmental Protection, 2005; Cornell Cooperative Extension Ulster County, New York City Department of Environmental Protection, and U.S. Army Engineer Research Development Center, 2007). The presence of in-stream turbidity sources that act as sources of turbidity during low flow make discharge a poor predictor of turbidity levels. Since the completion of data collection for this study, eight stream stabilization projects have been completed within the Stony Clove watershed and decreases in SSC and turbidity have been documented at the Stony Clove Creek station (Siemion and others, 2016).
The relations between SSC and turbidity were significant for every station at p<0.001. The relations were strongest in the Batavia Kill watershed. The Batavia Kill at Maplecrest station had an r2 value of 0.78 and Red Falls had an r2 of 0.91. The relations between SSC and turbidity were also strong for the Stony Clove watershed. Hollow Tree Brook had an r2 of 0.55 and Stony Clove had an r2 of 0.78. The relations between SSC and turbidity were significant for the Town Brook stations; however, the relations were not as strong as the other stations. Town Brook Tributary had an r2 of 0.32 and Town Brook had an r2 of 0.46. Agricultural land use and forest harvesting, which both involve sediment disturbance, may have introduced more variability in the relations between SSC and turbidity than was measured at the other stations.
Conclusions
Land use cannot be considered independently of other factors affecting water quality in the Catskill and Delaware watersheds of the New York City water supply system. In the Catskill and Delaware watersheds surficial geology exerted a strong influence on water quality in streams throughout the region. Areas of glacial till are among the most productive soils in the Catskill region. The amount of agricultural land use has diminished in the Catskill region during the last 100 years and the remaining agriculture has concentrated in the Cannonsville and Pepacton Reservoir watersheds which contain the most productive soils in the Catskill and Delaware watersheds. The results of this study indicate that watershed management activities in the Catskill and Delaware watersheds have had a positive effect on surface-water quality in the region. Stream water TDP concentrations significantly decreased during 2000–09 in the Town Brook watershed where a series of agricultural best management practices were implemented. Results indicate no significant decrease in SSC in the Stony Clove watershed based on a seasonal Kendall test. A series of large storms during a 2-year period caused a large increase in SSC and turbidity in the Stony Clove watershed for nearly 2 years and then SSC and turbidity slowly returned to pre-storm levels. The decrease in SSC and turbidity following those storms could not be attributed to a stream stabilization project implemented during the study, but a series of subsequent stream stabilization projects appear to have resulted in a decrease in SSC, turbidity, and suspended-sediment loads (Siemion and others, 2016).
Stream water acidity decreased in the most acidic watersheds indicating continued improvements related to reduced levels of atmospheric deposition. Stream water sulfate concentrations decreased significantly in every study watershed; however, only the most acidic streams showed decreases in hydrogen ion concentrations. Sodium and chloride concentrations increased during the study period in watersheds with roads, which may be a cause for concern in the future if concentrations continue to increase. There was a wide range in steam water chemistry among the forested study watersheds that was related to surficial geology and past land use. These factors must be taken into account when interpreting stream water chemistry even in watersheds that currently have the same land use. The 100-percent forested Town Brook Tributary watershed had the second highest TP and TDP concentrations of any of the study watersheds indicating that previously agricultural watersheds may leach phosphorus for many decades after farming has ceased. Legacy phosphorus leaching from past agricultural watersheds may be a cause for concern in the Catskill and Delaware watersheds because there is a large amount of previously agricultural land in the region and the highest TDP concentrations in Town Brook Tributary were measured during low flow. High dissolved phosphorus concentration during summer low flows could contribute to algal blooms in water supply reservoirs. In general, water quality in the Catskill and Delaware watersheds improved and watershed management activities appear to have had a positive effect on water quality.
Although this study shows the value of targeted monitoring of watershed management activities to evaluate the effectiveness of the management strategies, the study also demonstrates the value of a more broadly based monitoring strategy. Watershed disturbances may or may not be caused by humans, are often unexpected, and typically cannot be controlled; for instance, insect infestations, fire, large destructive storms, and long-term changes in climate. A baseline of water quality must be established before the disturbances occur to evaluate the effect of the disturbance and the recovery of the ecosystem following the disturbance. Although short-term base-flow surveys across the Catskill and Delaware watersheds are an excellent, inexpensive method to describe the quality of water throughout the watershed, long-term storm-based sampling was needed to track trends in water quality through time and evaluate the effect of land use on water quality through the range in discharge experienced in the Catskill and Delaware watersheds.
References Cited
Ahn, K.-H., Yellen, B., and Steinschneider, S., 2017, Dynamic linear models to explore time-varying suspended sediment-discharge rating curves: Water Resources Research, v. 53, p. 4802–4820. [Also available at https://doi.org/10.1002/2017WR020381.]
Arscott, D.B., Dow, C.L., and Sweeney, B.W., 2006, Landscape template of New York City’s drinking-water-supply watersheds: Journal of the North American Benthological Society, v. 25, no. 4, p. 867–886. [Also available at https://doi.org/10.1899/0887-3593(2006)025[0867:LTONYC]2.0.CO;2.]
ASTM International, 2013, Standard test methods for determining sediment concentration in water samples: ASTM International D3977–97, 7 p., accessed June 22, 2020, at https://www.astm.org/Standards/D3977.htm.
Auer, M.T., Tomasoski, K.A., Babiera, M.J., Needham, M.L., Effler, S.W., Owens, E.M., and Hansen, J.M., 1998, Phosphorus bioavailability and P-cycling in Cannonsville Reservoir: Journal of Lake and Reservoir Management, v. 14, no. 2-3, p. 278–289. [Also available at https://doi.org/10.1080/07438149809354337.]
Baldigo, B.P., and Lawrence, G.B., 2000, Composition of fish communities in relation to stream acidification and habitat in the Neversink River, New York: Transactions of the American Fisheries Society, v. 129, no. 1, p. 60–76. [Also available at https://doi.org/10.1577/1548-8659(2000)129<0060:COFCIR>2.0.CO;2.]
Baldigo, B.P., and Murdoch, P.S., 1997, Effect of stream acidification and inorganic aluminum on mortality of brook trout (Salvelinus fontinalis) in the Catskill Mountains, New York: Canadian Journal of Fisheries and Aquatic Sciences, v. 54, no. 3, p. 603–615. [Also available at https://doi.org/10.1139/f96-314.]
Baldigo, B.P., Murdoch, P.S., and Burns, D.A., 2005, Stream acidification and mortality of brook trout (Salvelinus fontinalis) in response to timber harvest in Catskill Mountain watersheds, New York, USA: Canadian Journal of Fisheries and Aquatic Sciences, v. 62, no. 5, p. 1168–1183. [Also available at https://doi.org/10.1139/f05-022.]
Bishop, P.L., Hively, W.D., Stedinger, J.R., Rafferty, M.R., Lojpersberger, J.L., and Bloomfield, J.A., 2005, Multivariate analysis of paired watershed data to evaluate agricultural best management practice effects on stream water phosphorus: Journal of Environmental Quality, v. 34, no. 3, p. 1087–1101. [Also available at https://doi.org/10.2134/jeq2004.0194.]
Bott, T.L., Montgomery, D.S., Arscott, D.B., and Dow, C.L., 2006, Primary productivity in receiving reservoirs—Links to influent streams: Journal of the North American Benthological Society, v. 25, no. 4, p. 1045–1061. [Also available at https://doi.org/10.1899/0887-3593(2006)025[1045:PPIRRL]2.0.CO;2.]
Brakke, D.F., Landers, D.H., and Eilers, J.M., 1988, Chemical and physical characteristics of lakes in the northeastern United States: Environmental Science & Technology, v. 22, no. 2, p. 155–163. [Also available at https://doi.org/10.1021/es00167a004.]
Bryant, R.B., Veith, T.L., Kleinman, P.J.A., and Gburek, W.J., 2008, Cannonsville Reservoir and Town Brook watersheds—Documenting conservation efforts to protect New York City’s drinking water: Journal of Soil and Water Conservation, v. 63, no. 6, p. 339–344. [Also available at http://https://doi.org/10.2489/jswc.63.6.339.]
Burns, D.A., Klaus, J., and McHale, M.R., 2007, Recent climate trends and implications for water resources in the Catskill Mountain region, New York, USA: Journal of Hydrology (Amsterdam), v. 336, no. 1–2, p. 155–170. [Also available at https://doi.org/10.1016/j.jhydrol.2006.12.019.]
Burns, D.A., McHale, M.R., Driscoll, C.T., and Roy, K.M., 2006, Response of surface water chemistry to reduced levels of acid precipitation—Comparison of trends in two regions of New York, USA: Hydrological Processes, v. 20, no. 7, p. 1611–1627. [Also available at https://doi.org/10.1002/hyp.5961.]
Cadwell, D.H., ed., 1989, Surficial geologic map of New York: New York State Museum and Science Service Map and Chart Series 40, scale 1:25,000. [Also available at http://www.nysm.nysed.gov/staff-publications/surficial-geologic-map-new-york.]
Carpenter, S.R., Bolgrien, D., Lathrop, R.C., Stow, C.A., Reed, T., and Wilson, M.A., 1998, Ecological and economic analysis of lake eutrophication by nonpoint pollution: Australian Journal of Ecology, v. 23, no. 1, p. 68–79. [Also available at https://doi.org/10.1111/j.1442-9993.1998.tb00706.x.]
Cornell Cooperative Extension Ulster County, New York City Department of Environmental Protection, and U.S. Army Engineer Research Development Center, 2007, Upper Esopus Creek management plan: Cornell Cooperative Extension technical report, 225 p. [Also available at https://ashokanstreams.org/publications-resources/stream-management-plans/.]
Dow, C.L., Arscott, D.B., and Newbold, J.D., 2006, Relating major ions and nutrients to watershed conditions across a mixed-use, water-supply watershed: Journal of the North American Benthological Society, v. 25, no. 4, p. 887–911. [Also available at https://doi.org/10.1899/0887-3593(2006)025[0887:RMIANT]2.0.CO;2.]
Driscoll, C.T., Driscoll, K.M., Mitchell, M.J., and Raynal, D.J., 2003, Effects of acidic deposition on forest and aquatic ecosystems in New York State: Environmental Pollution, v. 123, no. 3, p. 327–336. [Also available at https://doi.org/10.1016/S0269-7491(03)00019-8.]
Driscoll, C.T., Lawrence, G.B., Bulger, A.J., Butler, T.J., Cronan, C.S., Eagar, C., Lambert, K.F., Likens, G.E., Stoddard, J.L., and Weathers, K.C., 2001, Acidic deposition in the northeastern United States—Sources and inputs, ecosystem effects, and management strategies: Bioscience, v. 51, no. 3, p. 180–198. [Also available at https://doi.org/10.1641/0006-3568(2001)051[0180:ADITNU]2.0.CO;2.]
Dubrovsky, N.M., Burow, K.R., Clark, G.M., Gronberg, J.A.M., Hamilton, P.A., Hitt, K.J., Mueller, D.K., Munn, M.D., Nolan, B.T., Puckett, L.J., Rupert, M.G., Short, T.M., Spahr, N.E., Sprague, L.A., and Wilbur, W.G., 2010, The quality of our nation’s water—Nutrients in the nation’s streams and groundwater, 1992–2004: U.S. Geological Survey Circular 1350, 174 p., accessed July 20, 2020, at https://doi.org/10.3133/cir1350.
Fishman, M.J., 1993, Methods of analysis by the U.S. Geological Survey National Water Quality Laboratory; determination of inorganic and organic constituents in water and fluvial sediments: U.S. Geological Survey Open-File Report 93–125, 217 p., accessed July 20, 2020, at https://doi.org/10.3133/ofr93125.
Gburek, W.J., and Sharpley, A.N., 1998, Hydrologic controls on phosphorus loss from upland agricultural watersheds: Journal of Environmental Quality, v. 27, no. 2, p. 267–277. [Also available at https://doi.org/10.2134/jeq1998.00472425002700020005x.]
Greene County Soil and Water Conservation District and New York City Department of Environmental Protection, 2005, The Stony Clove Creek stream management plan: Greene County Soil and Water Conservation District and New York City Department of Environmental Protection web page, accessed December 11, 2014, at http://www.catskillstreams.org/stonyclovesmp.html.
Guy, H.P., 1969, Laboratory theory and methods for sediment analysis: U.S. Geological Survey Techniques of Water-Resources Investigations, book 5, chap. C1, 58 p., accessed July 20, 2020, at https://doi.org/10.3133/twri05C1.
Henshaw, J.M., Lewis, T.E., and Heithmar, E.M., 1988, A semi-automated colorimetric method for the determination of monomeric aluminum species in natural waters by flow injection analysis: International Journal of Environmental Analytical Chemistry, v. 34, no. 2, p. 119–135. [Also available at https://doi.org/10.1080/03067318808027410.]
Hirsch, R.M., Slack, J.R., and Smith, R.A., 1982, Techniques of trend analysis for monthly water quality data: Water Resources Research, v. 18, no. 1, p. 107–121, accessed July 20, 2020, at https://doi.org/10.1029/WR018i001p00107.
Homer, C.G., Dewitz, J., Fry, J., Coan, M., Hossain, N., Larson, C., Herold, N., McKerrow, A., VanDriel, J.N., and Wickham, J., 2007, Completion of the 2001 national land cover database for the conterminous United States: Photogrammetric Engineering and Remote Sensing, v. 73, no. 4, p. 337–341. [Also available at http://citeseerx.ist.psu.edu/viewdoc/download?doi=10.1.1.515.7961&rep=rep1&type=pdf.]
Jarvie, H.P., Sharpley, A.N., Spears, B., Buda, A.R., May, L., and Kleinman, P.J.A., 2013, Water quality remediation faces unprecedented challenges from “legacy phosphorus”: Environmental Science & Technology, v. 47, no. 16, p. 8997–8998. [Also available at https://doi.org/10.1021/es403160a.]
Johnson, N.M., Likens, G.E., Bormann, F.H., Fisher, D.W., and Pierce, R.S., 1969, A working model for the variation in stream water chemistry at the Hubbard Brook Experimental Forest, New Hampshire: Water Resources Research, v. 5, no. 6, p. 1353–1363. [Also available at https://doi.org/10.1029/WR005i006p01353.]
Kahl, J.S., Stoddard, J.L., Haeuber, R., Paulsen, S.G., Birnbaum, R., Deviney, F.A., Webb, J.R., DeWalle, D.R., Sharpe, W., Driscoll, C.T., Herlihy, A.T., Kellogg, J.H., Murdoch, P.S., Roy, K., Webster, K.E., and Urquhart, N.S., 2004, Have U.S. surface waters responded to the 1990 Clean Air Act amendments?: Environmental Science & Technology, v. 38, no. 24, p. 484A–490A. [Also available at https://doi.org/10.1021/es040686l.]
Kaplan, L.A., Newbold, J.D., Van Horn, D.J., Dow, C.L., Aufdenkampe, A.K., and Jackson, J.K., 2006, Organic matter transport in New York City drinking-water-supply watersheds: Journal of the North American Benthological Society, v. 25, no. 4, p. 912–927. [Also available at https://doi.org/10.1899/0887-3593(2006)025[0912:OMTINY]2.0.CO;2.]
Keller, W., Heneberry, J.H., and Dixit, S.S., 2003, Decreased acid deposition and the chemical recovery of Killarney, Ontario, lakes: Ambio, v. 32, no. 3, p. 183–189. [Also available at https://doi.org/10.1579/0044-7447-32.3.183.]
Kelly, V.R., Lovett, G.M., Weathers, K.C., Findlay, S.E.G., Strayer, D.L., Burns, D.J., and Likens, G.E., 2008, Long-term sodium chloride retention in a rural watershed—Legacy effects of road salt on streamwater concentration: Environmental Science & Technology, v. 42, no. 2, p. 410–415. [Also available at https://doi.org/10.1021/es071391l.]
Kendall, S.B., 1975, Variations of two temporal parameters in observing response procedures: Animal Learning & Behavior, v. 3, no. 3, p. 179–185. [Also available at https://doi.org/10.3758/BF03213427.]
Kratzer, E.B., Jackson, J.K., Arscott, D.B., Aufdenkampe, A.K., Dow, C.L., Kaplan, L.A., Newbold, J.D., and Sweeney, B.W., 2006, Macroinvertebrate distribution in relation to land use and water chemistry in New York City drinking-water-supply watersheds: Journal of the North American Benthological Society, v. 25, no. 4, p. 954–976. [Also available at https://doi.org/10.1899/0887-3593(2006)025[0954:MDIRTL]2.0.CO;2.]
Latifoglu, A., 2003, Formation of trihalomethanes by the disinfection of drinking water: Indoor and Built Environment, v. 12, no. 6, p. 413–417. [Also available at https://doi.org/10.1177/1420326X03037000.]
Lawrence, G.B., 2002, Persistent episodic acidification of streams linked to acid rain effects on soil: Atmospheric Environment, v. 36, no. 10, p. 1589–1598. [Also available at https://doi.org/10.1016/S1352-2310(02)00081-X.]
Lawrence, G.B., Lincoln, T.A., Horan-Ross, D.A., Olson, M.L., and Waldron, L.A., 1995, Analytical methods of the U.S. Geological Survey’s New York district water-analysis laboratory: U.S. Geological Survey Open-File Report 95–416, 78 p. [Also available at https://doi.org/10.3133/ofr95416.]
Lincoln, T.A., Horan-Ross, D.A., McHale, M.R., and Lawrence, G.B., 2009, Quality-assurance data for routine water analyses by the U.S. Geological Survey laboratory in Troy, New York—July 2005 through June 2007: U.S. Geological Survey Open-File Report 2009–1234, 35 p., accessed July 20, 2020, at https://doi.org/10.3133/ofr20091234.
Long, R.P., Horsley, S.B., Hallett, R.A., and Bailey, S.W., 2009, Sugar maple growth in relation to nutrition and stress in the northeastern United States: Ecological Applications, v. 19, no. 6, p. 1454–1466. [Also available at https://doi.org/10.1890/08-1535.1.]
Lovett, G.M., Weathers, K.C., and Arthur, M.A., 2002, Control of nitrogen loss from forested watersheds by soil carbon—Nitrogen ratio and tree species composition: Ecosystems (New York, N.Y.), v. 5, no. 7, p. 712–718. [Also available at https://doi.org/10.1007/s10021-002-0153-1.]
Lovett, G.M., Weathers, K.C., and Sobczak, W.V., 2000, Nitrogen saturation and retention in forested watersheds of the Catskill Mountains, New York: Ecological Applications, v. 10, no. 1, p. 73–84. [Also available at https://doi.org/10.1890/1051-0761(2000)010[0073:NSARIF]2.0.CO;2.]
Mann, H.B., 1945, Nonparametric tests against trend: Econometrica, v. 13, no. 3, p. 245–259. [Also available at https://doi.org/10.2307/1907187.]
McHale, M.R., Burns, D.A., Lawrence, G.B., and Murdoch, P.S., 2007, Factors controlling soil water and stream water aluminum concentrations after a clearcut in a forested watershed with calcium-poor soils: Biogeochemistry, v. 84, no. 3, p. 311–331. [Also available at https://doi.org/10.1007/s10533-007-9124-0.]
McHale, M.R., Burns, D.A., Siemion, J., and Antidormi, M.A., 2017, The response of soil and stream chemistry to decreases in acid deposition in the Catskill Mountains, New York, USA: Environmental Pollution, v. 229, p. 607–620. [Also available at https://doi.org/10.1016/j.envpol.2017.06.001.]
Mehaffey, M.H., Nash, M.S., Wade, T.G., Ebert, D.W., Jones, K.B., and Rager, A., 2005, Linking land cover and water quality in New York City’s water supply watersheds: Environmental Monitoring and Assessment, v. 107, no. 1–3, p. 29–44. [Also available at https://doi.org/10.1007/s10661-005-2018-5.]
Murdoch, P.S., and Stoddard, J.L., 1993, Chemical characteristics and temporal trends in eight streams of the Catskill mountains, New York: Water, Air, and Soil Pollution, v. 67, no. 3–4, p. 367–395. [Also available at https://doi.org/10.1007/BF00478154.]
Nagle, G.N., Fahey, T.J., Ritchie, J.C., and Woodbury, P.B., 2007, Variations in sediment sources and yields in the Finger Lakes and Catskills regions of New York: Hydrological Processes, v. 21, no. 6, p. 828–838. [Also available at https://doi.org/10.1002/hyp.6611.]
National Atmospheric Deposition Program, 2014, Monitoring our changing chemical climate: National Atmospheric Deposition Program website, accessed June 2, 2014, at http://nadp.sws.uiuc.edu/. [Website not available at time of publication.]
National Climatic Data Center, 2011, State of the climate—Annual 2009: National Oceanic and Atmospheric Administration National Climatic Data Center website, accessed June 2011 at https://www.ncdc.noaa.gov/sotc/?report=entire&year=2009&month=13.
New York City Department of Environmental Protection, 2008, Evaluation of turbidity reduction potential through watershed management in the Ashokan basin: Kingston, N.Y., New York City Department of Environmental Protection, 53 p. [Also available at http://catskillstreams.org/wp-content/uploads/2018/04/CAT_IC-_SPDES_Permit_TR_Report.pdf.]
New York City Department of Environmental Protection, 2017, Upper Esopus Creek watershed turbidity/suspended sediment monitoring study—Project design report: Kingston, N.Y., New York City Department of Environmental Protection, 17 p. [Also available at https://a860-gpp.nyc.gov/concern/parent/hx11xg048/file_sets/tm70mv886.]
New York City Department of Environmental Protection, 2020, Drinking water: New York City Department of Environmental Protection website, accessed May 2020 at https://www1.nyc.gov/site/dep/water/drinking-water.page.
New York State Department of Health, 2017, New York City filtration avoidance determination: New York State Department of Health, 115 p. [Also available at https://www1.nyc.gov/assets/dep/downloads/pdf/about/filtration-avoidance-determination/2017-filtration-avoidance-determination.pdf.]
Newbold, J.D., Bott, T.L., Kaplan, L.A., Dow, C.L., Jackson, J.K., Aufdenkampe, A.K., Martin, L.A., Van Horn, D.J., and Long, A.A., 2006, Uptake of nutrients and organic C in streams in New York City drinking-water-supply watersheds: Journal of the North American Benthological Society, v. 25, no. 4, p. 998–1017. [Also available at https://doi.org/10.1899/0887-3593(2006)025[0998:UONAOC]2.0.CO;2.]
Nürnberg, G.K., 1988, Prediction of phosphorus release rates from total and reductant-soluble phosphorus in anoxic lake sediments: Canadian Journal of Fisheries and Aquatic Sciences, v. 45, no. 3, p. 453–462. [Also available at https://doi.org/10.1139/f88-054.]
Omernik, J.M., and Powers, C.F., 1983, Total alkalinity of surface waters—A national map: Annals of the Association of American Geographers, v. 73, no. 1, p. 133–136. [Also available at https://doi.org/10.1111/j.1467-8306.1983.tb01400.x.]
Palmstrom, N.S., Carlson, R.E., and Cooke, G.D., 1988, Potential links between eutrophication and the formation of carcinogens in drinking water: Lake and Reservoir Management, v. 4, no. 2, p. 1–15. [Also available at https://doi.org/10.1080/07438148809354809.]
Pires, M., 2004, Watershed protection for a world city—The case of New York: Land Use Policy, v. 21, no. 2, p. 161–175. [Also available at https://doi.org/10.1016/j.landusepol.2003.08.001.]
Rantz, S.E., and others, 1982a, Computation of discharge, v. 2 of Measurement and computation of streamflow: U.S. Geological Survey Water Supply Paper 2175, p. 285–631. [Also available at https://doi.org/10.3133/wsp2175.]
Rantz, S.E., and others, 1982b, Measurement of stage and discharge, v. 1 of Measurement and computation of streamflow: U.S. Geological Survey Water Supply Paper 2175, p. 1–284. [Also available at https://doi.org/10.3133/wsp2175.]
Rich, J.L., 1934, Glacial geology of the Catskill mountains: New York State Museum Bulletin 299, 180 p. [Also available at https://nysl.ptfs.com/data/Library1/06042012/76613.PDF.]
Sharpley, A.N., Chapra, S.C., Wedepohl, R., Sims, J.T., Daniel, T.C., and Reddy, K.R., 1994, Managing agricultural phosphorus for protection of surface waters—Issues and options: Journal of Environmental Quality, v. 23, no. 3, p. 437–451. [Also available at https://doi.org/10.2134/jeq1994.00472425002300030006x.]
Sharpley, A.N., Jarvie, H.P., Buda, A., May, L., Spears, B., and Kleinman, P.J., 2013, Phosphorus legacy—Overcoming the effects of past management practices to mitigate future water quality impairment: Journal of Environmental Quality, v. 42, no. 5, p. 1308–1326. [Also available at https://doi.org/10.2134/jeq2013.03.0098.]
Shortle, W.C., Smith, K.T., Minocha, R., Lawrence, G.B., and David, M.B., 1997, Acidic deposition, cation mobilization, and biochemical indicators of stress in healthy red spruce: Journal of Environmental Quality, v. 26, no. 3, p. 871–876. [Also available at https://doi.org/10.2134/jeq1997.00472425002600030038x.]
Siemion, J., Lawrence, G.B., and Murdoch, P.S., 2014, Use of soil-stream-water relationships to assess regional patterns of acidic deposition effects in the northeastern USA: Hydrological Processes, v. 28, no. 10, p. 3615–3626. [Also available at https://doi.org/10.1002/hyp.9903.]
Siemion, J., McHale, M.R., and Davis, W.D., 2016, Suspended-sediment and turbidity responses to sediment and turbidity reduction projects in the Beaver Kill, Stony Clove Creek, and Warner Creek, Watersheds, New York, 2010–14: U.S. Geological Survey Scientific Investigations Report 2016–5157, 28 p., accessed July 20, 2020, at https://doi.org/10.3133/sir20165157.
Siemion, J., McHale, M.R., Lawrence, G.B., Burns, D.A., and Antidormi, M., 2018, Long-term changes in soil and stream chemistry across and acid deposition gradient in the northeastern United States: Journal of Environmental Quality, v. 47, no. 3, p. 410–418. [Also available at https://doi.org/10.2134/jeq2017.08.0335.]
Smith, V.H., Tilman, G.D., and Nekola, J.C., 1999, Eutrophication—Impacts of excess nutrient inputs on freshwater, marine, and terrestrial ecosystems: Environmental Pollution, v. 100, no. 1–3, p. 179–196. [Also available at https://doi.org/10.1016/S0269-7491(99)00091-3.]
Stevens, A.A., Slocum, C.J., Seeger, D.R., and Robeck, G.G., 1976, Chlorination of organics in drinking water: Journal - American Water Works Association, v. 68, no. 11, p. 615–620. [Also available at https://doi.org/10.1002/j.1551-8833.1976.tb02506.x.]
Stoddard, J.L., Kahl, J.S., Deviney, F.A., DeWalle, D.R., Driscoll, C.T., Herlihy, A.T., Kellogg, J.H., Murdoch, P.S., Webb, J.R., and Webster, K.E., 2003, Response of surface water chemistry to the Clean Air Act amendments of 1990: U.S. Environmental Protection Agency EPA 620/R–03/001, 78 p. [Also available at http://nepis.epa.gov/Exe/ZyPURL.cgi?Dockey=30003YXE.txt.]
Suro, T.P., Firda, G.D., and Szabo, C.O., 2009, Flood of June 26–29, 2006, Mohawk, Delaware, and Susquehanna River basins, New York: U.S. Geological Survey Open-File Report 2009–1063, 354 p., accessed July 20, 2020, at https://doi.org/10.3133/ofr20091063.
U.S. Geological Survey, 2011, USGS water data for the nation: U.S. Geological Survey National Water Information System database, accessed October 1, 2013, at https://doi.org/10.5066/F7P55KJN.
U.S. Geological Survey, [variously dated], National field manual for the collection of water-quality data: U.S. Geological Survey Techniques of Water-Resources Investigations, book 9, chaps. A1–A9, [variously paged], accessed July 20, 2020, at https://pubs.water.usgs.gov/twri9A.
van Leeuwen, J., Daly, R.I., and Holmes, M., 2005, Modeling the treatment of drinking water to maximize dissolved organic matter removal and minimize disinfection by-product formation: Desalination, v. 176, nos. 1–3, p. 81–89. [Also available at https://doi.org/10.1016/j.desal.2004.10.024.]
Conversion Factors
U.S. customary units to International System of Units
Temperature in degrees Celsius (°C) may be converted to degrees Fahrenheit (°F) as °F=(1.8×°C)+32.
Datums
Vertical coordinate information is referenced to the North American Vertical Datum of 1988 (NAVD 88).
Horizontal coordinate information is referenced to the North American Datum of 1983 (NAD 83).
Elevation, as used in this report, refers to distance above the vertical datum.
Supplemental Information
Concentrations of chemical constituents in water are given in milligrams per liter (mg/L), micrograms per liter (µg/L) or microequivalents per liter (μeq/L).
Concentration trends are given in microequivalents per liter per year (μeq/L/yr) or micromoles per liter per year (μmol/L/yr).
Abbreviations
DOC
dissolved organic carbon
EPA
U.S. Environmental Protection Agency
NADP
National Atmospheric Deposition Program
NCDC
National Climatic Data Center
NYCDEP
New York City Department of Environmental Protection
Q
discharge in cubic feet per second
SRP
soluble reactive phosphorus
SSC
suspended-sediment concentration
TDP
total dissolved phosphorus
TP
total phosphorus
USGS
U.S. Geological Survey
WAP
Watershed Agricultural Program
Director, New York Water Science Center
U.S. Geological Survey
425 Jordan Road
Troy, NY 12180–8349
dc_ny@usgs.gov
or visit our website at
https://www.usgs.gov/centers/ny-water
Publishing support provided by the Lafayette, Pembroke, and Rolla Publishing Service Centers
Suggested Citation
McHale, M.R., Siemion, J., and Murdoch, P.S., 2021, The water quality of selected streams in the Catskill and Delaware water-supply watersheds in New York, 1999–2009: U.S. Geological Survey Scientific Investigations Report 2020–5049, 48 p., https://doi.org/10.3133/sir20205049.
ISSN: 2328-0328 (online)
Study Area
| Publication type | Report |
|---|---|
| Publication Subtype | USGS Numbered Series |
| Title | The water quality of selected streams in the Catskill and Delaware water-supply watersheds in New York, 1999–2009 |
| Series title | Scientific Investigations Report |
| Series number | 2020-5049 |
| DOI | 10.3133/sir20205049 |
| Year Published | 2021 |
| Language | English |
| Publisher | U.S. Geological Survey |
| Publisher location | Reston, VA |
| Contributing office(s) | New York Water Science Center |
| Description | viii, 48 p. |
| Country | United States |
| State | New York |
| Other Geospatial | Catskill Park |
| Online Only (Y/N) | Y |
| Additional Online Files (Y/N) | N |
| Google Analytic Metrics | Metrics page |