

Surface-Water-Quality Data to Support Implementation of Revised Freshwater Aluminum Water-Quality Criteria in Massachusetts, 2018–19
Links
- Document: Report (35.2 MB pdf) , HTML , XML
- Data Releases:
- USGS data release - Surface-water-quality data and time-series plots to support implementation of site-dependent aluminum criteria in Massachusetts, 2018–19 (ver. 1.1, February 2023)
- USGS data release - Total and dissolved organic carbon data for an assessment of aluminum in Massachusetts surface waters
- Version History: Version History (1.19 KB txt)
- Download citation as: RIS | Dublin Core
Acknowledgments
This study benefited greatly from the interest, support, and assistance of personnel from the Massachusetts Department of Environmental Protection, Office of Watershed Planning; the U.S. Environmental Protection Agency Region 1, National Pollutant Discharge Elimination System (NPDES) Water Permit Program; and the staff for the water-treatment and wastewater-treatment facilities participating in the study. We would also like to recognize and thank our many U.S. Geological Survey colleagues whose teamwork and assistance made the study possible. The public and private landowners who allowed access to streams, rivers, and ponds for the collection of water-quality samples are much appreciated.
Abstract
The U.S. Geological Survey, in cooperation with the Massachusetts Department of Environmental Protection, performed a study to inform the development of the department’s guidelines for the collection and use of water-chemistry data to support calculation of site-dependent aluminum criteria values. The U.S. Geological Survey collected and analyzed discrete water-quality samples at four wastewater-treatment facilities and seven water-treatment facilities in eastern and central Massachusetts from April 2018 through May 2019.
For each of the 11 facilities considered, water-quality samples were collected from treatment-plant effluent and receiving-water bodies. Samples were collected for laboratory analysis of major ions (calcium and magnesium ions are used to calculate total hardness), dissolved organic carbon (DOC), total organic carbon (TOC), and total recoverable aluminum. Field parameters for pH, temperature, and specific conductance were measured in situ concurrently with sample collection.
Water-quality conditions differed among monitoring stations. The highest pH values were observed for stations on the Assabet River that receive effluent discharges from wastewater-treatment facilities (the Westborough, Marlborough, Hudson, and Maynard wastewater-treatment facilities). High DOC concentrations (greater than 10 mg/L) were measured in water bodies associated with large areas of riparian wetlands—Lily Pond (Cohasset) and Third Herring Brook (Hanover), and low DOC concentrations (less than 2.5 mg/L) were measured at three water bodies in central Massachusetts—Hocomonco Pond (Westborough), Wyman Pond (Fitchburg), and Monoosnoc Brook (Leominster). Wyman Pond (Fitchburg), Monoosnoc Brook (Leominster), and Lily Pond (Cohasset) also had low pH values and low total hardness concentrations.
The monthly discrete pH, DOC, and total hardness data for selected stations on receiving-water bodies were used in the U.S. Environmental Protection Agency Aluminum Criteria Calculator Version 2.0 to estimate site-dependent total recoverable aluminum concentrations that—if not exceeded—would be expected to protect fish, invertebrates, and other aquatic life from adverse effects associated with acute and chronic aluminum exposures. The U.S. Environmental Protection Agency Calculator output provides values for the acute criterion, defined as the criterion maximum concentration (CMC), an estimate of the highest aluminum concentration in surface water to which an aquatic community can be exposed briefly without resulting in an unacceptable effect. This output also provides values for the chronic criterion, defined as the criterion continuous concentration (CCC), an estimate of the highest concentration of aluminum in surface water to which an aquatic community can be exposed indefinitely without resulting in an unacceptable effect. To determine aluminum criteria values typically evaluated for use as protective water-quality criteria, the monthly instantaneous CMC and CCC values were used to calculate the minimum, 5th percentile, and 10th percentile CMC and CCC values for selected monitoring stations.
The monthly instantaneous aluminum CMC and CCC values generated using the U.S. Environmental Protection Agency Calculator varied among stations. Aluminum CMC and CCC values were highest for four ambient (upstream) stations on the Assabet River associated with wastewater-treatment facilities (Westborough, Marlboro, Hudson, and Maynard). Aluminum CMC and CCC values were lower for stations associated with water-treatment facilities, and lowest for selected ambient stations on Lily Pond, Monoosnoc Brook, and Wyman Pond associated with water-treatment facilities in Cohasset, Leominster, and Fitchburg, respectively. For many stations, the highest CMC and CCC instantaneous aluminum criteria values generated using the U.S. Environmental Protection Agency Calculator were for months during the growing season for algae and aquatic macrophytes (April or May through September or October) and the lowest values were for months during the nongrowing season (October or November through March or April), indicating the importance of collecting water-quality data during the nongrowing season.
Aluminum CMC and CCC values generated by the U.S. Environmental Protection Agency Calculator are sensitive to variations in the input parameters (pH, DOC, and total hardness). Aluminum solubility is particularly affected by pH. To characterize diel and seasonal variations in pH, multiparameter water-quality monitors recording continuous (15-minute interval) water temperature and pH were installed in the receiving-water body for one station near each facility upstream from the effluent discharge (in rivers) or at a station outside the immediate effect of effluent discharge (in ponds). Continuous water temperature and pH data were collected from April or May 2018 through November or December 2018. Continuous pH data indicated that the pond stations and Assabet River stations had large diel variations in pH during the growing season. Continuous pH data were used together with discrete DOC and total hardness data to evaluate the potential effect of diel variations in pH on calculated site-dependent aluminum criteria values. For the 11 stations, diel variations in pH were determined to correspond to differences in the 10th percentile of CMC values by a median of 160 µg/L, ranging from 0 to 610 µg/L, and differences in the 10th percentile of CCC values by a median of 40 µg/L, ranging from 15 to 210 µg/L. The low monthly instantaneous CMC and CCC values that have the greatest effect on the minimum, 5th percentile, and 10th percentile aluminum values tend to result during the nongrowing season (October or November through March or April) when the range of diel variations in pH is small, thus minimizing the effect of diel variations in pH on the lowest CMC and CCC values.
Historical water-quality data on organic carbon in Massachusetts streams were investigated using data retrieved from the USGS National Water Information System database. An assessment of the availability of historical pH, DOC, and hardness data indicated that more data were available for TOC than for DOC. A linear regression equation was developed for the relation between DOC and TOC concentrations to inform the potential use of available data to evaluate water-quality conditions at additional sites across Massachusetts where only pH, hardness, and TOC data are available. DOC and TOC concentrations were well correlated in the 223 samples in which both constituents were analyzed, and the equation had a coefficient of determination (R2) equal to 0.93.
Introduction
Surface waters with elevated (above background) aluminum concentrations from natural and manmade processes can create toxic conditions for aquatic life, such as invertebrates, amphibians, and fish; for example, aluminum accumulation on fish receptor sites (gills and olfactory glands) impairs metabolic and respiratory functions and can be lethal (Rosseland and others, 1990; Exley and others, 1991). Aluminum enters surface waters from natural and manmade sources through multiple pathways, such as rock and mineral weathering, atmospheric deposition, and effluent discharges from water-treatment facilities (WTFs) and wastewater-treatment facilities (WWTFs) (Gensemer and Playle, 1999; Agency for Toxic Substances and Disease Registry, 2008). WTFs use aluminum-based coagulants, such as aluminum sulfate, and aluminum polymers, such as polyaluminum chloride (PACL) and polyaluminum sulfate, to clarify water (Metcalf and Eddy, Inc., 2003). WWTFs use aluminum-based coagulants to reduce effluent phosphorus before discharging to receiving waters (Metcalf and Eddy, Inc., 2003). The National Pollutant Discharge Elimination System (NPDES) permits for these facilities include effluent limitations and monitoring requirements for discharge of contaminants, including aluminum, to receiving waters.
The chemistry and toxicity of aluminum in aquatic environments is complex. The chemical properties of surface water directly affect the speciation and bioavailability of aluminum and, thus, its toxic effect on aquatic life (Brumbaugh and Kane, 1985; Freda and McDonald, 1990; Rosseland and others, 1990; Gensemer and Playle, 1999). The toxicity of elevated aluminum concentrations to fish and macroinvertebrates in freshwater is affected by local water quality, primarily by pH, dissolved organic carbon (DOC), and total hardness. Aluminum is nearly insoluble at neutral pH (7 standard units [SU]), but the solubility of aluminum increases exponentially after pH reaches acidic (less than 6 SU) or basic (greater than 8 SU) conditions (Driscoll and Postek, 1996; Gensemer and Playle, 1999; Gensemer and others, 2018; U.S. Environmental Protection Agency [EPA], 2018). The toxicity of aluminum is reduced when aluminum sorbs to DOC, such as humic substances, to form organic aluminum complexes that reduce the bioavailability of aluminum to aquatic organisms (DeForest and others, 2018; Besser and others, 2019). Aluminum toxicity also is reduced when hardness concentrations increase. Cations that increase hardness, such as calcium and magnesium, compete with aluminum cations for uptake by aquatic organisms, reducing the toxic effects of aluminum (Goenaga and Williams, 1988; Exley and others, 1991; Gensemer and Playle, 1999; DeForest and others, 2018).
Under the authority of the Clean Water Act, the EPA publishes water-quality criteria recommendations that address the toxic effects of contaminants in water. In 2018, the EPA published national recommended ambient water-quality criteria guidance for total recoverable aluminum in freshwater (EPA, 2018). The EPA defines the term “ambient” as referring to open waters (such as rivers, lakes, and streams) as opposed to closed-water systems that distribute treated water or wastewater (EPA, 2020). The new guidance reflects the latest science on aluminum toxicity by recognizing the need to calculate site-dependent aluminum criteria based on local water chemistry. The 2018 aluminum criteria guidance supersedes the EPA’s 1988 invariable aluminum criteria recommendations for short-term (acute) (750 micrograms per liter [µg/L]) and long-term (chronic) (87 µg/L) exposures that were only applicable within a pH range from 6.5 to 9.0 SU (EPA, 1988). Unlike the fixed acute and chronic aluminum criteria in the 1988 guidance, the 2018 aluminum criteria guidance is based on multiple linear regression models to calculate recommended acute and chronic instantaneous aluminum criteria values, which will differ based on site-dependent water-chemistry parameters (pH, DOC, and total hardness) (EPA, 2018). To facilitate use of the multiple linear regression models to generate acute and chronic aluminum-criteria value recommendations at a specific site, the EPA developed the Aluminum Criteria Calculator Version 2.0, which is available as both a macro-enabled Microsoft Excel file and as R Code (R Core Team, 2020). The Excel version of the Aluminum Criteria Calculator Version 2.0 was used to calculate aluminum-criteria values described in this report and is referred to hereafter as the “EPA Calculator.” The EPA Calculator uses local water chemistry (pH, DOC, and total hardness) values to generate site-dependent aluminum criteria values that will protect aquatic organisms from lethal effects (acute criteria) and effects on growth and reproduction (chronic criteria).
Factors including the selection of appropriate sampling locations, minimum data requirements, and data-collection methods that account for spatial and temporal site variability are essential considerations for application of the EPA’s updated guidance. In cooperation with the Massachusetts Department of Environmental Protection (MassDEP), the U.S. Geological Survey (USGS) designed and performed a study at multiple streams, rivers, and ponds in eastern and central Massachusetts that receive treatment-plant effluent to demonstrate and evaluate these factors.
Purpose and Scope
The purpose of this report is to inform the development of MassDEP’s guidelines for the collection and use of site-dependent water-chemistry data (pH, DOC, and total hardness), which are required inputs to the EPA Calculator.
The following is a list of specific objectives for this report:
-
Summarize discrete water-quality data for analysis of in situ pH, DOC, total hardness, and total aluminum in effluent and receiving-water bodies near four WWTFs and seven WTFs in eastern and central Massachusetts.
-
Use the discrete water-quality data (pH, DOC, and total hardness) from selected monitoring stations near each facility to demonstrate the use of the EPA Calculator (EPA, 2018) for site-dependent calculations of acute (criterion maximum concentration, CMC) and chronic (criterion continuous concentration, CCC) instantaneous water-quality criteria values for total recoverable aluminum.
-
Collect continuous water-quality data (water temperature and pH) at a selected station near each facility. Stations selected for collection of continuous data are upstream from effluent discharges (for streams and rivers) or outside of the immediate effect of the effluent discharge (for ponds). Describe the daily and seasonal variability in pH at the selected study sites. Apply the continuous pH data to the EPA Calculator to illustrate the potential effects of pH variability on the CMC and CCC water-quality criteria values for total recoverable aluminum.
-
Compile available historical water-quality data for total organic carbon (TOC) and DOC collected at sites in Massachusetts and develop a relation between TOC and DOC in Massachusetts streams. This objective was included to enable MassDEP to use available water-quality data to evaluate water-quality conditions at additional sites across Massachusetts where only pH, hardness, and TOC data are available.
This report describes the approach used to select monitoring stations and the methods used to collect water-quality samples and provides water-quality data measured in situ or analyzed from collected samples. The report presents the site-dependent aluminum criteria values generated with the EPA Calculator for receiving-water bodies near 11 water-treatment facilities in eastern and central Massachusetts during 2018–19.
Water-quality samples were collected from multiple locations near the water-treatment facilities, including (1) stations upstream from effluent discharges (for streams and rivers) and locations outside of the immediate effect of the effluent discharge (for ponds), (2) effluent discharges, (3) stations downstream from effluent discharges (for streams and rivers), and (4) other locations as directed by MassDEP. Instantaneous water-quality criteria values for total recoverable aluminum were calculated only for water-quality samples collected at stations on water bodies designated by the EPA as the receiving-water body for the water-treatment facility and for stations where samples were collected upstream from effluent discharges (for streams and rivers) or in locations outside of the immediate effect of the effluent discharge (for ponds). Instantaneous water-quality criteria values for total recoverable aluminum were not determined for water-quality data collected from effluent discharges, from stations immediately downstream from effluent discharges (for streams and rivers) or within the dilution mixing zone (for ponds), or from stations not on the receiving-water body for a facility.
The aluminum criteria values generated by the EPA Calculator for selected stations using site dependent water-chemistry parameters are included in this report to demonstrate potential applications of the EPA’s 2018 ambient water-quality criteria guidance for aluminum in freshwater; the calculated values are not regulatory effluent limits for specific facilities. The formal adoption and use of any site-dependent aluminum calculations to restore and maintain the chemical, physical, and biological integrity of surface waters under the Clean Water Act (https://www.epa.gov/laws-regulations/summary-clean-water-act) are subject to additional Federal and State regulatory frameworks.
Previous Investigations
Water quality and toxicity related to aluminum in effluent discharges have been investigated by the USGS in two recent publications (Colman and others, 2016; Besser and others, 2019). In 2011, the USGS developed a method to assess dilution of aluminum in filter-backwash effluent discharged to reservoirs from water-treatment plants (Colman and others, 2016). The dilution of aluminum discharged to reservoirs was investigated in a field study and through computer simulation. Determination of dilution is needed so that permits for discharge ensure compliance with water-quality standards for aquatic life. Dilution statistics were simulated for 13 reservoirs from 1960 to 2004 using the USGS Firm-Yield Estimator model to simulate reservoir inputs and outputs and present-day values of filter-effluent discharge and aluminum concentration (Levin and others, 2011). In addition to computing dilution factors, Colman and others (2016) determined dilution factors that would mitigate aluminum toxicity with the same statistical basis (frequency of exceedance of the chronic standard) as dilutions computed for streams at the 7-day-average, 10-year-recurrence annual low flow (7Q10) (Blum and others, 2019).
In a followup study to Colman and others (2016), the USGS (Besser and others, 2019) investigated the importance of DOC as a control on aluminum toxicity in low‐hardness waters (20 mg/L and 35 mg/L as CaCO3). A series of 7‐day toxicity tests were completed with the water flea Ceriodaphnia dubia in dilutions of low‐hardness natural waters, which contained DOC concentrations as much as 10 milligrams per liter (mg/L). Results from the study confirm the importance of DOC as a control on aluminum toxicity in low‐hardness waters and demonstrate that total aluminum concentrations are not predictive of aluminum toxicity, except under defined water quality (pH, DOC, and total hardness) and exposure conditions (Besser and others, 2019).
Study Design
The 11 water-treatment facilities participating in this study were selected by MassDEP and included 4 WWTFs and 7 WTFs in eastern and central Massachusetts (fig. 1, table 1). For consistency in this report, the facilities are referred to using the town name, with each wastewater-treatment facility referred to as “WWTF” and each water treatment facility referred to as “WTF.” To distinguish between the two water-treatment facilities in Westborough, these facilities are referred to as the Westborough WWTF and the Westborough WTF in this report. The four WWTFs are all on the Assabet River, from upstream to downstream, in the towns of Westborough, Marlborough, Hudson, and Maynard. The selection of four WWTF facilities within the same drainage basin was done to evaluate the variability in water-quality conditions that may occur within a single basin. All the WTFs are in five major drainage basins of Massachusetts (Massachusetts Bureau of Geographic Information, 2003). The seven WTFs include two in the Nashua River Basin in the towns of Fitchburg and Leominster, one in the Sudbury-Assabet-Concord River Basin in the town of Westborough, one in the Ipswich River Basin in the town of Wilmington, one in the Boston Harbor Drainage Area in the town of Weymouth, and two in the South Coastal Drainage Area in the towns of Cohasset and Hanover.
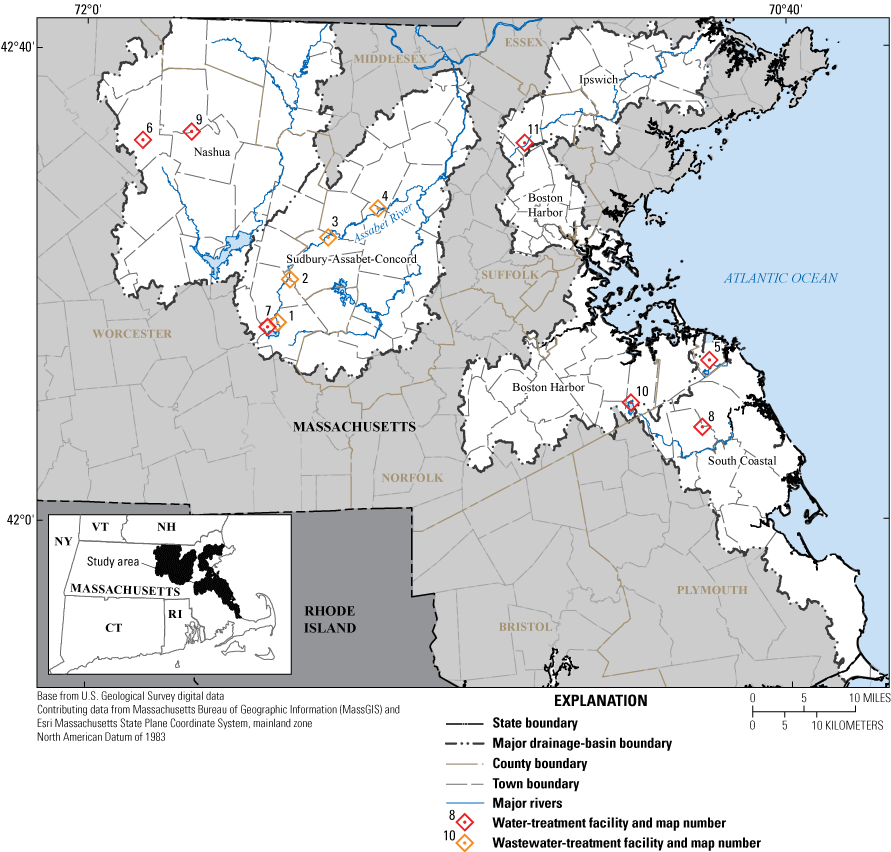
Locations of study-area major drainage basin boundaries and water-treatment and wastewater-treatment facilities in eastern and central Massachusetts. Facility information provided in table 1.
Table 1.
Information on water-treatment and wastewater-treatment facilities in eastern and central Massachusetts.[no., number; WTF, water-treatment facility; WWTF, wastewater-treatment facility; NA, not applicable]
| Map no. (fig. 1) |
Facility | Town | Facility type | Source of WTF water | Receiving-water body | Receiving-water body type |
|---|---|---|---|---|---|---|
| 1 | Westborough wastewater-treatment facility | Westborough | WWTF | NA | Assabet River | Stream |
| 2 | Marlborough wastewater-treatment facility | Marlborough | WWTF | NA | Assabet River | River |
| 3 | Hudson wastewater-treatment facility | Hudson | WWTF | NA | Assabet River | River |
| 4 | Maynard wastewater-treatment facility | Maynard | WWTF | NA | Assabet River | River |
| 5 | Cohasset water-treatment facility | Cohasset | WTF | Surface water | Lily Pond | Pond |
| 6 | Fitchburg water-treatment facility | Fitchburg | WTF | Groundwater | Wyman Pond | Pond |
| 7 | Westborough water-treatment facility | Westborough | WTF | Groundwater and surface water | Hocomonco Pond | Pond |
| 8 | Hanover water-treatment facility | Hanover | WTF | Groundwater | Third Herring Brook | Stream |
| 9 | Leominster water-treatment facility | Leominster | WTF | Surface water | Monoosnoc Brook | Stream |
| 10 | Weymouth water-treatment facility | Weymouth | WTF | Surface water | Mill River | Stream |
| 11 | Wilmington water-treatment facility | Wilmington | WTF | Groundwater | Maple Meadow Brook | Stream |
Each facility had a minimum of three monitoring stations, at least two stations for sampling ambient water upstream and downstream of the effluent discharge, and one station for sampling treatment-plant effluent (fig. 2). In this report, stations sampling WWTF or WTF effluent are referred to as “effluent” stations, whereas stations on receiving waters or other water bodies are referred to as “ambient stations.” When additional information is needed in this report to distinguish stations on streams or rivers that are upstream or downstream from effluent discharges or stations on ponds that are outside the area of effect of effluent discharges, a location descriptor is added in parentheses. For example, ambient (upstream), ambient (downstream), or ambient (pond) stations.
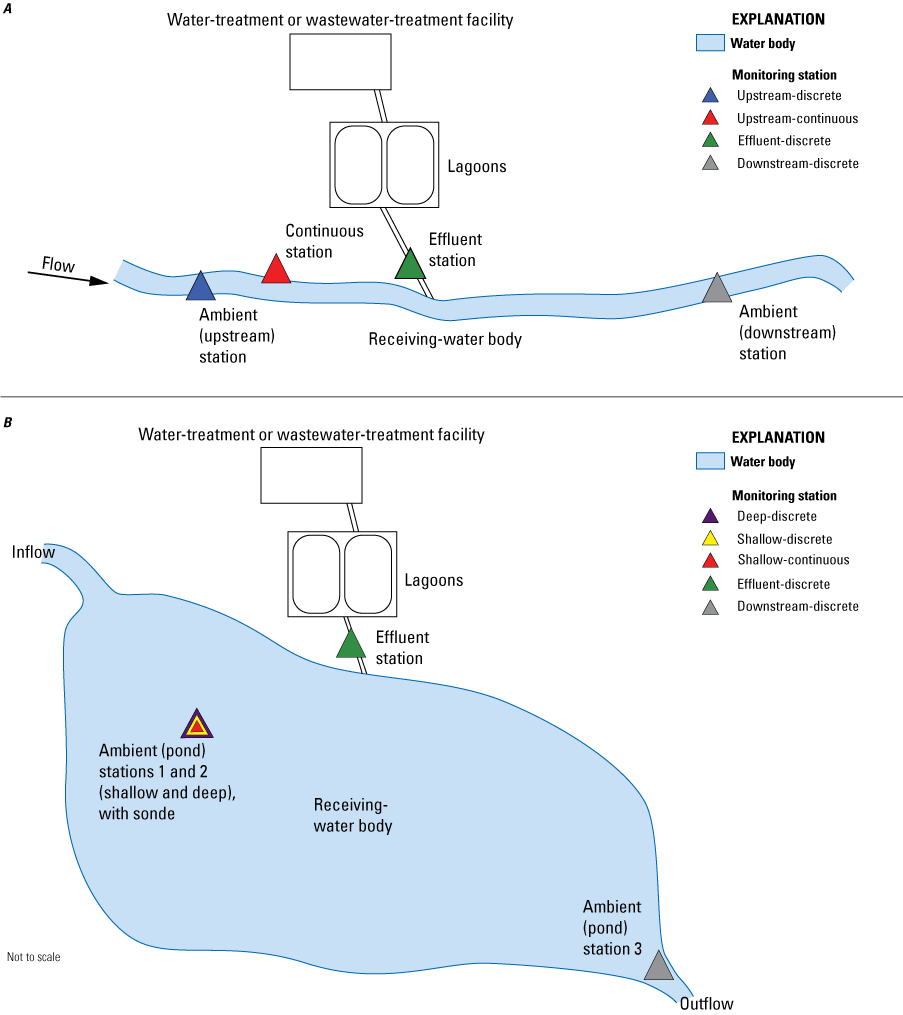
Schematic diagrams showing conceptual sampling designs for selection of water-quality monitoring stations A, on a stream or river and B, on a pond.
If the receiving-water body for a facility was a stream or river, stations were established for collection of water-quality samples upstream and downstream from the effluent discharge. The upstream stations were established to sample water-quality conditions upstream from the effluent discharge, and the downstream stations were established so that water-quality conditions downstream from the effluent discharge (and outside of the mixing zone of effluent discharges) from that facility could be evaluated. Determining the dimensions of mixing zones or effluent dilution ratios was not within the scope of this study. Mixing was estimated at the start of the study primarily from measurement of field parameters (water temperature, pH and specific conductance) collected during site reconnaissance and with best professional judgment. Where possible, stations were established downstream from features that increased mixing, such as riffles or large meanders.
If the receiving-water body for a facility was a pond or reservoir, water-quality samples were collected from a near-surface (shallow) station and a near-bottom (deep) station, located near the deepest area (deep hole) of the pond or reservoir. Water samples at the shallow stations were generally collected at a depth of about 1.5 ft. Water samples at the deep stations were collected just above aquatic vetetation and water depths varied from about 3 to 12 feet. The shallow and deep stations are referred to in this report as pond station 1 and pond station 2, respectively (or pond stations 3 and 4 if more than one location is used). If possible, the first pair of shallow and deep stations would be established near the upgradient end of the pond and another station would be established near the pond outlet to bracket effluent discharges. Pond stations could not always be established to bracket effluent discharges, however. Stations could not bracket effluent discharges if the effluent discharge was at the upgradient end of the pond, or if there were other imports or exports of water from the pond or reservoir. For these ponds, stations were established at locations where water-quality conditions were beyond the immediate effect of the effluent discharge.
In practice, the location and number of stations associated with each facility were unique because of factors related to the hydrologic setting, the structure and routing of effluent discharges, the water body designated by the EPA as the receiving-water body in the facility’s NPDES permit, and other factors, such as accessibility or landowner access permission. Seven facilities had three monitoring stations (Westborough WWTF, Marlborough, Hudson, Maynard, Cohasset, Hanover, and Leominster), and four facilities (Fitchburg, Westborough WTF, Weymouth, and Wilmington) had four or five monitoring stations.
Water-quality data were collected by USGS staff at 38 monitoring stations near 11 water- treatment facilities during 2018–19 (table 2). The monitoring stations included 27 stations that monitored ambient water quality and 11 stations that monitored effluent water quality. Of the 27 ambient stations, 15 were on streams or rivers and 12 were on ponds or reservoirs. Aluminum CMC and CCC values were calculated for 18 of the 27 ambient stations. The stations used for calculating aluminum CMC and CCC were the ambient stations on the receiving-water body for the facility that were upstream of effluent discharges (for stream and river stations) or outside of the immediate effect of effluent discharges (for pond stations) (table 2).
Table 2.
Water-quality monitoring stations near seven water-treatment and four wastewater-treatment facilities in eastern and central Massachusetts.[For stations that monitored discrete and continuous data, only the discrete data are used in the U.S. Environmental Protection Agency Aluminum Criteria Calculator (EPA Calculator). The locational data for these stations will be provided upon request in accordance with the Bureau policy on product access and distribution. D, discrete; N, no; Mass., Massachusetts; C, continuous; P, pond; Y, yes; US, upstream; DS, downstream]
Although the effluent discharge from WWTFs and the effluent discharge from WTFs are both referred to as “effluent” in this report, the water quality of sewage-treatment wastewater from a WWTF differs from the filter backwash effluent from a WTF, which is predominantly drinking water containing aluminum sulfate or polyaluminum chloride. The water quality of effluent from WTFs also may differ among facilities, depending on whether the source of the water to the WTF was groundwater, surface water, or a combination of the two. For WTFs, the effluent is typically settled in a lagoon, and overflow from the lagoon (the lagoon supernatant) is displaced over a weir to the receiving-water body every time water from a filter backwash is discharged to the lagoon. Effluent water samples represent conditions present during the site visits for monthly sampling. In general, study goals were to sample normal operations and not seek out specific or unusual effluent discharges.
Selection of Sampling Locations
Selection of sampling locations is an important study component leading to the collection of high-quality water-quality samples. The physical setting varied at each of the facilities in relation to the water bodies considered in this study. Some of the challenges encountered during the selection of station location included the need to consider the potential effects on water quality caused by impoundment from downstream dams or flood-control reservoirs, water releases from upstream reservoirs or water imports from other water bodies, induced infiltration from appreciable groundwater withdrawals, stormwater runoff, and discharges from NPDES and Superfund sites. Station selection could also be complicated by difficult access conditions or denial of permission to access private property. Factors evaluated during site selection for each station are discussed in the station descriptions in appendix 1.
Where possible, stations were established away from the outfalls of stormwater runoff pipes and away from areas receiving road runoff to reduce the possibility that metals or other constituents from stormwater runoff would directly affect water quality. Stations on ponds were established away from the shore to minimize the effects of runoff on water quality. The station locations on streams and rivers also were selected to minimize the possibility that metals or other constituents in stormwater runoff from roads would be attributed to effluent discharges. For example, for stations on streams and rivers, upstream stations were established downstream from roads, and downstream stations were established upstream from roads.
Stations on streams and rivers were selected in reaches with single channels and in areas free of eddies, with minimum turbulence and streambed irregularities that may have affected sample collection. Study protocols for sampling ponds required knowledge of pond bathymetry to identify the deepest areas of the pond. Pond bathymetry was available for some ponds from published reports, and bathymetry was measured for other ponds. Shallow and deep stations were established in a deep area so that the water-quality conditions at different depths could be compared. Stations on ponds also were established in a deep area to reduce the probability that in the summer the pond water surface would be covered with aquatic vegetation that hampers the collection of shallow and deep water-quality samples. The ponds in the study area were less than 15 feet (ft) deep and small enough in area that station location with respect to the effluent discharge was a factor during selection of monitoring station locations.
Effluent samples were collected at the ends of the outfall pipes, where possible. However, selection of appropriate locations for collection of effluent samples was dictated by the structure, route, and location of effluent outfalls. Four of the facilities had conditions that prevented collection of a representative sample directly from the end of the outfall pipe. The effluent pipes at the Marlborough and Hudson WWTFs are partially submerged in the Assabet River, and the effluent pipes at the Maynard WWTF and at the Westborough WTF join with stormwater runoff pipes before reaching the effluent outfalls. For these facilities, effluent samples were collected at the locations where the facilities collect water-quality samples, either by pumping from the effluent stream with a peristaltic pump (Marlborough and Hudson) or by using the facility’s pumps (Maynard WWTF and Westborough WTF).
The location of effluent outfalls relative to the receiving-water body varied considerably by facility. Selection of a station downstream or downgradient from effluent discharge required assessment of how and where effluent discharges would reach the receiving-water body. Some facilities discharged effluent directly into receiving-water bodies (Cohasset, Leominster, Marlborough, Hudson, Maynard, Westborough-WTF). At other facilities, effluent was routed through ditches (Westborough-WWTF); swales, intermittent streams, or riparian wetlands (Fitchburg, Hanover, Wilmington); ponds (Weymouth); or other water bodies before discharging into the receiving-water body.
A list of factors considered during selection of monitoring stations was developed (table 3). The selection factors were developed to ensure that (1) monitoring stations were selected to allow collection of discrete samples during all flow conditions; (2) stormwater runoff and known point sources (other than those from the facility being monitored) would have minimal effects on water quality; and (3) site conditions at the ambient (upstream) or ambient (pond) stations facilitated the installation of a continuous sensor, datalogger, and equipment shelter. Manmade alterations that could potentially affect water quality that needed to be considered during the site-selection process included flow alterations, such as from flood-retention dams, downstream reservoirs, surface-water diversions, groundwater withdrawals, and stormwater; or contamination, such as from NPDES discharges, EPA Superfund sites, old landfills, and stormwater runoff. Other factors that affected site selection included tributaries; isolated locations; access issues; permission to access sites through private property; and safety concerns related to road traffic, boating, or wading hazards (USGS, 2014).
Table 3.
Factors to consider during selection of reaches and monitoring stations for collection of water-quality data to support aluminum criteria development in Massachusetts.[MassDEP, Massachusetts Department of Environmental Protection; EPA, U.S. Environmental Protection Agency; NPDES, National Pollutant Discharge Elimination System]
Figures 3–13 show maps of the receiving water bodies and monitoring stations associated with each of the water-treatment facilities. Some of the receiving water-bodies are on small tributaries or ponds, and the text includes mention of the downstream water bodies that the receiving waters flow into. Some of the downstream water bodies in the site descriptions are outside of the map areas shown in figures 3–13 and would be too small to identify on figure 1 and, therefore, do not appear in any figure.
Wastewater-Treatment Facilities
The Westborough, Marlborough, Hudson, and Maynard WWTFs (listed in order of increasing drainage area) are within about a 20-mile (mi) reach of the Assabet River. Water quality in the Assabet River at each of these facilities is potentially affected by effluent discharge from upstream water-treatment facilities. A tributary entering the Assabet River upstream of the Westborough WWTF contains the outflow from Hocomonco Pond, which received effluent discharge from the Westborough WTF during the study (2018–19). Water quality in the Assabet River at the Marlborough, Hudson, and Maynard WTFs is potentially affected by effluent discharges from upstream WWTFs.
Westborough Wastewater-Treatment Facility
The Assabet River is the EPA-designated receiving-water body for the effluent discharge from the Westborough WWTF. The headwaters of the Assabet River are in Westborough, and the Assabet River is a small stream with a drainage area of 8.37 square miles (mi2) at the point where the stream receives the effluent discharge. Contributing drainage areas for stations in this report were determined with StreamStats (USGS, 2016).
The following three monitoring stations are associated with the Westborough WWTF: a station upstream from the effluent discharge: Assabet River near Westborough, Mass. (station 01096603); an effluent station, Westborough wastewater-treatment plant effluent (station 421651071381401); and a station downstream from the effluent discharge, Assabet River downstream from Westborough water-treatment plant at Route 9 (Turnpike Road) (station 421700071381901) (fig. 3).
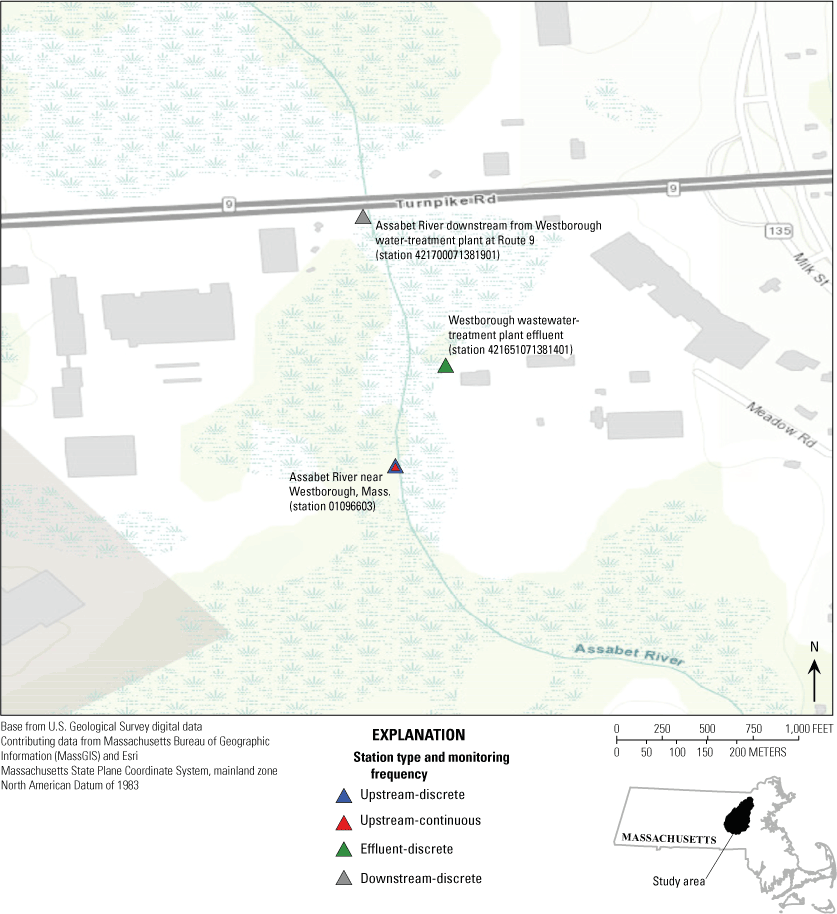
Locations of water-quality monitoring stations near the Westborough wastewater-treatment facility, Westborough, Massachusetts. Names of facilities and receiving-water bodies are provided in table 1. Station monitoring frequency, station type, and identification of stations used in the Environmental Protection Agency Aluminum Criteria Calculator are provided in table 2.
Marlborough Wastewater-Treatment Facility
The Assabet River is the EPA-designated receiving-water body for the effluent discharge from the Marlborough WWTF. The Marlborough WWTF is about 6 mi downstream from the Westborough WWTF, and the drainage areas for the upstream and downstream monitoring stations are 35.3 and 35.6 mi2, respectively. The Marlborough WWTF discharges effluent to the Assabet River in a river reach upstream from the Tyler floodwater-retarding dam (fig. 4) (U.S. Department of Agriculture, 2013).
The following three monitoring stations are associated with the Marlborough WWTF: a station upstream from the effluent discharge, Assabet River at Boundary Street near Northborough, Mass. (station 01096720); an effluent station, Marlborough wastewater-treatment plant effluent (station 422034071365601); and a station downstream from the effluent discharge, Assabet River, downstream Marlborough wastewater-treatment plant (station 01096725) (fig. 4).
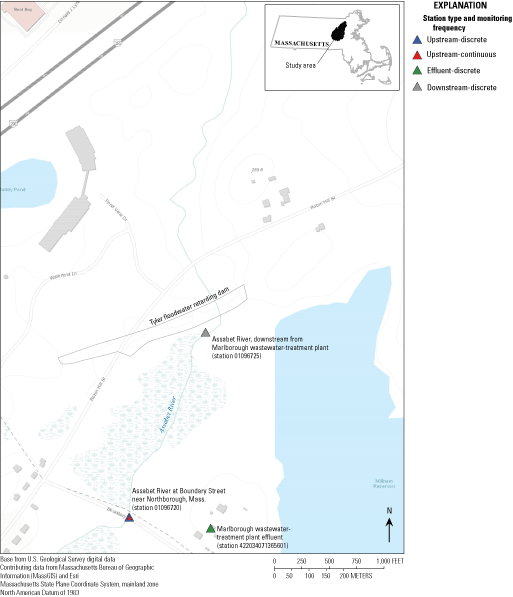
Locations of water-quality monitoring stations near the Marlborough wastewater-treatment facility, Marlborough, Massachusetts. Names of facilities and receiving water bodies are provided in table 1. Station monitoring frequency, station type, and identification of stations used in the Environmental Protection Agency Aluminum Criteria Calculator are provided in table 2.
Hudson Wastewater-Treatment Facility
The Assabet River is the EPA-designated receiving-water body for the effluent discharge from the Hudson WWTF. The facility discharges to the Assabet River upstream from the Gleasondale impoundment (fig. 5). The Hudson WWTF is about 8 mi downstream from the Marlborough WWTF, and the Assabet River at the WWTF has a drainage area of 74 mi2.
The following three monitoring stations are associated with the Hudson WWTF: a station upstream from the effluent discharge, Assabet River at Cox Street near Hudson, Mass. (station 01096870); an effluent station, Hudson wastewater-treatment plant effluent (station 422406071323401); and a station downstream from the effluent discharge, Assabet River near Hudson-Stow town line (station 01096875) (fig. 5).
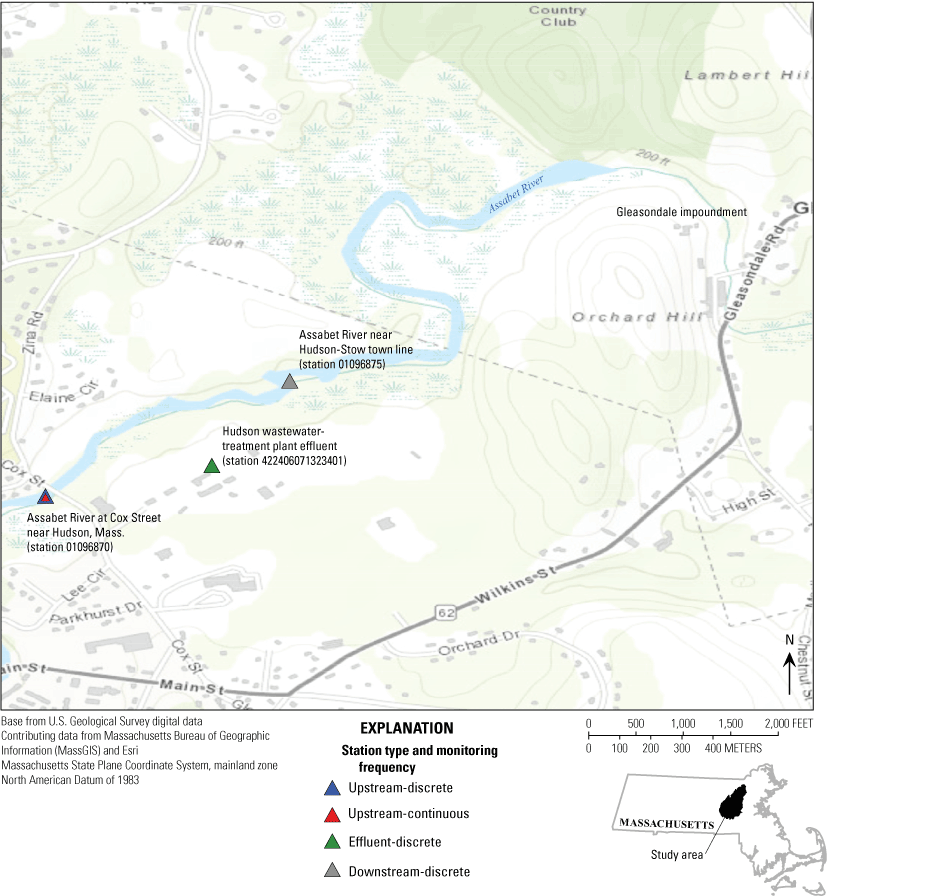
Locations of water-quality monitoring stations near the Hudson wastewater-treatment facility, Hudson, Massachusetts. Names of facilities and receiving water bodies are provided in table 1. Station monitoring frequency, station type, and identification of stations used in the Environmental Protection Agency Aluminum Criteria Calculator are provided in table 2.
Maynard Wastewater Treatment Facility
The Assabet River is the EPA-designated receiving-water body for the effluent discharge from the Maynard WWTF. The Maynard WWTF is about 9 mi downstream from the Hudson WWTF, and the contributing drainage area at the WWTF effluent discharge is 117 mi2. The Maynard WWTF effluent is discharged into the Powdermill impoundment, about 2,010 ft upstream from the Powdermill Dam. The Maynard WWTF is constructed on a hillslope along the left side of the Assabet River near the Maynard and Acton town line. The Acton WWTF is just downstream (0.2 mi) of the Maynard WWTF. Effluent from the Acton WWTF is discharged to rapid-infiltration beds and moves to the Assabet River as groundwater.
The following three monitoring stations are associated with the Maynard WWTF: a station upstream from the effluent discharge, Assabet River, upstream Maynard wastewater-treatment plant (station 01097021); an effluent station, Maynard wastewater-treatment plant effluent (station 422627071262301); and a station downstream from the Maynard WWTF effluent discharge, Assabet River, downstream Maynard wastewater-treatment plant (station 01097023) (fig. 6).
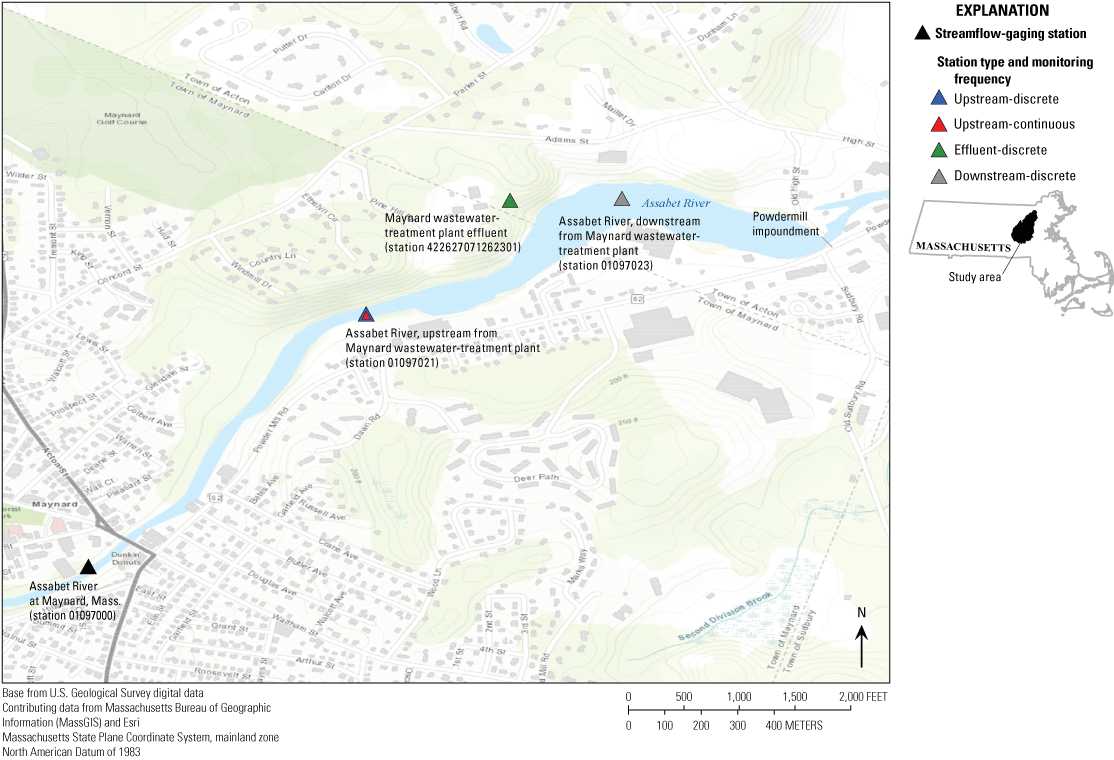
Locations of water-quality monitoring stations near the Maynard wastewater-treatment facility, Maynard, Massachusetts. Names of facilities and receiving water bodies are provided in table 1. Station monitoring frequency, station type, and identification of stations used in the Environmental Protection Agency Aluminum Criteria Calculator are provided in table 2.
Water-Treatment Facilities with Pond Receiving-Water Bodies
The three WTFs discussed here (Cohasset, Fitchburg, and Westborough WTF) have receiving-water bodies that are ponds. Depending on the location of the effluent discharge relative to the pond inflow and outflow, the designation of a monitoring station as upgradient or downgradient from effluent discharge was not always possible. Consequently, monitoring stations on ponds were established in areas thought to be outside of the immediate effect of the effluent discharge.
Cohasset Water-Treatment Facility
Lily Pond is the EPA-designated receiving-water body for the effluent discharge from the Cohasset WTF. The sources of water to the Cohasset WTF are from surface water (Cohasset Water Department, 2021). Lily Pond is 51 acres in area with a maximum depth of about 8 ft (ENSR International, 2003). The drainage area to Lily Pond is 2.5 mi2 but totals 8.89 mi2 if the drainage area above the Bound Brook Control Structure is included (not shown). The outflow of Lily Pond (Herring Brook) joins with the outflow from Aaron River Reservoir (Aaron River) to form Bound Brook, which is a tributary to the Gulf River estuary.
The following three monitoring stations are associated with the Cohasset WTF: two stations at a deep hole in the pond, Lily Pond deep hole (shallow) (station 421326070485802) and Lily Pond deep hole (station 421326070485801); and an effluent station, Cohasset water-treatment plant backwash effluent (station 421334070490601) (fig. 7).
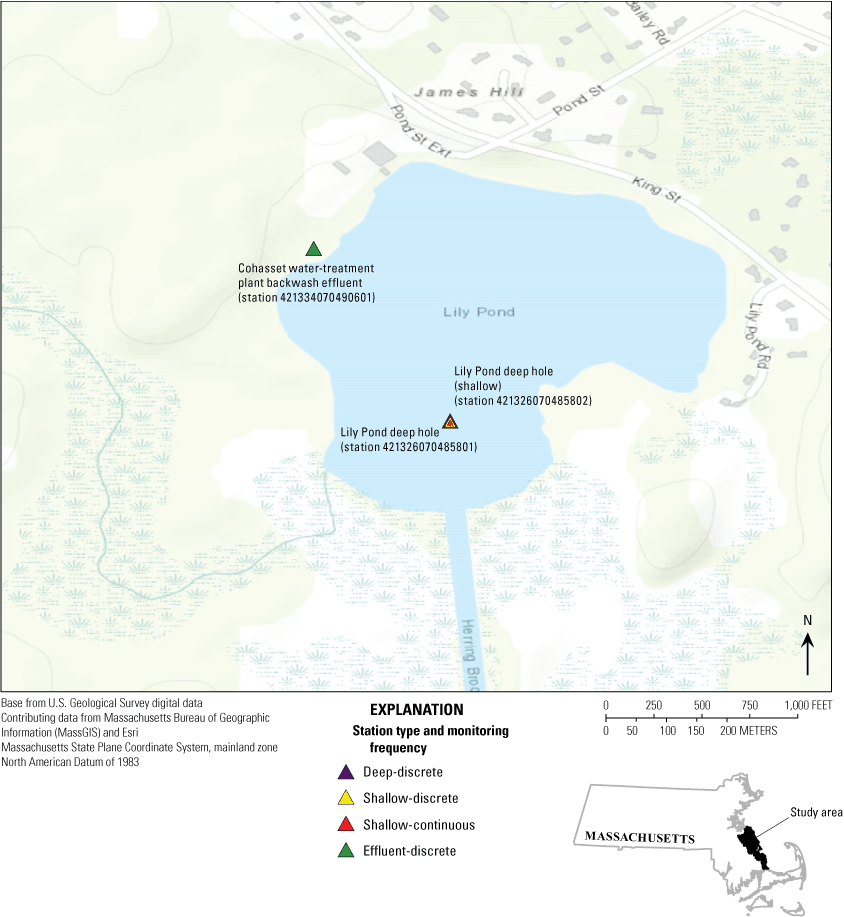
Locations of water-quality monitoring stations near the Cohasset water-treatment facility, Cohasset, Massachusetts. Names of facilities and receiving-water bodies are provided in table 1. Station monitoring frequency, station type, and identification of stations used in the Environmental Protection Agency Aluminum Criteria Calculator are provided in table 2.
Fitchburg Water-Treatment Facility
The EPA-designated receiving-water body for the effluent discharge from the Fitchburg WTF facility is Wyman Pond (fig. 8). The source of water for the Fitchburg WTF is surface water. The Fitchburg WTF and Wyman Pond are both in the town of Westminster, Mass. Wyman Pond is a reservoir constructed by damming Wyman Brook. The pond is 198 acres in area with a maximum depth of about 14 ft with a contributing drainage area of 11.8 mi2 at the dam. The pond is long, narrow, and sinuous in shape at its inflow end and broadest near the outflow end of the pond. Flow at the inflow end of the pond is thought to generally be in one direction from the south toward the dam at the north end of the pond. The Fitchburg WTF effluent discharges to the pond on the northwest side of Wyman Pond about 0.5 mi from the dam. The outflow of Wyman Pond is over a spillway at the dam or through the gates at the gatehouse. Wyman Pond outflows to Wyman Brook, a tributary to Flag Brook, which flows to the North Nashua River (not shown).
The following five monitoring stations are associated with the Fitchburg WTF: two stations at the upgradient end of the pond, Wyman Pond, Leino Park Road, shallow, Westminster, Mass. (station 423132071523401), and Wyman Pond, Leino Park Road, deep, Westminster, Mass. (station 423132071523402); an effluent station, Fitchburg water treatment plant backwash effluent (station 423215071534101); and two stations at a deep hole near the outlet end of the pond, Wyman Pond shallow, Westminster, Mass. (station 423211071524701), and Wyman Pond deep, Westminster, Mass. (station 423211071524702) (fig. 8).
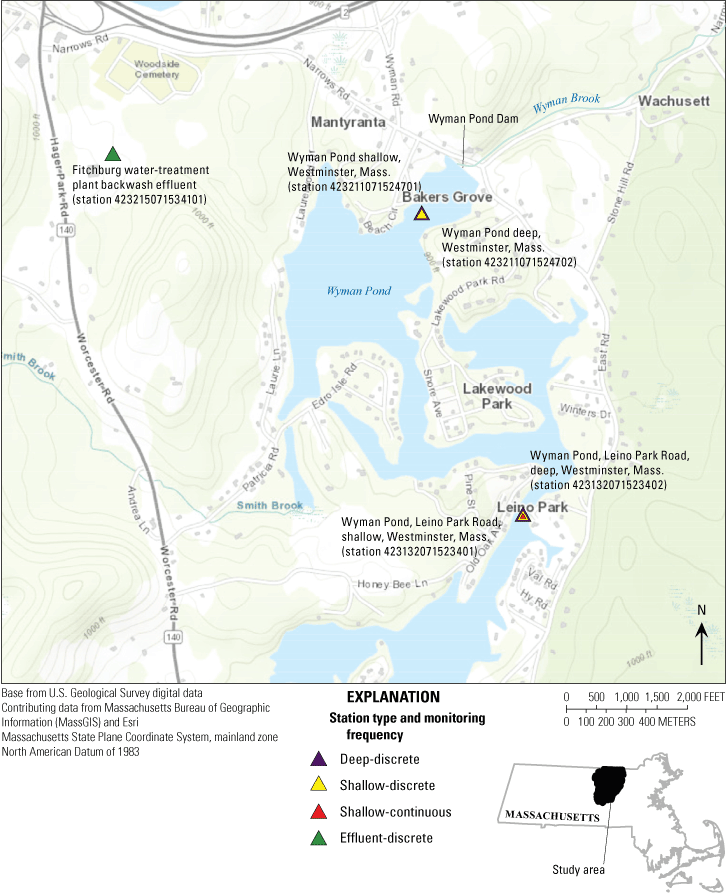
Locations of water-quality monitoring stations near the Fitchburg water-treatment facility, Westminster, Massachusetts. Names of facilities and receiving-water bodies are provided in table 1. Station monitoring frequency, station type, and identification of stations used in the Environmental Protection Agency Aluminum Criteria Calculator are provided in table 2.
Westborough Water-Treatment Facility
Hocomonco Pond is the EPA-designated receiving-water body for the effluent discharge from the Westborough WTF. The source of water to the Westborough WTF is primarily from groundwater pumped from wells. Hocomonco Pond is a shallow 28-acre pond with a maximum depth of about 8 ft. A small intermittent tributary enters Hocomonco Pond from the northwestern side of the pond. The effluent from the Westborough WTF discharges into Hocomonco Pond on the western side of the pond, less than 300 ft southwest of the mouth of the intermittent tributary. The outflow from Hocomonco Pond is from the east side of the pond to a small brook that is tributary to the Assabet River upstream from the Westborough WWTF. Hocomonco Pond is an EPA Superfund site, and a pump-and-treat facility at the southeastern side of the pond pumps and treats groundwater to remove creosote from the aquifer underlying the pond (Hansen, 1993). The area is fenced on the eastern and southern sides of the pond, and permission from the EPA is needed to access the site.
The following four monitoring stations are associated with the Westborough WTF: an effluent station, Westborough water-treatment plant backwash effluent (station 421627071392401); two stations near the deep hole in the pond, Hocomonco Pond shallow, Westborough, Mass. (station 421622071385701), and Hocomonco Pond deep, Westborough, Mass. (station 421622071385702); and a station at the pond outlet, Hocomonco Pond near Otis Street, Westborough, Mass. (station 421628071384501) (fig 9).
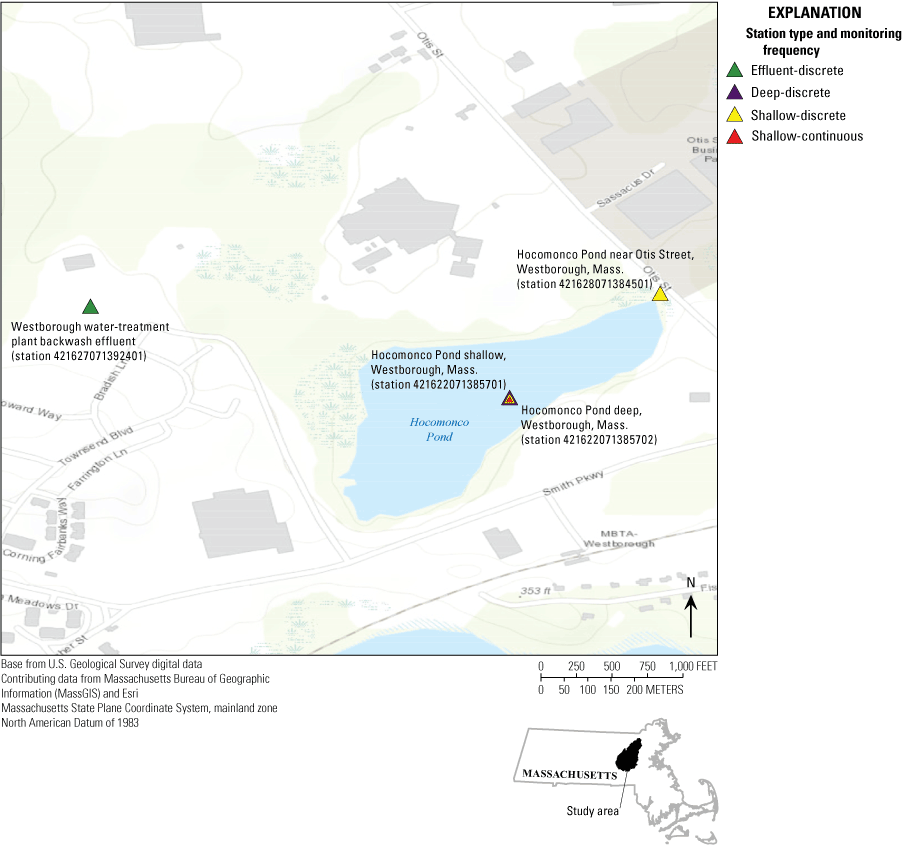
Locations of water-quality monitoring stations near the Westborough water-treatment facility, Westborough, Massachusetts. Names of facilities and receiving-water bodies are provided in table 1. Station monitoring frequency, station type, and identification of stations used in the Environmental Protection Agency Aluminum Criteria Calculator are provided in table 2.
Water-Treatment Facilities with Stream Receiving-Water Bodies
The four WTFs discussed in this section (Hanover, Leominster, Weymouth, and Wilmington) have receiving-water bodies that are streams. The effluent from the Weymouth WTF is initially discharged into a pond whose outflow is tributary to a brook that is the EPA-designated receiving-water body; therefore, Weymouth is included with facilities that have streams as receiving-water bodies.
Hanover Water-Treatment Facility
Third Herring Brook is the EPA-designated receiving-water body for the effluent discharge from the Hanover WTF. The source of water for the treatment plant is groundwater from an aquifer adjacent and underlying Third Herring and Silver Brooks (fig. 10). The effluent from the Hanover WTF does not discharge directly into Third Herring Brook. The effluent first discharges to a wetland, flows about 650 ft to Silver Brook, and then flows about 750 ft down Silver Brook to the juncture with Third Herring Brook. Downstream, Third Herring Brook flows through Old Pond Meadows about 1 mi to join with Wildcat Brook (not shown), then flows another 2 mi to join with the Indian Head River to form the North River, which discharges to the Atlantic Ocean about 10 mi downstream.
Streamflows in Third Herring Brook and in Silver Brook are affected by groundwater withdrawals by the production wells for the Hanover WTF and the Norwell WTF, which is on the northeastern side of Third Herring Brook. Silver Brook is generally dry in summer, possibly because the production wells deplete streamflow or intercept groundwater that would have discharged to the brook (Parker and Craddock, 2012, p. 33). During August 2018, Third Herring Brook dried completely in the area of the Hanover and Norwell well fields.
The following three monitoring stations are associated with the Hanover WTF: a station upstream from the effluent discharge, Third Herring Brook Pond Street near Hanover, Mass. (station 011058065); an effluent station, Hanover water-treatment plant backwash effluent (station 420754070495801); and a station downstream from the effluent discharge, Third Herring Brook, downstream water-treatment plant, near Hanover, Mass. (station 011058075) (fig. 10).
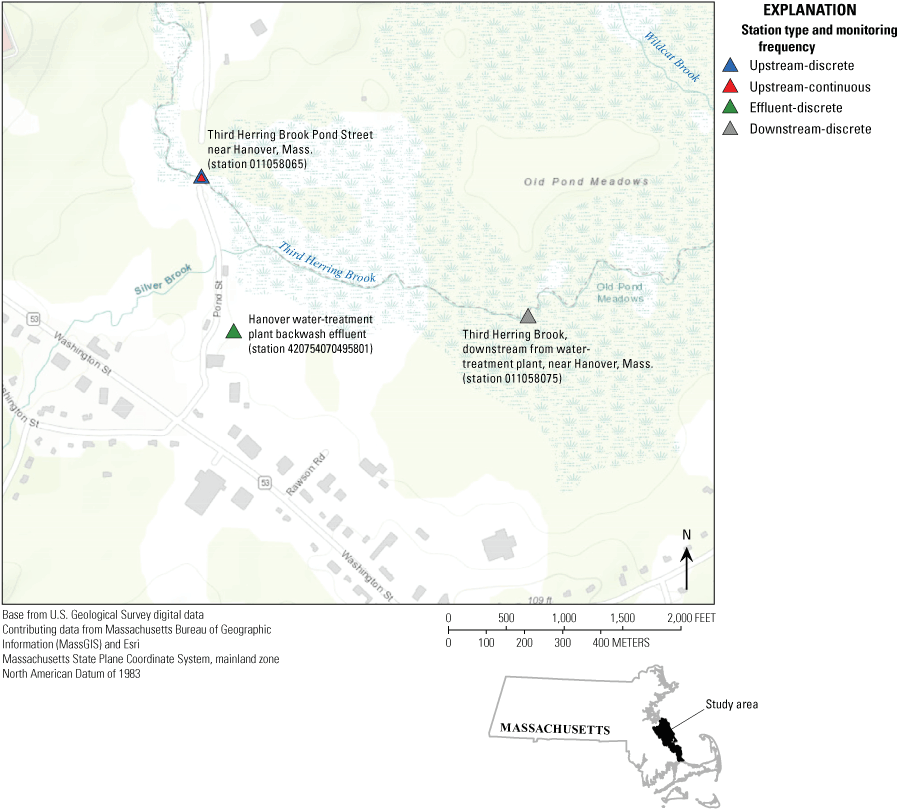
Locations of water-quality monitoring stations near the Hanover water-treatment facility, Hanover, Massachusetts. Names of facilities and receiving-water bodies are provided in table 1. Station monitoring frequency, station type, and identification of stations used in the Environmental Protection Agency Aluminum Criteria Calculator are provided in table 2.
Leominster Water-Treatment Facility
Monoosnoc Brook is the EPA-designated receiving-water body for the effluent discharge from the Leominster WTF. The primary source of water for the Leominster WTF is from surface water. Monoosnoc Brook has a drainage area of 5.07 mi2 at the Leominster WTF. Streamflow in the brook is altered by upstream reservoirs and water withdrawals. Downstream, Monoosnoc Brook flows into the city of Leominster where it joins with the North Nashua River (not shown).
The following three monitoring stations are associated with the Leominster WTF: a station upstream from the effluent discharge, Monoosnoc Brook upstream Leominster water-treatment plant (station 01094420); an effluent station, Leominster water-treatment plant backwash effluent (station 423258071480701); and a station downstream from the effluent discharge, Monoosnoc Brook, downstream Leominster water-treatment plant (station 01094422) (fig. 11).
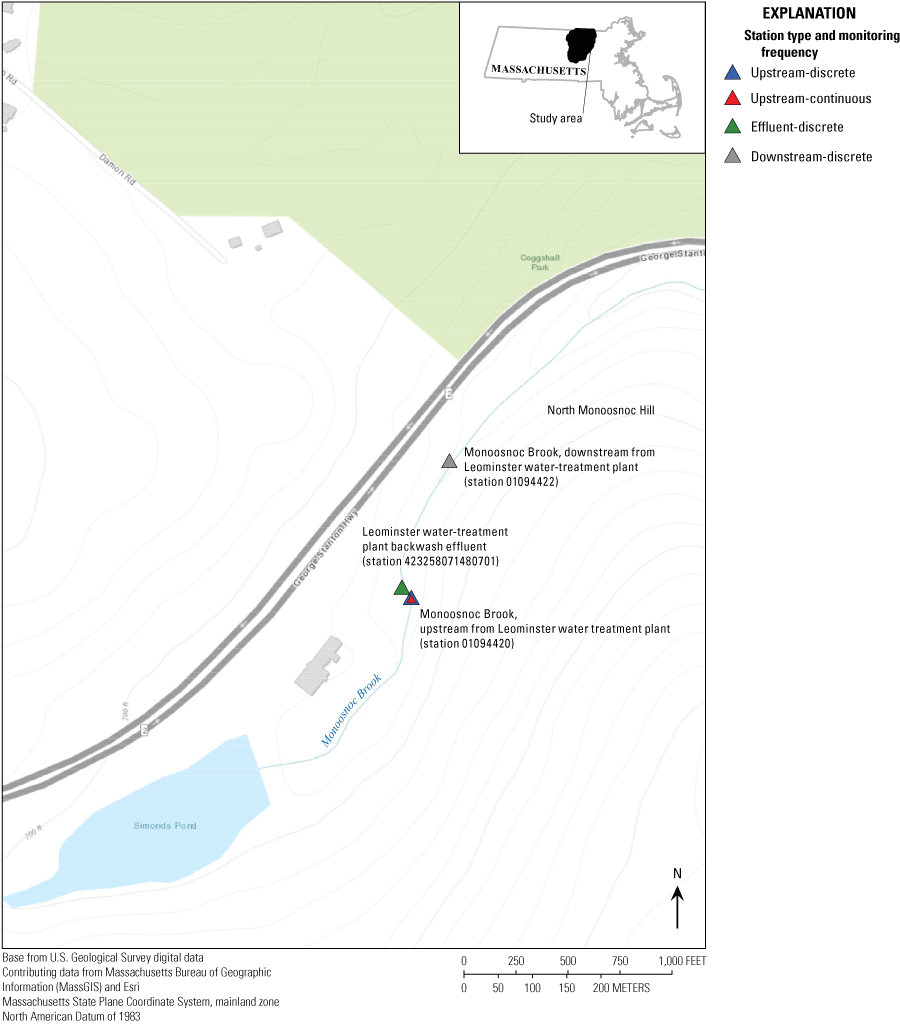
Locations of water-quality monitoring stations near the Leominster water-treatment facility, Leominster, Massachusetts. Names of facilities and receiving water bodies are provided in table 1. Station monitoring frequency, station type, and identification of stations used in the Environmental Protection Agency Aluminum Criteria Calculator are provided in table 2.
Weymouth Water-Treatment Facility
The Mill River is the EPA-designated receiving-water body for the effluent discharge from the Weymouth WTF. The primary source of water to the Weymouth WTF is from surface water (fig. 12). Great Pond is in the headwaters of the Mill River. Downstream, Mill River joins with the Old Swamp River in Whitman’s Pond (not shown) and ultimately discharges to the Weymouth Back River estuary. The Weymouth WTF effluent is discharged to an embayment of Great Pond at the outlet (northern end) of Great Pond that is separated from water exchanges with the main body of Great Pond except at high pond water levels. The outflow from Great Pond flows through a control structure at the dam near Randolph Street (rebuilt in 2020) and down a small stream channel to the Mill River. Historically, the Mill River originated at Great Pond. The outflow from Great Pond is reported as the natural source of the Mill River in Wandle (1984), and the tributary paralleling the Massachusetts Bay Transportation Authority Kingston/Plymouth Commuter Rail Line is designated as the Mill River by O’Brien and others (2002). The tributary parallel to the rail line was designated as Mill River (segment MA74–04) by O’Brien and others (2002), and the station established on this tributary is designated as the ambient (upstream) station for Mill River for this report. The outflow from Great Pond joins Mill River about 0.5 mi downstream from Great Pond. Mill River is a small wetland stream at this juncture with a drainage area of 3.68 mi2. A station was not established on Mill River downstream from where the outflow from Great Pond joins with the Mill River.
The following four monitoring stations are associated with the Weymouth WTF: a station upstream from where the outflow from Great Pond joins with the Mill River, Mill River near Randolph Street, South Weymouth, Mass. (station 01105587); an effluent station, Weymouth water-treatment plant effluent (station 420959070580401); and two stations on the pond embayment that receive the effluent discharge at the outlet (northern end) of Great Pond, Great Pond near outlet, shallow, South Weymouth, Mass. (station 421004070580201), and Great Pond near outlet, deep, South Weymouth, Mass. (station 421004070580202) (fig. 12).
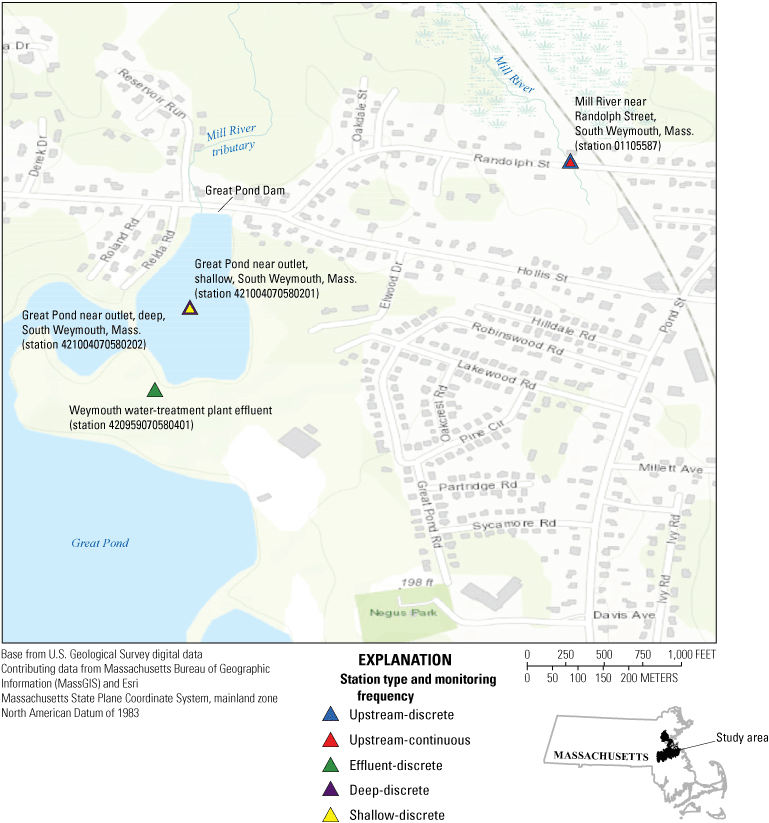
Locations of water-quality monitoring stations near the Weymouth water-treatment facility, Weymouth, Massachusetts. Names of facilities and receiving water bodies are provided in table 1. Station monitoring frequency, station type, and identification of stations used in the Environmental Protection Agency Aluminum Criteria Calculator are provided in table 2.
Wilmington Water-Treatment Facility
Maple Meadow Brook is the EPA-designated receiving-water body for the Wilmington WTF (fig. 13). The water source to the Wilmington WTF is groundwater. The Wilmington WTF effluent does not discharge directly into Maple Meadow Brook. The effluent first discharges to a forested swale and flows downslope toward Sawmill Brook. The effluent moves through a riparian wetland before entering Sawmill Brook, which flows downstream through a large shrub wetland where it joins with Maple Meadow Brook. Water is impounded in the wetland behind a berm that is a remnant of an elevated reach of the Middlesex Canal, built in the early 1800s, and by a beaver dam at the stone abutment where Maple Meadow Brook passes through through the former canal crossing. Downstream, Maple Meadow Brook joins with Lubbers Brook (not shown) to form the headwaters of the Ipswich River.
The following four monitoring stations are associated with the Wilmington WTF: two stations on tributaries upstream from the effluent discharge, Sawmill Brook at Chestnut Street, Wilmington, Mass. (station 01101296), and Maple Meadow Brook, Wilmington, Mass. (station 01101294); an effluent station, Wilmington water-treatment plant backwash effluent (station 423200071100201); and a station downstream from the effluent discharge, Maple Meadow Brook at Middlesex Canal, Wilmington, Mass. (station 01101298), (fig. 13).
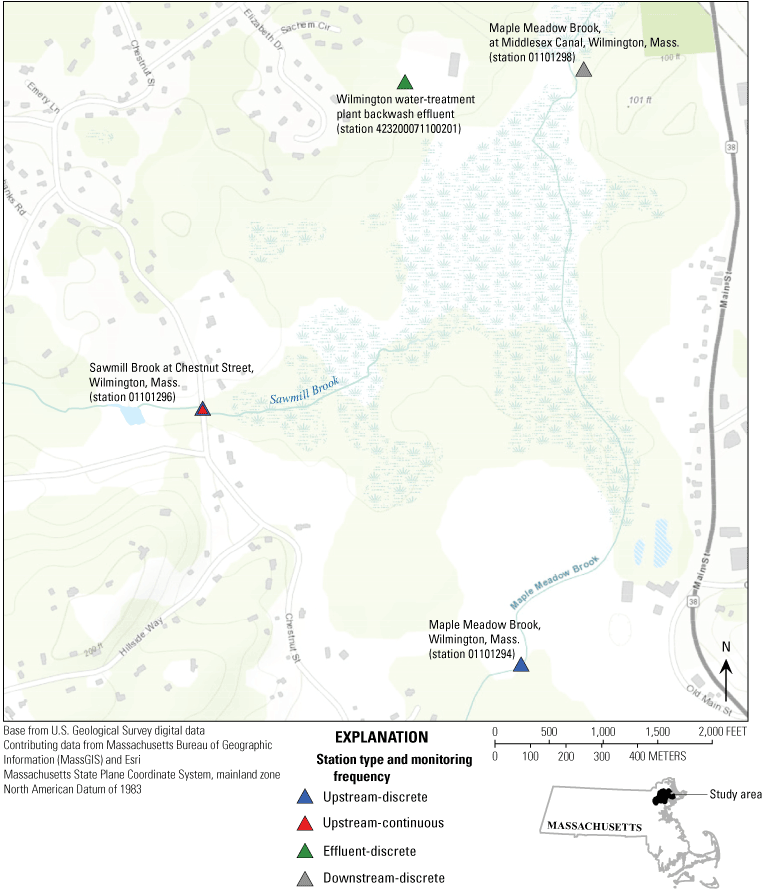
Locations of water-quality monitoring stations near the Wilmington water-treatment facility, Wilmington, Massachusetts. Names of facilities and receiving water bodies are provided in table 1. Station monitoring frequency, station type, and identification of stations used in the Environmental Protection Agency Aluminum Criteria Calculator are provided in table 2.
Data-Collection and Data-Processing Methods
This section describes the methods used for collection and processing of discrete water-quality samples, and for continuous monitoring of water quality, and the methods used for quality assurance and quality control.
Collection and Processing of Water-Quality Samples
The following two types of water-quality data were collected at the monitoring stations: (1) monthly discrete water-quality samples (individual water samples collected at one discrete point in time) and associated field parameters (water temperature, pH, and specific conductance), and (2) continuous water-quality measurements (measurements recorded automatically with water-quality monitors at 15-minute intervals) of water temperature and pH.
Discrete Monthly Water-Quality Sampling
Discrete water-quality samples and field parameters were collected monthly at 38 stations for 10 to 13 months from April 2018 through May 2019. No discrete samples were collected from December 21, 2018, through January 28, 2019, because of a lapse of U.S. Government appropriations. After January 2019, discrete water-quality samples were only collected at ambient (upstream) stations and selected pond stations.
Discrete water-quality samples were collected during this study only when antecedent rainfall conditions at the stations met sampling criteria for “dry-weather” sampling to minimize the effect of stormwater runoff on water-quality conditions. Dry-weather conditions were defined as antecedent dry periods that had less than 0.1 inch (in.) of rain during a 1- to 3-day period before sampling. The length of antecedent dry period required for each station varied by water-body type: 1 day of antecedent dry conditions was required for ponds, 2 days for streams, and 3 days for rivers. All samples associated with a facility were collected on the same day. For facilities with stations on both streams and ponds (Weymouth), the longer antecedent dry period (2 days) was used. The stations on the Assabet River in Westborough and the Mill River in Weymouth (fig. 12) had small contributing drainage areas (less than 10 mi2) and were classified with stream stations (requiring 2 days of antecedent dry conditions).
A web-based Doppler rainfall map was used on the morning of each sampling day to determine which stations met the antecedent dry-period criteria. The rainfall maps were accessed from the iWeatherNet web page (iWeatherNet, 2021). The iWeatherNet rainfall maps are updated hourly from Doppler radar and provide estimates of rainfall for 24-, 48-, and 72-hour periods across Massachusetts. Rainfall from summer thunderstorms can be localized, and the Doppler rainfall maps provided more spatially representative coverage of rainfall conditions across Massachusetts than data from individual precipitation gages.
The magnitude of streamflow can affect water-quality conditions. During high-flow periods, concentrations of some water-quality constituents may decrease because of dilution or increase because of suspension of sediments and inputs from stormwater runoff. During low-flow periods, streamflow is predominantly base flow and groundwater can have a greater effect on stream water-quality conditions. In this study, water-quality samples were collected during a range of flow conditions. Streamflow conditions differ within and among years during the study period. Mean daily streamflow records from the USGS streamflow-gaging station on the Assabet River near Maynard, Mass. (station 01097000), were used to compare streamflow conditions during the study to historical streamflow conditions. A hydrograph showing mean daily streamflow during the study (water years 2018 and 2019) in comparison to the interquartile range (the area between the 25th and 75th percentile) of historical means of long-term discharge (based on the 1942–2017 period of record) indicates that streamflow conditions during the period of water-quality sampling were normal or above normal throughout most of the study period except for a few months in summer 2018 (June and July) when streamflow conditions were below normal (fig. 14).
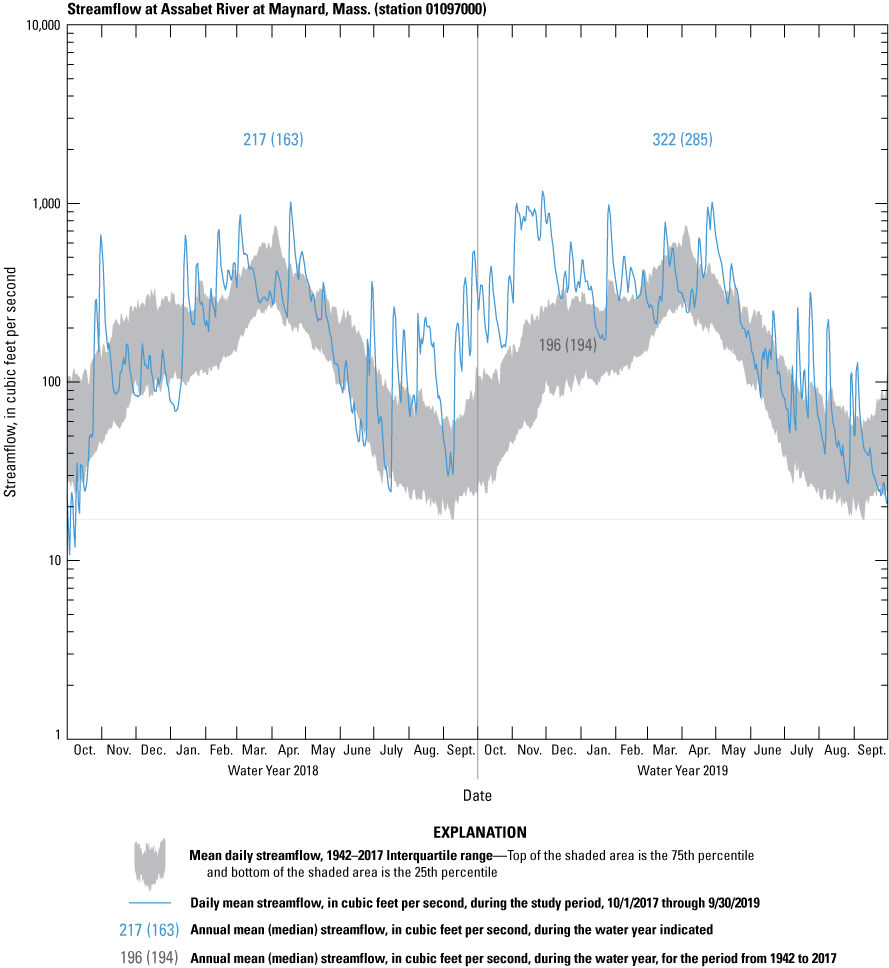
Interquartile range of mean daily streamflow from 1942 to 2017 at Assabet River at Maynard (station 01097000) repeated and overlaid with daily mean streamflow during the study period, water years 2018–19, Assabet River, Maynard, Massachusetts.
Discrete water-quality samples were collected, processed, and analyzed for organic carbon, filtered calcium and magnesium, and total aluminum concentrations. Organic carbon was analyzed as DOC, which is defined as the organic carbon that passes through a 0.45-micrometer pore-size silver filter or 0.7-micrometer pore-size glass-fiber filter, and as TOC, which is unfiltered and includes particulates. DOC is considered the chemically reactive fraction and typically consists of a range of organic compounds, including fulvic and humic acids derived from root exudates, microbial biomass, and the decomposition of plant litter and soil organic matter (Thurman, 1985; Liu and others, 2014). Filtered calcium and magnesium were measured on samples after filtration through a 0.45-micrometer pore-size capsule filter. Hardness, which is caused primarily by the divalent cations calcium and magnesium dissolved in water, was calculated from the sum of filtered calcium and magnesium concentrations, in milliequivalents, and is reported in units of milligrams per liter (mg/L) as CaCO3. Hardness is referred to by its EPA Substance Registry Services name of “total hardness” in this report for consistency with terminology used in the EPA Calculator (EPA, 2018). General guidelines for classification of water on the basis of hardness are as follows: 0 to 60 mg/L as CaCO3 is classified as soft, 61 to 120 mg/L as CaCO3 is classified as moderately hard, 121 to 180 mg/L as CaCO3 is classified as hard, and more than 180 mg/L as CaCO3 is classified as very hard (Hem, 1985). In general, water quality in Massachusetts tends toward lower hardness concentrations in comparison to other areas of the country containing carbonate bedrock (DeSimone, 2009). Water-quality samples collected for determination of aluminum concentrations were analyzed for total aluminum and were not filtered.
Discrete water-quality samples were collected according to standard USGS field sample- collection techniques for the collection of surface-water-quality data (USGS, [variously dated]). Before sampling, all water-quality sampling equipment was cleaned in the USGS New England Water Science Center laboratory in Northborough, Mass. Water-quality sampling bottles that required cleaning (plastic sampling bottles) were rinsed with deionized (DI) water in the Northborough laboratory on the morning of sampling. All plastic sampling bottles also were rinsed with site water before sample collection.
Water-quality samples were collected at river or stream stations using depth-integrated sampling techniques, by use of a depth-integrating hand sampler (DH–81) while wading (fig. 15A) or a depth-integrating hand-line or bridge board sampler (DH–95) while sampling from a bridge, or by pumping with a peristaltic pump (fig. 15B) or by a grab sample, depending on site conditions. When streamflow conditions were low and depth integrated sampling was not possible, grab samples were collected directly from the river using a prerinsed 2-liter (L) polyethylene bottle. In some situations, USGS protocols for sample collection were modified because of safety concerns or access issues. For example, the stations on the Assabet River in Hudson, Maynard, and Marlborough were remote and were accessed using a canoe with an electric motor. At these locations, when the river was too deep to wade and the current too swift to hold the canoe in place, samples were collected with a peristaltic pump with silicone tubing at a set depth (1.5 ft) below the water surface and by pumping directly into a prerinsed 2-L polyethylene bottle while ferrying the canoe back and forth across the river. Field parameters (water temperature, pH, and specific conductance) measured at these stations indicated that the river was well mixed, and samples are considered representative of instream conditions.
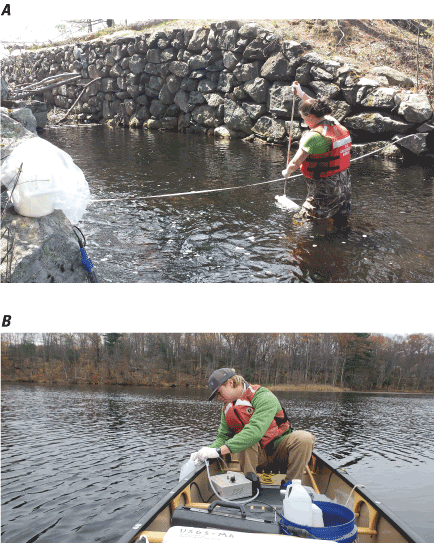
U.S. Geological Survey staff collecting water samples for analysis of local water-quality conditions that are used to demonstrate application of the U.S. Environmental Protection Agency’s (2018) recommended aquatic life water-quality criteria in Massachusetts A, in a stream cross section using a DH–81 sampler while wading and B, in a pond using a peristaltic pump (gray box with tubing) from a canoe. Photographs by Dave Armstrong, U.S. Geological Survey.
For stations on ponds, samples were collected with a peristaltic pump from a single depth and pumping directly into a prerinsed 2-L polyethylene bottle (fig. 15B). Shallow samples were collected at 1.5-ft depth. The sampling depth for deep samples varied; samples were collected as deep as possible while remaining above aquatic vegetation. Effluent grab samples were collected either directly from the discharging pipe or weir using a prerinsed 2-L polyethylene bottle or by pumping into the bottle with a peristaltic pump.
USGS techniques for trace-element sampling (Wilde and others, 1999) were used for sample collection: (1) equipment was constructed of noncontaminating materials and was cleaned rigorously before sample-collection events and between field sites, (2) equipment was handled in a manner that minimizes the chance of altering sample composition, and (3) samples were handled in a manner that prevented contamination.
Water-quality analytes and field parameters for discrete samples collected at and near the 11 water-treatment facilities and their respective USGS parameter codes, analysis methods, and minimum reporting limits are listed in table 4. Samples were filtered and acidified (for preservation) at the USGS laboratory in Northborough and shipped to the USGS National Water Quality Laboratory (NWQL) in Denver, Colorado, for analysis.
Table 4.
Water-quality analytes and minimum reporting levels for discrete samples collected at and near seven water-treatment and four wastewater-treatment facilities in Massachusetts, 2018–19.[Hardness is referred to in this report by its U.S. Environmental Protection Agency Substance Registry Services name of “total hardness.” USGS, U.S. Geological Survey; NWQL, National Water Quality Laboratory; µg/L, microgram per liter; mg/L, milligram per liter; NA, not available; CaCO3, calcium carbonate; NWIS, National Water Information System. ]
| Analyte | Parameter name | USGS parameter code | Analysis Type | Analysis method | NWQL minimum reporting limit |
|---|---|---|---|---|---|
| Aluminum, unfiltered | Aluminum, water, unfiltered, recoverable, µg/L | 01105 | NWQL | Method I–4471-97 (Garbarino and Struzeski, 1998; Garbarino and others, 2006) |
3 µg/L |
| Total organic carbon | Organic carbon, water, unfiltered, mg/L | 00680 | NWQL | Method 5310B (Clesceri and others, 1998) |
0.7 mg/L |
| Dissolved organic carbon | Organic carbon, water, filtered, mg/L | 00681 | NWQL | Method 5310B (Clesceri and others, 1998) |
0.23 mg/L |
| Calcium, filtered | Calcium, water, filtered, mg/L | 00915 | NWQL | Method I–1472–87 (Fishman, 1993) | 0.022 mg/L |
| Magnesium, filtered | Magnesium, water, filtered, mg/L | 00925 | NWQL | Method I–1472–87 (Fishman, 1993) | 0.01 mg/L |
| Specific conductance | Specific conductance, water, unfiltered, microsiemens per centimeter at 25 degrees Celsius | 00095 | Field | U.S. Geological Survey (2018) | NA |
| pH | pH, water, unfiltered, field, standard units | 00400 | Field | U.S. Geological Survey (2018) | NA |
| Water temperature, in degrees Celsius | Temperature, water, degrees Celsius | 00010 | Field | U.S. Geological Survey (2018) | NA |
| Total hardness | Hardness, water, mg/L as CaCO3 (calculated) | 00900 | Algorithm | Computation by NWIS algorithm | NA |
Measurement of Field Parameters
Multiparameter water-quality monitors were used to measure field parameters including water temperature, pH, and specific conductance. Field parameters were measured in accordance with guidelines provided in Gibs and others (2007) for the use of multiparameter instruments for routine field measurements. Sensor calibration was checked the morning of each day of sampling and, if needed, sensors were calibrated before visiting field sites. Specific-conductance sensors were checked in standards covering the range in specific conductance expected at the sites to be sampled on that day based on previous field measurements. Sensors were calibrated when measurements differed from expected readings in standards by more than 5 microsiemens per centimeter (µS/cm) in standards of 100 µS/cm or less or by more than 3 percent for higher conductivity standards. The pH sensors were always calibrated when measurements in pH buffers differed from expected readings in pH standards by more than 0.2 SU and were generally calibrated if measurements differed from expected readings by more than 0.1 SU. These calibration procedures place a general limit on accuracy for pH of plus or minus 0.2 SU for the dataset when pH is considered in total. Calibration data were stored electronically in the water-quality monitors, and calibration log books were kept to help track sensor performance during the study.
Field parameters were measured using a multiparameter water-quality monitor immediately after collection of discrete water-quality samples and were measured “in situ,” meaning in the water body, and not “ex situ,” such as in water drawn from churn splitters, tubing, or sampling bottles. Monitors were submerged in site water upon arrival to a site before sample collection to allow time for equilibration, and readings were allowed to stabilize before recording a measurement. Measurements of field parameters in streams and rivers were made at six-tenths of the depth of the stream at each of the points where water-quality samples had been collected (fig. 16A). Samples were generally collected at 10 locations along a stream cross-section. For small streams (less than 5 to 10 ft wide), the number of sample locations depended on the stream width, and samples were collected at either three locations (left, center, right) or five locations (left, left center, center, right center, and right). If only three measurements were made, the value at the center measurement point was used as the final reported value. If more than three measurements were made, the median value of the cross-section measurements was used as the final value. Field measurements of water temperature, pH, and specific conductance collected across a section of a stream can be used to evaluate the magnitude of variability along the cross section and as an indicator of mixing in streams downstream from effluent discharges or tributary inputs. Measurements of field parameters in ponds (fig. 16B) were made at the same depth for which the discrete sample was collected. Field parameters were also measured along a vertical profile of the pond to evaluate the variability of water temperature, pH, and specific conductance with depth.
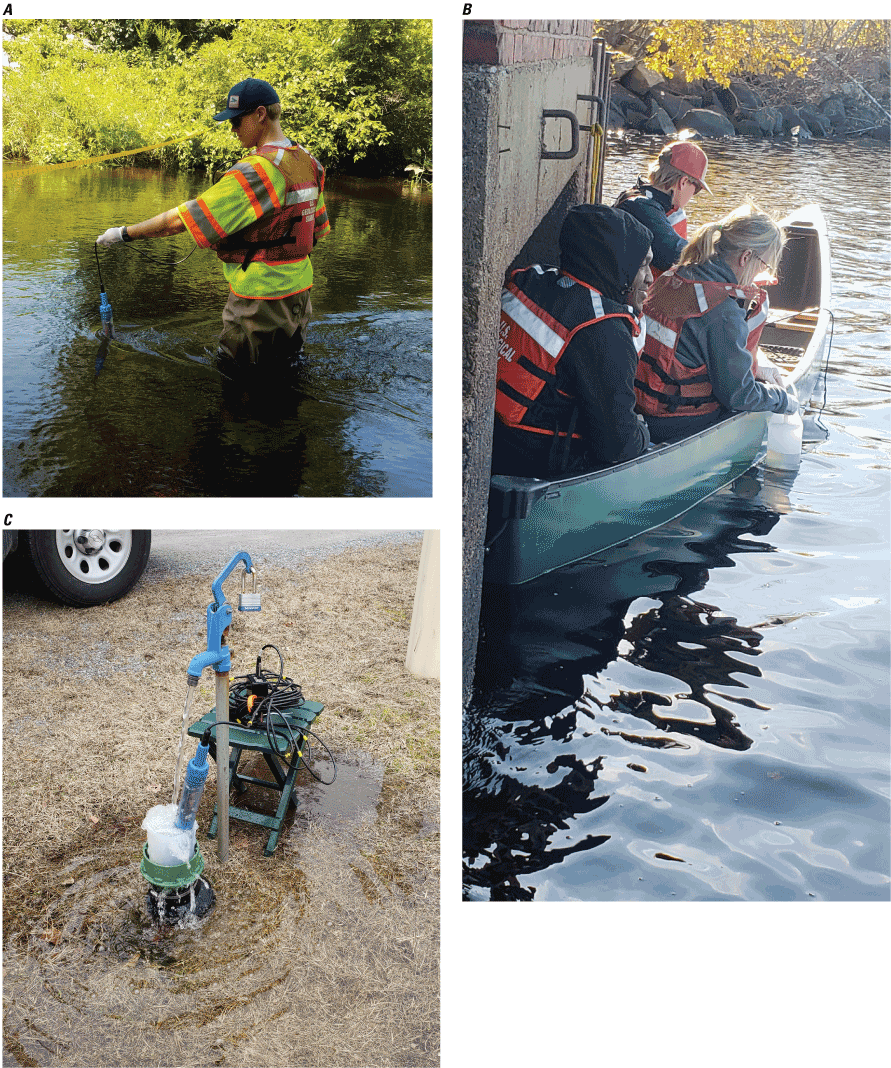
U.S. Geological Survey staff measuring field parameters for analysis of local water-quality conditions that are used to demonstrate application of the U.S. Environmental Protection Agency’s 2018 recommended aquatic life water-quality criteria in Massachusetts A, in a river cross section while wading (using a multiparameter water-quality monitor), B, in a pond from a canoe, and C, in water-treatment facility effluent using a flow-through cell (white cylinder). Photographs by Dave Armstrong, U.S. Geological Survey.
Measurements of field parameters associated with effluent samples were made at the location where the discrete sample was collected. Depending on the station, measurements of field parameters for effluent were measured where effluent flowed over a weir at the lagoon, at the end of the effluent outfall pipe, or in the channel downstream from the outfall if the channel contained only effluent discharge. For instances where effluent discharges were not of enough volume to submerge the monitor, field parameters were measured with a monitor inserted into a flow-through cell while pumping effluent into the cell with a peristaltic pump (fig. 16C). Data were recorded on paper field sheets and then entered in the USGS Personal Computer Field Form for facilitating data entry to the USGS National Water Information System (NWIS) database (USGS, 2020).
Continuous Monitoring of Water Quality
Regular daily fluctuations in pH can result because of the effect of photosynthesis by plants and respiration by aquatic biota and plants at night. During the day, photosynthesis by algae and aquatic vegetation produces dissolved oxygen and converts carbon dioxide to organic matter, causing dissolved carbon dioxide to decrease, increasing pH. During the night, an increase in respiration decreases dissolved oxygen and releases carbon dioxide. Increased metabolic carbon dioxide forms carbonic acid, which dissociates into bicarbonate and hydrogen ions, decreasing pH. The result can be a daily variation in pH, where the pH is typically at a minimum near dawn and at a maximum in mid-to-late afternoon (Nimick and others, 2011; Gammons and others, 2015; Andersen and others, 2017). This regular variation in pH over a 24-hour period (day plus night) is called a diel pH cycle. Slow-moving, highly productive streams, rivers, reservoirs, or ponds with open canopy cover can have large diel swings in pH (about 1 to 2 SU), whereas changes in pH may be small (about 0.1 to 0.2 SU) in forested upland streams.
In addition to photosynthesis and respiration, other factors, such as streamflow, weather (temperature, sunlight, and wind), and groundwater inflow can affect diel variations in water quality. For example, DOC concentrations can also fluctuate daily, seasonally, and with storm events. Recent development of instream optical sensors for measurement of fluorescent dissolved organic matter (FDOM) allows for continuous monitoring of FDOM, which can be used together with high frequency measurement of DOC concentrations to quantify DOC dynamics in streams (Saiers and others, 2021). However, the continuous monitoring of FDOM was not within the scope of this study.
Automatic-monitoring techniques were used to collect continuous (15-minute interval) measurements of water temperature and pH at a station near each of the 11 facilities to capture seasonal, diel, and event-driven fluctuations in water quality. Continuous measurements were recorded at stations upstream from effluent discharge for facilities where the receiving water was a stream or river, or at stations outside the immediate effect of effluent discharge for facilities where the receiving water was a pond (fig. 17A, B, table 2). Continuous measurements were recorded from June 2018 through November 2018 for all stations, with measurements for some stations beginning in April 2018 and extending into April 2019. Continuous measurements collected at the selected stations on Monoosnoc Brook (Leominster), Assabet River (Hudson), and Lily Pond (Cohasset) (table 2) were recorded for longer periods (through February 2019) to represent conditions in streams, rivers, and ponds, respectively.
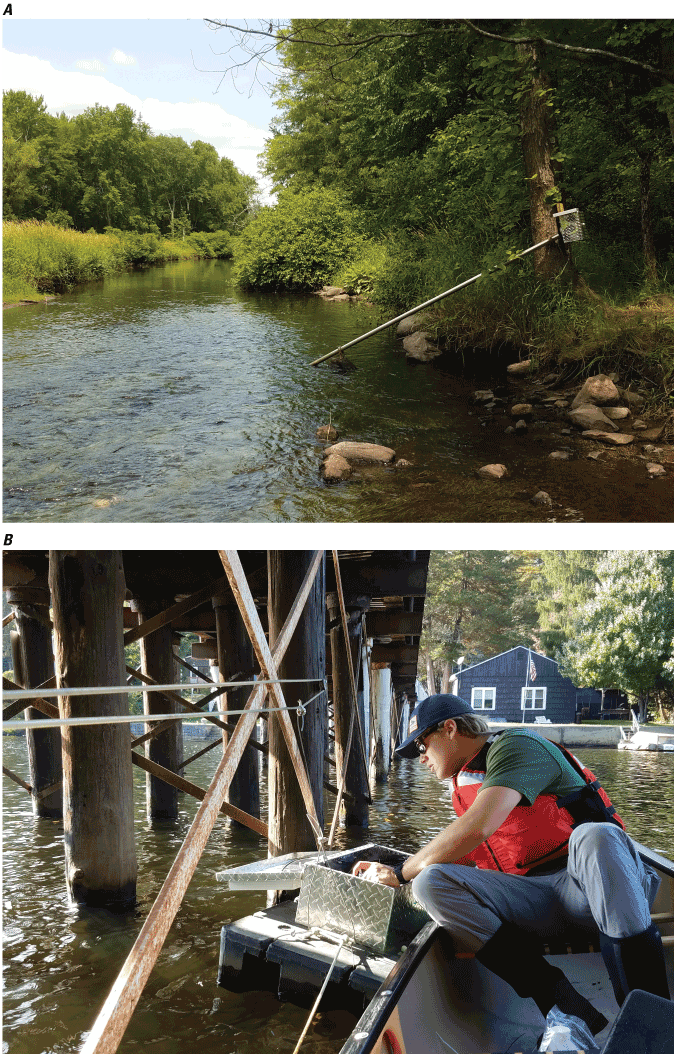
Shelter and monitoring equipment used to collect continuous water-quality data that are used to demonstrate application of the U.S. Environmental Protection Agency’s 2018 recommended aquatic life water-quality criteria in Massachusetts. A, Downstream view of equipment installed on a bank for a river station, and B, equipment installed on a float for a pond station. Photographs by Dave Armstrong, U.S. Geological Survey.
Multiparameter water-quality monitors were deployed for continuous measurement of field parameters at the selected water-quality monitoring stations. Monitors were programmed to measure water temperature and pH at 15-minute intervals and reported readings to a datalogger. The datalogger was programmed to provide the power-distribution controls (turning sensors on and off) and time stamp, and to internally log all sensor data at predetermined sampling frequencies. The datalogger was interfaced with a cellular modem to allow remote-data acquisition and troubleshooting. Data were transmitted by cellular transmission at hourly intervals to the USGS New England Water Science Center Northborough office for uploading to the NWIS web. For stations on streams or rivers, the monitors were equipped with a stage sensor to help determine if the sensors were out of the water during low-flow conditions. Stations on ponds did not need stage sensors because the monitors were installed on floats, which rise and fall with changing water levels. Before deployment, all field water-quality sensors were calibrated in a laboratory-controlled environment. Water-temperature thermistors passed five-point temperature checks against a National Institute of Standards and Technology (https://www.nist.gov)-certified thermometer. Before each site visit, the field monitor’s pH sensor was checked for accuracy against known standards in the USGS Northborough laboratory and calibrated, if needed. Calibration log books were kept to aid in tracking the performance of water-quality sensors during the study.
Maintenance and calibration of continuous monitors followed standard protocols (Wagner and others, 2006; USGS, 2019, 2021a). All site monitors were visited monthly for routine calibration and maintenance. During each site visit, the water temperature, pH, and specific conductance measured by the site water-quality monitor were checked against field monitor measurements to track potentially changing environmental conditions and to aid in applying data corrections. This maintenance included cleaning the monitor and the deployment tube and checking the accuracy of the water-temperature and pH sensors. Measurements of water temperature and pH were taken before and after the sensors were cleaned to help determine the effects of sensor fouling between site visits (fig. 18A). The site monitor pH sensor was then checked in the field against pH standards (4.00, 7.00, and 10.00 SU) (fig. 18B) and calibrated, if needed (fig. 18C). Calibrations were done based on the protocols discussed in Wagner and others (2006); these protocols require calibration if readings in standards are not within 0.2 SU of standard values. If calibration of the pH sensor was needed, the sensor was calibrated to pH 7.0 SU and 4.0 SU and then checked against pH 10.0 SU standard for accuracy. Upon completion of each field visit, fouling and calibration corrections were applied to the data, if needed, in accordance with the procedures outlined in Wagner and others (2006). Data from the sensors were processed in accordance with USGS methods, including those described by Wagner and others (2006) and Pellerin and others (2013).
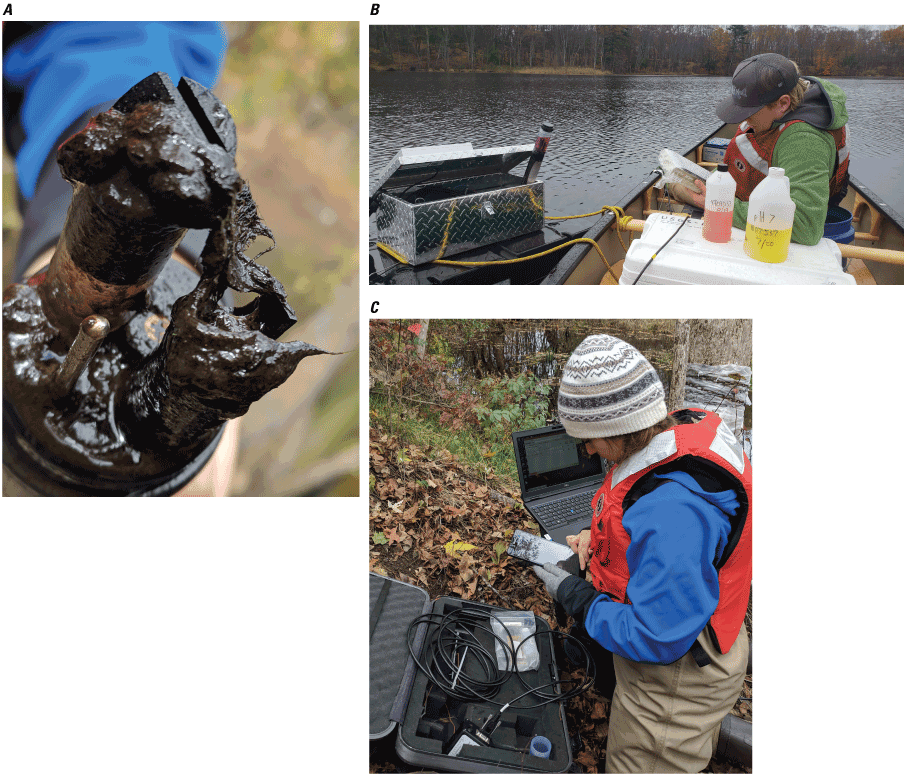
Maintenance of water-quality monitors used to collect continuous water-quality data to demonstrate application of the U.S. Environmental Protection Agency’s 2018 recommended aquatic life water-quality criteria in Massachusetts. A, Fouled multiparameter sensors; B, field calibration of a pH sensor using standard pH buffer solutions; and C, comparing field-parameter readings from field and continuous-multiparameter monitors after cleaning and calibration, using a cell phone to communicate with the datalogger. Photographs by Dave Armstrong, U.S. Geological Survey.
Water-quality monitoring data can be missing for periods because of instrument failure or environmental conditions. Three stations (Monoosnoc Brook, upstream Leominster water-treatment plant [station 01094420] [fig. 11], Assabet River near Westborough, Mass. [station 01096603] [fig. 3], and Mill River near Randolph Street, South Weymouth, Mass. [station 01105587] [fig. 12]), had short periods of missing data (about a month) because of instrument failure during the study period. In addition, water-quality data were not recorded at Wyman Pond, Leino Park Road, shallow, Westminster, Mass. (station 423132071523401) (fig. 8), during a week in October 2018 when the float and equipment were upended during the annual fall lake drawdown. Water-quality data were not recorded from Third Herring Brook in Hanover during late July, August, and early September 2018 because there was no flow in Third Herring Brook in the area of Third Herring Brook Pond Street near Hanover, Mass. (station 011058065) (fig. 10).
Quality Assurance and Quality Control
A quality-assurance program was designed to evaluate the accuracy and precision of the water-quality data collected during this study to ensure that results are representative of actual environmental concentrations. Collection and analysis of quality-control samples are mandated components of USGS water-quality field studies (Mueller and others, 2015). The goal of quality-control sampling is to identify, quantify, and document bias and variability in data that result from the collection, processing, shipping, and handling of samples and to help identify potential sources of sample contamination. Quality-assurance procedures consisted of using appropriate equipment-cleaning and sample-collection techniques and submitting quality-control samples for laboratory analysis.
Blank Samples
Blank samples are collected to determine the likelihood that samples were contaminated by sampling and processing procedures and to trace potential sources of contamination (USGS, variously dated). Equipment and field blanks were collected to determine if analytical results were biased by contamination introduced by the sample-collection equipment used for the study—during the process of cleaning and storing equipment or during sample collection, handling, processing, preserving, or shipping procedures. In the USGS laboratory in Northborough, equipment and field blanks were prepared from DI water produced by a laboratory-grade water-purification system. At the beginning of the study in 2018, four equipment blanks were performed on the 2-L polyethylene bottles that were used to collect grab samples and samples collected with a peristaltic pump. One equipment blank was performed on the silicone tubing used to pump samples in the field and when filtering samples. All other equipment blanks were performed in the laboratory on the churn splitters and silicone tubing that were used to collect and process the samples. Equipment blanks were collected in the laboratory before the sample was processed. For field blanks, DI water was transported to the monitoring stations in prerinsed 2-L polyethylene bottles. Field blank samples were collected immediately before collection of the environmental sample by rinsing and filling a churn splitter with DI water or pumping DI water through the sample tubing using a peristaltic pump. Field blanks were processed in the laboratory in a manner consistent with the collection of environmental and effluent samples.
Replicate Samples
The primary purpose of replicate samples is to identify and quantify the variability in all or part of the sampling and analysis process and to evaluate if sample-collection techniques and analytical results were reproducible (USGS, variously dated). Sample replicates are considered nearly identical in composition to the associated samples and are analyzed for the same chemical properties. Replicate samples, either concurrent, sequential, or splits, were collected randomly, immediately following the first sample (unless the sample was split) based on the same protocols.
Laboratory Matrix Spikes
A laboratory matrix spike (LMS) is a type of quality-control sample used to evaluate the effects of sample matrices (the components of a sample other than the analyte of interest) on the laboratory analysis of a water sample (USGS, variously dated). The purpose of an LMS is to determine if the sample water or sediment matrix creates interferences in analytical recoveries of compounds that may cause positive or negative bias in reported data. To evaluate the potential for matrix effects, the NWQL recommended that an LMS be performed when the specific conductance values of the samples were near or greater than 2,500 µS/cm. Specific conductance values near 2,500 µS/cm were measured in some WWTF effluent samples during this study.
The LMS were prepared by the NWQL by taking a portion of the environmental sample and adding a measured volume of known concentration of elements. At times, the sample required dilution before being split into parent and spike samples, and the spike sample was then related to the parent (or environmental) sample, and relative percent differences were calculated. The LMS were analyzed for selected metals by inductively coupled plasma mass spectrometry exactly like an unspiked sample.
Water-Quality Results from Monthly Discrete Water-Quality Monitoring
A total of 420 discrete water-quality samples were collected for the 38 monitoring stations near each of the 11 water-treatment facilities during the study period (2018–19). The 420 water-quality samples included 306 ambient samples from streams, rivers, ponds, or reservoirs and 114 effluent samples from WWTFs or WTFs. The water-quality data collected for this study are available to the public online from the USGS NWIS web interface (USGS, 2020). The data also can be retrieved from NWIS web using the dataRetrieval package (DeCicco, 2020) of the R software environment (R Core Team, 2020). The monthly discrete water-quality data collected for each of the 38 stations also are available in a data release (Armstrong and others, 2022; available for download at https://doi.org/10.5066/P95WCT5T). The data release includes the monthly discrete water-quality data (including pH, DOC, and total hardness) used as inputs to the EPA Calculator and provides the monthly site-dependent CMC and CCC output values for the selected stations used near each of the 11 water-treatment facilities. The data release also includes time-series plots and summary statistics for each water-quality constituent at each station.
Comparisons of Water Quality Among Ambient Stations
The water-quality parameters that affect aluminum toxicity (pH, DOC, and total hardness), varied among stations associated with the 11 facilities considered in this study. Water-quality conditions were often similar for one or more of the water-quality parameters (pH, DOC, or total hardness) for nearby stations that were upstream and downstream on the same river or stream or for stations with water-quality data collected from similar depths within the same pond. Although the data indicated some similarities among one or more water-quality parameters in similar water-body types (such as streams, rivers, impoundments, and ponds); ultimately, the aluminum criteria values calculated for stations were based on the local water chemistry conditions in the water body.
Boxplots of monthly discrete pH, DOC, total hardness, and aluminum in figures 19–22 show the values for the ambient (upstream) stations and pond stations outside of the immediate effect of effluent discharges. For facilities with multiple ambient (upstream) stations (Wilmington) or multiple pond stations (Cohasset, Fitchburg, and Westborough-WTF), the boxplots were developed using the combined data from those stations. Summaries of the water-quality results and comparisons of pH, DOC, total hardness, and aluminum among stations are reported below. The reported medians and minimum and maximum values were calculated from all discrete water-quality samples—no values were removed as outliers. The seasonal patterns in monthly discrete pH, DOC, total hardness, and aluminum are also discussed below, and plots showing monthly values for these parameters for each station are provided in the data release (Armstrong and others, 2022).
Comparisons of pH Among Ambient Stations
A comparison of pH values measured during the monthly discrete water-quality sampling indicated a wide range of variation of pH among stations (fig. 19). Overall, the pH values ranged from 5.0 to 8.6 SU. Median pH values for the stations varied by 1.3 SU (from 5.9 to 7.2 SU).
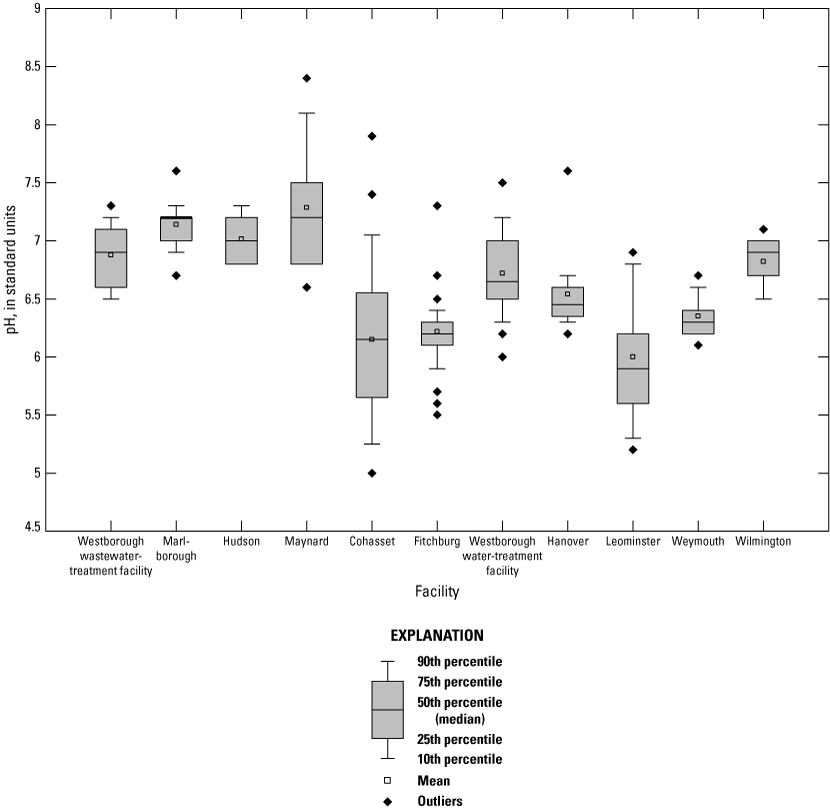
Distribution of pH measured as a field parameter during monthly sampling at selected ambient stations near 11 water-treatment facilities in eastern and central Massachusetts, 2018–19. Data used for the boxplots are only those from selected ambient stations used for aluminum calculations, as identified in table 2. Facility and station names are provided in table 2.
The pH values for the ambient (upstream) stations on the Assabet River in Westborough, Marlborough, Hudson, and Maynard (stations 01096603, 01096720, 01096870, and 01097021, respectively) had similar pH ranges that were among the highest observed during the study. Median pH values for these stations ranged from 6.9 to 7.2 SU. The pH values for stations on the Assabet River in Marlborough, Hudson, and Maynard indicated similar seasonal patterns. For these stations to have similar seasonal patterns was not unexpected because the stations are all on the Assabet River (fig. 1). Monthly pH values tended to be highest (more than 7.0 SU) from June through September, and lowest (less than 7.0 SU) from October through February. The lowest monthly pH values (6.5 SU) were measured in the headwaters of the Assabet River (Assabet River near Westborough, Mass. [station 01096603]) (fig. 3) in July, August, and September, and the highest pH value (8.6 SU) was measured in an impoundment at the most downstream station (Assabet River, downstream Maynard wastewater-treatment plant [station 01097023]) (fig. 6) during June.
The pH values for the pond stations associated with the Cohasset and Fitchburg WTFs were lower than those for the ambient (upstream) stations on the Assabet River associated with WWTFs. The median pH values for the ambient (upstream) stations and pond stations associated with WTFs ranged from 5.9 to 6.9 SU. Various sets of stations with similar pH values were in close geographic proximity to one another (Leominster and Fitchburg; and Cohasset and Weymouth), indicating that the pH values may be affected by basin characteristics such as bedrock type, glacial geology, soils, and vegetation.
Stations on Monoosnoc Brook (Leominster), Lily Pond (Cohasset), and Wyman Pond (Fitchburg) had some of the lowest pH values observed during the monthly discrete sampling. A pH value of 5.2 SU was measured in December at Monoosnoc Brook, upstream Leominster water-treatment plant (station 01094420); a pH value of 5.0 SU was measured in November at Lily Pond deep hole (shallow) (station 421326070485802) and Lily Pond deep hole (station 421326070485801); and a pH value of 5.5 SU was measured in September at Wyman Pond, Leino Park Road, deep, Westminster, Mass. (station 423132071523402). The low monthly pH values measured in fall and winter at many stations indicate the importance of collecting water-quality data throughout the year to collect the full range of water-quality conditions at a station.
Comparisons of Dissolved Organic Carbon Among Ambient Stations
The DOC concentrations for the ambient (upstream) stations on the Assabet River in Westborough, Marlborough, Hudson, and Maynard (stations 01096603, 01096720, 01096870, and 01097021, respectively) had similar values (fig. 20). Minimum and maximum monthly DOC concentrations for these stations ranged from 2.69 to 6.46 mg/L, and median monthly DOC concentrations ranged from 4.29 to 5.32 mg/L. The monthly DOC concentrations for the ambient (upstream) stations in Marlborough, Hudson, and Maynard indicated similar seasonal patterns and were highest in July (5.81, 6.39, and 6.46 mg/L, respectively) and lowest in March (2.80, 2.69, and 2.79 mg/L, respectively). DOC concentrations began declining after leaf fall, in November, and generally did not recover to November values until May.
The DOC concentrations at the stream and pond stations associated with WTFs had a wider range of values than DOC concentrations in the Assabet River associated with the WWTFs (fig. 20). The stations with the lowest DOC concentrations were on Wyman Pond in Fitchburg and Hocomonco Pond in Westborough. The DOC concentrations at Wyman Pond stations 1–4 (stations 423132071523401, 423132071523402, 423211071524701, and 423211071524702, respectively) (fig. 8) ranged from 1.68 to 4.65 mg/L, and the median DOC concentration for all four stations was 3.10 mg/L. The DOC concentrations at Hocomonco pond stations 1 and 2 (stations 421622071385701 and 421622071385702, respectively) and at Hocomonco Pond near Otis Street, Westborough, Mass. (station 421628071384501) (fig. 9), ranged from 1.92 to 5.17 mg/L, and the median DOC concentration for all three stations was 3.30 mg/L (fig. 20). The stations with the highest DOC concentrations and greatest range of DOC were for Lily Pond in Cohasset and Third Herring Brook in Hanover. The DOC concentrations for pond stations 1 and 2 on Lily Pond in Cohasset (stations 421326070485802 and 421326070485801, respectively) (fig. 7) ranged from 6.99 to 18.9 mg/L, and the DOC concentrations for the upstream station on Third Herring Brook in Hanover (station 011058065) (fig. 10) ranged from 4.12 to 11.7 mg/L.
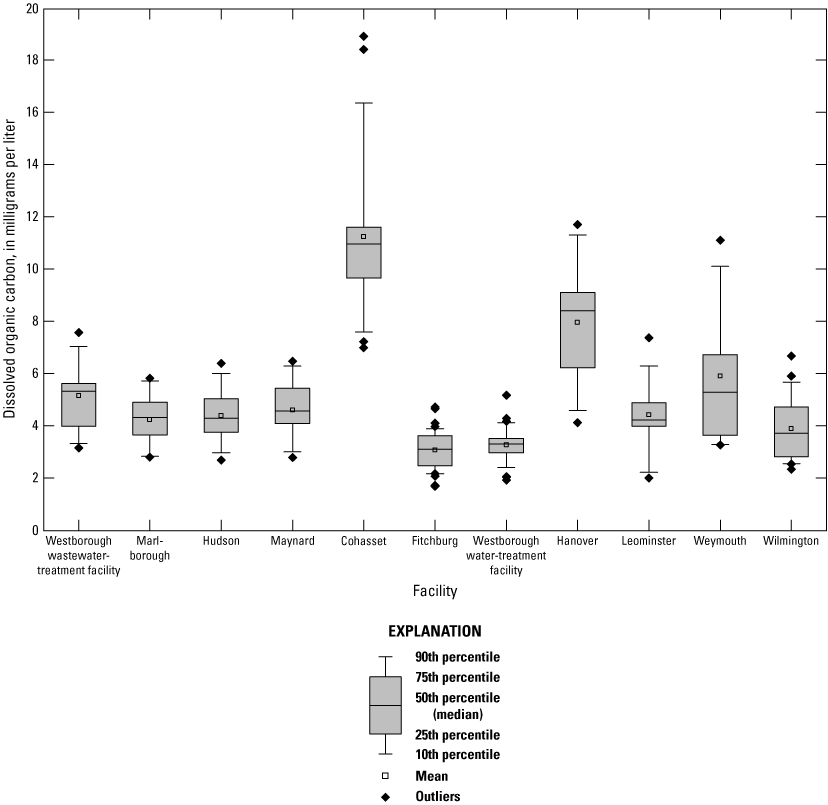
Distribution of concentrations of dissolved organic carbon measured in samples collected monthly at selected ambient stations near 11 water-treatment facilities in eastern and central Massachusetts, 2018–19. Data used for the boxplots are only those from selected ambient stations used for aluminum calculations, as identified in table 2. Facility and station names are provided in table 2.
Comparisons of Total Hardness Among Ambient Stations
The median monthly total hardness concentrations for the ambient (upstream) stations on the Assabet River in Marlborough, Hudson, and Maynard ranged from 47.2 to 86.7 mg/L as CaCO3 (fig. 21). Of these stations, the highest total hardness concentration (172 mg/L as CaCO3) was measured in July at Assabet River at Boundary Street near Northborough, Mass. (station 01096720), and the lowest total hardness concentration (41.8 mg/L as CaCO3) was detected in November at Assabet River, upstream Maynard wastewater-treatment plant (station 01097021) (fig. 6). Total hardness concentrations at these stations indicated similar seasonal patterns. Total hardness concentrations at these stations were highest from May through October and lowest from November through April.
The total hardness concentrations detected at four of the stations on streams had similar values to those from the Assabet River. The median monthly total hardness concentrations ranged from 47.1 to 87.2 mg/L as CaCO3 at Third Herring Brook (station 011058065), the Assabet River near Westborough (station 01096603), Mill River (station 01105587), and Sawmill and Maple Meadow Brooks (stations 01101296 and 01101294, respectively).
A comparison of total hardness concentrations among stations indicated that total hardness concentrations were lowest at the ambient (upstream) station on Monoosnoc Brook (Leominster) and the pond stations on Wyman Pond (Fitchburg) (fig. 21). Total hardness concentrations were also low for the pond stations on Lily Pond (Cohasset). The median monthly total hardness concentration at Monoosnoc Brook, upstream Leominster water-treatment plant (station 01094420) was 7.05 mg/L as CaCO3, and monthly total hardness concentrations ranged from 5.13 to 39.7 mg/L as CaCO3. The median monthly total hardness concentrations at Wyman Pond stations 1–4 (stations 423132071523401, 423132071523402, 423211071524701, and 423211071524702, respectively) ranged from 9.98 to 13.0 mg/L as CaCO3 and the monthly total hardness concentrations ranged from 8.77 to 13.5 mg/L as CaCO3. Median monthly total hardness concentrations were 25.7 and 24.6 mg/L as CaCO3 at Lily Pond stations 1 and 2 (stations 421326070485802 and 421326070485801, respectively) (fig. 7), and the monthly total hardness concentrations for these stations ranged from 15.4 to 28.9 mg/L as CaCO3.
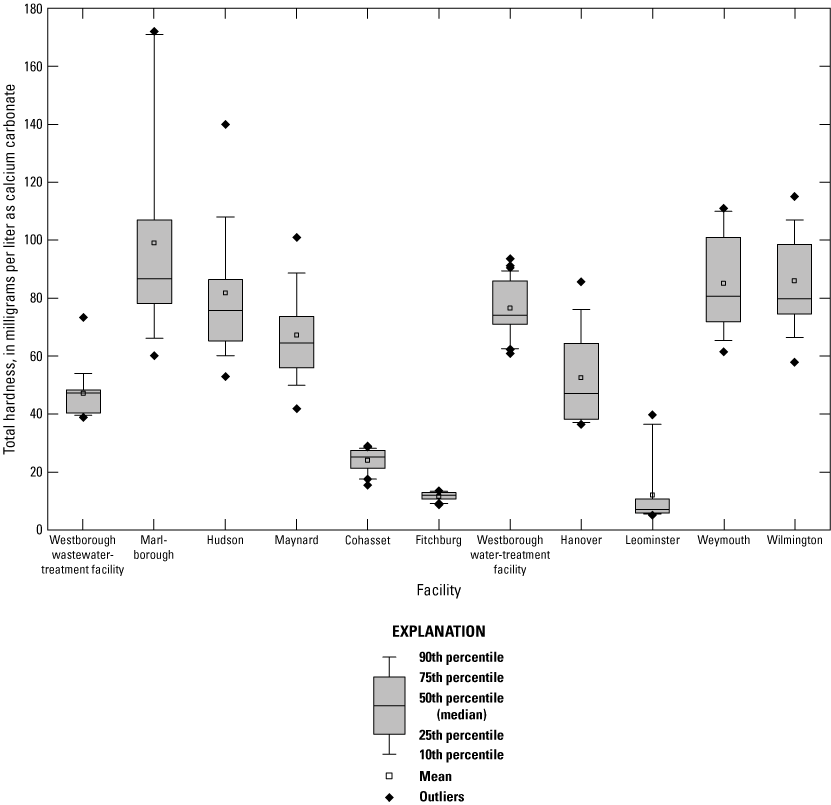
Distribution of concentrations of total hardness measured in samples collected monthly at selected ambient stations near 11 water-treatment facilities in eastern and central Massachusetts, 2018–19. Data used for the boxplots are only those from selected ambient stations used for aluminum calculations, as identified in table 2. Facility and station names are provided in table 2.
Comparisons of Total Aluminum Concentrations Among Ambient Stations
A comparison of aluminum concentrations among ambient stations indicated that high aluminum concentrations (greater than 100 µg/L) were consistently detected for stations on Lily Pond in Cohasset and Monoosnoc Brook in Leominster and for five monthly samples at five additional stations, but that aluminum concentrations for most stations were less than 100 µg/L (fig. 22). Aluminum concentrations detected at the ambient (upstream) stations on the Assabet River in Westborough, Marlborough, Hudson, and Maynard ranged from 6.00 to 173 µg/L with median values ranging from 37.0 to 47.0 µg/L. Aluminum concentrations at ambient stations on streams and ponds varied more than concentrations in the Assabet River. Aluminum concentrations detected at Mill River near Randolph St., South Weymouth, Mass. (station 01105587), ranged from 15.5 to 440 µg/L, with a median value of 63.0 µg/L. Concentrations at the upstream stations in Leominster and Wilmington ranged from 15.8 to 208 µg/L with median values of 45.0 and 155 µg/L, respectively. During periods of low streamflow, aluminum concentrations at downstream stations in small streams may be affected by upstream effluent discharges. For example, during a period when Third Herring Brook in Hanover (fig. 10) dried completely at the upstream station and formed a series of pools at the downstream station, aluminum concentrations measured at the downstream station (station 420754070495801) on July 3, July 20, and August 8, 2018, were 1,980, and 1290, and 3,090 µg/L, respectively.
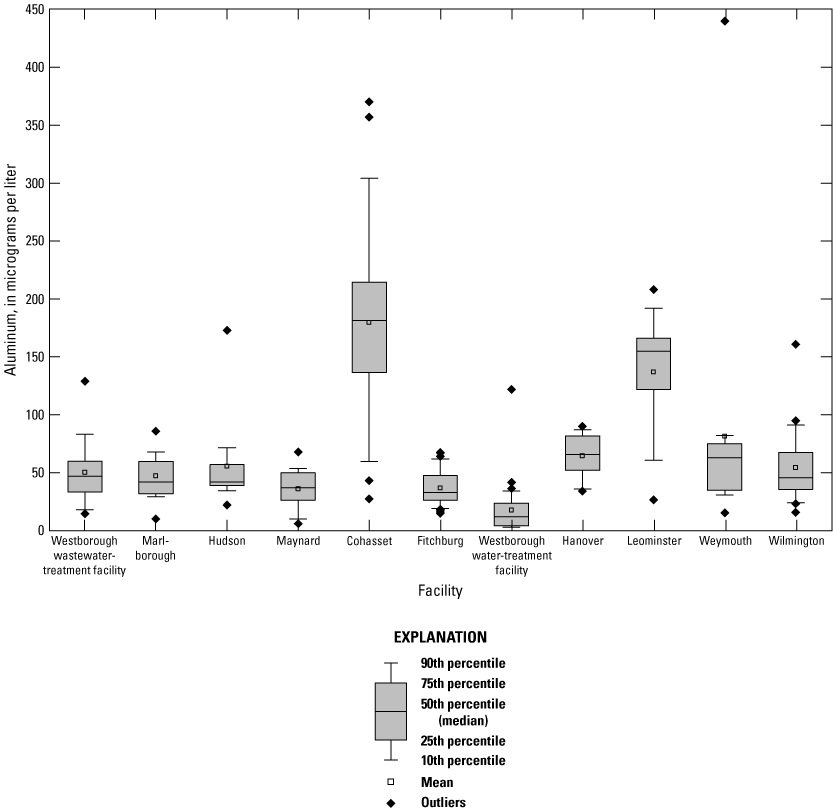
Distribution of concentrations of aluminum measured in samples collected monthly at ambient stations near four wastewater-treatment facilities and seven water-treatment facilities in eastern and central Massachusetts, 2018–19. Data used for the boxplots are only those from selected ambient stations used for aluminum calculations, as identified in table 2. Facility and station names are provided in table 2.
Aluminum concentrations for the pond stations ranged widely. Aluminum concentrations for samples collected at stations on Hocomonco Pond in Westborough were among the lowest measured during the study. Aluminum concentrations were less than 12 mg/L for over half (19 of 34) of the samples collected at pond stations 1 and 2 in Hocomonco Pond (stations 421622071385701 and 421622071385702, respectively), and at the pond outlet (Hocomonco Pond near Otis Street, Westborough, Mass. [station 421628071384501]). Median aluminum concentrations at these stations ranged from 11.9 to 15 µg/L. Aluminum concentrations measured at the stations in Wyman Pond ranged from 15.1 to 67.4 µg/L with median values ranging from 28.8 to 41.1 µg/L. In contrast, aluminum concentrations measured at the stations on Lily Pond in Cohasset (fig. 7) were among the highest measured during the study. Aluminum concentrations were between 200 and 370 µg/L for about half (11 of 23) of the samples collected at the Cohasset at Lily Pond deep hole (shallow) and Lily Pond deep hole (stations 421326070485802 and 421326070485801, respectively). The backwash effluent from the Cohasset WTF discharges to Lily Pond and may not circulate out of the pond during low-flow periods of the year when water is withdrawn from Lily Pond and seasonal releases from the Aaron River Reservoir flow into Lily Pond.
Water Quality of Effluent Discharges
The monthly discrete water-quality data for pH, DOC, total hardness, and total aluminum concentrations for the effluent stations monitored during the study are presented here. Effluent discharges can be a major factor contributing to water-quality variability (Carey and Migliaccio, 2009).
Comparisons of pH Among Effluent Stations
The water quality of effluent from WWTFs and WTFs differed. The pH of effluent samples from WWTFs varied over a narrower range than those from WTFs (fig. 23A). The pH values of effluent from the four WWTFs (Westborough, Marlborough, Hudson, and Maynard) were generally near neutral pH (7.0 SU), with median monthly pH values ranging from 6.8 to 7.1 SU and monthly pH values ranging from 6.6 to 7.3 SU. In contrast, the pH values of effluent from the seven WTFs varied within a wider range, with median monthly pH values ranging between 6.3 and 7.5 SU and monthly pH values ranging from 5.8 to 8.7 SU.
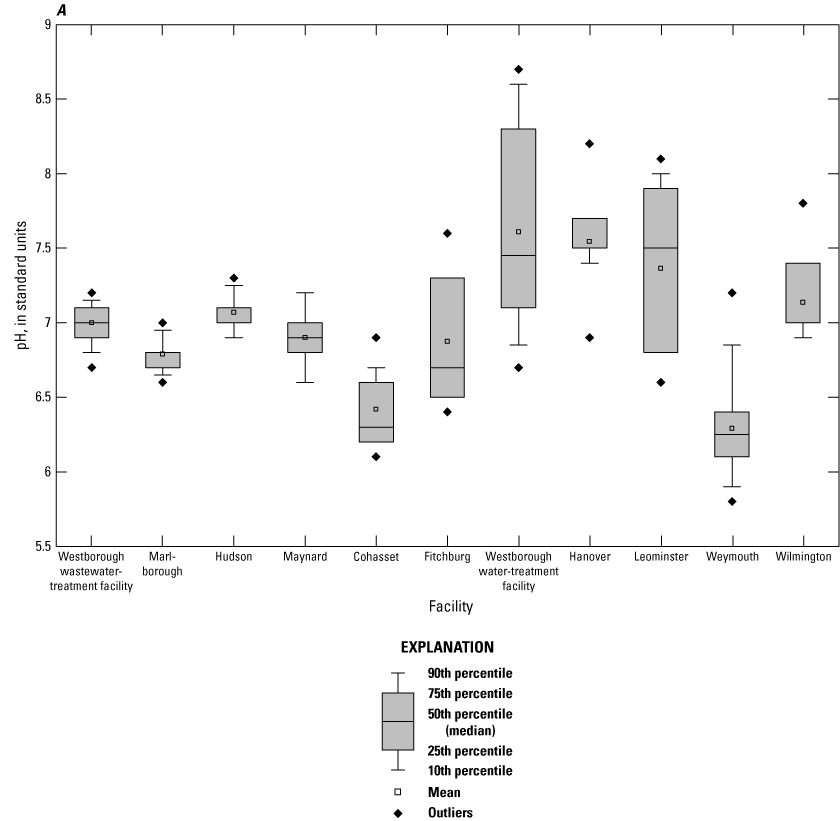
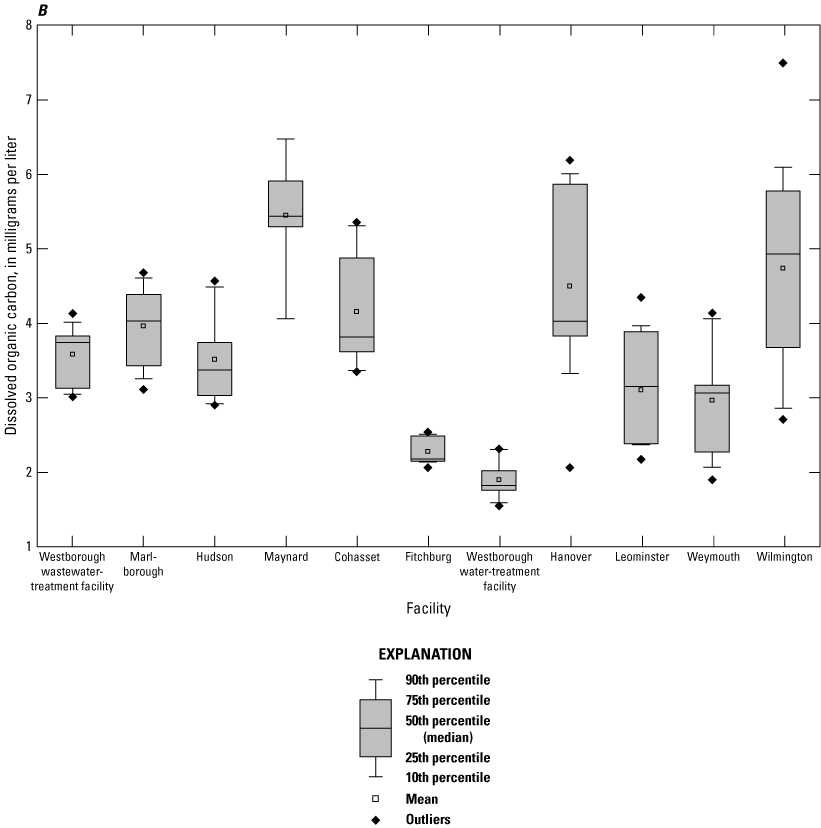
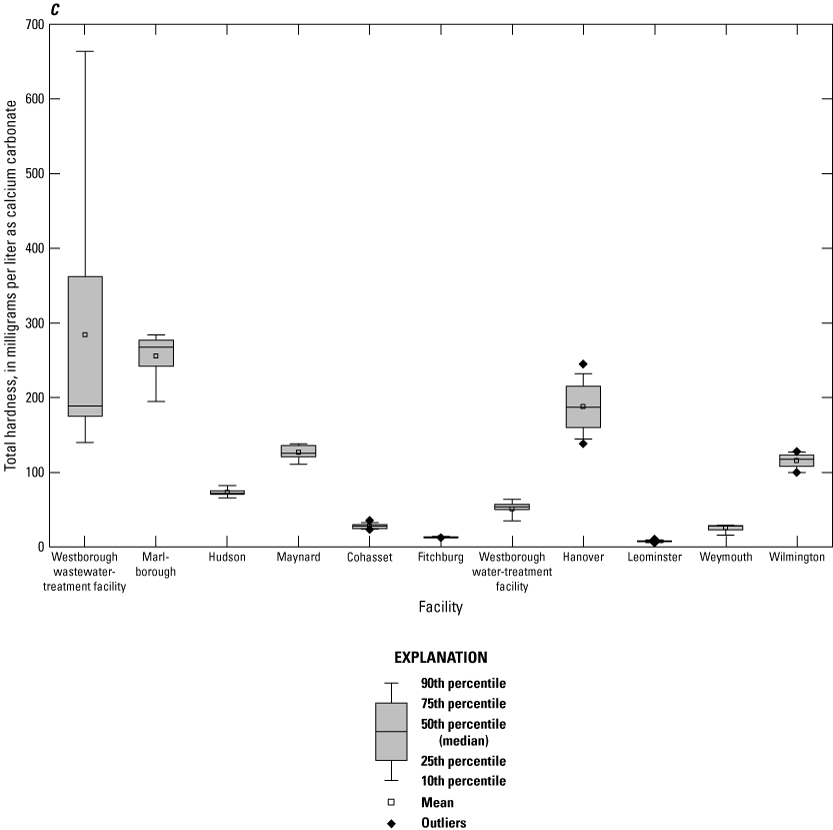
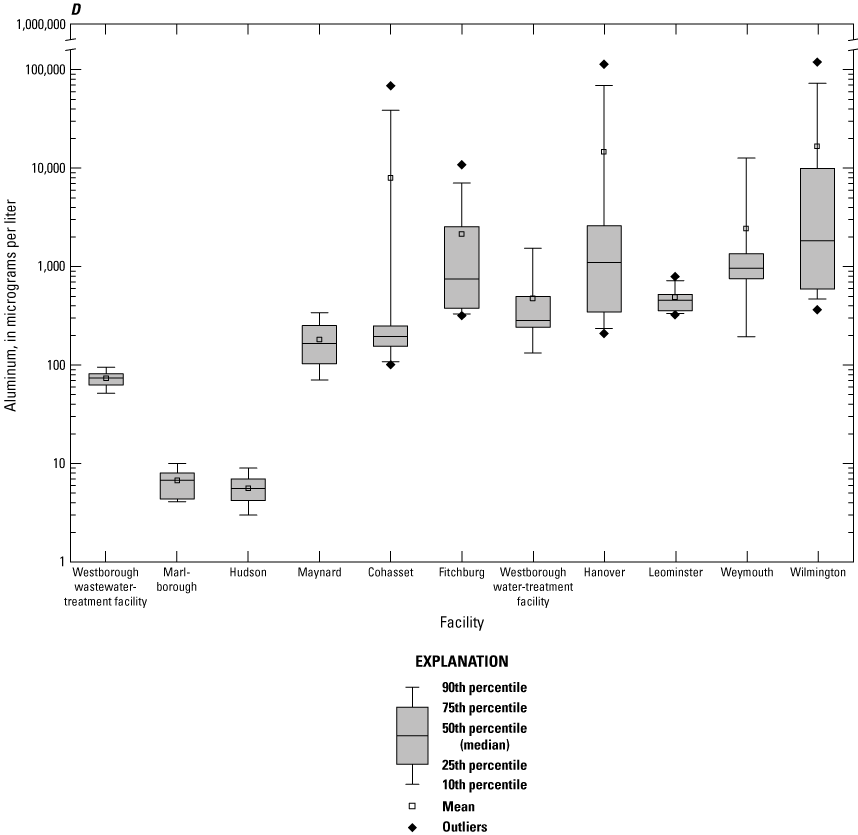
Distribution of pH measured as a field parameter and concentrations of dissolved organic carbon, total hardness, and total aluminum measured in samples collected monthly in effluent from four wastewater-treatment facilities and seven water-treatment facilities in eastern and central Massachusetts, 2018–19. A, pH; B, dissolved organic carbon; C, total hardness, and D, total aluminum. Facility and station names are provided in table 2.
The effluent discharge from WWTFs may have some capacity to buffer pH values downstream. Plots of continuous pH data for the ambient (upstream) stations in Marlborough, Hudson, and Maynard (Armstrong and others, 2022) indicated that for many days during June, July, and August, the diel cycles had consistent minimum pH values near 7.0 SU.
Comparisons of DOC Concentrations Among Effluent Stations
The DOC concentrations in effluent discharge from WWTFs and WTFs varied within overlapping ranges. The DOC concentrations in effluent from the four WWTFs (Westborough, Marlborough, Hudson, and Maynard) ranged from 2.9 to 6.48 mg/L, and median monthly values ranged from 3.38 to 5.44 mg/L. The DOC concentrations of effluent from the seven WTFs ranged from 1.82 to 7.5 mg/L, and median DOC concentrations ranged from 1.82 to 4.93 mg/L. Median DOC concentrations for two of the WTF sites, Westborough water-treatment plant backwash effluent (station 421627071392401, 1.82 mg/L) and Fitchburg water-treatment plant backwash effluent (station 423215071534101, 2.18 mg/L), had DOC values that were below the lowest DOC concentrations in effluent discharge from other facilities (fig. 23B).
Comparisons of Total Hardness Concentrations Among Effluent Stations
Total hardness in effluent discharge varied among facilities (fig. 23C). The total hardness concentrations in effluent from WWTFs tended to be higher than total hardness concentrations in effluent from WTFs. Total hardness concentrations of effluent from three of the WWTFs (Westborough, Marlborough, and Maynard) had median total hardness concentrations of 127 to 264 mg/L as CaCO3 and ranged from 111 to 664 mg/L as CaCO3. In contrast, WTFs with surface-water sources had low total hardness (soft water) in the range from about 5 to 60 mg/L as CaCO3. The Wilmington and Hanover WTFs, both having groundwater as a source of water supply, had higher total hardness concentrations than other WTFs. Median total hardness concentrations were 117 and 182 mg/L as CACO3 for the Wilmington water-treatment plant backwash effluent (station 423200071100201) (fig. 13) and Hanover water treatment plant backwash effluent (station 420754070495801) (fig. 10), respectively.
Comparisons of Total Aluminum Concentrations Among Effluent Stations
Aluminum concentrations in the effluent discharges varied considerably among facilities (fig. 23D). The aluminumum concentrations for the four stations on the Assabet River (Westborough, Marlborough, Hudson, and Maynard) did not indicate a cumulative effect from effluent discharges from upstream to downstream. High aluminum concentrations (greater than 10,000 µg/L) were measured in the effluent at eight stations. Often, high aluminum concentrations could be explained by manmade activities or environmental conditions at the facilities at the time of sampling (table 5). For example, most WTFs contain two or more lagoons and periodically switch the effluent discharge from one lagoon to the other to allow for drying and the proper disposal of the coagulated and flocculated solids from the inactive lagoon. At two stations, high aluminum concentrations in effluent discharge were sampled when facilities were cleaning out or refilling lagoons. At Fitchburg, high aluminum concentrations were measured in samples that were collected while tanker trucks were cleaning out a lagoon. In Wilmington, high aluminum concentrations were measured when lagoons were refilling after cleaning, and samples were collected from streams of water leaking from gaps between boards in the weir. In other instances, specific actions at a facility may lead to the effluent discharge containing supernatant and suspended solids from lagoons with high aluminum concentrations. For example, high aluminum concentrations were measured at Hanover (fig. 10) after a double backwash of filters exceeded lagoon capacity. Winter conditions appeared to result in high aluminum concentrations at various facilities. In Cohasset, frozen lagoons seemed to make it difficult to transfer effluent between lagoons. In Wilmington, effluent was observed to discharge onto a frozen lagoon and flow over the ice and out the weir without settling of floc and coagulated solids in the lagoon. Staining on ice observed in lagoons at other facilities indicated that frozen lagoons might be a factor that affects aluminum concentrations in effluent discharge for water-treatment facilities during winter.
Table 5.
Field observations made in association with water-quality sampling of effluent discharges for samples with high aluminum concentrations (greater than 10,000 milligrams per liter) at water-treatment facilities in Massachusetts.Quality-Assurance and Quality-Control Results
The accuracy and precision of the data collected in this study were evaluated by making quality-control measurements at each of the monitoring stations and collecting various types of quality-control samples to monitor bias and precision in data collection. Quality-control samples for the study included equipment and field blanks, replicates, and laboratory spike samples. Quality-assurance and quality-control data are available in a table in a data release (Armstrong and others, 2022).
Blank Samples
Field and equipment blank samples were collected randomly at the stations over the course of the study period. A total of 48 blank samples (about 11 percent of the total samples) were submitted for chemical analysis, including 15 field and 33 equipment blanks. Measurable concentrations for each constituent in field and equipment blank samples were compared to the USGS NWQL reporting limit and environmental concentration data collected during the study (see Armstrong and others, 2022). For analytes not detected in samples, a concentration equal to the laboratory reporting limit is reported with a “less than” (<) remark code in all data tables in this report. Low contaminant concentrations may be acceptable if the level of contamination is within the measurement error of the analytical method or is appreciably below the constituent concentrations in the samples. All analytes in the 48 equipment and field blanks were below the method detection limit, except for four detections of TOC and one detection of DOC; however, all analytes that were detected were near the method detection limit and appreciably below concentrations in the samples.
Replicate Samples
The primary purpose of replicate samples is to identify and (or) quantify the variability in all or part of the sampling and analysis process and to evaluate whether sample-collection techniques and analytical results were reproducible. Replicate samples are considered nearly identical in composition to the associated samples and are analyzed for the same chemical properties. Replicate samples, either concurrent, sequential, or splits, were collected randomly, immediately following the first sample (unless the sample was split), using the same protocols. Over the course of the study period, 27 replicates were collected (about 6 percent of total samples) and submitted for chemical analysis. Relative percent differences (RPD) in all replicate samples were less than 10 percent for all analytes except for aluminum in nine samples (RPD from 11 to 57 percent) and one TOC sample (RPD 53 percent).
Laboratory Matrix Spikes
The performance of the LMS analysis is quantified by the percentage recovery of the spiked sample compared to the environmental sample. For this study, each LMS was performed on filtered (or dissolved) aluminum. Four LMSs were performed during the study, including three from the Westborough wastewater-treatment plant effluent (station 421651071381401) and one from the Maynard wastewater-treatment plant effluent (station 422627071262301). For the four matrix spikes performed, aluminum spike recovery was 75, 87, 98, and 105 percent, respectively. The spike recoveries indicate that when specific conductance in a sample is greater than 1,000 µS/cm (such as in the effluent samples), matrix suppression of aluminum can result and concentrations in the samples may be biased low. About 10 percent of the samples (13 ambient samples and 34 effluent samples) had specific-conductance values greater than 1,000 µS/cm, where matrix suppression of aluminum could be a concern.
The performance of LMS analysis also is quantified by in-house laboratory quality assurance and quality control performed at the NWQL. Quality assurance and quality control is performed regularly at the NWQL through the Inorganic Blind Sample Project, and data on percent recovery of elements during the study period are available online (USGS, 2021b). From January to July 2018, Inorganic Blind Sample Project results indicate that matrix suppression of aluminum resulted in a bias ranging from positive 6 percent to negative 27 percent with a median negative bias of about 10 percent. In July 2018, a new collision-mode analytical method was incorporated, and percent recoveries for aluminum from July 2018 to January 2019 improved, resulting in a bias ranging from positive 12 to negative 13 percent with a median negative bias of 1 percent.
Water-Quality Results for 38 Stations near 11 Water-Treatment Facilities in Eastern and Central Massachusetts
This section presents summaries of water quality from the stations associated with each of the WWTFs and WTFs. The stations are organized to group facilities and stations together that are associated with (1) WWTFs on the Assabet River, (2) WTFs with receiving-water bodies on ponds, and (3) WTFs with receiving-water bodies on streams. For each facility, the monthly discrete water-quality data (pH, DOC, total hardness, and total aluminum concentrations) and continuous (15-minute interval) pH data are discussed for the ambient stations, followed by a discussion of the monthly discrete water-quality data for the effluent stations. Time-series plots of the monthly water-quality data are available in a data release (Armstrong and others, 2022).
Westborough Wastewater-Treatment Facility
Stations near the Westborough WWTF (fig. 3) were visited monthly from April 13, 2018, through May 2, 2019, to collect discrete water-quality samples and measure water-quality field parameters. Most monthly discrete pH values for the ambient (upstream) station (Assabet River near Westborough, Mass. [station 01096603]) were near neutral pH (7.0 SU), ranging from 6.5 to 7.3 SU with a median value of 7.0 SU. Lowest pH values were from 6.5 to 6.6 SU from July through October. Continuous pH data were measured at the upstream station from April 26, 2018, through November 26, 2018. The continuous pH data indicate diel variations in pH were generally small. Diel variations in pH were greatest during May and least during November (median daily range in pH per month of 0.3 and 0.1 SU, respectively). Monthly discrete pH values for the ambient (downstream) station (Assabet River downstream from Westborough wastewater-treatment plant [station 01096725]) ranged from 6.6 to 7.2 SU with a median value of 7.0 SU.
Monthly DOC concentrations at the upstream station ranged from 3.15 to 7.56 mg/L with a median concentration of 5.32 mg/L. DOC concentrations were highest in October and November and lowest in March and April. Monthly DOC concentrations at the downstream station ranged from 3.72 to 6.46 mg/L with a median concentration of 4.34 mg/L.
Monthly total hardness concentrations at the upstream station ranged from 38.8 to 73.3 mg/L as CaCO3 with a median total hardness concentration of 47.2 mg/L as CaCO3. All monthly samples were in the range from 38 to 55 mg/L as CaCO3. except for July 2018 (73.3 mg/L as CaCO3). Monthly total hardness concentrations at the downstream station ranged from 67.6 to 402 mg/L as CaCO3, with a median total hardness concentration of 144 mg/L as CaCO3.
Aluminum concentrations at the upstream station ranged from 14.7 to 129 µg/L with a median concentration of 47.0 µg/L. Aluminum concentrations at the downstream station ranged from 28.6 to 166 µg/L, with a median concentration of 69.1 µg/L.
The pH values for the effluent station (Westborough wastewater-treatment plant effluent [station 421651071381401]) (fig. 3) were near neutral (7.0 SU) and varied within a similar range as the ambient stations, ranging from 6.7 to 7.2 SU with a median value of 7.0 SU. Effluent DOC concentrations were relatively constant and ranged from 3.01 to 4.13 mg/L, with a median value of 3.74 mg/L. The effluent total hardness concentrations varied more than effluent pH and DOC values. The effluent total hardness concentrations ranged from 140 to 664 mg/L as CaCO3, with a median value of 192 mg/L as CaCO3. High total hardness concentrations at the downstream station during August and December followed a similar pattern of total hardness concentrations in the effluent. Aluminum concentrations in effluent discharge ranged from 51.9 to 95.0 µg/L, with a median concentration of 75.7 µg/L. Aluminum concentrations in the effluent discharge were generally higher than concentrations at the upstream station (a median of 34 µg/L higher) and likely contributed to higher aluminum concentrations at the downstream station.
Marlborough Wastewater-Treatment Facility
Stations near the Marlborough WWTF (fig. 4) were visited monthly from May 4, 2018, through May 3, 2019, to collect discrete water-quality samples and measure water-quality field parameters. Monthly discrete pH values for the ambient (upstream) station (Assabet River at Boundary Street near Northborough, Mass. [station 01096720]) ranged from 6.7 to 7.6 SU, with a median value of 7.2 SU. The monthly pH values for the upstream Marlborough station were among the highest of all stations, with pH values higher than 7.0 SU for 75 percent of the samples. The lowest pH value (6.7 SU) was measured at the upstream station during November. Continuous pH data were measured at the upstream station from May 24, 2018, through February 4, 2019. The continuous pH data indicated diel variations in pH in the Assabet River in Marlborough were larger than variations in pH measured upstream at the Assabet River stations associated with the Westborough WWTF. The daily pH values for the upstream Marlborough station varied by as much as 1.5 SU. These diel variations in pH were likely caused by photosynthesis and respiration of algae, aquatic vegetation, and periphyton in the large wetland reach of the Assabet River just upstream from the Marlborough monitoring stations. The greatest diel pH variation (1.7 SU) was measured on July 17–18, 2018. Diel variations in pH were greatest during June and least during November (median daily range in pH per month of 0.7 and 0.1 SU, respectively). Monthly discrete pH values for the downstream station (Assabet River, downstream Marlborough wastewater-treatment plant [station 01096725]) (fig. 4) ranged from 6.8 to 7.3 SU with a median value of 7.1 SU. Monthly discrete pH values were similar at the upstream and downstream stations and did not indicate a seasonal pattern.
The monthly DOC concentrations at the upstream station ranged from 2.80 to 5.81 mg/L, with a median concentration of 4.31 mg/L. Monthly DOC concentrations at the downstream station were similar to those at the upstream station and ranged from 3.00 to 5.58 mg/L, with a median concentration of 4.60 mg/L. The DOC concentrations were lowest (less than 3 mg/L) from February through March.
Total hardness concentrations were similar at the upstream and downstream stations. Monthly total hardness concentrations at the upstream station ranged from 60.1 to 172 mg/L as CaCO3, with a median total hardness concentration of 86.7 mg/L as CaCO3 (station 01096725). Monthly total hardness concentrations at the downstream station ranged from 61.5 to 174 mg/L as CaCO3, with a median total hardness concentration of 114 mg/L as CaCO3. Total hardness concentrations were highest from May through October (greater than 100 mg/L as CaCO3).
Aluminum concentrations at the upstream station ranged from 10.2 to 86.0 µg/L with a median concentration of 42.0 µg/L. Aluminum concentrations at the downstream station ranged from 28.1 to 82.0 µg/L with a median concentration of 43.6 µg/L.
The pH values for the effluent station (Marlborough wastewater-treatment plant effluent [station 422034071365601]) (fig. 4) ranged from 6.6 to 7.0 SU with a median of 6.8 SU. The pH of the effluent tended to be lower (median 0.4 SU lower) than values for the upstream station during most months. Effluent DOC concentrations were relatively constant and ranged from 3.11 to 4.68 mg/L with a median of 4.04 mg/L. The total hardness concentration of the effluent ranged from 195 to 284 mg/L as CaCO3 with a median of 264 mg/L as CaCO3. The total hardness values in the effluent were typically about 100 mg/L higher than total hardness in the river. Monthly aluminum concentrations in the effluent ranged from 4.1 to 10.0 µg/L with a median of 6.5 µg/L and were generally lower (median 31 µg/L lower) than those at the upstream station.
Hudson Wastewater-Treatment Facility
Stations near the Hudson WWTF (fig. 5) were visited monthly from April 24, 2018, through May 3, 2019, to collect discrete water-quality samples and measure water-quality field parameters. The monthly discrete pH values for the ambient (upstream) station (Assabet River at Cox Street near Hudson, Mass. [station 01096870]), ranged from 6.8 to 7. 3 SU with a median of 7.0 SU. The lowest pH values for the upstream station (6.8 SU) were measured from October through December 2018. Continuous pH data were measured at the upstream station from April 20, 2018, through April 29, 2019. The diel variability of pH was greatest during June through September, when pH varied by as much as 0.7 to 1.2 SU. Diel variations in pH were greatest during June and least during February (median daily range in pH per month of 0.4 and 0.1 SU, respectively). The monthly discrete pH values for the ambient (downstream) station (Assabet River near Hudson-Stow town line [station 01096875]) ranged from 6.8 to 7.3 SU with a median of 6.9 SU.
The monthly DOC concentration at the upstream station ranged from 2.69 to 6.39 mg/L with a median of 4.29 mg/L. The monthly DOC concentrations at the downstream station had similar values to those at the upstream station and ranged from 3.31 to 6.30 mg/L with a median of 4.46 mg/L. The DOC concentrations were lowest (less than 4.0 mg/L) at the upstream station from December through March. The monthly total hardness concentrations at the upstream station ranged from 53.0 to 140 mg/L as CaCO3 with a median of 75.7 mg/L as CaCO3.
Monthly total hardness concentrations at the downstream station ranged from 54.6 to 130 mg/L as CaCO3 with a median of 83.9 mg/L as CaCO3. Total hardness concentrations were highest (greater than 80 mg/L as CaCO3) from May through October and lowest (less than 60 mg/L) as CaCO3 in February.
Aluminum concentrations at the upstream station ranged from 22.3 to 173 µg/L with a median value of 42.0 µg/L. Aluminum concentrations at the downstream station ranged from 18.1 to 77.4 µg/L with a median value of 41.0 µg/L.
The pH values for the effluent station (Hudson wastewater-treatment plant effluent [station 422406071323401]) were near neutral and ranged from 6.9 to 7.3 SU with a median of 7.1 SU. Effluent DOC concentrations ranged from 2.90 to 4.57 mg/L with a median of 3.38 mg/L. Effluent total hardness concentrations varied little monthly and ranged from 66.2 to 82.3 mg/L as CaCO3 with a median of 73.1 mg/L as CaCO3. Aluminum concentrations in the effluent were low and ranged from 3.00 to 10.5 µg/L with a median of 5.65 µg/L. Effluent aluminum concentrations were always lower (median 36 µg/L lower) than aluminum concentrations in the river at the upstream and downstream stations.
Maynard Wastewater-Treatment Facility
Stations near the Maynard WWTF (fig. 6) were visited monthly from April 24, 2018, through May 3, 2019, to collect discrete water-quality samples and measure water-quality field parameters. The monthly discrete pH values for the Maynard stations were among the highest of all stations. The pH values for the ambient (upstream) station (Assabet River, upstream Maynard wastewater-treatment plant [station 01097021]) (fig. 6) ranged from 6.6 to 8.4 SU with a median of 7.2 SU. The pH values indicated a seasonal pattern—pH values were lowest (less than 7.0 SU) from October through February, and highest (8.4 SU) in June. Continuous pH data were measured at the upstream station from May 3, 2018, to February 8, 2019. The diel variability of pH was greatest from July through September, when pH varied by as much as 1.5 to 1.8 SU. The daytime maximum pH values tended to result in early afternoon and were maintained for short periods of 1 to 2 hours, in comparison to the nighttime minimum pH values that were often maintained for 6 hours or more, from near midnight to shortly after dawn. The highest pH measured was 8.9 SU on August 6, 2018. The lowest pH values were measured during September (pH 6.5–6.6 SU, September 21–24, 2018), coinciding with heavy rains and flooding caused by the remnants of Hurricane Florence (https://www.weather.gov/ilm/HurricaneFlorence). Diel variations in pH were greatest during June (median daily range in pH per month of 0.6 SU) and least during November and December (median daily range in pH per month of 0.1 SU). The pH values for the ambient (downstream) station (Assabet River, downstream Maynard wastewater-treatment plant [station 01097023]) ranged from 6.5 to 8.6 SU with a median of 7.1 SU.
The monthly DOC concentrations at the Maynard upstream station (fig. 6) ranged from 2.79 to 6.46 mg/L with a median of 4.57 mg/L The monthly DOC concentrations at the Maynard downstream station were similar to those at the upstream station and ranged from 3.14 to 6.52 mg/L with a median of 4.96 mg/L. The DOC concentrations had a seasonal pattern and were lowest (less than 5 mg/L) from November through April and highest (greater than 5 mg/L) from July through October.
The monthly total hardness concentrations at the upstream station ranged from 41.8 to 101 mg/L as CaCO3 with a median of 64.5 mg/L as CaCO3. The monthly total hardness concentrations at the downstream station ranged from 42.0 to 101 mg/L as CaCO3 with a median of 72.6 mg/L as CaCO3. Total hardness concentrations indicated a slight seasonal pattern; total hardness values were higher from May through October 2018 and lower from December 2018 through May 2019. The total hardness was highest (101 mg/L as CaCO3) in September 2018 and lowest (42 mg/L as CaCO3) in November 2018.
Aluminum concentrations at the upstream station ranged from 6.00 to 67.8 µg/L with a median of 37.0 µg/L. Aluminum concentrations at the downstream station ranged from 20.2 to 79.8 µg/L with a median of 41.5 µg/L.
The pH values for the effluent station (Maynard wastewater-treatment plant effluent [station 422627071262301]) (fig. 6) ranged from 6.6 to 7.2 SU with a median of 6.9 SU. The pH values of the effluent tended to be a few tenths lower than the pH values in the river most months (average 0.4 SU lower). Effluent DOC concentrations ranged from 4.06 to 6.48 mg/L with a median of 5.44 SU. Effluent total hardness concentrations ranged from 111 to 138 mg/L as CaCO3 with a median of 127 mg/L as CaCO3. Total hardness concentrations in the effluent were consistently about 50 mg/L higher than the total hardness values in the river for the upstream station; however, the higher concentrations were not reflected at the downstream station. Aluminum concentrations in effluent ranged from 70.3 to 341 µg/L with a median of 155 µg/L. Aluminum concentrations in the effluent were consistently higher (median 120 µg/L higher) than those at the upstream station. These higher aluminum concentrations were not generally reflected at the downstream station, likely because of dilution of effluent in the Powdermill impoundment (fig. 6).
Cohasset Water-Treatment Facility
Stations near the Cohasset WTF (fig. 7) were visited monthly from April 27, 2018, through May 1, 2019, to collect discrete water-quality samples and measure water-quality field parameters. The monthly pH values for Lily pond station 1 (Lily Pond deep hole [shallow] [station 421326070485802]) ranged from 5.0 to 7.9 SU with a median of 6.2 SU. Monthly pH values for Lily Pond station 2 (Lily Pond deep hole [station 421326070485801]) ranged from 5.0 to 7.4 SU with a median of 5.8 SU. The monthly pH values for Lily Pond stations 1 and 2 were among the lowest values of all stations in the study; more than one-half of the measurements collected at Lily Pond station 2 were less than 6 SU. The monthly pH values for the pond varied but did not indicate a distinct seasonal pattern. The lowest pH values (5.0 SU) were measured during November 2018 at both the shallow and deep stations. Continuous pH data were measured at Lily Pond station 1 from May 16, 2018, through December 19, 2018. The continuous pH data indicated large diel variations (between 1.0 and 1.5 SU) during September 2018. These daily cycles in pH are caused by photosynthesis and respiration of aquatic plants and algae. Although the range of diel variations in pH decreases during the fall, examination of continuous pH data in November indicates that large diel variations in pH can still result late in the growing season. Diel variability in pH was greatest during September and least during December (median daily range in pH per month of 1.2 and 0.2 SU, respectively). During 2018, the daily maximum pH value at Lily pond station 1 was 8.0 SU or greater for 11 days, including 10 days during September (8.0 to 8.8 SU) and 1 day during October (8.8 SU). During October and November, the daily minimum pH values were 5.5 SU or less (from 4.9 to 5.5 SU) for 9 days and 6.0 SU or less for 42 days. More than one-half (28) of the days with low pH (6.0 SU or less) were in the fall, including 8 days during October, 14 days during November, and 6 days during December.
The monthly DOC concentrations at Lily Pond stations 1 and 2 (fig. 7) ranged from 6.99 to 18.9 mg/L with a median of 10.6 mg/L and from 7.22 to 18.4 mg/L with a median of 11.2 mg/L, respectively. The monthly DOC concentrations at Lily Pond stations 1 and 2 were among the highest measured during the study. More than half of the monthly samples had DOC concentrations of 10.0 mg/L or higher. The DOC concentrations had a seasonal pattern and were lowest (less than 8.0 mg/L) at the Lily Pond station 1 during April and highest (18.9 mg/L) during November 2018.
The total hardness concentrations at Lily Pond stations 1 and 2 ranged from 17.5 to 28.9 mg/L as CaCO3 with a median of 25.6 as CaCO3 and from 15.4 to 28.7 mg/L as CaCO3 with a median of 24.6 as CaCO3, respectively. Total hardness concentrations did not indicate a distinct seasonal pattern and were lowest (less than 20 mg/L as CaCO3) in November 2018 and May 2019.
Aluminum concentrations at Lily Pond station 1 ranged from 43.3 to 370 µg/L with a median of 164 µg/L. Aluminum concentrations at Lily Pond station 2 ranged from 27.3 to 357 µg/L with a median of 194 µg/L.
The pH values for the effluent station (Cohasset water-treatment plant backwash effluent [station 421334070490601]) (fig. 7) ranged from 6.1 to 6.9 SU with a median of 6.3 SU. The effluent DOC concentrations ranged between 3.35 and 5.36 mg/L with a median of 3.82 mg/L. The pH values and DOC concentrations in the effluent were less variable than those in Lily Pond. The total hardness concentrations in the effluent ranged from 23.3 to 35.3 mg/L as CaCO3 with a median of 27.7 mg/L as CaCO3. The total hardness concentrations in the effluent were generally within the same range as total hardness concentrations in Lily Pond.
Effluent aluminum concentrations collected from April 27 through December 14, 2018, ranged from 101 to 207 µg/L with a median value of 186 µg/L. Most of these effluent samples were not collected during a filter backwash but were collected from lagoon supernatant by lifting the top board of the weir. Two effluent samples collected during scheduled sampling but under different discharge conditions had higher aluminum concentrations. A sample collected in February 2019 from a stream of effluent leaking through boards in the weir had an aluminum concentration of 8,770 µg/L. A sample collected at the effluent outfall in March 2019 after a filter backwash when the effluent did not have an opportunity to settle in the lagoon because the lagoons were frozen had an aluminum concentration of 68,900 µg/L.
Fitchburg Water-Treatment Facility
Stations near the Fitchburg WTF (fig. 8) were visited monthly from April 23, 2018, through April 25, 2019, to collect discrete water-quality samples and measure water-quality field parameters. The pH values for pond station 1 (Wyman Pond, Leino Park Road, shallow, Westminster, Mass. [station 423132071523401]) ranged from 5.6 to 7.3 SU with a median of 6.2 SU. The pH values for pond station 2 (Wyman Pond, Leino Park Road, deep, Westminster, Mass. [station 4231320715234012]) had similar values as those at Wyman Pond station 1 and ranged from 5.5 to 7.3 SU with a median of 6.2 SU. The monthly pH values varied but did not indicate a seasonal pattern. The lowest pH values were measured during September (5.5 SU) and November (5.6 SU) at pond station 1. The pH values for pond station 3 (Wyman Pond shallow, Westminster, Mass. [station 423211071524701]) ranged from 6.1 to 6.4 SU with a median of 6.2 SU. The pH values for pond station 4 (Wyman Pond deep, Westminster, Mass. [station 423211071524702]) had similar values as those at Wyman Pond station 3 and ranged from 5.7 to 6.5 SU with a median of 6.3 SU.
Continuous pH data were measured at Wyman Pond station 1 from May 24, 2018, through November 27, 2018. This station is upgradient of effluent discharges to Wyman Pond. The continuous pH data indicated that diel variations were largest (0.5–1.0 SU) in late July and August 2018. Diel variations in pH were greatest during August and least during October (median daily range in pH per month of 0.5 and 0.1 SU, respectively). The lowest observed pH value (6.0 SU) was measured during late September. Minimum pH values were less than 6.2 SU for 2 days in early September, 11 days in late September and early October, and 5 days in late November.
The monthly DOC concentrations at Wyman Pond stations 1 and 2 ranged from 1.68 to 4.71 mg/L with a median of 2.84 mg/L and from 1.72 to 4.65 mg/L with a median of 3.26 mg/L, respectively. The monthly DOC concentrations at Wyman Pond stations 3 and 4 ranged from 2.16 to 3.89 mg/L with a median of 3.11 mg/L and from 2.17 to 4.10 mg/L with a median of 3.09 mg/L, respectively. The monthly DOC concentrations at the Wyman Pond stations were among the lowest during the study, with 90 percent of the monthly DOC concentrations less than 4 mg/L. Although low, the DOC concentrations had a distinct seasonal pattern; values generally increased from spring into fall, peaked during September, and then decreased from fall to early spring, with the lowest value (1.68 mg/L) in April.
Total hardness values for Wyman Pond stations 1 and 2 (fig. 8) ranged from 8.77 to 13.0 mg/L as CaCO3 with a median of 9.98 mg/L as CaCO3 and from 8.78 to 12.8 mg/L as CaCO3 with a median of 11.4 mg/L as CaCO3, respectively. Total hardness values for Wyman Pond stations 3 and 4 ranged from 10.1 to 13.5 mg/L as CaCO3 with a median of 12.9 mg/L as CaCO3 and from 10.8 to 13.5 mg/L as CaCO3 with a median of 13.0 mg/L as CaCO3, respectively. Total hardness concentrations at the Wyman Pond stations were among the lowest measured during the study, with 90 percent of the monthly values less than 13.5 mg/L as CaCO3. The lowest concentrations (from 8.77 to 8.82 mg/L as CaCO3) were measured at Wyman Pond stations 1 and 2 during November 2018 and April 2019, respectively.
Aluminum concentrations at Wyman Pond stations 1 and 2 ranged from 23.6 to 67.4 µg/L with a median of 41.0 µg/L and from 25.3 to 64.1 µg/L with a median of 31.7 µg/L, respectively. Aluminum concentrations at Wyman Pond stations 3 and 4 ranged from 15.1 to 62.0 µg/L with a median of 28.9 µg/L and from 16.2 to 62.0 µg/L with a median of 28.8 µg/L, respectively. Aluminum concentrations at the Wyman Pond stations were lowest (less than 30 µg/L) in June, July, and August. Although aluminum concentrations differed slightly between Wyman Pond stations 1 and 2 and Wyman Pond stations 3 and 4, the monthly aluminum concentrations at the paired shallow and deep stations tended to be similar.
The pH values for the effluent station (Fitchburg water-treatment plant backwash effluent [station 423215071534101]) (fig. 8) ranged from 6.4 to 7.6 SU with a median of 6.7 SU. Effluent pH values were higher than pH values in Wyman Pond. Effluent DOC concentrations ranged from 2.06 to 2.54 mg/L with a median of 2.18 mg/L. Effluent DOC concentrations were lower than those in Wyman Pond. Effluent total hardness concentrations ranged from 12.0 to 14.0 mg/L as CaCO3 with a median of 13.0 mg/L as CaCO3. Effluent total hardness concentrations were similar to concentrations measured in Wyman Pond.
Effluent aluminum concentrations ranged from 318 to 10,800 µg/L with a median of 806 µg/L. The effluent aluminum concentration of 10,800 µg/L was measured during May 2018 during a period when the lagoons were being cleaned. The aluminum concentrations in the effluent were higher than concentrations measured in Wyman Pond. The effluent from the Fitchburg WTF lagoons is discharged into an intermittent stream containing some beaver dams, potentially allowing for additional settling of aluminum before discharging to Wyman Pond. The relatively large size of Wyman Pond, compared to other ponds considered in this study, likely also provides for dilution of effluent discharge.
Westborough Water-Treatment Facility
Stations near the Westborough WTF (fig. 9) were visited monthly from April 18, 2018, through April 25, 2019, to collect discrete water-quality samples and measure water-quality field parameters. The pH values for pond station 1 (Hocomonco Pond shallow, Westborough, Mass. [station 421622071385701]) ranged from 6.2 to 7.5 SU with a median of 6.8 SU. The pH values for pond station 2 (Hocomonco Pond deep, Westborough, Mass. [station 421622071385702]) had similar values as those at Hocomonco Pond station 1 and ranged from 6.0 to 7.2 SU with a median of 6.8 SU. The pH values varied monthly with some seasonal differences. The lowest pH values (6.0–6.2 SU) were measured during October 2018. Continuous pH data were measured at the Hocomonco Pond station 1 from May 4, 2018, through December 4, 2018. The largest diel pH variations (1.0–2.0 SU) were measured during July 2018. These daily cycles in pH are likely caused by photosynthesis and respiration of aquatic plants and algae. Diel variations in pH were greatest during July and least during November (median daily range in pH per month of 1.4 and 0.1 SU, respectively). During 2018, the daily maximum pH value was 8.5 SU or higher for 28 days, 22 of which were in July. The highest pH values were in the afternoons of July 16 and July 31, 2018 (9.1 and 9.0 SU, respectively). The lowest daily minimum pH values ranged from 6.3 to 6.5 SU and were observed during September and again during October. The pH values for Hocomonco Pond station 3 (Hocomonco Pond near Otis Street, Westborough, Mass. [station 421628071384501]) (fig. 9) ranged from 6.3 to 7.0 SU with a median of 6.6 SU.
The DOC concentrations for Hocomonco Pond (fig. 9) were among the lowest measured during the study. The monthly DOC concentrations at Hocomonco Pond stations 1 and 2 ranged from 2.05 to 3.52 mg/L with a median of 3.29 mg/L and from 1.92 to 5.17 mg/L with a median of 3.40 mg/L, respectively. The monthly DOC concentrations at Hocomonco Pond station 3 ranged from 2.03 to 4.28 mg/L with a median of 3.28 mg/L. The DOC concentrations had only a slight seasonal pattern, with the highest DOC concentrations (4 to 5.2 mg/L) measured in July through October 2018 and the lowest DOC concentrations (less than 2.5 mg/L) measured in February through April 2019.
Monthly total hardness concentrations at Hocomonco Pond stations 1 and 2 ranged from 60.9 to 89.4 mg/L as CaCO3 with a median of 73.9 mg/L as CaCO3 and from 62.4 to 93.6 mg/L as CaCO3 with a median of 73.7 mg/L as CaCO3, respectively. Monthly total hardness concentrations at Hocomonco Pond station 3 ranged from 62.2 to 91.2 mg/L as CaCO3 with a median of 76.9 mg/L as CaCO3. The total hardness concentrations did not indicate a seasonal pattern. The lowest values were measured during December (less than 63 mg/L as CaCO3), and the highest values were measured during September (ranging from 89 to 94 mg/L as CaCO3).
Aluminum concentrations at Hocomonco Pond stations 1 and 2 ranged from 3.00 to 36.3 µg/L with a median of 15.0 µg/L and from 7.10 to 122 µg/L with a median of 15.0 µg/L, respectively. Aluminum concentrations at Hocomonco Pond station 3 ranged from 3.10 to 41.5 µg/L with a median of 11.9 µg/L.
The pH values for the effluent station (Westborough water-treatment plant backwash effluent [station 421627071392401]) (fig. 9) ranged from 6.7 to 8.7 SU with a median of 7.4 SU. Effluent pH values were generally higher than pH values in the pond. Effluent DOC and total hardness concentrations were always lower than the DOC and total hardness concentrations in the pond. Effluent DOC concentrations ranged from 1.55 to 2.31 mg/L with a median of 1.82 mg/L. Effluent total hardness concentrations ranged from 35 to 63.3 mg/L as CaCO3 with a median of 54.4 mg/L as CaCO3. Aluminum concentrations in the effluent ranged from 133 to 1,540 µg/L with a median of 333 µg/L. Aluminum concentrations in the effluent were always higher than aluminum concentrations in Hocomonco Pond. These higher aluminum concentrations were not reflected at pond stations 1–3, likely because of dilution of effluent in Hocomonco Pond.
Hanover Water-Treatment Facility
Stations near the Hanover WTF (fig. 10) were visited monthly from May 3, 2018, through May 2, 2019, to collect discrete water-quality samples and measure water-quality field parameters. The pH values for the ambient (upstream) station (Third Herring Brook Pond Street near Hanover, Mass. [station 011058065]) ranged from 6.2 to 7.6 SU with a median of 6.4 SU. The pH values in Third Herring Brook varied throughout the year with no distinct seasonal pattern. The lowest monthly pH value (6.2 SU) was measured at the upstream station in May 2018. Continuous pH data were measured at the upstream station from May 29, 2018, through February 5, 2019. Low flows affected the collection of water-quality data in Third Herring Brook during summer of 2018. No continuous pH data were measured from July 29 through September 12, 2018, because Third Herring Brook was dry at the upstream station during this period. Diel variations in pH were small (median daily range in pH per month of about 0.1 SU) and were less variable than pH variations between months. For example, pH values in fall 2018 ranged from 6.0 SU in September to 7.1 SU in November. The pH values for the ambient (downstream) station (Third Herring Brook downstream water-treatment plant near Hanover, Mass. [station 011058075]) (fig. 10) ranged from 5.8 to 7.9 SU with a median of 6.2 SU.
The monthly DOC concentrations at the upstream station ranged from 4.12 to 11.7 mg/L with a median of 8.40 mg/L. The monthly DOC concentrations detected at the upstream station were lowest in February and highest during October 2018. The monthly DOC concentrations at the downstream station ranged from 4.79 to 16.9 mg/L with a median of 9.76 mg/L. The monthly DOC concentrations detected at the downstream station during July and October were greater than 16 mg/L and were among the highest measured during the study. The brook flows through a large wetland in this reach that dried to a series of shallow pools during these months.
Total hardness concentrations at the upstream station ranged from 36.4 to 85.6 mg/L as CaCO3 with a median of 47.1 mg/L as CaCO3. Total hardness concentrations at the downstream station ranged from 33.7 to 173 mg/L as CaCO3 with a median of 54.8 mg/L as CaCO3. The total hardness concentrations at the upstream station were highest (greater than 50 mg/L as CaCO3) from May through October.
Aluminum concentrations at the upstream station ranged from 34.3 to 90.0 µg/L with a median of 65.5 µg/L. Aluminum concentrations at the downstream station ranged from 79 to 3,090 µg/L with a median of 225 µg/L. The highest aluminum concentrations at the downstream station were measured during July (1,980 and 1,290 µg/L) and August (3,090 µg/L), when streamflow in Third Herring Brook at the downstream station dried to a series of pools.
The pH values for the effluent station (Hanover water-treatment plant backwash effluent [station 420754070495801]) (fig. 10) ranged from 6.9 to 8.2 SU with a median of 7.5 SU. Effluent pH values were always higher than values in Third Herring Brook. Effluent DOC concentrations ranged from 2.06 to 6.19 mg/L with a median of 4.03 mg/L. Monthly DOC concentrations in effluent were always lower than DOC concentrations in the Third Herring Brook. The total hardness of the effluent ranged from 133 to 245 mg/L as CaCO3 with a median of 156 mg/L as CaCO3. Monthly total hardness values in effluent were always higher than total hardness values in Third Herring Brook. Aluminum concentrations in the effluent were higher than concentrations at the upstream station and ranged from 210 to 114,000 µg/L with a median of 1,140 µg/L. Effluent discharges likely contributed to high aluminum concentrations at the downstream station during the period from July 29 through September 12, 2018, when Third Herring Brook was dry at the upstream station and during low-flow periods leading up to and after the period when the brook was dry.
Leominster Water-Treatment Facility
Stations near the Leominster WTF (fig. 11) were visited monthly from April 23, 2018, through May 6, 2019, to collect discrete water-quality samples and measure water-quality field parameters. The pH values for the ambient (upstream) station (Monoosnoc Brook, upstream Leominster water-treatment plant [station 01094420]) ranged from 5.2 to 6.9 SU with a median of 5.9 SU. The monthly pH values for November and December 2018 (5.3 and 5.2 SU, respectively) and March 2019 (5.4 SU) were among the lowest pH values measured during the study. The pH at the upstream station had a distinct seasonal pattern, with higher values (greater than 6.5 SU) from June through August, and lower values (less than 6.0 SU) from October through February. Continuous pH data were measured at the ambient (upstream) station (Monoosnoc Brook, upstream Leominster water-treatment plant [station 01094420]) from May 4, 2018, through April 29, 2019. No data were collected from May 7 through June 7, 2018, because of a monitor malfunction. The continuous pH data indicate that Monoosnoc Brook had small diel variations in pH that were generally less than 0.4 SU. Diel variations in pH were greatest during June and least during November. Variations in pH between or within months were generally greater than diel variations of pH. The pH values for the ambient (downstream) station (Monoosnoc Brook, downstream Leominster water-treatment plant [station 01094422]) ranged from 5.4 to 7.2 SU with a median of 6.4 SU.
The monthly DOC concentrations at the upstream station ranged from 2.00 to 7.37 mg/L with a median of 4.21 mg/L. The monthly DOC concentrations at the downstream station ranged from 2.07 to 7.32 mg/L with a median of 4.03 mg/L. The monthly DOC concentrations in Monoosnoc Brook had a seasonal pattern and were lowest (less than 3 mg/L) during July and August and highest (greater than 5.0 mg/L) from October through December.
Total hardness concentrations at the upstream station ranged from 5.13 to 39.1 mg/L as CaCO3 with a median of 7.05 mg/L as CaCO3. Total hardness concentrations at the downstream station ranged from 5.19 to 35.2 mg/L as CaCO3 with a median of 9.12 mg/L as CaCO3. The total hardness concentrations in Monoosnoc Brook were among the lowest measured during the study. Total hardness had a seasonal pattern; values were higher (greater than 10.0 mg/L as CaCO3) from June through August and lower (less than 10.0 mg/L as CaCO3) during the remainder of the year.
Aluminum concentrations at the upstream station ranged from 26.7 to 208 µg/L with a median of 155 µg/L. Aluminum concentrations at the downstream station ranged from 86.1 to 287 µg/L with a median of 198 µg/L.
Monoosnoc Brook contained low ionic-strength water during portions of the study period. Specific conductance at the upstream station ranged between 107 and 426 µS/cm for the first half of the water year (April through September 2018). From October 2018 through April 2019, the specific conductance was less than 100 µS/cm. Seasonal differences in water quality at the Monoosnoc Brook stations are potentially related to the sources of water to the brook. Specific conductance was highest (about 425 µS/cm) during low flows in July and August when streamflow is primarily base flow (groundwater discharge). Specific conductance was lowest (less than 100 µS/cm) during periods of the year when streamflows were higher (October through April).
The pH values for the effluent station (Leominster water-treatment plant backwash effluent [station 423258071480701]) (fig. 11) ranged from 6.6 to 8.1 SU with a median of 7.5 SU. The effluent pH was always higher than the pH of Monoosnoc Brook at the upstream station, and the effluent discharge likely contributed to higher pH values for the downstream station. The pH at the downstream station averaged 0.3 SU higher than the pH at the upstream station. The effluent DOC concentrations ranged from 2.17 to 4.35 mg/L with a median of 3.15 mg/L. Effluent total hardness concentrations ranged from 5.07 to 10.4 mg/L as CaCO3 with a median of 7.71 mg/L as CaCO3. Effluent aluminum concentrations ranged from 326 to 792 µg/L with a median of 453 µg/L. Monthly aluminum concentrations in effluent were always higher than aluminum concentrations in Monoosnoc Brook. During periods of low flow, effluent discharges likely contributed to high aluminum concentrations at the downstream station.
Weymouth Water-Treatment Facility
Stations near the Weymouth WTF (fig. 12) were visited monthly from May 3, 2018, through May 2, 2019, to collect discrete water-quality samples and measure water-quality field parameters. The pH values for the ambient (upstream) station (Mill River near Randolph Street, South Weymouth [station 01094420]) ranged from 5.2 to 6.9 SU with a median of 5.9 SU. The monthly discrete pH values for Mill River near Randolph Street, South Weymouth, Mass. (station 01105587) ranged from 6.1 to 6.7 SU with a median of 6.3 SU. The pH values did not have a distinct seasonal pattern. Continuous pH data were measured at the upstream station from April 17, 2018, through February 4, 2019. Data were not collected between December 19, 2018, and January 17, 2019, because of a monitor malfunction. Daily minimum pH values were lowest during November (8 days with pH less than 6.0 SU), and daily maximum pH values were highest during May (16 days with pH greater than 6.8 SU). Diel variations in pH were greatest during August and least during December (median daily range of pH per month of 0.2 and 0.1 SU, respectively). Water-quality conditions at the shallow and deep stations on Great Pond were similar but differed from conditions in the Mill River. The pH values for Great Pond station 1 (Great Pond near outlet, shallow, South Weymouth, Mass. [station 421004070580201]) (fig. 12) ranged from 6.3 to 6.5 SU with a median of 6.4 SU. The pH values for Great Pond station 2 (Great Pond near outlet, deep, South Weymouth, Mass. [station 421004070580202]) ranged from 6.3 to 6.5 SU with a median of 6.4 SU.
The monthly DOC concentrations at the Mill River station ranged from 3.26 to 11.1 mg/L with a median of 5.29 mg/L. The monthly DOC concentrations at the Great Pond stations were lower than the DOC concentrations in Mill River. The monthly DOC concentrations at Great Pond stations 1 and 2 ranged from 2.35 to 3.53 mg/L with a median of 2.82 mg/L and from 2.32 to 3.09 mg/L with a median of 2.84 mg/L, respectively.
The total hardness concentrations at the Mill River station ranged from 61.5 to 111 mg/L as CaCO3 with a median of 80.7 mg/L as CaCO3. The total hardness concentrations had a slight seasonal pattern that was higher (greater than 90 mg/L as CaCO3) from late May through September and lower (less than 90 mg/L as CaCO3) the remainder of the year. The lowest total hardness concentration (61.5 mg/L as CaCO3) was measured during December 2018. These seasonal differences in water quality are potentially related to the water quality of base flow in summer when streamflow in the Mill River is primarily groundwater discharge. The total hardness concentrations at the Great Pond stations 1 and 2 ranged from 17.1 to 28.1 mg/L as CaCO3 with a median of 25.2 mg/L as CaCO3 and from 20.2 to 28.1 mg/L as CaCO3 with a median of 25.4 mg/L as CaCO3, respectively.
Aluminum concentrations at the Mill River station ranged from 15.5 to 440 µg/L with a median of 63 µg/L. Aluminum concentrations in Great Pond were higher at the deeper station than at the shallow station. Aluminum concentrations at Great Pond stations 1 and 2 ranged from 27.5 to 71 µg/L with a median of 47.1 µg/L and from 30.1 to 192 µg/L with a median of 58.6 µg/L, respectively.
The pH values for the effluent station (Weymouth water-treatment plant effluent [station 420959070580401]) (fig. 12) ranged from 5.8 to 7.2 SU with a median of 6.25 SU. The effluent DOC concentrations ranged from 1.90 to 4.14 mg/L with a median of 3.06 mg/L. Effluent total hardness concentrations ranged from 16.0 to 29.3 mg/L as CaCO3 with a median of 27.8 mg/L as CaCO3. Effluent aluminum concentrations ranged from 194 to 12,700 µg/L with a median of 971 µg/L. In addition to the high aluminum values in the effluent discharge, there were some physical indications (clear water and a delta of gelatinous sediments of unusual composition at the effluent outfall) that coagulant from the plant may be reaching the pond.
Wilmington Water-Treatment Facility
Stations near the Wilmington WTF (fig. 13) were visited monthly from May 4, 2018, through May 6, 2019, to collect discrete water-quality samples and measure water-quality field parameters. The pH values for the two ambient (upstream) stations on Sawmill and Maple Meadow Brooks varied over a similar pH range. The pH values for the Sawmill Brook station (Sawmill Brook at Chestnut Street, Wilmington, Mass. [station 01101296]) ranged from 6.5 to 7.0 SU with a median of 6.8 SU. The pH values for the upstream Maple Meadow Brook station (Maple Meadow Brook, Wilmington, Mass., [station 01101294]) ranged from 6.6 to 7.1 SU with a median of 6.9 SU. The monthly pH values did not indicate a consistent seasonal pattern. Continuous pH data were measured at the Sawmill Brook station from June 6, 2018, through February 7, 2019. Diel variations in pH were greatest during August and September (median daily range in pH per month of 0.2 and 0.1 SU, respectively. The lowest daily minimum pH values were near 6.0 SU and were measured over 1- to 2-day periods during July, August, and September. The highest daily maximum pH values (7.0–7.2 SU) were measured during January. The pH values for the downstream Maple Meadow Brook station (Maple Meadow Brook at Middlesex Canal, Wilmington, Mass., [station 01101298]) ranged from 6.1 to 6.7 SU with a median of 6.2 SU.
Monthly DOC concentrations at the Sawmill Brook station (fig. 13) ranged from 3.24 to 6.66 mg/L with a median of 4.71 mg/L. The monthly DOC concentrations at the upstream Maple Meadow Brook station ranged from 2.33 to 4.50 mg/L with a median of 2.81 mg/L. The DOC concentrations were lowest (less than 3.00 mg/L) from May through August and from December through April. The monthly DOC concentrations at the downstream Maple Meadow Brook station ranged from 4.09 to 8.08 mg/L with a median of 6.83 mg/L. Monthly DOC concentrations at the downstream station were always higher than at the two upstream stations, potentially because of the effect of the large wetland between the upstream and downstream stations.
Total hardness concentrations at Sawmill Brook station ranged from 57.9 to 115 mg/L as CaCO3 with a median of 79.8 mg/L as CaCO3. The total hardness concentrations at the upstream Maple Meadow Brook station (fig. 13) ranged from 62.4 to 117 mg/L as CaCO3 with a median of 87.2 mg/L as CaCO3. The total hardness concentrations at the upstream stations had a seasonal pattern and were higher (greater than 90 mg/L as CaCO3) from May through October and lower (less than 90 mg/L as CaCO3) during the remainder of the year. The total hardness concentrations at the downstream Maple Meadow Brook station ranged from 37.9 to 97.0 mg/L as CaCO3 with a median of 77.6 mg/L as CaCO3.
The aluminum concentrations at the Sawmill Brook station ranged from 15.8 to 161 µg/L with a median of 46.4 µg/L. The aluminum concentrations at the upstream Maple Meadow Brook station ranged from 28.0 to 91.3 µg/L with a median of 45.0 µg/L. Aluminum concentrations at the two upstream stations on Sawmill Brook and Maple Meadow Brook were generally higher than aluminum concentrations at the downstream Maple Meadow Brook station. The aluminum concentrations at the downstream Maple Meadow Brook station ranged from 4.10 to 80.0 µg/L with a median of 19.0 µg/L.
The pH values for the effluent station (Wilmington water-treatment plant backwash effluent [station 423200071100201]) (fig. 13) ranged from 6.9 to 7.8 SU with a median of 7.0 SU. Effluent DOC concentrations ranged from 2.71 to 7.50 mg/L with a median of 4.93 mg/L. Effluent total hardness ranged from 99.7 to 131 mg/L as CaCO3 with a median of 117 mg/L. Effluent aluminum concentrations ranged from 320 to 119,000 µg/L with a median of 1,540 µg/L. In November and December 2018, the southern lagoon was cleaned, and there was little effluent outflow while the lagoon was refilling. Monthly effluent samples collected while the lagoons were refilling were collected from streams of effluent flowing through cracks between boards on the weir and had high aluminum concentrations (119,000, 9,930, and 26,900 µg/L). The high aluminum concentrations likely resulted because the effluent leaks were not a supernatant discharge and included suspended solids. The high aluminum concentrations in the effluent were not reflected at the downstream station possibly because of the slow movement of water and long flow paths through the wetland.
Calculation of Site Dependent Aluminum Criteria Values
The EPA Calculator is used with local pH values and DOC and total hardness concentrations as input parameters to calculate site-dependent aluminum criteria values. The EPA Calculator estimates total aluminum concentrations in water that, if not exceeded, would be expected to protect fish, invertebrates, and other aquatic life under the full range of conditions determined at each site. These conditions include when aluminum is most toxic given the spatial and temporal variability of the water chemistry at the site (EPA, 2018).
The outputs from the EPA Calculator are the acute criterion, defined as the CMC, an estimate of the highest aluminum concentration in micrograms per liter in surface water to which an aquatic community can be exposed briefly without resulting in unacceptable (lethal) effects; and also the chronic criterion, defined as the CCC, an estimate of the highest aluminum concentration in surface water to which an aquatic community can be exposed indefinitely without resulting in unacceptable effects, such as to growth and reproduction (EPA, 2018). The CMC is intended to protect approximately 95 percent of a group of diverse genera in an aquatic community if the 1-hour average total recoverable aluminum concentration does not exceed the acute criterion more than once every 3 years, and the CCC will protect organisms if the 4-day average total recoverable aluminum concentration does not exceed the chronic criterion more than once every 3 years.
For this report, site-dependent freshwater acute and chronic aluminum concentrations were calculated with the EPA Calculator (EPA, 2018). The version of the EPA Calculator used for this report was a macro-enabled Excel file (Aluminum Criteria Calculator V.2.0.xlsx). Selected stations used in the EPA Calculator are listed in tables 2 and 6, and these stations were reviewed by the MassDEP. Water-quality data used as inputs into the EPA Calculator included pH data that had been measured as a field parameter in situ concurrently with sample collection, and DOC and total hardness concentrations determined from discrete water-quality samples.
The EPA Calculator has lower and upper boundary limits for the following water-chemistry input parameters: pH (5.0–10.5 SU), DOC (0.08–12.0 mg/L), and total hardness (0.01–430 mg/L as CaCO3). If pH, DOC, or total hardness concentrations beyond the specified limits are used as inputs to the EPA Calculator, the software will flag samples as being “outside model inputs,” and the input parameters will default to the upper or lower boundary limits, as appropriate. The EPA cautions that aluminum CMC and CCC calculations should be considered carefully if input pH values are less than 6.0 or greater than 8.2 SU but are within the upper and lower boundary limits of the EPA Calculator (EPA, 2018).
The output from the EPA Calculator includes the recommended CMC and CCC values, reported in micrograms per liter for total recoverable aluminum for each set of data inputs (pH, DOC, and total hardness). Instantaneous aluminum CMC and CCC values were determined for each monthly sample with the EPA Calculator. These instantaneous aluminum CMC and CCC values differ among months and seasons in response to water-chemistry variability at a site (pH, DOC, and total hardness). To determine CMC and CCC values typically evaluated for use as protective water-quality criteria, the monthly instantaneous CMC and CCC values were used to calculate the minimum, 5th percentile, and 10th percentile CMC and CCC values. The 5th and 10th percentile statistics represent conservative values to protect aquatic life within the full range of seasonal and flow conditions at a site throughout the year, including when aluminum is most toxic (EPA, 2018). The minimum CMC and CCC values are calculated to represent values that would capture the most toxic conditions at a site.
Site-Dependent Aluminum Criteria Values for Receiving-Water Bodies near 11 Water-Treatment Facilities in Eastern and Central Massachusetts
Site-dependent aluminum CMC and CCC concentration values were calculated for selected stations near each water-treatment facility. The stations used for aluminum calculations were the ambient stations on the receiving-water body that were upstream from effluent discharges (for stream and river stations) or outside of the immediate effect of effluent discharges (for ponds and reservoir stations). The USGS consulted with the MassDEP and the EPA to confirm the EPA-designated receiving-water body for each facility’s NPDES permit and which stations to use for calculations of the monthly site-dependent criteria values. Of the 27 ambient stations, 18 were used in calculations of monthly aluminum CMC and CCC values (table 2).
Water-quality data from effluent stations and stations downstream from effluent discharges (for streams or rivers) were not used for aluminum criteria value calculations. In addition, a few discrete monthly samples from the 18 selected ambient stations were not used for aluminum calculations. Samples that were removed from use for aluminum calculations include a sample collected after a storm event by MassDEP’s request (Richard Carey, MassDEP, oral commun., July, 2018) at Assabet River at Boundary Street near Northborough (station 01096720) on July 27, 2018, and seven monthly pond samples collected through the ice in winter but at different locations from the established stations because of unsafe ice conditions. These samples were removed from analysis because water-quality conditions at these sites may have differed from those at the established stations because of different site conditions such as shallower water depths, and different bottom substrates and flow conditions. Different locations included samples collected through the ice near shore in the vicinity of the Cohasset station at Lily Pond deep hole (shallow) (station 421326070485802) on December 11, 2018, February 2, 2019, and March 8, 2019; the Westborough WTF station at Hocomonco Pond shallow, Westborough, Mass. (station 421622071385701), on February 12, 2019, and March 6, 2019; and the Fitchburg station at Wyman Pond shallow, Westminster, Mass. (station 423211071524701), on December 10, 2018, and February 12, 2019.
The monthly aluminum CMC and CCC values were calculated by entering the monthly pH, DOC, and total hardness data into the EPA Calculator. Input and output data from the EPA Calculator and time-series plots of the monthly aluminum CMC and CCC values for each of the selected stations are available in Armstrong and others (2022). The instantaneous aluminum CMC and CCC values differed among stations in response to local water-chemistry variability at a site (pH, DOC, and total hardness) (fig. 24).
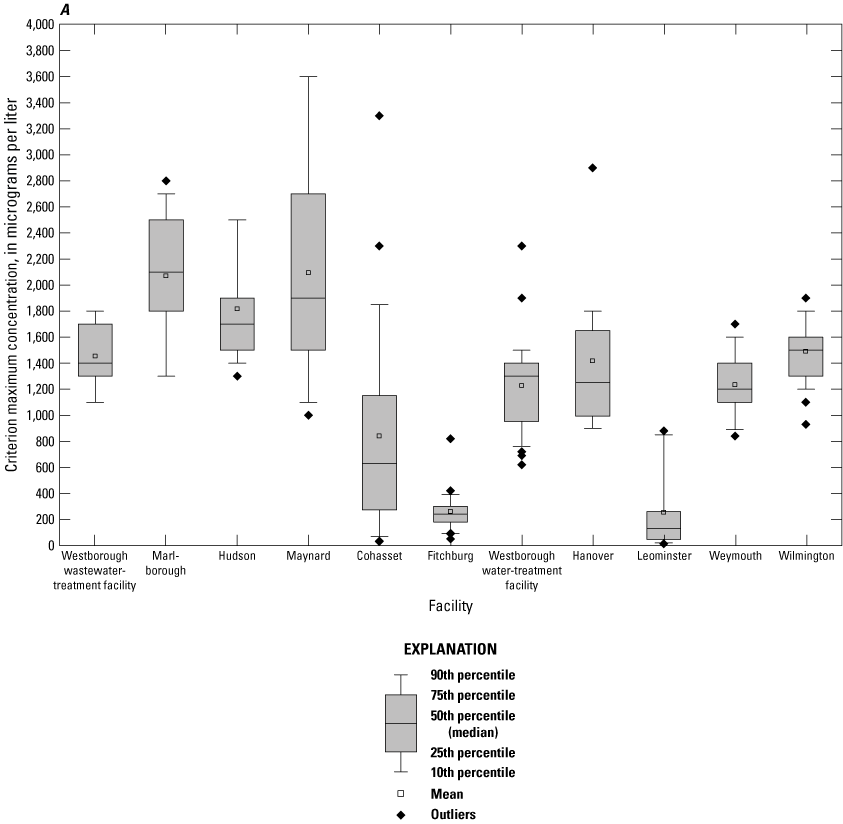
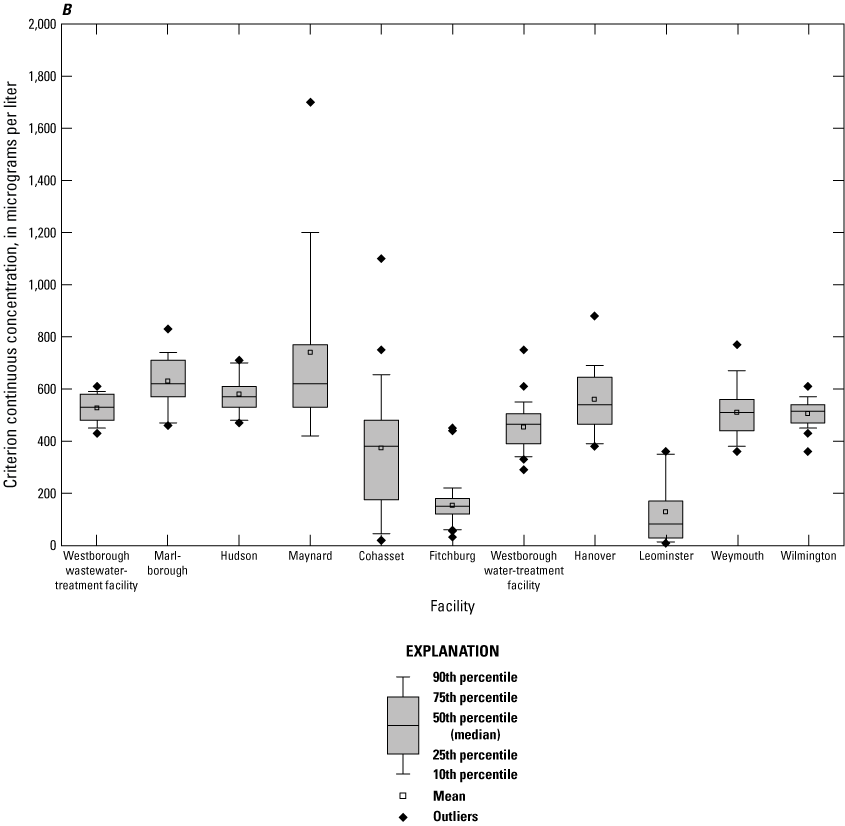
Distribution of site-dependent aluminum criteria values calculated with the U.S. Environmental Protection Agency (EPA) Aluminum Criteria Calculator for monthly pH, dissolved organic carbon, and total hardness data collected at selected stations near 11 water-treatment facilities in eastern and central Massachusetts, 2018–19. A, Aluminum criterion maximum concentration values and B, Criterion continuous concentration. Facility names and identification of stations used in EPA calculator to generate aluminum criteria values are provided in table 2.
Monthly aluminum output values from the EPA Calculator were used to calculate the minimum, 5th percentile, and 10th percentile of the monthly aluminum criteria values for each of the selected stations (table 6). The 10th percentile values would be protective 90 percent of the time, and the 5th percentile values would be protective 95 percent of the time. The minimum, 5th percentile, and 10th percentile values were determined from the monthly data for each individual station and also from datasets that combined the monthly data from multiple stations. Monthly data were combined to calculate the minimum, 5th percentile, and 10th percentile values for the two upstream tributaries (Sawmill Brook and Maple Meadow Brook) in Wilmington, pond stations 1 and 2 on Lily Pond in Cohasset (fig. 7), pond stations 1–4 on Wyman Pond in Fitchburg (fig. 8); and pond stations 1–3 on Hocomonco Pond in Westborough (fig. 9). The boxplots for Wilmington, Cohasset, Fitchburg, and Westborough WTFs shown in figure 24 were generated using the combined monthly aluminum concentration criteria values for those stations.
Table 6.
Minimum, 5th percentile, and 10th percentile statistics for aluminum calculations made with the U.S. Environmental Protection Agency Aluminum Criteria Calculator for stations near seven water-treatment and four wastewater-treatment facilities in eastern and central Massachusetts, 2018–19.[µg/L as Al, microgram per liter as aluminum; CMC, criterion maximum concentration; CCC, criterion continuous concentration; WWTF, wastewater-treatment facility; Mass., Massachusetts; WTF, water-treatment facility; —, not applicable; US, upstream]
The site-dependent aluminum criteria values calculated for each station are discussed below. Time-series plots of the monthly aluminum CMC and CCC values for each station are available in Armstrong and others (2022).
Westborough Wastewater-Treatment Facility
Monthly aluminum criteria value calculations for the Assabet River in Westborough were generated using water-quality data collected at the ambient (upstream) station Assabet River near Westborough, Mass. (station 01096603) (fig. 9). The monthly aluminum CMC values for the upstream station ranged from 1,100 to 1,800 µg/L, and the monthly aluminum CCC values ranged from 430 to 610 µg/L. The CMC minimum, 5th percentile, and 10th percentile values were 1,100, 1,100, and 1,100 µg/L, respectively, and the CCC minimum, 5th percentile, and 10th percentile values were 430, 442, and 450 µg/L, respectively. The aluminum concentrations measured in the Assabet River at the downstream station, Assabet River downstream from Westborough water-treatment plant at Route 9 (station 421700071381901), ranged from 28.6 to 166 µg/L and were always lower than the minimum, 5th percentile, and 10th percentile of the monthly aluminum CMC and CCC values.
Marlborough Wastewater-Treatment Facility
Monthly aluminum criteria value calculations for the Assabet River in Marlborough were generated using water-quality data collected at the ambient (upstream) station Assabet River at Boundary Street near Northborough, Mass. (station 01096720) (fig. 4). The monthly CMC values for the upstream station ranged from 1,300 to 2,800 µg/L, and the monthly CCC values ranged from 460 to 830 µg/L. Monthly aluminum CMC and CCC values were highest during May through October and lowest during November and February. The CMC minimum, 5th percentile, and 10th percentile values were 1,300, 1,300, and 1,380 µg/L, respectively. The CCC minimum, 5th percentile, and 10th percentile values were 460, 466, and 486 µg/L, respectively. The aluminum concentrations measured in the Assabet River at the downstream station, Assabet River, downstream Marlborough wastewater-treatment plant (station 01096725), ranged from 61.5 to 174 µg/L and were always lower than the minimum, 5th percentile, and 10th percentile of the monthly aluminum CMC and CCC values.
Hudson Wastewater-Treatment Facility
Monthly aluminum criteria value calculations for the Assabet River in Hudson were generated using water-quality data collected at the ambient (upstream) station Assabet River at Cox Street near Hudson, Mass. (station 01096870) (fig. 5). The monthly aluminum CMC values for the upstream station ranged from 1,300 to 2,500 µg/L, and the monthly aluminum CCC values ranged from 470 to 710 µg/L. The aluminum calculations indicated seasonal patterns. Monthly CMC and CCC values were highest during June through October and lowest in December. The CMC minimum, 5th percentile, and 10th percentile values were 1,300, 1,360, and 1,420 µg/L, respectively, and the CCC minimum, 5th percentile, and 10th percentile values were 470, 476, and 486 µg/L, respectively. The aluminum concentrations measured in the Assabet River at the downstream station, Assabet River near Hudson-Stow town line (station 01096875), ranged from 18.1 to 77.4 µg/L and were always lower than the minimum, 5th percentile, and 10th percentile of the monthly aluminum CMC and CCC values.
Maynard Wastewater-Treatment Facility
Monthly aluminum criteria value calculations for the Assabet River in Maynard were generated using water-quality data collected at the ambient (upstream) station Assabet River, upstream Maynard wastewater-treatment plant (station 01097021) (fig. 6). The monthly aluminum CMC values for the upstream station ranged from 1,000 to 3,600 µg/L, and the monthly aluminum CCC values ranged from 420 to 1,700 µg/L. The aluminum CMC and CCC calculations indicated seasonal patterns. Monthly CMC and CCC values were highest during June through September and lowest in November and February. The CMC minimum, 5th percentile, and 10th percentile values were 1,000, 1,060, and 1,140 µg/L, respectively, and the CCC minimum, 5th percentile, and 10th percentile values were 420, 420, and 428 µg/L, respectively. The aluminum concentrations measured in the Assabet River at the downstream station, Assabet River, downstream Maynard wastewater-treatment plant (station 01097023), ranged from 20.2 to 79.8 µg/L and were always lower than the minimum, 5th percentile, and 10th percentile of the monthly aluminum CMC and CCC values.
Cohasset Water-Treatment Facility
Monthly aluminum criteria value calculations for Lily Pond in Cohasset were generated using water-quality data collected at Lily Pond station 1 (Lily Pond deep hole [shallow] [station 421326070485802]) and Lily Pond station 2 (Lily Pond deep hole [station 421326070485801]) (fig. 7). When values from Lily Pond stations 1 and 2 are combined, the monthly CMC values ranged from 30 to 3,300 µg/L, and the monthly CCC values ranged from 19 to 1,100 µg/L. The aluminum CMC and CCC calculations at Lily Pond stations 1 and 2 varied but did not indicate distinct seasonal patterns. Monthly CMC and CCC values were lowest during November. The CMC minimum, 5th percentile, and 10th percentile values determined from the combined monthly aluminum criteria values were 30, 32, and 102 µg/L, respectively, and the CCC minimum, 5th percentile, and 10th percentile values determined from the combined monthly aluminum criteria values were 19, 20, and 66 µg/L, respectively. The low aluminum criteria values for these stations were affected primarily by the low pH values measured in Lily Pond. The aluminum concentrations at Lily Pond stations 1 and 2 ranged from 43.3 to 370 µg/L, and from 27.3 to 357 µg/L, respectively. The aluminum concentrations measured at pond stations 1 and 2 exceeded the minimum, 5th percentile, and 10th percentile of the monthly aluminum CMC and CCC values for 8 of the 10 months for which CMC and CCC values were calculated.
Fitchburg Water-Treatment Facility
Monthly aluminum criteria value calculations for Wyman Pond in Fitchburg were generated using water-quality data collected at four stations on Wyman Pond in Fitchburg, pond stations 1 and 2 (stations 423132071523401 and 423132071523402, respectively), and pond stations 3 and 4 (stations 423211071524701 and 423211071524702, respectively) (fig. 8). The monthly CMC values for pond stations 1 and 2 ranged from 49 to 1,632 µg/L, and the monthly CCC values ranged from 31 to 450 µg/L. The monthly CMC values for pond stations 3 and 4 ranged from 95 to 390 µg/L, and the monthly CCC values ranged from 59 to 220 µg/L. The monthly aluminum criteria value calculations for the stations on Wyman Pond varied but did not indicate seasonal patterns. The low aluminum criteria values for Wyman Pond are a result of concurrently low pH and DOC concentrations for sampling events. The monthly CMC and CCC values were lowest at pond station 1 during November, pond station 2 during September, pond station 3 during May and November, and pond station 4 during September.
When monthly CMC and CCC values from all four Wyman Pond stations (pond stations 1–4) are combined, the minimum, 5th percentile, and 10th percentile of the monthly aluminum CMC values were 49, 89, and 95 µg/L, respectively, and the minimum, 5th percentile, and 10th percentile of the monthly aluminum CCC values were 31, 55, and 60 µg/L, respectively. The aluminum concentrations at pond stations 1 and 2 ranged from 23.6 to 67.4 µg/L, and the aluminum concentrations at pond stations 3 and 4 ranged from 15.1 to 62 µg/L. The highest monthly aluminum concentrations detected in Wyman Pond exceeded the minimum of the monthly aluminum CMC values (49 µg/L) at all four stations. There were no pond stations where aluminum concentrations exceeded the 5th percentile (89 µg/L) and 10th percentile (95 µg/L) of the monthly aluminum CMC values. The monthly aluminum concentrations measured in Wyman pond during September (67.4 µg/L) or November (67 µg/L) exceeded the minimum, 5th percentile, and 10th percentile of the monthly aluminum CCC values for all four stations.
Westborough Water-Treatment Facility
Monthly aluminum criteria value calculations for Hocomonco Pond in Westborough were generated using water-quality data collected at three stations on Hocomonco Pond, pond stations 1 and 2 (stations 421622071385701 and 421622071385702, respectively), and pond station 3 (station 421628071384501) (fig. 9). When values from pond stations 1, 2, and 3 are combined, the monthly CMC aluminum criteria values ranged from 620 to 2,300 µg/L, and the monthly CCC values ranged from 290 to 750 µg/L. The aluminum concentration calculations at the pond stations varied with the lowest values in fall and winter. The CMC minimum, 5th percentile, and 10th percentile values when all three pond stations are combined were 620, 706, and 769 µg/L, respectively. The combined CCC minimum, 5th percentile, and 10th percentile values were 290, 336, and 341 µg/L, respectively. The aluminum concentrations detected in Hocomonco Pond ranged from 3 to 122 µg/L and were always lower than the minimum, 5th percentile, and 10th percentile of the monthly aluminum CMC and CCC values for pond stations 1–3.
Hanover Water-Treatment Facility
Monthly aluminum criteria value calculations for Third Herring Brook in Hanover were generated using water-quality data collected at the ambient (upstream) station Third Herring Brook Pond Street near Hanover, Mass. (station 011058065) (fig. 10). The monthly CMC values for the upstream station ranged from 900 to 2,900 µg/L, and the monthly CCC values ranged from 380 to 880 µg/L. The aluminum CMC and CCC values indicated seasonal patterns. The monthly CMC and CCC values were low for January through March with the lowest values during March (CMC and CCC values of 900 and 380 µg/L, respectively). The CMC minimum, 5th percentile, and 10th percentile values were 900, 900, and 909 µg/L, respectively, and the CCC minimum, 5th percentile, and 10th percentile values were 380, 386, and 397 µg/L, respectively. The aluminum concentrations measured in Third Herring Brook at the downstream station, Third Herring Brook, downstream water-treatment plant, near Hanover, Mass. (station 011058075), ranged from 79 to 3,090 µg/L, and the monthly aluminum concentrations measured during July (1,980 and 1,290 µg/L) and August (3,090 µg/L) exceeded the minimum, 5th percentile, and 10th percentile of the monthly aluminum CMC and CCC values.
Leominster Water-Treatment Facility
Monthly aluminum criteria value calculations for Monoosnoc Brook in Leominster were generated using water-quality data collected at the ambient (upstream) station, Monoosnoc Brook, upstream Leominster water treatment plant (station 01094420) (fig. 11). The monthly CMC values for the upstream station ranged from 15 to 880 µg/L, and the monthly CCC values ranged from 9 to 360 µg/L. The low aluminum CMC and CCC values were caused by low pH values measured in Monoosnoc Brook in combination with low DOC and total hardness concentrations. The monthly CMC and CCC values for the upstream station were lowest in December (15 and 9 µg/L, respectively). The CMC minimum, 5th percentile, and 10th percentile values were 15, 19, and 21 µg/L, respectively, and the CCC minimum, 5th percentile, and 10th percentile values were 9, 11, and 13 µg/L, respectively. The aluminum concentrations measured in Monoosnoc Brook at the downstream station Monoosnoc Brook, downstream Leominster water-treatment plant (station 01094422) ranged from 86.1 to 287 µg/L and were always higher than the minimum, 5th percentile, and 10th percentile of the monthly aluminum CMC and CCC values.
Weymouth Water-Treatment Facility
Monthly aluminum criteria value calculations for the Mill River in Weymouth were generated using water-quality data collected at the ambient (upstream) station Mill River near Randolph Street, South Weymouth, Mass. (station 01105587) (fig. 12). The monthly CMC values for the upstream station ranged from 840 to 1700 µg/L, and the monthly CCC values ranged from 360 to 770 µg/L. Monthly CMC and CCC values for the Mill River station varied throughout the year and were lowest during February. The CMC minimum, 5th percentile, and 10th percentile values were 840, 870, and 896 µg/L, respectively. The CCC minimum, 5th percentile, and 10th percentile values were 360, 372, and 382 µg/L, respectively. The aluminum concentrations measured at the upstream station on Mill River ranged from 15.5 to 440 µg/L and were always lower than the minimum, 5th percentile, and 10th percentile of the monthly aluminum CMC values. The aluminum concentration measured at the upstream station on Mill River in February 2019 (440 µg/L) exceeded the minimum, 5th percentile, and 10th percentile of the monthly aluminum CCC values. During the selection process for stations associated with the Weymouth WTF, a pair of stations (stations 421004070580201 and 421004070580202) were selected in the pond downgradient of the effluent discharge from the Weymouth WTF, but a monitoring station was not selected on Mill River (the receiving-water body) downstream from where the effluent discharge reaches the Mill River. Aluminum concentrations in the effluent could reach high values (from 194 to 12,700 µg/L). However, aluminum concentrations measured in the embayment of Great Pond that receives the effluent discharge were always lower than the CMC and CCC minimum, 5th percentile, and 10th percentile values. Aluminum concentrations measured at the shallow pond station, Great Pond near outlet, shallow, South Weymouth, Mass. (station 421004070580201), ranged from 27.5 to 71 µg/L; and aluminum concentrations measured at the deep pond station, Great Pond near outlet, deep, South Weymouth, Mass. (station 421004070580202), ranged from 30.2 to 192 µg/L.
Wilmington Water-Treatment Facility
Monthly aluminum criteria value calculations for Maple Meadow Brook in Wilmington were generated using water-quality data collected at two ambient (upstream) stations, Sawmill Brook at Chestnut Street, Wilmington, Mass. (station 01101296), and Maple Meadow Brook, Wilmington, Mass. (station 01101294) (fig. 13). Monthly CMC values for the upstream station on Sawmill Brook ranged from 1,300 to 1,900 µg/L, and the monthly CCC values ranged from 460 to 610 µg/L. The monthly CMC values for the upstream station on Maple Meadow Brook ranged from 930 to 1,700 µg/L, and the monthly CCC values ranged from 360 to 540 µg/L. Monthly CMC and CCC values were lowest during August and December at the Sawmill Brook station and during December at the upstream Maple Meadow Brook station. The CMC minimum, 5th percentile, and 10th percentile values for the combined aluminum CMC values values for Sawmill and Maple Meadow Brooks were 930, 1,120, and 1,250 µg/L, respectively, and the CCC minimum, 5th percentile, and 10th percentile values were 360, 435, and 455 µg/L, respectively. Some high aluminum concentrations (from 320 to 119,000 µg/L) were detected in effluent leaking from the boards of the weir when the lagoon was filling. However, the aluminum concentrations measured in Maple Meadow Brook at the downstream station Maple Meadow Brook, at Middlesex Canal, Wilmington, Mass. (station 01101298), ranged from 4.1 to 80 µg/L and were always lower than the minimum, 5th percentile, and 10th percentile of the monthly aluminum CMC and CCC values.
Effect of Variable pH on Aluminum Values from the U.S. Environmental Protection Agency Aluminum Criteria Calculator
Two factors observed to affect pH values in this study were evaluated to assess the effect of pH variability on aluminum CMC and CCC values determined from the EPA Calculator. The two factors are as follows: (1) pH variability arising from pH measurement at different locations with different instruments and (2) pH variability caused by diel pH cycles. The continuous pH data collected during the study were used to help evaluate these factors. The continuous pH measurements do not have corresponding water samples collected concurrently at the location of the continuous sensors for measurement of DOC and total hardness; therefore, continuous pH measurements were not used as inputs to the EPA Calculator to report CMC and CCC values. However, the continuous pH measurements were used to evaluate the potential effect of pH variability on aluminum CMC and CCC values.
Assessment of Variations in pH Measurement on Aluminum Criterion Maximum Concentration and Criterion Continuous Concentration Calculations
Discrete in situ pH measurements were compared to concurrent continuous (15-minute interval) pH measurements (fig. 25). Discrete pH measurements were less than the concurrent continuous pH measurements recorded by water-quality monitors for six of the stations, including Leominster, Fitchburg, Hanover, and, to a lesser extent, Marlborough, Maynard, and Wilmington. The 91 discrete measurements made at the 11 stations where continuous data were collected were on average 0.2 SU less than concurrent continuous measurements (differences ranged from −1.1 to 1.0 SU). A review of the discrete and continuous pH data did not definitively determine the reasons for specific differences. The following are possible sources of these differences: (1) differences in measurement location, (2) differences among measurements in rapidly moving and relatively still water, (3) inaccuracies resulting from measurement in low ionic-strength water using electrodes designed for general use, (4) use of different instruments to measure pH, and (5) errors from temperature differences between calibration buffers and field measurements. Differences in discrete and continuous pH measurements are discussed below using the ambient (upstream) Leominster station (fig. 11) as an example.
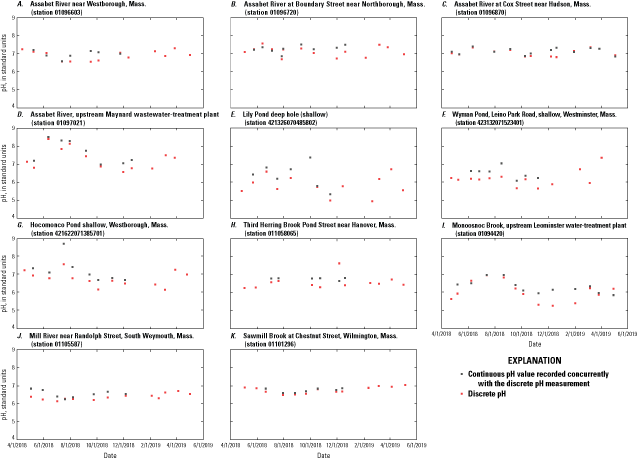
Comparison of pH values collected as continuous (15-minute interval) and discrete water-quality field parameters at selected stations near four wastewater-treatment facilities and seven water-treatment facilities in eastern and central Massachusetts, 2018–19. A, Fitchburg; B, Cohasset; C, Hanover; D, Leominster; E, Weymouth; F, Wilmington; G, Westborough Water-Treatment Facility; H, Westborough Waste-Water Treatment Facility; I, Marlborough; J, Hudson; K, Maynard. Facility names and station types are provided in table 2.
Differences Among pH Values Measured in Different Locations
During this study, discrete pH values were measured in situ at each of the points along a cross section where water-quality samples had been collected. The number of points where samples were collected varied depending on channel size and hydrologic conditions, but samples were generally collected either at 3, 5, or 10 locations. Measurements were made at six-tenths the stream depth if pH measurements were made while wading or from a bridge, or at approximately 1.5 ft below the surface if pH measurements were made from a canoe. The discrete pH value recorded with the water-quality sample was the median of the field measurements. For shallow and deep pond stations, discrete pH measurements were made at the same depths where samples were collected. For shallow pond stations, pH measurements were made at approximately 1.5 ft below the surface. For deep pond stations, pH measurements were made at the deepest location possible while remaining above submerged aquatic vegetation. To evaluate pH variability with depth, discrete pH measurements also were made at 1-ft intervals within a vertical pond profile.
The continuous pH measurements were recorded with a monitor installed at a fixed location. Continuous pH measurements for stream and river stations were recorded from a deep channel area near one bank using a sonde installed in a stainless-steel pipe anchored just above the streambed. Continuous pH measurements for pond stations were recorded using monitoring equipment mounted on a plastic dock float with a sonde housed inside a polyvinyl chloride (PVC) pipe that extended about 1.5 ft below the water surface.
Differences in water-quality conditions along a cross section or vertical profile where field parameters were measured could contribute to differences between discrete and continuous pH values for a station. An additional source of variation for discrete pH measurements may result because the locations of the cross section or vertical profile used to collect the discrete samples could vary from month to month, depending on hydrologic and environmental conditions at the site at the time of sampling. Descriptions of the sampling locations for each station are provided in appendix 1.
Small differences in pH (about as much as 0.1 SU) typically were observed along the cross sections during the monthly sampling at the Leominster ambient (upstream) station (Monoosnoc Brook, upstream Leominster water-treatment plant [station 01094420]) (fig. 11). During some sampling events, discrete water-quality samples and associated pH measurements were collected from a cross section of the brook from 20 to 30 ft upstream from the continuous water-quality monitor. Discrete water-quality samples and associated field parameters (including water temperature, pH, and specific conductance) were collected at this location because the channel had a relatively uniform cross section not divided by large boulders, simplifying sample collection using equal-width increment, isokinetic, depth-integrated sampling techniques (USGS, 2018).
Measurement of discrete and continuous pH values for different locations at the Leominster ambient (upstream) station (fig. 11) may have contributed to differences between the discrete and continuous pH measurement values. Continuous pH measurements at the Leominster ambient (upstream) station were recorded with a monitor near the left bank that was secured at the bottom of a small pool behind a large rock. The receiving-water body, Monoosnoc Brook, is a small brook with a steep gradient, and the monitor was installed at this location to avoid water levels dropping below the sensors during summer low flows and to minimize the possibility of ice damage during winter. Streamflow at the site is regulated by an impoundment about 680 ft upstream from the station. During the summer, observations of rust-colored, iron-oxidizing bacteria deposits along the left bank and in the pool bottom indicate that groundwater discharges could potentially affect water quality during periods of low flow.
Differences Among Measurements Made in Rapidly Moving Water Compared to Relatively Still Water
Monoosnoc Brook at the Leominster ambient (upstream) station is a steep stream reach with rapidly moving, turbulent, and well-aerated water. Turbulence increases the aeration of flowing water. These conditions can make accurate measurement of pH difficult. The discrete pH measurements were taken at multiple locations along a channel cross section, frequently in turbulent conditions. In contrast, continuous pH measurements were recorded with a monitor at the bottom of a pool where water turbulence, aeration, and velocity conditions were generally less severe than those in the cross section where the discrete measurements were made. The effect of high velocity and aeration of the water on pH has been documented to decrease measurement accuracy (Ritz and Collins, 2008; USGS, 2021a) and potentially cause systematic errors of lower pH by as much as 0.5 SU (Neal and Thomas, 1985).
Inaccuracies Resulting from Measurement in Low Ionic-Strength Water Using Electrodes Designed for General Use
Measurement of pH is more difficult in low-conductivity waters (less than 100 μS/cm), especially at low (near freezing) temperatures (Busenberg and Plummer, 1987; USGS, 2021a). The measurement of pH is an electrical measurement, and the presence of ions is needed to enable electron transfer between the measuring and reference electrodes. Low-conductance water is not sufficiently conductive to complete the electrical circuit and can lead to less stable pH readings (USGS, 2021a). Measurements of pH in low ionic-strength water or at low temperatures also require longer times for pH readings to stabilize.
During parts of the year, Monoosnoc Brook (fig. 11) has relatively low ionic-strength water. For the first half of the study (April through September, 2018), the monthly specific-conductance values in Monoosnoc Brook ranged between 107 and 426 µS/cm at the ambient (upstream) station (Monoosnoc Brook upstream Leominster water treatment plant [station 01094420]) and between 110 and 437 µS/cm at the downstream station (Monoosnoc Brook, downstream Leominster water-treatment plant [station 01094422]) (fig. 11). In October, the specific conductance in Monoosnoc Brook was 96 µS/cm and 110 µS/cm at the upstream and downstream stations, respectively. During the remainder of the study period (November 2018 through May 2019), specific conductance at these stations ranged between 66 and 94 µS/cm. This low ionic-strength water, in combination with the turbulence, aeration, and high-velocity conditions at the Monoosnoc Brook stations, and low water temperatures in winter, created challenges for field pH measurements. In March and April 2019, pH measurements were made using three different instruments (two water-quality sondes and a laboratory pH meter) and compared. The pH values measured with the different instruments differed slightly and varied by about 0.3–0.5 SU. Low ionic-strength pH electrodes are available for some instruments (USGS, 2021a) but were not used in this study. However, the use of low ionic-strength electrodes could potentially improve pH measurements made under similar environmental conditions.
Small differences in pH can make a difference in the aluminum concentration criteria values generated by the EPA Calculator. To evaluate differences in the CMC and CCC aluminum value outputs that could potentially result in association with differences in pH inputs, pH values from the continuous pH dataset corresponding in time to discrete pH measurements were identified and entered into the EPA Calculator, along with the DOC and total hardness concentrations from the discrete samples. The continuous pH measurement values tended to be about 0.2 SU higher than the discrete measurements. Consequently, input of the continuous pH values that corresponded in time to the discrete pH values into the EPA Calculator resulted in increases of monthly CMC and CCC aluminum values. Among all sites, increases to minimum aluminum CMC and CCC values ranged from about 50 to 800 µg/L for CMC and from about 10 to 210 µg/L for CCC; increases to 5th percentile aluminum concentration calculations ranged from about 33 to 695 µg/L for CMC and from about 7 to 175 µg/L for CCC; and increases to the 10th percentile aluminum calculations ranged from about 15 to 600 µg/L for CMC and from about 3 to 154 µg/L for CCC.
Differences in how different discrete and continuous and pH values may have affected the 5th percentile and 10th percentile CMC and CCC calculations for the stations are not reported because the time periods during which continuous and discrete pH data were collected did not allow for good comparisons of percentile calculations. The discrete pH measurements were collected over a 1-year period (April 2018 through May 2019), and the continuous pH measurements were made over a shorter time period (6 to 12 months). The continuous pH measurements for some stations were not collected during during winter and spring months when the receiving-water bodies may have had the lowest pH values.
Assessment of the Effects of Diel Variations in pH on Aluminum Criterion Calculations
The daily cycles of photosynthesis and respiration create variations in carbon dioxide concentration throughout the day and night that generate corresponding diel variations in pH. The lowest pH values typically result in the morning in the hours shortly after sunrise, and highest pH values typically result in the middle of the afternoon. In general, diel variations in pH are smaller in shaded forested streams and rivers and higher in low-gradient and impounded rivers or ponds that have an open canopy with appreciable algae and aquatic vegetation. The daily range in pH values is greater during the growing season (April or May through September or October) than in the nongrowing season (October or November through March or April). Time-series plots of pH values for the stations considered in this study with continuous (15-minute interval) pH data are available in Armstrong and others (2022).
The timing of sample collection can affect the pH values detected during sampling and, consequently, the aluminum CMC and CCC values generated by the EPA Calculator for a given sampling event. Water-quality samples for this study were generally collected at stations associated with two facilities per day. Early morning hours were used to calibrate instruments, rinse sample bottles, load vehicles, and travel to a site. Typically, the first set of water-quality samples was collected in the middle to late morning and the second set of samples was collected in the early afternoon. For the morning samples, the median sample-collection time was 11 a.m. with 90 percent of the samples collected between 10 a.m. and 11:45 a.m. For the afternoon samples, the median sample-collection time was 1 p.m. with 90 percent of the samples collected between 12 p.m. and 3 p.m.
To assess how diel variations in pH could potentially affect aluminum CMC and CCC calculations, the minimum and maximum pH values from the continuous dataset were determined for each day that the water body was sampled. These minimum and maximum pH values were substituted into the EPA Calculator along with the DOC and total hardness concentrations collected during the discrete sampling. The resulting aluminum CMC and CCC values were then compared to the aluminum calculations determined by use of the continuous pH measurement that corresponded in time to the discrete pH sample. During the growing season, when diel variations in pH are largest, application of the minimum and maximum daily pH values to the EPA Calculator was determined to cause differences in monthly CMC values that ranged by several hundred µg/L for most stations. Differences of several thousand µg/L were determined in two instances, where differences between minimum and maximum diel pH values varied by about 1 to to 2 SU. Minimum and maximum pH values of 6.5 to 7.5 SU in Wyman Pond in Fitchburg (station 423132071523401) during August 2018 led to differences in calculated CMC and CCC values of 1,210 and 490 µg/L, respectively; and minimum and maximum pH values of 6.6 to 8.8 SU in Lily Pond in Cohasset (station 421326070485802) during October 2018 led to differences in calculated CMC and CCC values of 3,200 and 2,100 µg/L, respectively. Diel pH variations vary throughout a year, however. For many stations, the lowest CMC and CCC instantaneous aluminum criteria values resulted during the nongrowing season, when diel variations in pH were much smaller, thus minimizing the effect that diel pH variation may have on the minimum and calculated 5th and 10th percentile statistical CMC and CCC aluminum values. For most stations considered in this study, continuous pH data were collected during an 8- to 9-month period from April or May through December. Over this period, diel variations in pH at the 11 stations were determined to correspond to differences in the 10th percentile of CMC values by a median of 160 µg/L, ranging from 0 to 610 µg/L, and differences in the 10th percentile of CCC values by a median of 40 µg/L, ranging from 15 to 210 µg/L. A dataset with at least a full year of record or longer would improve the evaluation and comparison of the potential effect of diel pH variations and sampling time on aluminum CMC and CCC calculations.
Organic Carbon in Massachusetts Streams
The MassDEP was interested in using historical pH, DOC, and total hardness data to calculate aluminum CMC and CCC values for sites in Massachusetts other than those studied for this report. An assessment of the availability of historical pH, DOC, and hardness data indicated that more data were available for TOC than for DOC. Development of a relation between TOC and DOC would allow the MassDEP to use historical water-quality data to evaluate calculated aluminum concentration criteria values for a greater number of sites than available prior to this study in Massachusetts. Historical water-quality data on organic carbon in Massachusetts streams were investigated using data retrieved from the USGS NWIS database. Criteria for the data retrieval and processing steps are described in DeSimone and Armstrong (2022) and are available for download at https://doi.org/10.5066/P9420WXU. Paired values of DOC and TOC were available from 223 samples collected at 52 stations, primarily in eastern Massachusetts (fig. 26). Sample-collection dates ranged from March 1978 through October 2007, although most of the data were collected from the mid-1990s through 2001. Most DOC and TOC values ranged from about 4 to 12 mg/L, with median values of 6.7 mg/L for DOC and 7.9 mg/L for TOC. A linear regression equation was developed for the relation between DOC and TOC (eq. 1). DOC and TOC were well correlated in the 223 samples where both parameters were analyzed (Pearson’s r equal to 0.96), and the equation had a coefficient of determination (R2) equal to 0.93 (fig. 27) (Helsel and others, 2020).The linear regression equation is as follows:
whereDOC
is dissolved organic carbon (in milligrams per liter), and
TOC
is total organic carbon (in milligrams per liter).
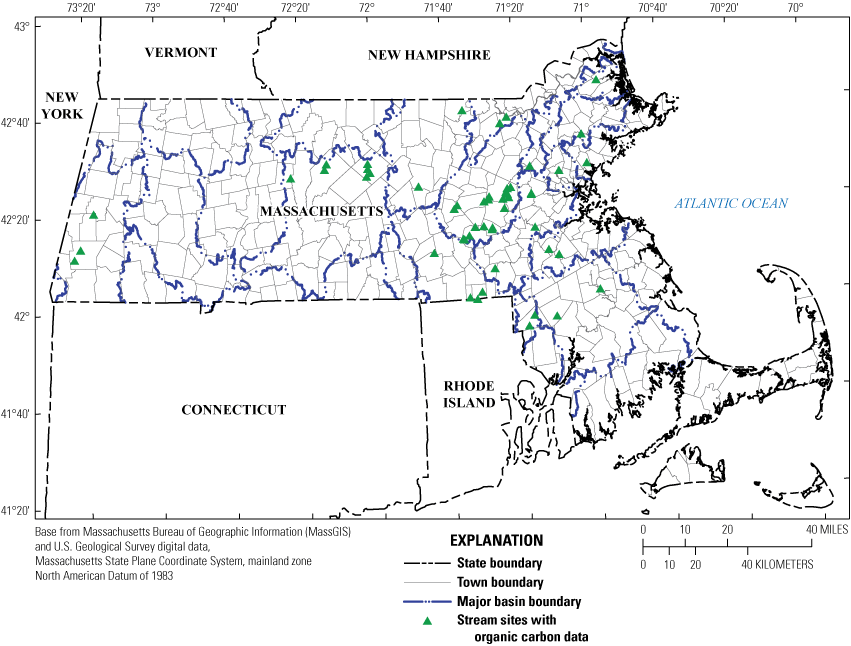
Historical data (1978–2001) showing organic carbon in 223 samples from 52 stream stations in Massachusetts.
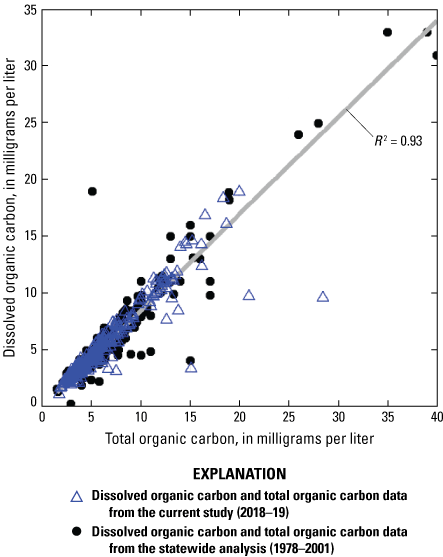
Correlation of dissolved organic carbon and total organic carbon from the current study (2018–19) and statewide analysis (1978–2001) in Massachusetts.
Summary
The U.S. Geological Survey, in cooperation with the Massachusetts Department of Environmental Protection (MassDEP), designed and performed a study to inform the development of the MassDEP guidelines for the collection and use of water-chemistry data to support calculation of site-dependent aluminum concentration criteria values based on updated national recommended ambient water-quality criteria for aluminum in freshwater from the U.S. Environmental Protection Agency (EPA). The selection of appropriate sampling locations, minimum data requirements, data-collection methods, and analytical procedures to reflect spatial and temporal site variability are essential considerations for application of the EPA’s 2018 recommended aquatic life water-quality criteria. The U.S. Geological Survey collected and analyzed discrete water-quality samples at four wastewater-treatment facilities and seven water-treatment facilities in eastern and central Massachusetts from April 2018 through May 2019. At each facility, water-quality samples were collected from the treatment-plant effluent and from ambient stations on the receiving-water bodies. (The term “ambient” refers to open waters [such as rivers, lakes, and streams] as opposed to closed-water systems that distribute treated water or wastewater.) In addition to discrete water-quality samples, monitoring instruments were installed at one station near each facility to measure continuous water quality in the receiving-water body. The monitoring instruments were installed at a station upstream from the effluent discharge (in rivers) and at stations outside the immediate effect of effluent discharges (in ponds). The continuous monitors measured and recorded water temperature and pH at 15-minute intervals. Continuous data were collected from April 2018 through November or December 2018 for all 11 stations, and 3 of the stations were selected for continuous data collection through the winter and spring months from February through May 2019.
The monthly discrete measurements of pH, dissolved organic carbon (DOC), and total hardness data collected in receiving-water bodies were used in the EPA Aluminum Criteria Calculator Version 2.0 (EPA Calculator) to generate site-dependent aluminum concentration criteria values that, if not exceeded, would be expected to protect aquatic organisms from lethal effects (acute criteria) and effects on growth and reproduction (chronic criteria). The stations used for aluminum criterion maximum concentration (CMC) and criterion continuous concentration (CCC) calculations were the ambient stations on the receiving-water body that were upstream from effluent discharges (for stream and river stations) or outside of the immediate effect of effluent discharges (for pond and reservoir stations). Stations used in the EPA Calculator were reviewed and accepted by the MassDEP. To determine CMC and CCC values typically evaluated for use as protective water-quality criteria, the monthly instantaneous CMC and CCC values were used to calculate the minimum, 5th percentile, and 10th percentile aluminum CMC and CCC values for the selected stations.
The monthly instantaneous aluminum CMC and CCC values generated using the EPA Calculator varied among stations. Aluminum CMC and CCC values were highest for four ambient (upstream) stations on the Assabet River associated with wastewater-treatment facilities (Westborough, Marlboro, Hudson, and Maynard). The 10th percentile aluminum CMC and CCC values for these stations ranged from 1,100 to 1,400 micrograms per liter (µg/L) for the CMC and from 410 to 482 µg/L for the CCC. The high aluminum CMC and CCC values for these stations are a result of the near neutral pH, moderate DOC, and total hardness levels measured in larger rivers with wastewater-effluent discharges. Aluminum CMC and CCC values were generally lower for stations associated with water-treatment facilities. The 10th percentile aluminum CMC and CCC values ranged from 751 to 960 µg/L (CMC) and 341 to 425 µg/L (CCC) for selected ambient stations on Maple Meadow Brook, Mill River, Third Herring Brook, and Hocomonco Pond associated with water-treatment facilities in Wilmington, Weymouth, Hanover, and Westborough, respectively. Aluminum CMC and CCC values were lowest for selected ambient stations on Lily Pond, Monoosnoc Brook, and Wyman Pond associated with water-treatment facilities in Cohasset, Leominster, and Fitchburg, respectively. The 10th percentile aluminum CMC and CCC values for these stations ranged from 21 to 102 µg/L for the CMC and from 13 to 66 µg/L for the CCC. These relatively low aluminum CMC and CCC values are a function of local water-chemistry parameters (pH, DOC, and total hardness) in these water bodies. The Lily Pond stations had low pH values (5.5 to 6.5 standard units [SU]) and low total hardness concentrations (15 to 30 milligrams per liter as CaCO3). The Monoosnoc Brook stations had low pH values, and the Wyman Pond stations had low pH values (5.5 to 6.5 SU), low DOC concentrations (less than 10 milligrams per liter), and low total hardness concentrations (less than 20 milligrams per liter).
Aluminum CMC and CCC values generated by the EPA Calculator are sensitive to variations in the input parameters (pH, DOC, and total hardness). Aluminum solubility is particularly affected by pH. The continuous pH data were used to evaluate how pH variability could affect aluminum values calculated from the EPA Calculator for each of the 11 water- treatment facilities. Comparisons of discrete pH measurements, collected as field parameters during collection of discrete water-quality samples, to concurrent pH measurements, measured continuously (15-minute intervals), indicated that the continuous pH values were higher than the discrete pH values by an average of 0.2 SU with a range of about plus or minus 1 SU. When applied to the EPA Calculator, these pH differences increased minimum aluminum CMC and CCC values. Differences between discrete and continuous pH measurements were attributed to seven field- and instrument-related factors. These factors are as follows: differences in pH across stream cross sections and with depth; differing pH values among stream reach locations; inaccuracies resulting from measurement in low ionic-strength water using electrodes designed for general use; challenges in measurement of pH in fast moving, aerated water; use of different instruments to measure pH; measurement of pH in cold temperatures; and possibly, errors from temperature differences between calibration buffers and field measurements. A review of the discrete and continuous pH data did not definitively determine the reasons for specific differences or identify any specific discrete measurements as invalid.
The continuous pH data were used to evaluate the effect of diel variations in pH on aluminum CMC and CCC calculations. Diel variations in pH are caused by the effects of photosynthesis and respiration on carbon-dioxide concentrations in surface water. The greatest diel range in pH was measured in rivers and ponds with open canopies and large amounts of algae and aquatic vegetation. Diel pH variations primarily result during the growing season (April or May through September or October) and can correspond to differences in monthly acute and chronic aluminum value calculations by several hundred micrograms per liter. Diel variations in pH at the 11 stations were determined to correspond to differences in the 10th percentile of CMC values by a median of 160 µg/L, ranging from 0 to 610 µg/L, and differences in the 10th percentile of CCC values by a median of 40 µg/L, ranging from 15 to 210 µg/L. The pH, DOC and total hardness values that together lead to the lowest monthly instantaneous CMC and CCC values tend to result during the nongrowing season (October or November through March or April), thus minimizing the effect of diel variations in pH on the lowest CMC and CCC values.
The CMC and CCC aluminum value calculations generated using water-chemistry parameters at selected stations are included in this report to demonstrate potential applications of the EPA’s updated ambient water-quality criteria guidance for aluminum in freshwater. These are not regulatory effluent limits for specific facilities. The formal adoption and use of any site-dependent aluminum concentration calculations to restore and maintain the chemical, physical, and biological integrity of surface waters under the Clean Water Act are subject to additional Federal and State regulatory frameworks.
Development of a relation between total organic carbon (TOC) and DOC would allow the MassDEP to use historical water-quality data to evaluate calculated aluminum concentration criteria values for a greater number of sites than available prior to this study in Massachusetts. Historical water-quality data on organic carbon in Massachusetts streams were investigated using data retrieved from the U.S. Geological Survey National Water Information System database. A linear regression equation was developed for the relation between DOC and TOC concentrations. DOC and TOC concentrations were well correlated in the 223 samples in which both constituents were analyzed, and the equation had a coefficient of determination (R2) equal to 0.93.
References Cited
Agency for Toxic Substances and Disease Registry, 2008, Toxicological profile for aluminum: Agency for Toxic Substances and Disease Registry web page, accessed January 2, 2020, at https://www.atsdr.cdc.gov/toxprofiles/tp.asp?id=191&tid=34.
Andersen, M.R., Krach, T., and Sand-Jensen, K., 2017, Extreme diel dissolved oxygen and carbon cycles in shallow vegetated lakes: Proceedings of the Royal Society B, v. 284, no., 1862, [article 20171427]. [Also available at https://doi.org/10.1098/rspb.2017.1427.]
Armstrong, D.S., DeSimone, L.A., and Savoie, J.G., 2022, Surface-water-quality data and time-series plots to support implementation of site-dependent aluminum criteria in Massachusetts, 2018–19 (ver. 1.1, February 2023): U.S. Geological Survey data release, https://doi.org/10.5066/P95WCT5T.
Besser, J., Cleveland, D., Ivey, C., and Blake, L., 2019, Toxicity of aluminum to Ceriodaphnia dubia in low-hardness waters as affected by natural dissolved organic matter: Environmental Toxicology and Chemistry, v. 38, no. 10, p. 2121–2127. [Also available at https://doi.org/10.1002/etc.4523.]
Blum, A.G., Archfield, S.A., Hirsch, R.M., Vogel, R.M., Kiang, J.E., and Dudley, R.W., 2019, Updating estimates of low-streamflow statistics to account for possible trends: Hydrological Sciences Journal, v. 64, no. 12, p. 1404–1414. [Also available at https://doi.org/10.1080/02626667.2019.1655148.]
Brumbaugh, W.G., and Kane, D.A., 1985, Variability of aluminum concentrations in organs and whole bodies of smallmouth bass (Micropterus dolomieui): Environmental Science & Technology, v. 19, no. 9, p. 828–831. [Also available at https://doi.org/10.1021/es00139a010.]
Busenberg, E., and Plummer, L.N., 1987, pH measurement of low-conductivity waters: U.S. Geological Survey Water-Resources Investigations Report 87–4060, 22 p. [Also available at https://doi.org/10.3133/wri874060.]
Carey, R.O., and Migliaccio, K.W., 2009, Contribution of wastewater treatment plant effluents to nutrient dynamics in aquatic systems—A review: Environmental Management, v. 44, no. 2, p. 205–217. [Also available at https://doi.org/10.1007/s00267-009-9309-5.]
Cohasset Water Department, 2021, Where your drinking water comes from: Cohasset, Massachusetts, web page, accessed January 29, 2021, at https://www.cohassetma.org/DocumentCenter/View/215/Drinking-Water-and-Watershed-Map-PDF.
Colman, J.A., Massey, A.J., and Levin, S.B., 2016, Determination of dilution factors for discharge of aluminum-containing wastes by public water-supply treatment facilities into lakes and reservoirs in Massachusetts (ver. 1.1, December 2016): U.S. Geological Survey Scientific Investigations Report 2011–5136, 36 p. [Also available at https://doi.org/10.3133/sir20115136.]
DeCicco, L., 2020, dataRetrieval (v. 2.5.3): RDocumentation web page, accessed April 3, 2020, at https://rdocumentation.org/packages/dataRetrieval/versions/2.1.4.
DeForest, D.K., Brix, K.V., Tear, L.M., and Adams, W.J., 2018, Multiple linear regression models for predicting chronic aluminum toxicity to freshwater aquatic organisms and developing water quality guidelines: Environmental Toxicology and Chemistry, v. 37, no. 1, p. 80–90. [Also available at https://doi.org/10.1002/etc.3922.]
DeSimone, L.A., 2009, Quality of water from domestic wells in principal aquifers of the United States, 1991–2004: U.S. Geological Survey Scientific Investigations Report 2008–5227, 139 p. [Also available at https://doi.org/10.3133/sir20085227.]
DeSimone, L.A., and Armstrong, D.S., 2022, Total and dissolved organic carbon data for an assessment of aluminum in Massachusetts surface waters: U.S. Geological Survey data release, https://doi.org/10.5066/P9420WXU.
ENSR International, 2003, Lily Pond limnology and water’s edge study: Westford, Mass., ENSR International, prepared for town of Cohasset Board of Water Commissioners, variously paginated, accessed March 25, 2020, at https://archives.lib.state.ma.us/handle/2452/101830.
Exley, C., Chappell, J.S., and Birchall, J.D., 1991, A mechanism for acute aluminum toxicity in fish: Journal of Theoretical Biology, v. 151, no. 3, p. 417–428. [Also available at https://doi.org/10.1016/S0022-5193(05)80389-3.]
Fishman, M.J., ed., 1993, v. 93–125. Methods of analysis by the U.S. Geological Survey National Water Quality Laboratory—Determination of inorganic and organic constituents in water and fluvial sediments, U.S. Geological Survey Open-File Report, 217 p. [Also available at https://doi.org/10.3133/ofr93125.]
Freda, J., and McDonald, D.G., 1990, Effects of aluminum on the leopard frog, Rana pipiens—Life stage comparisons and aluminum uptake: Canadian Journal of Fisheries and Aquatic Sciences, v. 47, no. 1, p. 210–216. [Also available at https://doi.org/10.1139/f90-023.]
Gammons, C.H., Nimick, D.A., and Parker, S.R., 2015, Diel cycling of trace elements in streams draining mineralized areas—A review: Applied Geochemistry, v. 57, p. 35–44. [Also available at https://doi.org/10.1016/j.apgeochem.2014.05.008.]
Garbarino, J.R., Kanagy, L.K., and Cree, M.E., 2006, Determination of elements in natural-water, biota, sediment, and soil samples using collision/reaction cell inductively coupled plasma–mass spectrometry: U.S. Geological Survey Techniques and Methods, book 5, sec. B, chap. 1, 88 p. [Also available at https://pubs.usgs.gov/tm/2006/tm5b1/PDF/TM5-B1.pdf.]
Garbarino, J.R., and Struzeski, T.M., 1998, Methods of analysis by the U.S. Geological Survey National Water Quality Laboratory—Determination of elements in whole-water digests using inductively coupled plasma-optical emission spectrometry and inductively coupled plasma-mass spectrometry: U.S. Geological Survey Open-File Report 98–165, 101 p. [Also available at https://doi.org/10.3133/ofr98165.]
Gensemer, R.W., Gondek, J.C., Rodriquez, P.H., Arbildua, J.J., Stubblefield, W.A., Cardwell, A.S., Santore, R.C., Ryan, A.C., Adams, W.J., and Nordheim, E., 2018, Evaluating the effects of pH, hardness, and dissolved organic carbon on the toxicity of aluminum to freshwater aquatic organisms under circumneutral conditions: Environmental Toxicology and Chemistry, v. 37, no. 1, p. 49–60. [Also available at https://doi.org/10.1002/etc.3920.]
Gensemer, R.W., and Playle, R.C., 1999, The bioavailability and toxicity of aluminum in aquatic environments: Critical Reviews in Environmental Science and Technology, v. 29, no. 4, p. 315–450. [Also available at https://doi.org/10.1080/10643389991259245.]
Gibs, J., Wilde, F.D., and Heckathorn, H.A., 2007, Use of multiparameter instruments for routine field measurements (ver. 1.1): U.S. Geological Survey Techniques of Water-Resources Investigations, book 9, chap. A6, section 6.8, accessed March 1, 2021, at https://pubs.water.usgs.gov/twri9A/.
Goenaga, X., and Williams, D.J.A., 1988, Aluminum speciation in surface waters from a Welsh upland area: Environmental Pollution, v. 52, no. 2, p. 131–149. [Also available at https://doi.org/10.1016/0269-7491(88)90086-3.]
Hansen, B.P., 1993, Results of geophysical surveys at Hocomonco Pond, Westborough, Massachusetts: U.S. Geological Survey Open-File Report 92–646, 19 p. [Also available at https://doi.org/10.3133/ofr92646.]
Helsel, D.R., Hirsch, R.M., Ryberg, K.R., Archfield, S.A., and Gilroy, E.J., 2020, Statistical methods in water resources: U.S. Geological Survey Techniques and Methods, book 4, chap. A3, 458 p. [Supersedes USGS Techniques of Water-Resources Investigations, book 4, chap. A3, version 1.1.] [Also available at https://doi.org/10.3133/tm4a3.]
Hem, J.D., 1985, Study and interpretation of the chemical characteristics of natural water: U.S. Geological Survey Water Supply Paper 2254, 263 p. [Also available at https://doi.org/10.3133/wsp2254.]
iWeatherNet, 2021, Rainfall totals for the last 24 hours to 3 days—High resolution map: iWeatherNet web page, accessed January 29, 2021, at https://www.iweathernet.com/total-rainfall-map-24-hours-to-72-hours.
Levin, S.B., Archfield, S.A., and Massey, A.J., 2011, Refinement and evaluation of the Massachusetts firm-yield estimator model version 2.0: U.S. Geological Survey Scientific Investigations Report 2011–5125, 49 p., plus CD–ROM. [Also available at https://doi.org/10.3133/sir20115125.]
Liu, W., Xu, X., McGroff, N.M., Eatn, J.M., Leahy, P., Foly, N., and Kiely, G., 2014, Spatial and seasonal variation of dissolved organic carbon (DOC) concentrations in Irish streams—Importance of soil and topographic characteristics: Environmental Management, v. 3, p. 959–967. [Also available at https://doi.org/10.1007/s00267-014-0259-1.]
Massachusetts Bureau of Geographic Information [MassGIS], 2003, MassGIS data—Major drainage basins: MassGIS web page, accessed January 13, 2021, at https://www.mass.gov/info-details/massgis-data-major-drainage-basins.
Mueller, D.K., Schertz, T.L., Martin, J.D., and Sandstrom, M.W., 2015, Design, analysis, and interpretation of field quality-control data for water-sampling projects: U.S. Geological Survey Techniques and Methods, book 4, chap. C4, 54 p. [Also available at https://doi.org/10.3133/tm4C4.]
Neal, C., and Thomas, A.G., 1985, Field and laboratory measurement of pH in low-conductivity natural waters: Journal of Hydrology, v. 79, no. 3–4, p. 319–322. [Also available at https://doi.org/10.1016/0022-1694(85)90062-9.]
Nimick, D.A., Gammons, C.H., and Parker, S.R., 2011, Diel biogeochemical processes and their effect on the aqueous chemistry of streams—A review: Chemical Geology, v. 283, no. 1–2, p. 3–17. [Also available at https://doi.org/10.1016/j.chemgeo.2010.08.017.]
O’Brien, K., Weinstein, M., and McVoy, R., 2002, Weymouth and weir subwatershed-river and estuary segment assessments, section IIIc of Boston Harbor Watershed 1999 Water Quality Assessment Report: Massachusetts Department of Environmental Protection Report Number 70–AC–1, DWM Control Number 49.0, accessed March 12, 2020, at https://www.mass.gov/files/documents/2016/08/qn/70wqar3c.pdf.
Parker, L., and Craddock, M., 2012, Low flow inventory: Commonwealth of Massachusetts Riverways Program, 58 p., accessed January 27, 2022, at https://archives.lib.state.ma.us/handle/2452/617351.
Pellerin, B.A., Bergamaschi, B.A., Downing, B.D., Saraceno, J.F., Garrett, J.A., and Olsen, L.D., 2013, Optical techniques for the determination of nitrate in environmental waters—Guidelines for instrument selection, operation, deployment, maintenance, quality assurance, and data reporting: U.S. Geological Survey Techniques and Methods 1–D5, 37 p. [Also available at https://doi.org/10.3133/tm1D5.]
R Core Team, 2020, R—A language and environment for statistical computing: Vienna, Austria, R Foundation for Statistical Computing, accessed January 22, 2020, at https://www.R-project.org/.
Ritz, G.F., and Collins, J.A., 2008, pH (ver. 2.0, October 2008): U.S. Geological Survey Techniques of Water-Resources Investigations, book 9, chap. A6.4, 29 p. [Also available at https://doi.org/10.3133/twri09A6.4.]
Rosseland, B.O., Eldhurst, T.D., and Staurnes, M., 1990, Environmental effects of aluminum: Environmental Geochemistry and Health, v. 12, no. 1–2, p. 17–27. [Also available at https://doi.org/10.1007/BF01734045.]
Saiers, J.E., Fair, J.H., Shanley, J.B., Hosen, J., Matt, S., Ryan, K.A., and Raymond, P.A., 2021, Evaluating streamwater dissolved organic carbon dynamics in context of variable flowpath contributions with a tracer based mixing model: Water Resources Research, v. 57, 23 p. [Also available at https://doi.org/10.1029/2021WR030529.]
Thurman, E.M., 1985, Organic geochemistry of natural waters: Dordrecht, Netherlands, Martinus Nijhoff/Dr. W. Junk Publishers, 497 p. [Also available at https://doi.org/10.1007/978-94-009-5095-5.]
U.S. Department of Agriculture, 2013, Supplemental watershed plan no. 10 & environmental evaluation for rehabilitation of the Tyler Floodwater Retarding Dam—SuAsCo watershed—Middlesex County, Massachusetts: U.S. Department of Agriculture, Natural Resource Conservation Service, 70 p., apps, accessed March 12, 2020, at https://www.nrcs.usda.gov/wps/PA_NRCSConsumption/download?cid=nrcseprd415238&ext=pdf.
U.S. Environmental Protection Agency, [EPA], 1988, Ambient water quality criteria for aluminum: U.S. Environmental Protection Agency document EPA 440/5–86–008, 47 p, accessed March 12, 2020, at https://www.epa.gov/sites/production/files/2019-02/documents/ambient-wqc-aluminum-1988.pdf.
U.S. Environmental Protection Agency, [EPA], 2018, Final aquatic life ambient water quality criteria for aluminum—2018: U.S. Environmental Protection Agency, document EPA–822–R–18–001, 161 p., apps., accessed March 12, 2020, at https://www.epa.gov/sites/production/files/2018-12/documents/aluminum-final-national-recommended-awqc.pdf.
U.S. Environmental Protection Agency, [EPA], 2020, Supplemental module—Human health ambient water quality criteria: U.S. Environmental Protection Agency web page, accessed September 25, 2020, at https://www.epa.gov/wqs-tech/supplemental-module-human-health-ambient-water-quality-criteria.
U.S. Geological Survey, [USGS], 2014, Safety and health for field operations: U.S. Geological Survey Manual, handbook 445–3–H, 336 p., accessed February 8, 2021, at https://www2.usgs.gov/usgs-manual/handbook/hb/445-3-h.pdf.
U.S. Geological Survey, [USGS], 2016, The StreamStats program for Massachusetts: U.S. Geological Survey web application, accessed January 22, 2020, at https://water.usgs.gov/osw/streamstats/massachusetts.html.
U.S. Geological Survey [USGS], 2018, General introduction for the “National Field Manual for the Collection of Water-Quality Data” (ver. 1.1, June 2018): U.S. Geological Survey Techniques and Methods, book 9, chap. A0, accessed December 30, 2019, at https://doi.org/10.3133/tm9A0.
U.S. Geological Survey, [USGS], 2019, Specific conductance: U.S. Geological Survey Techniques and Methods, book 9, chap. A6.3, 15 p. [Also available at https://doi.org/10.3133/tm9A6.3.] [Supersedes USGS Techniques of Water-Resources Investigations, book 9, chap. A6.3, version 1.2.]
U.S. Geological Survey, [USGS], 2020, USGS water-quality data for the Nation: U.S. Geological Survey National Water Information System database, accessed February 10, 2020, at https://waterdata.usgs.gov/nwis/.
U.S. Geological Survey, [USGS], 2021a, Measurement of pH: U.S. Geological Survey Techniques and Methods, book 9, chap. A6.4, 21 p. [Also available at https://doi.org/10.3133/tm9A6.4.] [Supersedes USGS Techniques of Water-Resources Investigations, book 9, chap. A6.4, version 2.0.]
U.S. Geological Survey, [USGS], 2021b, U.S. Geological Survey—Inorganic Blind Sample Project (IBSP): U.S. Geological Survey web page, accessed January 29, 2021, at https://bqs.usgs.gov/ibsp/.
U.S. Geological Survey, [USGS], variously dated, National field manual for the collection of water-quality data: U.S. Geological Survey Techniques of Water-Resources Investigations, book 9, chaps. A1–A9, accessed January 2021 at https://water.usgs.gov/owq/FieldManual/.
Wagner, R.J., Boulger, R.W., Jr., Oblinger, C.J., and Smith, B.A., 2006, Guidelines and standard procedures for continuous water-quality monitors—Station operation, record computation, and data reporting: U.S. Geological Survey Techniques and Methods 1–D3, 51 p., accessed August 1, 2020, at https://pubs.usgs.gov/tm/2006/tm1D3/pdf/TM1D3.pdf.
Wandle, S.W., Jr., 1984, Gazetteer of hydrologic characteristics of streams in Massachusetts; coastal river basins of the North Shore and Massachusetts: U.S. Geological Survey Water-Resources Investigations Report 84–4281, 60 p. [Also available at https://doi.org/10.3133/wri844281.]
Wilde, F.D., Radtke, D.B., Gibs, J., and Iwatsubo, R.T., 1999, Collection of water samples [revised 2006]: U.S. Geological Survey Techniques of Water-Resources Investigations, book 9, chap. A4, 164 p. [Also available at https://pubs.usgs.gov/twri/twri9a4/twri9a4_Chap4_v2.pdf].
Appendix 1. Site Descriptions and Sample-Collection Methods for Stations near 11 Water-Treatment Facilities in Eastern and Central Massachusetts
Table 1.1.
Site characteristics for 38 water-quality monitoring stations near 11 water-treatment facilities in eastern and central Massachusetts.[Drainage area at Cohasset is for Lily Pond and Aaron River Reservoir. Pond sample depth is depth below water surface. When different sampling methods were used at station on different dates, the method used most frequently is listed first. mi2, square mile; ft, foot; —, not applicable; WTP, water-treatment plant; Mass., Massachusetts; S, sand; pump, peristaltic pump; G, gravel; C, cobble; grab, grab sample; DS, downstream; EWI, equal-width increment, US, upstream; B, boulder; Rd, Road]
Wastewater-Treatment Facilities
This section includes site descriptions and sample-collection methods for stations associated with the Westborough, Marlborough, Hudson, and Maynard WWTFs. The ambient stations for these facilities are all on the Assabet River, from upstream to downstream, in Westborough, Marlborough, Hudson, and Maynard, respectively.
Westborough Wastewater-Treatment Facility
The following three monitoring stations are associated with the Westborough WWTF; a station upstream from the effluent discharge, Assabet River near Westborough, Massachusetts (station 01096603); an effluent station, Westborough wastewater-treatment plant effluent (station 421651071381401); and a station downstream from the effluent discharge, Assabet River downstream from Westborough water-treatment plant at Route 9 (station 421700071381901) (fig. 3).
Assabet River near Westborough, Mass. (Station 01096603)
The reach of the Assabet River where the Westborough WWTF effluent is discharged has a low gradient. During low-flow periods, the effluent discharge can be greater than streamflow entering from upstream and, therefore, an upstream location where streamflow was not mixed with effluent needed to be identified. Consequently, the upstream station was established at a sewer-line crossing about 570 feet (ft) upstream from the effluent discharge. This location was downstream from an unnamed tributary that is the outflow from Hocomonco Pond. The station was established at this location to ensure that any effluent from the Westborough WTF, which is discharged into Hocomonco Pond, would be included in the water samples at the upstream station and not be attributed to effluent discharges from the Westborough WWTF.
The sewer-line crossing creates a shallow reach with enough water velocity to assure collection of a representative water-quality sample. Water-quality samples were collected while wading, using equal-width increment (EWI) isokinetic, depth-integrated sampling techniques (U.S. Geological Survey, 2018). Water levels and water quality at this station are at times affected by releases from the George H Nichols Reservoir at the headwaters of the Assabet River, and also from water released from Hocomonco Pond created when beaver dam blockages of the culvert at the outlet of Hocomonco Pond are periodically removed.
The continuous water-quality monitor was installed along the right bank of the Assabet River in a shallow reach just upstream of the sewer-line crossing. The datalogger shelter was mounted on a pipe driven into the right bank, and the water-quality sonde was housed in a pipe extending out into the channel.
Westborough Wastewater-Treatment Plant Effluent (Station 421651071381401)
The effluent from the Westborough WWTF discharges from twin culverts into a ditch before joining with the Assabet River. The effluent discharges are relatively constant, and the ditch is wadable in the reach below the outfall. Water samples were collected with a sweep of a 2-liter (L) bottle across the ditch just downstream from the outfall culverts.
Assabet River Downstream from Westborough Water-Treatment Plant at Route 9 (Station 421700071381901)
Station 421700071381901, Assabet River downstream from Westborough water-treatment plant at Route 9, is about 825 ft downstream from the effluent discharge and about 30 ft upstream from State Route 9. The station was selected to be upstream from Route 9 to avoid any stormwater runoff from the highway and to be upstream from a tributary that enters the Assabet River downstream from Route 9. A constriction created by the Route 9 bridge increases the velocity in this reach, and the channel is wadable at most discharges. This station was consistently sampled at the same location using EWI isokinetic, depth-integrated sampling techniques (U.S. Geological Survey, 2018). Water-quality measurements made at the station during the study indicated that the river was not well mixed at this location and greatly affected by effluent during low flows.
Marlborough Wastewater-Treatment Facility
The following three monitoring stations are associated with the Marlborough WWTF (fig. 4): a station upstream from the effluent discharge, Assabet River at Boundary Street near Northborough, Mass. (station 01096720); an effluent station, Marlborough wastewater-treatment plant effluent (station 422034071365601); and a station downstream from the effluent discharge, Assabet River, downstream from Marlborough wastewater-treatment plant (station 01096725) (fig. 4).
Assabet River at Boundary Street near Northborough, Mass. (Station 01096720)
Station 01096729, Assabet River at Boundary Street near Northborough, Mass., is about 20 ft downstream from the Boundary Street Bridge, and about 480 ft upstream from the effluent discharge. Samples at this station were collected using EWI isokinetic, depth-integrated sampling techniques (U.S. Geological Survey, 2018) while wading or from the bridge during high flows.
The continuous water-quality monitor was installed along the right bank of the Assabet River about 30 ft downstream from Boundary Street. The datalogger shelter was mounted to a tree, and the water-quality sonde was housed in a pipe extending out into the channel.
Marlborough Wastewater-Treatment Plant Effluent (Station 422034071365601)
Effluent from the Marlborough WWTF (fig. 4) is piped northwest to the Assabet River. The effluent could not be sampled at the outflow into the Assabet River because the effluent discharge pipe is partially submerged beneath the water surface of the Assabet River, preventing collection of samples that are entirely effluent discharge. Consequently, the effluent was accessed for sampling through a grate in the floor of a WWTF building at the same location where the Marlborough WWTF collects samples with a Teledyne ISCO sampler. Effluent samples were pumped directly into a 2-L plastic bottle using a peristaltic pump.
Assabet River Downstream from Marlborough Wastewater-Treatment Plant (Station 01096725)
Station 01096725, Assabet River, downstream from Marlborough wastewater-treatment plant (fig. 4), is about 960 ft downstream from the effluent discharge and about 180 ft upstream from the intake structure for the Tyler floodwater-retarding dam. The station was established as far downstream from the effluent discharge as possible to allow for mixing, but still upstream from Milham Brook (the outlet from Milham Reservoir), which discharges from the right bank into the pool upstream of the intake structure. Two small tributaries enter the Assabet River from the left bank about 450 and 210 ft upstream from the monitoring station, and another small tributary enters the Assabet River from the right bank about 265 ft upstream from the monitoring station. The upstream left bank tributary drains Solomon Pond, and the downstream left bank tributary drains wetlands on the north side of the Assabet River. The right bank tributary drains a beaver pond and riparian wetlands between the Assabet River and Milham Reservoir. A meander just upstream from the station helps to mix the Assabet River with the Marlborough WWTF effluent and streamflow from the tributaries. Water samples were collected using EWI isokinetic, depth-integrated sampling techniques (U.S. Geological Survey, 2018) when the channel could be waded. During high flows, samples were collected from a canoe by pumping with a peristaltic pump at about 1.5 ft depth while ferrying the canoe back and forth across the channel.
Hudson Wastewater-Treatment Facility
The following three monitoring stations are associated with this facility: a station upstream from the effluent discharge, Assabet River at Cox Street near Hudson, Mass. (station 01096870); an effluent station, Hudson wastewater-treatment plant effluent (station 422406071323401); and a station downstream from the effluent discharge, Assabet River near Hudson-Stow town line (station 01096875) (figs. 5 and 16).
Assabet River at Cox Street near Hudson, Mass. (Station 01096870)
Station 01096870, Assabet River at Cox Street near Hudson, Mass., is about 1,200 ft upstream from the Hudson WWTF effluent discharge and just downstream from the Cox Street bridge (fig. 5). The channel downstream of the bridge is only wadable at very low flows. Multiple methods were used to collect samples at this station. EWI isokinetic, depth-integrated sampling techniques (U.S. Geological Survey, 2018) were used when samples were collected while wading or from the bridge. Water-quality samples during high flow also were collected from a canoe by pumping with a peristaltic pump from about 1.5 ft deep while ferrying the boat back and forth across the channel. Access to the station was from an informal canoe launch on the right bank downstream from Cox Street.
The continuous water-quality monitor was installed along the left bank of the Assabet River, about 30 ft downstream from Cox Street. The datalogger shelter was mounted to a pipe driven into the bank, and the water-quality sonde was housed in a pipe extending out into the channel and fastened to a downed tree.
Hudson Wastewater-Treatment Plant Effluent (Station 422406071323401)
The effluent from the Hudson WWTF is piped northwest to the Assabet River. The effluent could not be sampled at the culvert outflow because the effluent discharge pipe is partially submerged beneath the water surface of the Assabet River, preventing collection of samples that are entirely effluent. Consequently, the effluent was accessed for sampling (station 422406071323401) from a concrete tank just before the effluent enters the effluent discharge pipe at the same location where the Hudson WWTF collects samples with a Teledyne ISCO sampler. Effluent samples were pumped directly into a 2-L plastic bottle using a peristaltic pump.
Assabet River near Hudson-Stow Town Line (Station 01096875)
Station 01096875, Assabet River near Hudson-Stow town line, is about 1,200 ft downstream from the Hudson WWTF effluent discharge (fig. 5). The wastewater effluent discharges to the Assabet River behind a midchannel bar and travels downstream about 300 ft before beginning to mix with the river in the main channel. To assure the effluent would be well mixed at the downstream station, the station was established downstream from some meanders that help to mix the effluent with the river flow. Access to this station was only available by canoe. The land adjacent to the station on the north (left) side of the channel is a former 28-acre landfill (closed in 1997) with a solar farm that was under construction during the project. The station is near the upper end of the backwater behind the Gleasondale dam (about 1.3 miles [mi] downstream) but maintains sufficient velocity to collect a representative sample. Water samples were collected primarily from a canoe by pumping with a peristaltic pump at about 1.5-ft depth while ferrying the boat back and forth across the channel. During low-flow conditions when the channel could be waded, samples were collected using EWI isokinetic, depth-integrated sampling techniques (U.S. Geological Survey, 2018).
Maynard Wastewater-Treatment Facility
The following three monitoring stations are associated with the Maynard WWTF: a station upstream from the effluent discharge, Assabet River, upstream from Maynard wastewater-treatment plant (station 01097021); an effluent station, Maynard wastewater-treatment plant effluent (station 422627071262301); and a station downstream from the effluent discharge, Assabet River, downstream from Maynard wastewater-treatment plant (station 01097023).
Assabet River, Upstream from Maynard Wastewater-Treatment Plant (Station 01097021)
Station 01097021, Assabet River upstream from Maynard Wastewater-Treatment station, is near a sewer-line crossing of the Assabet River; about 1,500 ft upstream from the Maynard effluent discharge and adjacent to the sewer-line pump station behind the Middlesex Savings Bank. Access to the station for collection of discrete samples was by canoe, launched either from the Maynard Housing Authority or from the dam at the end of High Street. The river at this location is at the upstream end of the backwater behind the Powdermill impoundment (fig. 6). The channel was never shallow enough to wade (less than 4–5 ft deep) but maintains a sufficient velocity for collection of representative samples. Water samples were collected from a canoe by pumping with a peristaltic pump at about 1.5-ft depth while ferrying the boat back and forth across the channel.
The continuous water-quality monitor was installed along the right bank of the Assabet River. Access to the monitor was across a floodplain behind the parking area adjacent to the sewer pump station. The datalogger shelter was mounted to a tree, and the water-quality sonde was housed in a pipe extending out into the channel.
Maynard Wastewater-Treatment Plant Effluent (Station 422627071262301)
The effluent discharge from the Maynard WWTF is piped downslope to the Assabet River Powdermill impoundment. The effluent was not sampled at the outfall because a stormwater pipe draining the facility grounds joins the effluent discharge pipe prior to the outfall. The effluent discharge was sampled (station 422627071262301) at the point where the Maynard WWTF collects water samples with an automated Teledyne ISCO sampler. The effluent discharge at this point has cascaded through a concrete chamber with a series of drops to aerate the effluent and is deep below the land surface (more than 20 ft). Effluent samples were collected by pumping with the Maynard Teledyne ISCO sampler. Before sampling, the pump was operated until water-quality field parameters stabilized. Effluent samples were collected by pumping into a 2-L plastic bottle. Field parameters were measured in a flow-through cell by submerging the sonde while pumping the effluent through the cell.
Assabet River, Downstream from Maynard Wastewater-Treatment Plant (Station 01097023)
Station 01097023, Assabet River downstream from Maynard wastewater-treatment plant, is about 600 ft downstream from the Maynard effluent discharge and about 1,300 ft upstream from the Powdermill Dam in Acton (fig. 6). The Acton WWTF is also on the left bank side of the Assabet River, about 1,000 ft downstream of the Maynard WWTF. The Acton WWTF discharges wastewater into six rapid infiltration beds on the hillside. The flow path that the infiltrated wastewater takes to discharge to the Assabet River is unknown. To minimize the possibility of collecting water samples that would contain effluent originating from the Acton WWTF, the downstream monitoring station for Maynard was established about 120 ft upstream from a small tributary that enters the Assabet River upstream of the Acton rapid infiltration beds. Water samples were collected from a canoe along a cross section across the reservoir by pumping with a peristaltic pump at about 1.5-ft depth while ferrying the boat back and forth across the impoundment. The Powdermill impoundment is about 300 ft wide at the sampling cross section. The large reservoir size provides water volume for dilution of wastewater effluent. However, the short distance (600 ft) between the Maynard WWTF and the downstream monitoring station (fig. 6), the location of the discharge on an outside bend of the river, and the slow-moving water in the reservoir may not provide hydrologic conditions that allow the effluent to fully mix with the entire reservoir cross section. Specific-conductance measurements collected monthly along the cross section were often slightly higher along the left side of the impoundment. Nevertheless, the downstream monitoring station provided the best location to sample the Assabet River downstream from the Maynard WWTF effluent discharge and upstream from the potential discharge of wastewater from the Acton WWTF rapid infiltration beds.
Water-Treatment Facilities with Pond Receiving-Water Bodies
This section includes site descriptions and sample-collection methods for the stations associated with the Cohasset, Fitchburg, and Westborough WTFs. The ambient stations for these facilities are located on ponds or reservoirs, including Lily Pond (Cohasset), Wyman Pond (Fitchburg), and Hocomonco Pond (Westborough).
Cohasset Water-Treatment Facility
The following three monitoring stations are associated with the Cohasset WTF: two stations at a deep hole in the pond, Lily Pond deep hole (shallow) (station 421326070485802) and Lily Pond deep hole (station 421326070485801); and an effluent station, Cohasset water-treatment plant backwash effluent (station 421334070490601).
Lily Pond Deep Hole (Shallow) (Station 421326070485802) and Lily Pond Deep Hole (Station 421326070485801)
The shallow (421326070485802) and deep (2132607085801) stations on Lily Pond (fig. 7) were established in an area thought to represent the best available location outside the area of effect of effluent discharge. These station locations met the study selection criteria of being in a deep area of the pond and in an area that would not be covered with aquatic vegetation during summer. The monitoring stations were established about 1,400 ft from the WTF, at a location in line with the outflow of Lily Pond (Herring Brook). Herring Brook has been channelized and also serves to import water to Lily Pond from the Aaron River Reservoir. The shallow and deep stations also are referred to as pond stations 1 and 2, respectively. The effluent from the Cohasset WTF discharges into Lily Pond about 1,050 ft from the shallow and deep pond stations. Samples were collected at shallow (1.5 ft) and deep (3–6 ft) depths in the pond from a canoe with a peristaltic pump by pumping into a 2-L plastic bottle.
During winter, when ice was too thick to reach the stations by canoe but unsafe to walk on, water samples were collected 10 to 20 ft from shore at a location directly west of the shallow and deep stations. These samples were collected near shore in shallow water (about 4 ft deep) overlying organic pond bottom deposits and thought to potentially represent different water-quality conditions than those at Lily Pond stations 1 and 2. (fig. 7). Therefore, these samples were not used in subsequent aluminum CMC and CCC calculations.
The continuous water-quality monitor at Lily Pond station 1 was mounted on a plastic dock float anchored in the pond. The datalogger shelter was attached to the float, and the water-quality sonde was housed inside a polyvinyl chloride (PVC) pipe that extended about 1.5 ft down into the pond.
Cohasset Water-Treatment Plant Backwash Effluent (Station 421334070490601)
Polyaluminum chloride (PACL) and ferric chloride are used by the Cohasset WTF (fig. 7) for coagulation and removal of dissolved natural organic matter. Backwash from the Cohasset WTF is discharged to a cement-lined lagoon (nearest to the pond) from where the backwash is pumped to a second lagoon that is lined with a large geotextile bag (a geobag) (C. Carter Fahy, Environmental Partners Group, Inc., written commun., May 27, 2010) where the solids accumulate. The solids are shipped offsite once the geobag reaches capacity. The supernatant effluent discharge from both lagoons drains to Lily Pond.
Effluent samples were collected from three different locations at the lagoons depending on conditions at the time of sampling. If the supernatant was overflowing the weirs, effluent samples were collected using a peristaltic pump by pumping effluent into a 2-L plastic bottle from an access vault that receives outflow from the two lagoons as they drain to the pond. During most site visits, effluent was not discharging from the lagoons; the top board of the weir of the lagoon nearest the pond was pried upward, and the effluent was collected from the weir outflow directly into a 2-L plastic bottle. One sample (March 8, 2019) was collected at the end of the effluent culvert during a backwash event.
Fitchburg Water-Treatment Facility
The following five monitoring stations are associated with the Fitchburg WTF: two stations at the upgradient end of the pond, Wyman Pond, Leino Park Road, shallow, Westminster, Mass. (station 423132071523401), and Wyman Pond, Leino Park Road, deep, Westminster, Mass. (station 423132071523402); an effluent station, Fitchburg water-treatment plant backwash effluent (station 423215071534101); and two stations at a deep hole near the outlet end of the pond, Wyman Pond shallow, Westminster, Mass. (station 423211071524701), and Wyman Pond deep, Westminster, Mass. (station 423211071524702) (fig. 8).
Wyman Pond, Leino Park Road, Shallow, Westminster, Mass. (Station 423132071523401), and Wyman Pond, Leino Park Road, Deep, Westminster, Mass. (Station 423132071523402)
A pair of shallow and deep stations (stations 42313207152301and 42313207152302, respectively) were established in Wyman Pond near the inflow end of the pond. These shallow and deep stations also are referred to as pond stations 1 and 2, respectively. The stations were established where the Leino Park Bridge crosses the pond, about 1 mi from the Fitchburg WTF effluent discharge and about 1.25 mi above the Wyman Pond Dam. Because of the narrow sinuous shape of Wyman Pond at the inflow end of the pond, and the distance from the effluent discharge, the water quality at these stations were thought to be beyond the effect of effluent from the Fitchburg WTF (fig.8). Water samples were collected near the center of the Leino Park Road Bridge at shallow (generally about 1.5 ft) and deep (greater than 3 ft) depths in the pond from a canoe with a peristaltic pump by pumping into a 2-L plastic bottle. Two monthly discrete samples (October 10, 2018, and April 25, 2019) were collected along a cross section of the pond by pumping with a peristaltic pump while moving the canoe back and forth along the face of the bridge. Two samples during winter (December 10, 2018, and February 2, 2019) were collected through ice from a single location at the center of the channel using a weighted-bottle sampler.
The continuous water-quality monitor was installed in Wyman Pond at pond station 1 on a plastic dock float tethered with a cable between the third and fourth pier on the northeastern side of the Leino Park Road Bridge about 30 ft from the east bank. The datalogger shelter was mounted to the dock float, and the water-quality sonde was housed inside a PVC pipe that extended about 1.5 ft down into the pond.
Fitchburg Water-Treatment Plant Backwash Effluent (Station 423215071534101)
The Fitchburg WTF (fig. 8) uses PACL as a coagulant. Facility operations discharge rinse and backwash water to one of two lagoons. The effluent discharged from the lagoons is piped to a ditch that flows through a constructed wetland and then to an intermittent (unnamed) tributary from where the effluent flows about 0.45 mi and through two beaver ponds before discharging to the main body of Wyman Pond on the northwestern side of the pond. The drainage area of the intermittent tributary is 0.29 mi2 mi where the brook discharges to Wyman Pond. The effluent discharge enters Wyman Pond about 0.5 mi southeast from the Wyman Pond Dam.
The Fitchburg WTF effluent was sampled at the outflow of two culverts where the effluent is discharged into a ditch. Most samples were collected equally from both culverts by filling a 2-L plastic bottle directly from effluent flowing through a grate covering the ends of the culverts.
If samples were collected at the beginning of a backwash cycle, when effluent discharges were fast and turbulent, water samples were collected from the pool immediately below the culverts with a peristaltic pump by pumping into a 2-L plastic bottle.
Wyman Pond Shallow, Westminster, Mass. (Station 423211071524701), and Wyman Pond Deep, Westminster, Mass. (Station 423211071524702)
A second pair of shallow and deep stations were established in Wyman Pond near the outflow end of the pond, about 750 ft southeast from the dam and more than 1,800 ft from the effluent discharge (fig. 8). These shallow and deep stations also are referred to as pond stations 3 and 4, respectively. The stations were established where the pond narrows, and water depths are about 12 ft deep. Water samples collected at this location were thought to represent the best available location near the pond outflow that would (a) be outside the area of immediate effect of effluent discharge and (b) meet study selection criteria to be in a deep pond area that would not become covered with aquatic vegetation in summer. Water samples were collected at shallow (1.5 ft) and deep (generally greater than 6 ft) depths in the pond from a canoe with a peristaltic pump. During winter, when ice was too thick to reach the station by canoe but unsafe to walk on, two water samples (December 10, 2018, and February 12, 2019) were collected from the dam spillway. Unlike the pond samples, the samples from the spillway were collected from rapidly moving water and, therefore, were not used in subsequent aluminum value calculations.
Westborough Water-Treatment Facility
The following four monitoring stations are associated with the Westborough WTF: an effluent station, Westborough water-treatment plant backwash effluent (station 421627071392401); two stations near a deep hole in the pond, Hocomonco Pond shallow, Westborough, Mass. (station 421622071385701), and Hocomonco Pond deep, Westborough, Mass. (station 421622071385702); and a station at the pond outlet, Hocomonco Pond near Otis Street, Westborough, Mass. (station 421628071384501) (fig. 9).
Hocomonco Pond Shallow, Westborough, Mass. (Station 421622071385701), and Hocomonco Pond Deep, Westborough, Mass. (Station 421622071385702)
Two stations were established near the middle of Hocomonco Pond. A bathymetric map and Google Earth (https://earth.google.com) aerial photographs were used to identify an area near the center of the pond, about 300 ft from the northern and western shores of the pond where the water surface seemed to remain open and not become covered with aquatic vegetation during summer. This area was thought to represent the best available location in the pond that would be outside the area of the immediate effect of effluent discharge, but still meeting study selection criteria to be in a deep pond area. The shallow and deep stations established at Hocomono Pond also are referred to as pond stations 1 and 2, respectively. Samples were collected at shallow (1.5 ft) and deep (greater than 3 ft) depths in the pond from a canoe with a peristaltic pump by pumping into a 2-L plastic bottle. Samples were collected carefully to avoid contacting aquatic vegetation or disturbing the pond bottom. Submerged aquatic vegetation often limited the depth at which the deep sample could be collected without pulling plant fragments into the sample bottle with the peristaltic pump.
A continuous water-quality monitor was installed into Hocomonco Pond at pond station 1 on a plastic dock float anchored in the pond. The datalogger shelter was mounted to the dock float, and the water-quality sonde was housed inside a PVC pipe that extended about 1.5 ft into the pond.
Westborough Water-Treatment Plant Backwash Effluent (Station 421627071392401)
The Westborough WTF (fig. 9) uses PACL as a coagulant. The effluent discharges along the southwestern side of the pond from a small culvert from where the effluent runs overland to Hocomonco Pond. A small delta of sediment is laden with iron-oxidizing bacteria where the effluent discharges into the pond. The effluent could not be sampled at the end of the outflow pipe because a stormwater pipe that drains a parking lot from a nearby commercial building joins the effluent discharge pipe under the access road to the Westborough WTF before the effluent discharges to the pond. Consequently, the effluent was sampled about 30–40 ft east of the southern effluent lagoon from a spicket using a pump that is used by the Westborough WTF to collect effluent samples. To collect a sample, Westborough WTF staff were contacted to coordinate effluent discharge and pump operation. Field parameters were collected by submerging the field monitor into the effluent in a flow-through cell. Before collection of a water-quality sample, the pump was operated for about 10 minutes to wait for water-quality field parameters to stabilize and to minimize the possibility of sampling any solids from the pumping well that may have been disturbed by turning on the pump.
Hocomonco Pond near Otis Street, Westborough, Mass. (Station 421628071384501)
Station 421628071384501, Hocomonco Pond near Otis Street, Westborough, Mass., was established about 5–6 ft east of the Hocomonco Pond outflow culvert (fig. 9). The station is considered outside the immediate effect of the effluent discharge and is referred to as Hocomonco Pond station 3. This station was consistently sampled at the same location. The sample was collected from the bank by pumping with a peristaltic pump into a 2-L plastic bottle. The outlet was not waded during sampling to avoid disturbing the soft pond bottom. The end of the sample tubing was attached to a stainless-steel DH–81 rod (https://water.usgs.gov/fisp/docs/Instructions_US_DH-81_010612.pdf), and the tubing was moved gently back and forth across the outflow channel at mid-depth while the sample was collected. Velocities at the outflow varied because the culvert entrance is frequently blocked with sticks placed by beavers. A heavy steel grill is in place to prevent beavers from plugging the culvert and to facilitate periodic removal of the sticks. Water levels in the pond varied by 1 ft or more during the summer and fall in response to beaver damming the outlet and periodic removal of the blockage.
Water-Treatment Facilities with Stream Receiving-Water Bodies
This section includes site descriptions and sample-collection methods for the stations associated with the Hanover, Leominster, Weymouth, and Wilmington WTFs. The ambient (upstream) stations for these facilities are all on headwater streams including Third Meadow Brook (Hanover), Monoosnoc Brook (Leominster), Mine Brook (Weymouth), and Sawmill and Maple Meadow Brooks (Wilmington).
Hanover Water-Treatment Facility
The following three monitoring stations are associated with the Hanover WTF: a station upstream from the effluent discharge, Third Herring Brook Pond Street near Hanover, Mass. (station 011058065); an effluent station, Hanover water-treatment plant backwash effluent (station 420754070495801); and a station downstream from the effluent discharge, Third Herring Brook, downstream from water-treatment plant, near Hanover, Mass. (station 011058075) (fig. 10).
Third Herring Brook Pond Street near Hanover, Mass. (Station 011058065)
Station 011058065, Third Herring Brook Street near Hanover, Mass., is about 800 ft upstream from where the Hanover WTF effluent discharges from Silver Brook to Third Herring Brook, at the downstream end of the former Pond Street crossing of Third Herring Brook. The bridge deck at the Pond Street crossing has been removed, but the stone abutments remain. This station was consistently sampled at the same location. The channel at this station is a riffle with a cobble-boulder streambed and has a shallow depth (less than 4 ft deep). Water-quality samples were collected using EWI isokinetic, depth-integrated sampling techniques (U.S. Geological Survey, 2018). During low flows, water-quality samples were grab samples collected with a dip or sweep of a 2-L plastic bottle. During August 2018, Third Herring Brook dried completely at the upstream station.
The continuous water-quality monitor was installed into Third Herring Brook along the left side of the stone abutment just upstream of the access trail footbridge. The datalogger shelter was mounted on top of the abutment, and the water-quality sonde was housed in a pipe extending vertically down to the streambed.
Hanover Water-Treatment Plant Backwash Effluent (Station 420754070495801)
The Hanover WTF uses aluminum sulfate for water treatment. Filters are backwashed and pumped to two lagoons adjacent to the WTF. The lagoons are operated in series with effluent from one lagoon generally flowing into the other before discharge. Samples were collected from the outflow by pumping effluent with a peristaltic pump directly into a 2-L plastic bottle. For the first two monthly samples (May 3, 2018, and May 29, 2018), effluent samples were collected where effluent overflowed the weir of the active lagoon. Subsequent samples were collected at the outflow of two culverts draining the lagoons to include water that may have discharged or leaked from both lagoons.
Third Herring Brook Downstream from Water-Treatment Plant, near Hanover, Mass. (Station 011058075)
Station 011058075, Third Herring Brook downstream from water-treatment plant, near Hanover, Mass. (fig. 10), is about 1,800 ft downstream from the juncture of Silver and Third Herring Brooks. The brook flows through a large wetland with thick vegetation and difficult access. Consequently, a downstream monitoring station was established about 0.43 mi downstream from Pond Street in a reach adjacent to an upland peninsula that extends into the wetland. The station was accessed from the northern side of Third Herring Brook through Norwell Water Department property by way of a forest road and then by hiking about 0.25 mi along the upland peninsula and across the riparian wetland to the brook. The station was the best location for access downstream from the juncture of Silver and Third Herring Brooks and upstream from the juncture of Third Herring and Wildcat Brooks. The stream at the station is a low-gradient wetland stream. Water-quality samples were collected while wading using a DH–81 sampler. When streamflows were too deep to wade, samples were collected from the streambank with a DH–81 or with a 1-L bottle attached to a plastic extendable sampling rod and then transferred to 2-L plastic bottle. During August 2018, Third Herring Brook dried to a series of small-disconnected pools in this reach and grab samples were collected with a 2-L plastic bottle.
Leominster Water-Treatment Facility
The following three monitoring stations are associated with the Leominster WTF: a station upstream from the effluent discharge, Monoosnoc Brook upstream from Leominster water- treatment plant (station 01094420); an effluent station, Leominster water-treatment plant backwash effluent (station 423258071480701); and a station downstream from the effluent discharge, Monoosnoc Brook, downstream from Leominster water-treatment plant (station 01094422) (fig. 11).
Monoosnoc Brook Upstream from Leominster Water-Treatment Plant (Station 01094420)
Station 0109420, Monoosnoc Brook upstream from Leominster water-treatment plant, is about 100 ft upstream from the effluent discharge. The stream in this reach has a steep slope and is wadable at most flows. The upstream station was established at a point in the stream where the Leominster WTF also collects water-quality samples and a handrail is present down the bank. Water-quality samples were collected about 20–30 ft upstream at a location with a more uniform cross section using EWI isokinetic, depth-integrated sampling techniques (U.S. Geological Survey, 2018). When streamflows were low and water depths were shallow, water-quality samples were collected with a dip or sweep of a 2-L plastic bottle in a narrow constriction of the channel between large boulders.
The continuous water-quality monitor was installed along the left bank of Monooosnoc Brook at the same location where the Leominster WTF collects samples. The datalogger shelter was mounted to a tree and the water-quality sonde was housed in a pipe extending out into the channel. Because of concerns for low water levels and ice at this station, the water-quality monitor was installed into a small pool downstream from a large rock to minimize the chance that the sensors would be exposed during low flow or be damaged by ice. During low flow, orange iron-oxidizing bacteria deposits along the bank and on the pool bottom indicated that the pool water quality might be affected by groundwater discharge.
Leominster Water-Treatment Plant Backwash Effluent (Station 423258071480701)
The Leominster WTF (fig. 11) uses PACL as a coagulant. When the Leominster WTF discharges filter backwash water to the lagoon, the effluent (lagoon supernatant) is displaced from the lagoon to Monoosnoc Brook through a pipe that discharges onto the left bank of Monoosnoc Brook. During the initial part of a backwash, the effluent discharges with high velocity through the air directly into a steeply sloping reach of Monoosnoc Brook and rapidly mixes with the brook (within minutes). Effluent samples were collected from the end of the pipe directly into a 2-L plastic bottle, and field parameters were measured by submerging the water-quality sonde into a flow-through cell inserted into the effluent discharge.
Monoosnoc Brook Downstream from Leominster Water-Treatment Plant (Station 01094422)
Station 010944222, Monoosnoc Brook downstream from Leominster water-treatment plant, is about 300–500 ft downstream from the effluent discharge (fig. 11). The channel through this reach is a riffle, with riprap along the left bank. The exact sampling location varied slightly between monthly samples because field staff used different access points to climb down the steep riprap bank to access the channel depending on safety concerns related to weather conditions on the day of sampling. Water-quality samples were collected using EWI isokinetic, depth-integrated sampling techniques (U.S. Geological Survey, 2018). Water-quality samples during low flows were collected with a dip or sweep of a 2-L plastic bottle.
Weymouth Water-Treatment Facility
The following four monitoring stations are associated with the Weymouth WTF: a station on the Mill River upstream from the confluence with the outflow from Great Pond, Mill River near Randolph Street, South Weymouth, Mass. (station 01105587); an effluent station, Weymouth water-treatment plant effluent (station 420959070580401); and two stations on an embayment of Great Pond that receives the effluent discharge, Great Pond near outlet, shallow, South Weymouth, Mass. (station 421004070580201), and Great Pond near outlet, deep, South Weymouth, Mass. (station 421004070580202) (fig. 12).
Mill River near Randolph Street, South Weymouth, Mass. (Station 01105587)
Station 01105587, Mill River near Randolph Street, South Weymouth, Mass., is on Mill River, about 900 ft upstream from the juncture of Mill River with the outflow from Great Pond. The station is about 180 ft west of the Massachusetts Bay Transportation Authority Kingston/Plymouth Commuter Rail Line and 15 ft upstream from where Randolph Street crosses the Mill River. This station was consistently sampled at the same location. Water-quality samples were collected in a narrow channel constriction just upstream from the culverts under Randolph Street. Samples were collected with a grab sample using a single vertical dip with a 2-L plastic bottle. Two tributaries join just upstream from the monitoring station. These tributaries border the northern and eastern sides of the Weymouth Municipal compost site.
The continuous water-quality monitor was installed along the right bank of Mill River upstream from Randolph Street. The datalogger shelter was mounted to a tree, and the water-quality sonde was housed in a pipe extending out into the center of the channel.
Weymouth Water-Treatment Plant Effluent (Station 420959070580401)
The Weymouth WTF (fig. 12) uses PACL as a coagulant. Effluent (lagoon supernatant) return flows are discharged to a small channel that flows overland to an embayment near the outlet of Great Pond. The Weymouth WTF effluent was sampled at the outflow of the culvert draining the lagoons. The effluent contains water draining from the lagoons and periodically also includes water discharged from a plate separator at the Weymouth WTF. Most samples were collected from the channel just below the outflow culvert, either by pumping effluent from the channel into a 2-L plastic bottle with a peristaltic pump or by dipping the 2-L bottle directly into the effluent discharge.
Great Pond near Outlet, Shallow, South Weymouth, Mass. (Station 421004070580201), and Great Pond near Outlet, Deep, South Weymouth, Mass. (Station 421004070580202)
Station 421004070580201, Great Pond near Outlet, Shallow, South Weymouth, Mass., and station 421004070580202, Great Pond near Outlet, Deep, South Weymouth, Mass. (fig. 12), were established in the center of the embayment about 750 ft northeast of the effluent discharge and 420 ft southwest of the dam and outlet structure along Randolph Street. Water-quality samples were collected from a canoe at shallow (1.5 ft) and deep (6 ft) depths in the pond with a peristaltic pump. During winter, when ice prevented launching the canoe and the pond ice was not safe to walk on, two samples (December 10, 2018, and February 12, 2019) were collected at the outflow weir of the dam at the northern end of the pond. The outlet only flows at high pond levels, and the water at the outlet is shallow (less than 3 ft deep). These stations are downgradient of effluent discharge and are not on the designated receiving-water body (Mill River); therefore, these stations were not used in aluminum value calculations. Rebuilding of the dam at the outlet of Great Pond began in 2020; how the rebuilding of the dam and outlet controls may affect the discharges from Great Pond to the Mill River is unknown.
Wilmington Water-Treatment Facility
The following four monitoring stations are associated with the Wilmington WTF: two stations on tributaries upstream from the effluent discharge, Sawmill Brook at Chestnut Street, Wilmington, Mass. (station 01101296), and Maple Meadow Brook, Wilmington, Mass. (station 01101294); an effluent station, Wilmington water-treatment plant backwash effluent (station 423200071100201); and a station downstream from the effluent discharge, Maple Meadow Brook at Middlesex Canal, Wilmington, Mass. (station 01101298) (fig. 13).
Sawmill Brook at Chestnut Street, Wilmington, Mass. (Station 01101296), and Maple Meadow Brook, Wilmington, Mass. (Station 01101294)
Two small streams, Sawmill Brook and Maple Meadow Brook, flow into a large (about 65 acres) shrub wetland that receives the effluent discharge from the Wilmington WTF. Access issues prevented establishment of monitoring stations on the brooks in the wetland upstream from the effluent discharge. Consequently, stations were established further upstream on Sawmill Brook and Maple Meadow Brook at locations that allowed access.
The Sawmill Brook station (station 01101296) was established at Chestnut Street about 0.6 mi upstream from the effluent discharge. Here, Sawmill Brook is a small wetland stream, with a drainage area of about 1.85 mi2. The Chestnut Street crossing has two 3-ft culverts. This station was consistently sampled at the same location on the upstream side of Chestnut Street. Water-quality samples were collected (while wading) with a grab sample by sweeping a 2-L plastic bottle across the channel in front of the two culverts.
The continuous water-quality monitor was installed into Sawmill Brook on the downstream side of Chestnut Street. The datalogger shelter was mounted to the bridge deck, and the water-quality sonde was housed in a pipe extending out into the channel between the culverts.
Maple Meadow Brook was sampled beneath a power line, upstream from the former Maple Meadow landfill, and about 0.8 mi upstream from the juncture with Sawmill Brook. Maple Meadow Brook in this reach is a small, low-gradient wetland stream with a drainage area of about 0.96 mi2. Water-quality samples were collected (while wading) with a grab sample by a sweep of the channel with a 2-L plastic bottle.
Wilmington Water-Treatment Plant Backwash Effluent (Station 423200071100201)
The Wilmington WTF (fig. 13) contains two lagoons, one that is active and another that is typically offline for drying. The Wilmington WTF uses aluminum sulfate as a coagulant. The filter backwash and sedimentation basin residuals flow by gravity to the lagoons, displacing the effluent (lagoon supernatant) from the lagoon. The effluent could not be sampled at the end of the outflow pipe because the pipe discharges below the surface of a pool that also can contain stormwater. Consequently, the effluent was sampled directly from the outflow flowing over the weir draining the active lagoon. At the start of the project, the north lagoon was active and the south lagoon was drying out. After the solids were cleaned from the south lagoon, it became the active lagoon and refilled. When the lagoon was refilling, no water was flowing over the weir; during this period, effluent samples were collected from streams of water leaking from gaps between the boards making up the weir.
Maple Meadow Brook at Middlesex Canal, Wilmington, Mass. (Station 01101298)
Station 01101298, Maple Meadow Brook at Middlesex Canal, Wilmington, Mass. (fig. 13), is about 1,500 ft downstream from where the Wilmington WTF effluent enters the wetland. The monitoring station is on Maple Meadow Brook at the downstream end of the stone abutment for the historical Middlesex Canal crossing and was accessed from the east through Town Park, with permission from the Wilmington Conservation Commission. This station was consistently sampled at the same location at the downstream end of the abutments. Water-quality samples were collected while wading using EWI isokinetic, depth-integrated sampling techniques (U.S. Geological Survey, 2018).
References Cited
U.S. Geological Survey [USGS], 2018, General introduction for the “National Field Manual for the Collection of Water-Quality Data” (ver. 1.1, June 2018): U.S. Geological Survey Techniques and Methods, book 9, chap. A0, accessed December 30, 2019, at https://doi.org/10.3133/tm9A0.
Conversion Factors
Temperature in degrees Celsius (°C) may be converted to degrees Fahrenheit (°F) as follows:
°F = (1.8 × °C) + 32.
Temperature in degrees Fahrenheit (°F) may be converted to degrees Celsius (°C) as follows:
°C = (°F−32) / 1.8.
Supplemental Information
Specific conductance is given in microsiemens per centimeter (µS/cm) at 25 degrees Celsius (µS/cm at 25 °C).
Concentrations of chemical constituents in water are given in either milligrams per liter (mg/L) or micrograms per liter (µg/L).
pH is given in standard units (SU).
Water year is defined as the 12-month period from October 1 of any given year through September 30 of the following year. The water year is designated by the calendar year in which it ends.
The U.S. Geological Survey follows the convention of identifying left and right sides of a stream as viewed when facing downstream.
Abbreviations
CCC
criterion continuous concentration
CMC
criterion maximum concentration
DI
deionized
DOC
dissolved organic carbon
EPA
U.S. Environmental Protection Agency
EWI
equal-width increment
LMS
laboratory matrix spike
MassDEP
Massachusetts Department of Environmental Protection
NPDES
National Pollutant Discharge Elimination System
NWQL
National Water Quality Laboratory
PACL
polyaluminum chloride
PVC
polyvinyl chloride
TOC
total organic carbon
USGS
U.S. Geological Survey
WWTF
wastewater treatment facility
WTF
water treatment facility
For more information about this report, contact:
Director, New England Water Science Center
U.S. Geological Survey
10 Bearfoot Road
Northborough, MA 01532
dc_nweng@usgs.gov
or visit our website at
https://www.usgs.gov/centers/new-england-water
Publishing support provided by the Pembroke and Rolla Publishing Service Centers
Suggested Citation
Armstrong, D.S., Savoie, J.G., DeSimone, L.A., Laabs, K.L., and Carey, R.O., 2022, Surface-water-quality data to support implementation of revised freshwater aluminum water-quality criteria in Massachusetts, 2018–19 (ver. 1.1, February 2023): U.S. Geological Survey Scientific Investigations Report 2021–5144, 85 p., https://doi.org/10.3133/sir20215144.
ISSN: 2328-0328 (online)
Study Area
| Publication type | Report |
|---|---|
| Publication Subtype | USGS Numbered Series |
| Title | Surface-water-quality data to support implementation of revised freshwater aluminum water-quality criteria in Massachusetts, 2018–19 |
| Series title | Scientific Investigations Report |
| Series number | 2021-5144 |
| DOI | 10.3133/sir20215144 |
| Edition | Version 1.0: April 12, 2022; Version 1.1: February 27, 2023 |
| Year Published | 2022 |
| Language | English |
| Publisher | U.S. Geological Survey |
| Publisher location | Reston, VA |
| Contributing office(s) | New England Water Science Center |
| Description | Report: x, 85 p.; 2 Data Releases |
| Country | United States |
| State | Massachusetts |
| Online Only (Y/N) | Y |
| Additional Online Files (Y/N) | N |
| Google Analytic Metrics | Metrics page |