

Distribution of Streamflow, Sediment, and Nutrients Entering Galveston Bay from the Trinity River, Texas, 2016–19
Links
- Document: Report (4.08 MB pdf) , HTML , XML
- Dataset: U.S. Geological Survey National Water Information System database —USGS water data for the Nation
- Download citation as: RIS | Dublin Core
Abstract
The U.S. Geological Survey (USGS), in cooperation with the Texas Water Development Board, collected streamflow and water-quality data at USGS monitoring stations in the lower Trinity River Basin from January 2016 to December 2019 to characterize streamflow, nutrients, and suspended sediment entering Galveston Bay from the Trinity River. Results from previous studies indicate that water from the main channel of the Trinity River is diverted into surrounding wetlands and water bodies and is stored or discharged directly into Galveston Bay through distributary channels in the delta. This study provides an assessment of the distribution of streamflow in the various channels that form the delta of the Trinity River to evaluate the effects of streamflow diversions on the eventual supply of freshwater, nutrients, and suspended sediment to Galveston Bay.
Instantaneous streamflow data and continuous streamflow records from USGS monitoring stations in the delta of the Trinity River were used to quantify freshwater inflow into Galveston Bay and assess the distribution of streamflow in the lowermost reaches of the Trinity River Basin. In this report, periods in which releases from Lake Livingston caused a rise in streamflow farther downstream at USGS station 08067000 Trinity River at Liberty, Tex. (hereinafter referred to as the “Liberty site”) that did not exceed 20,000 cubic feet per second (ft3/s) are referred to as “low-flow events,” and periods in which streamflow at the Liberty site exceeded 20,000 ft3/s are referred to as “high-flow events.”
During this study, it was estimated that only about 55 percent of the total water volume released from Lake Livingston was accounted for at USGS station 08067252 Trinity River at Wallisville, Tex. (hereinafter referred to as the “Wallisville site”), which is approximately 8 river miles upstream from where the Trinity River enters Galveston Bay. The difference in water volumes between what is released from Lake Livingston and what is measured at the Wallisville site is consistent with findings from previous studies and indicates that a large part of the volume released from Lake Livingston does not reach Galveston Bay through the main channel of the Trinity River.
To assess the distribution of streamflow and estimate the amount of water diverted from the main channel of the Trinity River into distributary channels, instantaneous streamflow measurements were made at USGS station 08067230 Old River Lake near Wallisville, Tex. (hereinafter referred to as the “Old River Lake site”) and the Wallisville site during a range of hydrologic conditions. Results indicate that a large portion of the freshwater inflow was likely delivered to Galveston Bay through pathways other than the main channel of the Trinity River, including Old River Lake. When streamflow at the Liberty site, located upstream from the Wallisville site, exceeded approximately 40,000 ft3/s, Old River Lake and its network of hydrologically connected channels likely became the primary pathway for freshwater inflow entering Galveston Bay.
Water quality was characterized from discrete samples collected during a range of hydrologic conditions at the Old River Lake site and the Wallisville site in order to evaluate the effects of streamflow diversions on the supply of suspended sediment and nutrients into Galveston Bay. Suspended-sediment concentrations were typically higher at the Wallisville site than at the Old River Lake site, likely because of lower water velocities at the Old River Lake site than at the Wallisville site; low water velocities allow suspended sediment to settle, thus reducing concentrations. Suspended-sediment loads were also typically higher at the Wallisville site than at the Old River Lake site during high-flow events. However, when streamflows at the Liberty site exceeded approximately 60,000 ft3/s, suspended-sediment loads were higher at the Old River Lake, which likely became the primary pathway for suspended-sediment delivery into Galveston Bay.
Suspended-sediment concentrations and loads were computed at the Wallisville and Liberty sites for the duration of 11 hydrologic events representing different streamflows by using the regression equations developed for each monitoring station. Overall, approximately 25 percent of the total sediment load measured during events at the Liberty site was measured at the Wallisville site, indicating that only a portion of the suspended-sediment load from the Liberty site reached Galveston Bay through the main channel of the Trinity River during the measured events. Based on data from discrete samples, some of this sediment load was diverted into Old River Lake and associated distributary channels.
Results from analysis of nutrient samples indicate that streamflow conditions affect the nitrogen concentrations in the delta of the Trinity River. At the Old River Lake site, nitrate plus nitrite and total dissolved nitrogen concentrations were typically lower during low-flow conditions than during high-flow events; low-flow conditions represent low-flow events or tidal-flow conditions (during low-flow conditions the streamflow at the Liberty site was less than 20,000 ft3/s). Lower concentrations of nitrate plus nitrite and total dissolved nitrogen at the Old River Lake site may be associated with various physical and biogeochemical processes, including the transformation and biological uptake of nitrate, nitrite, and other species of nitrogen resulting from extended water residence times and relatively small inputs of nitrogen from the upstream reaches of the Trinity River Basin. During high-flow events, the proportions of nitrogen species were similar among sites, indicating that the travel path through wetlands and channels surrounding Old River Lake likely does not affect the relative concentrations of the various nitrogen species present in freshwater inflow to Galveston Bay.
Results from analysis of nutrient samples also indicate that the pathways for nutrient delivery from the Trinity River into Galveston Bay are dependent on event magnitude. When streamflows at the Liberty site were low (approximately 20,000 ft3/s), the main channel of the Trinity River was the primary pathway for nitrogen and phosphorus entering Galveston Bay. Once streamflow at the Liberty site exceeded 20,000 ft3/s, however, the contribution of nutrient loading through Old River Lake to Galveston Bay increased proportionally to the nutrient loading in the main channel, and when streamflow at the Liberty site exceeded approximately 50,000 ft3/s, Old River Lake likely became the primary pathway for nutrient delivery into Galveston Bay.
Introduction
The delivery of freshwater inflow plays an important role in the ecological productivity of bays and estuaries. Freshwater inflows into estuaries maintain salinity regimes and circulation patterns and deliver sediment and nutrients necessary to sustain the health of coastal ecosystems (Copeland, 1966; Longley, 1994). In Texas, the delivery of freshwater into estuaries is often affected by diversions and impoundments constructed for the purpose of providing flood control and water supplies, resulting in the need to define appropriate environmental flows that can sustain a sound ecological environment in estuaries and meet human needs (Houston Advanced Research Center, 2020). Because of the variable and complex nature of estuaries in the Texas coast, defining environmental flows is a complicated process, often driven by system-specific conditions (Montagna and others, 2011), requiring both spatially and temporally distributed data on streamflow, nutrient, and sediment inputs over a range of hydrologic conditions.
In Galveston Bay, the largest estuary in Texas, developing strategies to maintain adequate freshwater inflows are essential to preserve the economic, recreational, and environmental benefits the estuary provides. Galveston Bay’s largest freshwater inflow is the Trinity River (Houston Advanced Research Center, 2020), a heavily populated river basin facing several environmental challenges, including increasing water-supply demands (Texas Water Development Board [TWDB], 2019) and increasing sediment and nutrient loading from agricultural, urban, and industrial sources (Van Metre and Reutter, 1995; Land and others, 1999; Rebich and others, 2011). The U.S. Geological Survey (USGS), in cooperation with the TWDB, has collected and studied streamflow, nutrient, and sediment data in the lower part of the Trinity River since 2009. These data have been collected to assess the variability of freshwater inflow and nutrient and sediment concentrations from the Trinity River into Galveston Bay (Lee, 2010; Lucena and Lee, 2017) and to provide information that can be used to define environmental flows. Previous studies found that data from upstream USGS monitoring stations that were historically used to estimate freshwater inflow and nutrient and sediment loading from the Trinity River into Galveston Bay do not accurately describe inflow conditions in the lowermost reaches of the Trinity River (Lucena and Lee, 2017). Approximately 18 miles before entering Galveston Bay, near Moss Bluff, Tex., the Trinity River bifurcates from its main channel, forming a bayhead delta containing a complex system of distributary channels, lakes, and interdistributary wetlands (fig. 1) (McEwen, 1969; Anderson and others, 2008). Because freshwater inflow into Galveston Bay has historically been quantified from a combination of streamflow measured at USGS monitoring stations upstream from this delta and rainfall-runoff models in ungaged areas of the Trinity River Basin (Texas Department of Water Resources, 1981; Powell and others, 2002), the influence of wetlands within the Trinity delta on the timing, quantity, and quality of freshwater inflow into Galveston Bay has not been considered.
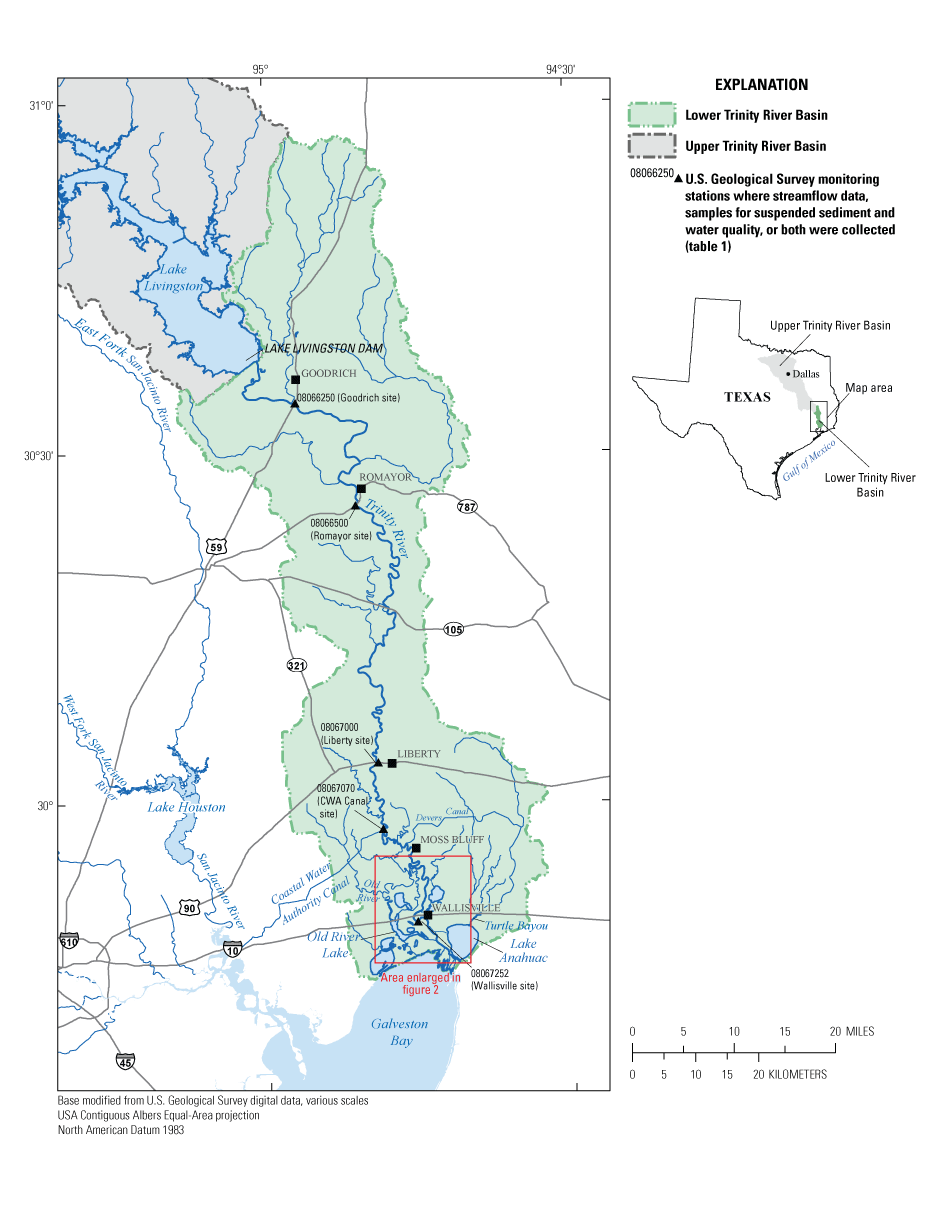
Locations of U.S. Geological Survey monitoring stations in the Trinity River Basin, downstream from Lake Livingston, Texas.
Wetlands are well known for their effectiveness in providing flood mitigation (Mitsch and Gosselink, 2015) and transforming and removing nutrients and other constituents from the water column (Zedler and Kercher, 2005). During storm events, floodplain lakes and wetlands intercept and store floodwaters that can then be slowly released after the flood passes (Mitsch and Gosselink, 2000). In the delta of the Trinity River, the interception of floodwaters by wetlands may result in conditions that enhance sedimentation, such as increased water retention times and decreased water velocities, thus affecting the timing and quantity of the sediment delivered to Galveston Bay. Consequently, sediment retention and resuspension also may affect phosphorus delivery to Galveston Bay; phosphorus concentrations in the lower part of the Trinity River are closely tied to suspended-sediment concentrations because of sorption of phosphorus onto clay particles (Lucena and Lee, 2017). Wetlands are also known for transforming nitrogen through various biogeochemical processes, such as ammonification, nitrification, denitrification, and assimilation by plants and microbes (Mitsch and Gosselink, 2015). These processes have the potential to affect not only the total concentration of nitrogen in freshwater inflow, but also the relative concentrations of nitrogen species in freshwater inflow into Galveston Bay. Understanding how the wetlands in the delta of the Trinity River influence the delivery of freshwater inflow into Galveston Bay is essential to improving accurate quantitative estimates of freshwater inflow, nutrient loads, and sediment loads entering Galveston Bay from the Trinity River. Therefore, the USGS, in cooperation with TWDB, completed a study to assess the distribution of streamflow and characterize sediment and nutrient concentrations and loading into Galveston Bay from the delta of the Trinity River.
Purpose and Scope
This report documents the distribution of streamflow and nutrient and suspended-sediment concentrations and loads in freshwater inflow entering Galveston Bay from the Trinity River, including its complex system of distributary channels, lakes, and interdistributary wetlands in the lower reaches, during 2016–19. Instantaneous streamflow data and continuous streamflow records from USGS monitoring stations in the delta of the Trinity River were used to quantify freshwater inflow into Galveston Bay and assess the distribution of streamflow in the delta of the Trinity River Basin. Water quality was characterized from in situ measurements of physicochemical properties and discrete nutrient and sediment samples collected predominantly during high-flow events at various USGS monitoring stations in the delta of the Trinity River. Water-quality data also were used to assess the influence of the distribution of streamflow in the delta of the Trinity River on nutrient and sediment inputs into Galveston Bay. This report helps address the need for streamflow and water-quality information in the delta of the Trinity River to improve our understanding of the processes that influence the delivery of freshwater, nutrients, and suspended sediment from the Trinity River into Galveston Bay.
Study Area Description
The Trinity River Basin covers approximately 18,000 square miles and is the largest river basin entirely in Texas. From its headwaters near Dallas, the Trinity River flows approximately 715 miles before emptying into the Galveston Bay (Trinity River Authority of Texas, 2021). For this study, the Trinity River Basin was divided into upper and lower parts (hereinafter referred to as the “upper Trinity River Basin” and “lower Trinity River Basin,” respectively) separated by Lake Livingston, a water-supply reservoir (fig. 1); the Trinity River was likewise separated by Lake Livingston into upper and lower parts hereinafter referred to as the “upper Trinity River and “lower Trinity River.” The hydrology in the lower Trinity River Basin is predominantly driven by releases from Lake Livingston as a result of rainfall-runoff events in the upper Trinity River Basin (Lucena and Lee, 2017). These rainfall-runoff events result in the release of large volumes of water from Lake Livingston for extended periods and are typically several orders of magnitude larger than events that cause localized surface runoff. In addition to periods of runoff-generated streamflow, there were ongoing small releases from Lake Livingston during the study period designed to mirror the streamflow entering Lake Livingston from the upper Trinity River Basin (Trinity River Authority of Texas, 2022 ); during these periods of small releases, tides control daily streamflow patterns in the extreme lowermost part of the Trinity River near Galveston Bay, and upstream movement is regulated by a saltwater barrier constructed and operated by the U.S. Army Corps of Engineers that is approximately 2 river miles downstream from the Wallisville site (fig. 2).
The study area (fig. 1) encompasses the lower Trinity River Basin, downstream from Lake Livingston and upstream from where the Trinity River delta meets Galveston Bay. The lower Trinity River flows downstream from Lake Livingston in one main channel for about 85 river miles. Approximately 4 river miles downstream from Moss Bluff (fig. 1), the lower Trinity River bifurcates from its main channel to form various distributaries (Phillips and Slattery, 2007), including the Old River and the Lost River, located west of the main channel of the Trinity River (fig. 2). The Old River and the Lost River flow through the delta plain until they converge at Interstate 10 (fig. 2) to form Old River Lake, a large, shallow open water body surrounded by freshwater wetlands and distributary channels. Downstream from Interstate 10, in the lower delta plain, freshwater inflow enters Galveston Bay through various hydrologically connected distributaries and estuarine wetlands.
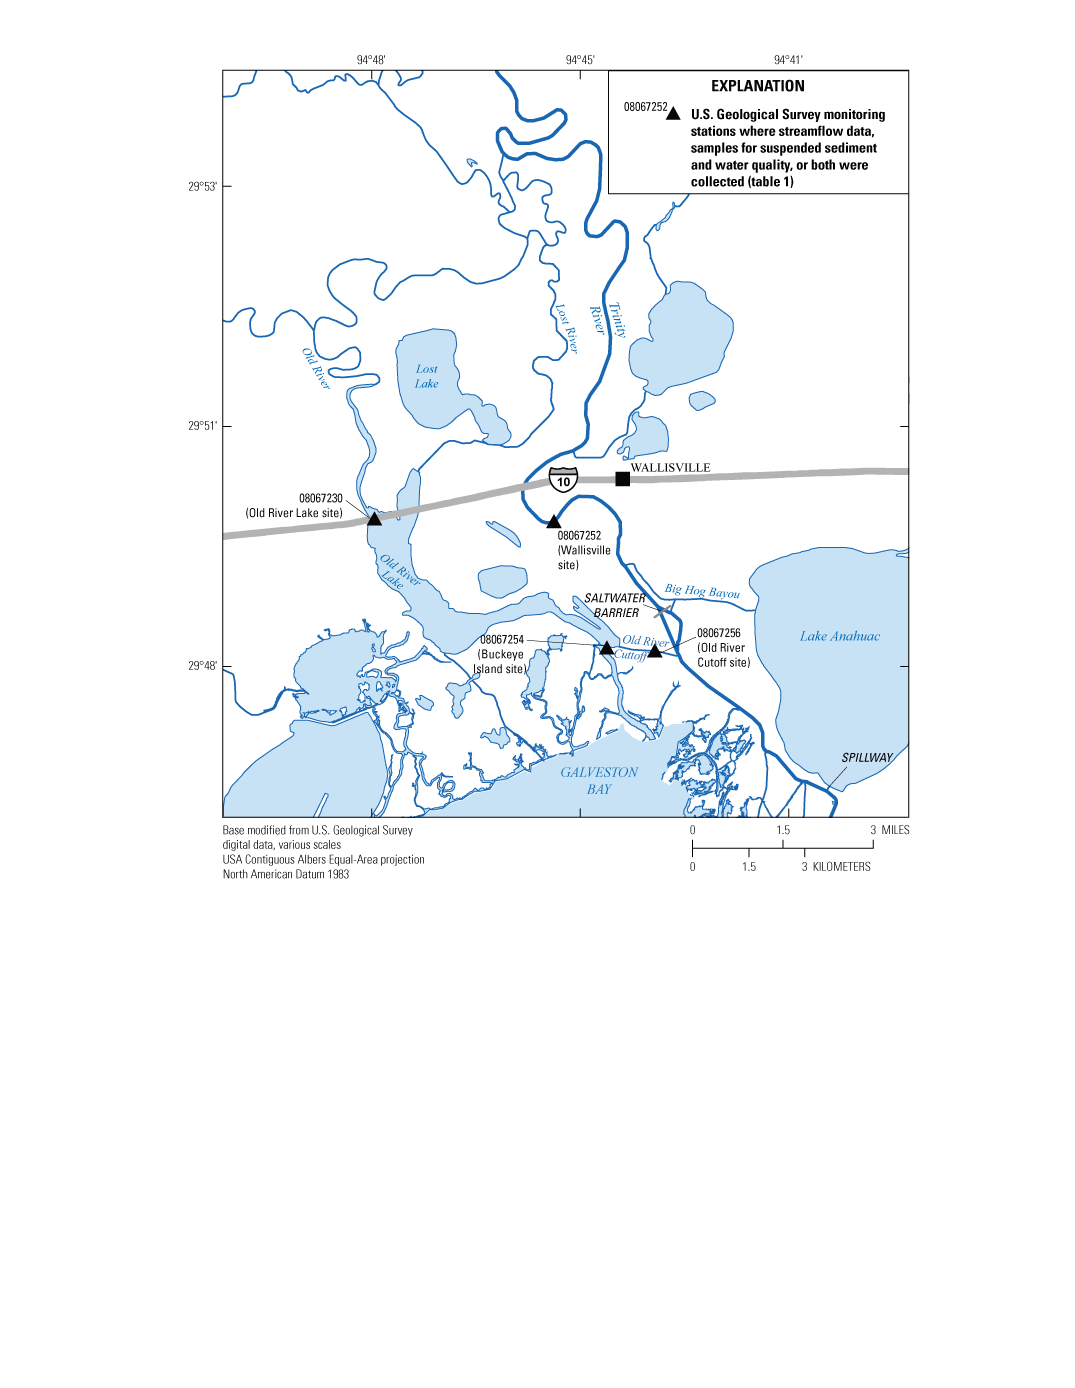
Locations of U.S. Geological Survey monitoring stations in the delta of the Trinity River Basin, Texas.
Freshwater inflow from the Trinity River Basin may also enter Galveston Bay through Lake Anahuac (figs. 1, 2), south of Interstate 10 and east of the main channel of the Trinity River. Lake Anahuac is a reservoir used for municipal, irrigation, industrial, and mining supply purposes (TWDB, 2006). The reservoir receives water from Turtle Bayou, but when necessary, water is pumped from the Trinity River into Lake Anahuac through Big Hog Bayou (fig. 2). The reservoir’s spillway is at the south end of the lake, approximately 3 river miles downstream from the confluence between the Trinity River and the Old River Cutoff. A levee prevents Lake Anahuac from being hydrologically connected to the Trinity River, except at times when water is being pumped into the reservoir through Big Hog Bayou and when high water levels cause water to flow over the uncontrolled spillway into the Trinity River. Because Lake Anahuac is usually not hydrologically connected to the Trinity River, its overall contribution of freshwater inflow, nutrients, and sediment to Galveston Bay was not monitored as part of this study.
Five USGS monitoring stations where continuous streamflow data are collected in the Trinity River (fig. 1; table 1) are included in this study. Four of these stations are on the main channel of the Trinity River: 08066250 Trinity River near Goodrich, Tex. (hereinafter referred to as “the Goodrich site”); 08066500 Trinity River at Romayor, Tex. (hereinafter referred to as “the Romayor site”); 08067000 Trinity River at Liberty, Tex. (hereinafter referred to as “the Liberty site”); and 08067252 Trinity River at Wallisville, Tex. (hereinafter referred to as “the Wallisville site”). The Wallisville site is approximately 8 river miles upstream from where the Trinity River enters Galveston Bay. The Liberty site is approximately 30 river miles upstream from the Wallisville site and 16 river miles upstream from where the Trinity River branches off to form the Old River and Lost River distributaries; the Romayor site is approximately 40 river miles upstream from the Liberty site; and the Goodrich site is approximately 20 river miles upstream from the Romayor site. The Goodrich site is about 10 river miles downstream from Lake Livingston Dam. The fifth USGS monitoring station used in this study (08067070 Coastal Water Authority [CWA] Canal near Dayton, Tex., hereinafter referred to as “the CWA Canal site”) is at the intake of the CWA Canal approximately 10 river miles downstream from the Liberty site. The CWA Canal is used to transport water that is diverted out of the main channel of the Trinity River into a water-supply reservoir. Water is also diverted out of the Trinity River through the ungaged Devers Canal (fig. 1) and Big Hog Bayou (fig. 2).
Table 1.
Description of U.S. Geological Survey (USGS) monitoring stations where streamflow data, samples for suspended sediment and water quality, or both were collected in the lower Trinity River Basin downstream from Lake Livingston, Texas, 2016–19.| USGS station number (fig. 1 or 2) | USGS station name | Short name (fig. 1 or 2) |
Streamflow data type | Water-quality and suspended-sediment samples collected |
|---|---|---|---|---|
| 08066250 | Trinity River near Goodrich, Tex. | Goodrich site | Continuous | No |
| 08066500 | Trinity River at Romayor, Tex. | Romayor site | Continuous | No |
| 08067000 | Trinity River at Liberty, Tex. | Liberty site | Continuous | Yes1 |
| 08067070 | CWA Canal near Dayton, Tex. | CWA Canal site | Continuous | No |
| 08067230 | Old River Lake near Wallisville, Tex. | Old River Lake site | Discrete | Yes |
| 08067252 | Trinity River at Wallisville, Tex. | Wallisville site | Continuous | Yes |
| 08067254 | Old River at Buckeye Island near Anahuac, Tex. | Buckeye Island site | Not collected | Yes |
| 08067256 | Old River Cutoff at Buckeye Island near Anahuac, Tex. | Old River Cutoff site | Discrete | No |
Samples were only collected for suspended-sediment concentration analysis; the data were used to develop a suspended-sediment regression equation (table 1.2).
In addition to the five sites where continuous streamflow data were collected (Goodrich, Romayor, Liberty, Wallisville, and CWA Canal sites), discrete (periodic) streamflow data were also collected at USGS stations 08067230 Old River Lake near Wallisville, Tex. (hereinafter referred to as “the Old River Lake site”) and 08067256 Old River Cutoff at Buckeye Island near Anahuac, Tex. (hereinafter referred to as “the Old River Cutoff site”). Water-quality monitoring data (including suspended-sediment samples) were collected at the Wallisville site and at two sites on distributaries in the delta of the Trinity River (Old River Lake site and USGS station 08067254 Old River at Buckeye Island near Anahuac, Tex. [hereinafter referred to as “the Buckeye Island site”]) (fig. 2; table 1).
Previous Studies
The USGS, in cooperation with the TWDB, has studied the lower reaches of the Trinity River since 2009 to evaluate the variability of freshwater inflow, nutrients, and sediment entering Galveston Bay during a variety of hydrologic conditions. During 2009–13, discrete measurements of streamflow were made during high-flow events at the Wallisville site to help quantify freshwater inflow to Galveston Bay. Lee (2010) evaluated two periods of relatively high streamflow in April 2009 and September 2009 in response to separate rain events. The peak streamflows at the Liberty site were approximately 27,000 cubic feet per second (ft3/s) in April 2009 and 60,000 ft3/s in September 2009. The corresponding peak streamflows at the downstream Wallisville site were approximately 16,500 ft3/s and 21,700 ft3/s, respectively (40 and 64 percent less than the peak streamflow at the upstream Liberty site) (Lee, 2010). An overall decrease in streamflow was also observed at the Wallisville site compared to the streamflow at the upstream Liberty site by using data from discrete streamflow measurements made during selected high-flow events in 2010–13 (USGS, 2021), possibly as a result of channel bifurcations causing water to divert into branching channels in the delta.
In 2014, the USGS installed a streamgage to continuously monitor streamflow at the Wallisville site in order to examine the hydrodynamics in the lowermost reaches of the main channel of the Trinity River. The continuous streamflow record during 2014–15 at the Wallisville site was used to evaluate the differences between the water volume measured at this site and the water volume measured at the upstream stations (Goodrich, Romayor, and Liberty sites) (Lucena and Lee, 2017). Lucena and Lee (2017) found that during 2014–15 only about 54 percent of the total volume of water measured at the Goodrich site was accounted for at the Wallisville site, indicating that at high streamflows, typically greater than 20,000 ft3/s, a large part of the inflow did not reach Galveston Bay through the main channel of the Trinity River. Results from that study also indicate that water likely flows out of the main channel of the Trinity River into surrounding wetlands and water bodies, such as the Old River Lake, and is being stored or discharged directly into Galveston Bay through other channels in the delta. The findings from that study led to the collection of additional data during 2016–19 to further assess the distribution of streamflow in the various channels that form the delta of the Trinity River and evaluate the effects of streamflow diversions into Old River Lake on the eventual supply of freshwater, nutrients, and sediments to Galveston Bay.
Methods
Streamflow and stage data were collected at the Goodrich, Romayor, Liberty, and Wallisville sites according to USGS methods described by Rantz and others (1982a, b), Sauer and Turnipseed (2010), Levesque and Oberg (2012), and Mueller and others (2013). Streamflow at the Goodrich, Romayor, and Liberty gages was computed by using stage-streamflow rating techniques (Rantz and others, 1982a, b; Sauer and Turnipseed, 2010). At the Wallisville site, streamflow was computed by using index velocity rating techniques (Levesque and Oberg, 2012). The index velocity method allows the computation of streamflow at USGS monitoring stations where a rating cannot be solely based on stage, such as the tidally affected streamflows at the Wallisville site.
Except during large storms, streamflow patterns in the delta are dominated by the effects of astronomical tides and routine releases from Lake Livingston. Streamflow tidal oscillations in river deltas such as the delta region of the Trinity River are common and include reversals in streamflow (Hoitink and Jay, 2016). A high percentage of the freshwater inflow delivered to Galveston Bay results from Lake Livingston releases; therefore, most of the discrete streamflow and water-quality monitoring for this study was done during high-flow events in which releases from Lake Livingston (as measured at the Goodrich site) exceeded 20,000 ft3/s. In this report, periods in which releases from Lake Livingston caused a rise in streamflow farther downstream at the Liberty site (fig. 1) that did not exceed 20,000 ft3/s are referred to as “low-flow events,” and periods in which streamflow at the Liberty site exceeded 20,000 ft3/s are referred to as “high-flow events.”
Discrete streamflow measurements were made at the Old River Lake and Old River Cutoff sites (fig. 2) according to methods described by Mueller and others (2013). Because the Old River Lake site is downstream from the confluence of the Old River and Lost River, streamflow measured at this monitoring station corresponds to the approximate total streamflow diverted out of the main channel of the Trinity River farther upstream into distributaries during high-flow events. Measurements at the Old River Cutoff site were used to assess additional distribution of streamflow downstream from the Old River Lake and Wallisville sites. Additional factors that may influence freshwater inflow gains and losses include local surface runoff, inputs from small tributaries, evapotranspiration, and withdrawals or diversions for municipal water use and irrigation. Diversions from the Trinity River into the CWA Canal were estimated from streamflow data computed at the CWA Canal site. Water is also withdrawn at the ungaged Devers Canal (fig. 1), where five streamflow measurements obtained during 2010–11 resulted in a calculated mean streamflow of approximately 110 ft3/s. Remaining factors influencing freshwater gains and losses (such as surface runoff, inputs from ungaged small tributaries, withdrawals from Big Hog Bayou, and evapotranspiration) were not quantified as part of this study; thus, results from these discrete streamflow measurements provide only estimates of the distribution of streamflow among the channels in the lower Trinity River Basin.
Discrete water-quality samples were collected at the Old River Lake and Wallisville sites between March 17, 2016, and May 14, 2019, during a range of hydrologic conditions. Starting December 7, 2017, water-quality samples were collected at the Buckeye Island site only when streamflow at the Liberty site exceeded 20,000 ft3/s and streamflow at the Old River Lake site was high enough to inhibit the effects of flood tides.
During the collection of water-quality and suspended-sediment samples, a multiparameter YSI 6920 V2-2 water-quality sensor (YSI Incorporated, 2012) was used in the field to make in situ measurements of the following physicochemical properties: dissolved oxygen concentration, pH, specific conductance, water temperature, and turbidity. Methods for the collection, processing, and analysis of water-quality and suspended-sediment samples are described by Lucena and Lee (2017) and are in accordance with guidelines in the USGS National Field Manual (USGS, variously dated) and Edwards and Glysson (1999). Samples were collected and submitted to the appropriate laboratory to be analyzed for suspended-sediment concentration, total nitrogen, total phosphorus, and a suite of dissolved nutrient concentrations (total dissolved nitrogen, nitrate plus nitrite, nitrite, ammonia, and orthophosphate). Nitrogen species are reported in milligrams per liter as nitrogen, and phosphorus species are reported in milligrams per liter as phosphorus. A sand-fine separation was performed to determine the amounts of sand-sized suspended sediment (greater than 0.0625 and less than or equal to 2 millimeters [mm]) and fine-sized suspended sediment (less than or equal to 0.0625 mm) (Guy, 1969). Samples for suspended-sediment concentration and sand-fine separation analysis were shipped to a USGS sediment laboratory in Louisville, Kentucky. Methods for sediment sample analyses are documented in Guy (1969). Samples for nutrient analysis were preserved, chilled, and shipped overnight to the USGS National Water Quality Laboratory in Lakewood, Colorado. Methods for nutrient analysis are documented in Fishman (1993), U.S. Environmental Protection Agency (1993), and Patton and Kryskalla (2003, 2011). Water-quality data and real-time streamflow and physicochemical property data collected at USGS monitoring stations, including the USGS monitoring stations where data were collected for this report, are available from the USGS National Water Information System (NWIS) (USGS, 2021).
Quality Control
To evaluate the variability of sample processing and analysis in water-quality constituents, data from field-replicate samples collected at the Old River Lake and Wallisville sites from 2009 to 2019 were considered. The dataset consists of 21 split-replicate samples (table 1.1). Split-replicate samples are prepared from a single sample that is collected and then subdivided into two samples. Quality-control data collected outside of the study period can be used to increase the size of the dataset and improve the understanding of variability in the environmental data as long as the samples are considered to be in the same inference space (Mueller and others, 2015). It was determined that split-replicate samples collected at the Wallisville site during 2009–15 share the same inference space (Lorenzen and Anderson, 1993) as the samples collected during this study at the Old River Lake and Wallisville sites because they represent similar conditions in terms of potential variability. This determination was made because (1) consistent sampling methods and equipment were used for the collection of all samples, (2) hydrologic conditions and concentrations in the quality-control dataset are representative of those observed during the study period, (3) analytical methods for most constituents did not change throughout the sampling period, and (4) sample collection and processing were conducted in the same general area.
For nitrate plus nitrite, only 6 of the 21 replicate samples were considered because of a change in the analytical method in 2011 and because some results were less than the method detection limit, defined as the lowest concentration of an analyte that can be reliably distinguished from a blank for a given analytical method (Long and Winefordner, 1983; Christian, 2004) and computed following methods described in Foreman and others (2021). For the rest of the constituents, replicate samples were only used in the analysis when results were greater than or equal to the method detection limit. Samples were not analyzed for total dissolved nitrogen before 2016; therefore, only four replicate pairs were used in the analysis.
To determine variability in environmental samples, the relative percent difference (RPD) between each pair of duplicate samples was calculated by using the following equation:
whereC1
is the constituent concentration in the environmental sample, and
C2
is the constituent concentration in the split-replicate sample.
The RPDs of replicate sample pairs are included in appendix 1 (table 1.1). The mean RPD of replicate concentrations was less than 8.5 percent for all analytes. This mean RPD, although low, is conservative; small differences in constituent concentration that were only slightly greater than method detection limit resulted in large RPD values in some instances. High RPD values from concentrations only slightly greater than the method detection limit were retained. Overall, the replicate samples indicate low variability in nutrient and sediment analyses.
Tests at the USGS National Water Quality Laboratory in 2007 and 2009–10 indicate that the alkaline-persulfate digestion of whole water samples resulted in a potential negative bias in total nitrogen concentrations in the presence of suspended sediment (Rus and others, 2013). This negative bias may be site specific and varies in magnitude, depending on the origin and concentration of suspended sediment. To assess the potential bias at the Old River Lake, Wallisville, and Buckeye Island sites, total particulate nitrogen (TPN) concentrations were measured following methods described by Zimmerman and others (1997) in a subset of samples that was also analyzed for total nitrogen using the alkaline-persulfate digestion method. Total nitrogen concentrations from the sum of total dissolved nitrogen and TPN were compared to total nitrogen results obtained from the alkaline-persulfate digestion method for 30 samples. Bias ranged from −0.28 to 0.14 milligram per liter (mg/L) (−30.9 to 14.1 percent) at the three sites, with a median bias of −0.03 mg/L (−3.7 percent) at the Old River Lake site, 0 mg/L at the Wallisville site, and 0.02 mg/L (2.1 percent) at the Buckeye Island site. Negative bias did not increase as sediment concentration increased; instead, bias was random and present in most samples. Random bias may be partially explained by the variability in analytical results for TPN, which can affect the bias and precision of computed total nitrogen values. The average relative standard deviation, based on three replicate pairs, was 11 percent for TPN and 6.5 percent for total dissolved nitrogen, resulting in a total variability that ranged from 7.0 to 8.9 percent, depending on the relative concentrations of each constituent in each sample. The mean relative standard deviation for total nitrogen determined by the alkaline-persulfate method was 3.1 percent. For this study, the effects of a potential bias from the alkaline persulfate method are considered negligible because the variability associated with both analytical methods was similar and no relation between negative bias and suspended-sediment concentrations was observed.
Suspended-Sediment Regression Equation Development
Regression equations that contain acoustic backscatter, turbidity, or streamflow can be used to compute suspended-sediment concentrations at a high temporal resolution (typically every 15 minutes), providing an advantage over discrete suspended-sediment concentration samples (Rasmussen and others, 2009; Landers and others, 2016). For example, during high-flow events, the concentrations of suspended sediment can vary considerably within a short time. This temporal variability with discrete samples is difficult to capture because these samples provide information only for the time in which the sample was collected, resulting in interpolation between sampling points that may not accurately characterize variability in suspended-sediment concentrations (Rasmussen and others, 2009).
A regression equation based on continuous acoustic backscatter data was developed by Lucena and Lee (2017) for estimating suspended-sediment concentrations at the Wallisville site (table 2) following methods described by Landers and others (2016). Continuous suspended-sediment concentrations were estimated from acoustic backscatter data collected at 15-minute intervals at the Wallisville site between April 19, 2014, and December 23, 2019. To compare sediment concentrations and loads at the Liberty and Wallisville sites during selected high-flow events in 2016–19, a regression equation was developed to estimate suspended-sediment concentrations at the Liberty site from streamflow and suspended-sediment concentration data collected between January 9, 2014, and July 14, 2020; the suspended-sediment concentration data were collected at the Liberty site in cooperation with the City of Houston. It is preferable to use continuous backscatter or turbidity data when developing regression equations to predict suspended-sediment concentrations (Rasmussen and others, 2009; Landers and others, 2016), but only continuous streamflow data were available at the Liberty site. Sixty-seven observations were used to calibrate the suspended-sediment regression equation (USGS, 2021) (table 1.2). Although 72 suspended-sediment concentration samples were collected at the Liberty site, the data from 5 samples were excluded because of potential issues with data quality indicated by an outlier evaluation based on a graphical analysis of residuals and leverage and influence statistics (Helsel and others, 2020). Outlier values were also identified by a further assessment of field measurements and observations to identify any potential errors that could have occurred during sample collection. Prior to 2018, streamflow data for the Liberty site are only available at streamflows greater than or equal to 10,000 ft3/s. To ensure the entire range of hydrologic conditions was considered and to minimize bias from high-flow observations, streamflow values less than 10,000 ft3/s that were missing for 29 of the remaining 67 suspended-sediment samples collected at the Liberty site were estimated based on streamflow data collected at the Romayor site by using the drainage-area method (Hirsch, 1979).
Streamflow and suspended-sediment concentration data used to develop the regression equation for suspended-sediment concentrations ranged from 785 to 83,700 ft3/s and from 15 to 550 mg/L, respectively (table 1.2). Because streamflow and suspended-sediment concentration data were not normally distributed, data were log transformed to approximate a normal distribution as required for linear regression (Helsel and others, 2020). The use of a log transformation introduces a bias when retransforming data to their original units. This bias was corrected with the nonparametric bias correction factor introduced by Duan (1983). The relation between log-transformed streamflow and suspended-sediment concentrations is depicted in figure 3. The suspended-sediment regression equation for estimating suspended-sediment concentrations at the Liberty site and associated regression diagnostics are included in table 2.
Table 2.
Summary of linear regression equations for estimating suspended-sediment concentrations at U.S. Geological Survey monitoring stations 08067000 Trinity River at Liberty, Texas, and 08067252 Trinity River at Wallisville, Tex. (Lucena and Lee, 2017).[USGS, U.S. Geological Survey; R2, coefficient of determination; RMSE, root mean square error; SSC, suspended-sediment concentration, in milligrams per liter; BCF, bias correction factor; Q, streamflow, in cubic feet per second; , mean sediment-corrected backscatter]
| USGS station name | Short name for sampling site (table 1) | Regression equation | R2 (Helsel and others, 2020) |
Adjusted R2 (Helsel and others, 2020) |
RMSE | Bias correction factor (Duan, 1983) |
Number of observations |
|---|---|---|---|---|---|---|---|
| Trinity River at Liberty, Tex. | Liberty site | 0.79 | 0.79 | 0.181 | 1.09 | 67 | |
| Trinity River at Wallisville, Tex. | Wallisville site | (Lucena and Lee, 2017) |
0.92 | 0.92 | 0.181 | 1.09 | 31 |
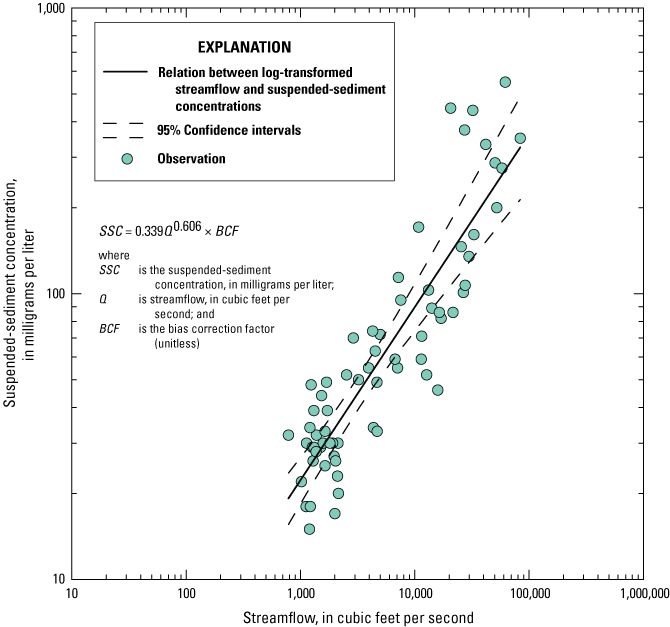
Relation between streamflow and suspended-sediment concentrations (in log10 space) for U.S. Geological Survey monitoring station 08067000 Trinity River at Liberty, Texas, June 2014–July 2020.
Residual and probability plots (fig. 4) indicate that the regression equation for estimating suspended-sediment concentrations resulted in residuals (discrepancies between the observed and estimated data) that met the required inherent assumptions of normality and constant variance (Helsel and others, 2020). The relation between regression-estimated and measured suspended-sediment concentrations (fig. 4D) indicates that, at suspended-sediment concentrations greater than 300 mg/L, the regression equation generally underpredicts concentrations. Because of this limitation, it is possible that some suspended-sediment concentrations included in this report are underestimated. Other predictive variables were unavailable to estimate suspended-sediment concentrations at the Liberty site, and attempts to develop a regression equation by using other methods, such as seasonal and flow-range methods (Glysson, 1987), were not appropriate or did not yield better results. Thus, the regression equation that was developed is used only to estimate concentrations and loads during selected hydrologic events and to make comparisons of suspended-sediment concentrations and loads between the Liberty site and the Old River Lake and Wallisville sites.
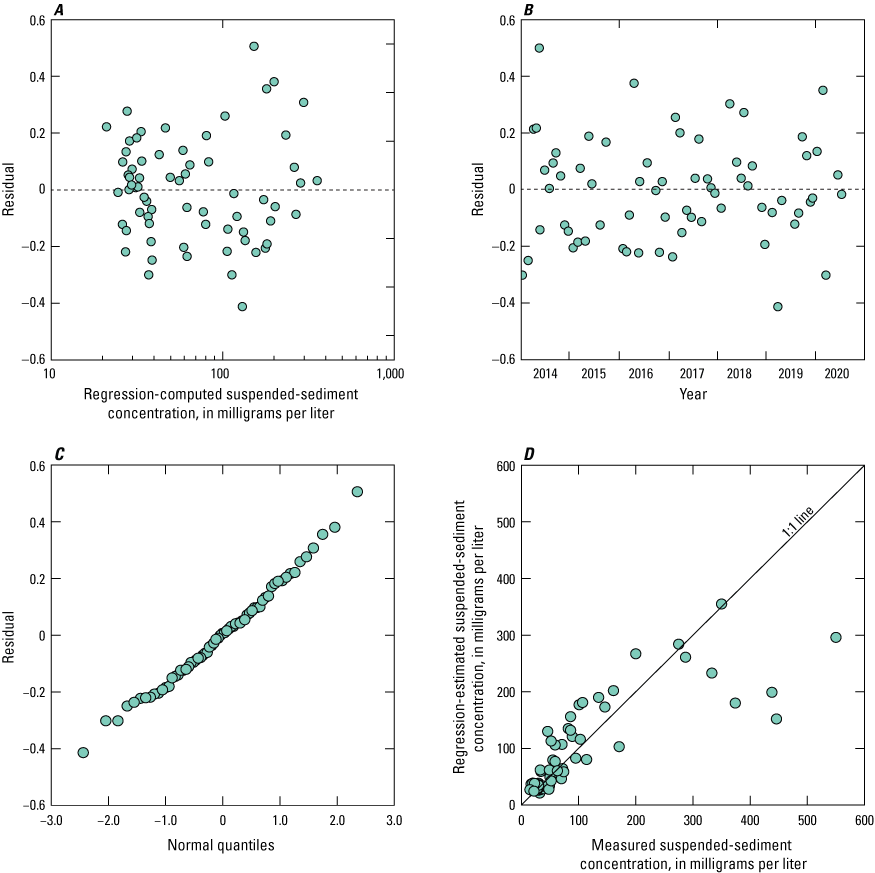
Regression diagnostics graphs showing A, residual variation over the range of computed suspended-sediment concentrations, B, residuals as a function of time, C, a normal probability plot, and D, estimated and measured suspended-sediment concentrations for a linear regression equation developed for U.S. Geological Survey monitoring station 08067000 Trinity River at Liberty, Texas, January 2014–July 2020.
Streamflow in the Lower Trinity River
Streamflow measured at the Goodrich site corresponds to outflow from Lake Livingston into the Trinity River. During 2016–19, large releases from Lake Livingston were maintained multiple times for extended periods. As a result of the large releases from Lake Livingston, the annual mean streamflows in 2016, 2018, and 2019 (18,420 ft3/s, 14,920 ft3/s, and 15,780 ft3/s, respectively) were all much greater than the long-term (1966–2019) mean annual streamflow of 8,610 ft3/s. In 2017, the annual mean streamflow was only 5,850 ft3/s; however, the second highest instantaneous peak streamflow (110,000 ft3/s) in the period of record (1966–2019) also was recorded in 2017, during Hurricane Harvey (August 25, 2017) (fig. 5A).
Daily mean streamflow at the Goodrich site ranged from 974 to 108,400 ft3/s. Daily mean streamflow at the Romayor site ranged from 953 to 92,800 ft3/s. Prior to 2018, streamflow records were only computed at the Liberty site when the streamflow was greater than 10,000 ft3/s; therefore, a minimum daily streamflow could not be determined at this site. The maximum daily mean streamflow at the Liberty site was 124,000 ft3/s. At the Wallisville site, daily mean streamflow ranged from −628 ft3/s (a reversal in flow direction caused by tidal influences) to 34,700 ft3/s.
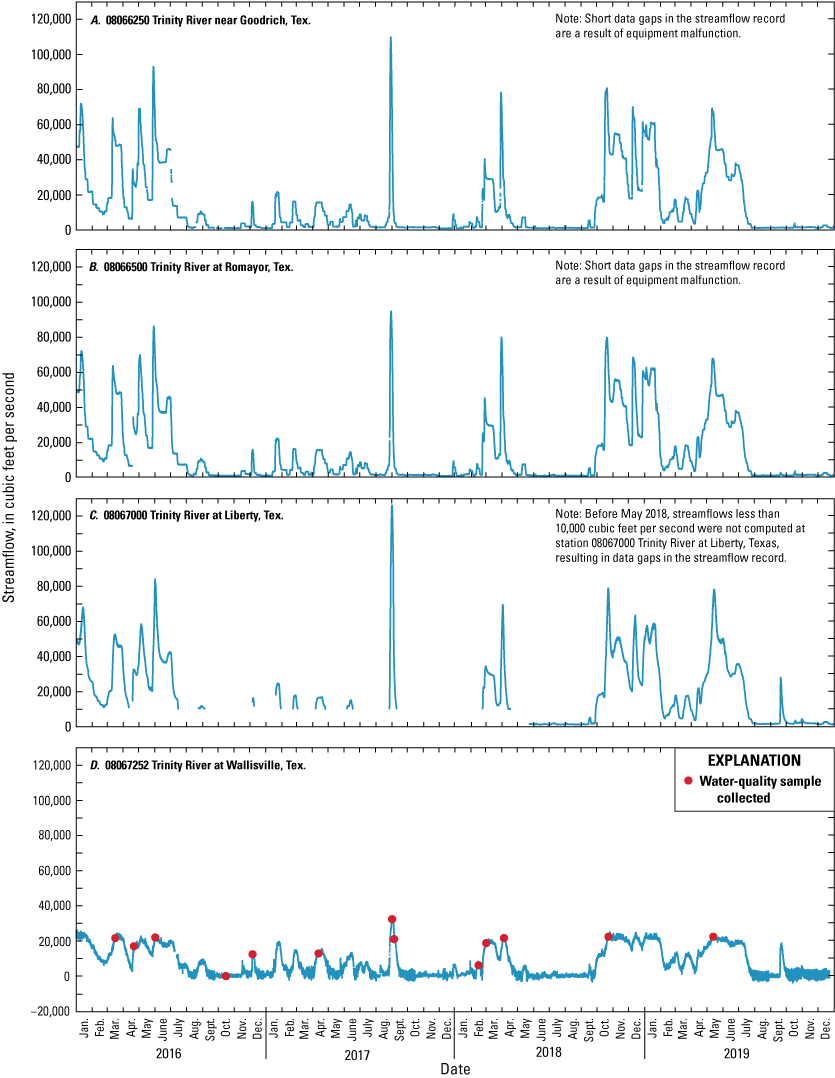
Instantaneous streamflow at U.S. Geological Survey monitoring stations in the lower Trinity River Basin, Texas, 2016–19. A, 08066250 Trinity River near Goodrich, Texas, B, 08066500 Trinity River at Romayor, Tex., C, 08067000 Trinity River at Liberty, Tex., and D, 08067252 Trinity River at Wallisville, Tex.
The hydrographs for the Goodrich, Romayor, and Liberty sites from January 2016 through December 2019 were similar (fig. 5A–C). Consistent with results documented by Lucena and Lee (2017), in 2016–19 only a part of the volume measured at Goodrich and Liberty sites was measured at the Wallisville site when streamflow exceeded approximately 20,000 ft3/s. During 2016–19, it was estimated that 39,400,000 acre-feet (acre-ft) of water flowed past the Goodrich site, compared to 40,200,000 acre-ft at the Romayor site, 38,700,000 acre-ft at the Liberty site, and 21,600,000 acre-ft at the Wallisville site. Only about 55 percent of the total water volume released from Lake Livingston during 2016–19 (as measured at the Goodrich site) was accounted for at the Wallisville site. Even with other potential sources and sinks for freshwater inflow that have not been accounted for as part of this study, it is likely that a portion of the remaining volume of water did not reach Galveston Bay through the main channel of the Trinity River because water was diverted into Old River Lake through the distributary channels, wetlands, and canals that branch off from the main channel of the Trinity River.
Distribution of Streamflow from the Trinity River into Old River Lake
To assess the distribution of streamflow and estimate the amount of water diverted from the main channel of the Trinity River into Old River Lake, discrete streamflow measurements were made at monitoring stations in the delta of the Trinity River (fig. 2) on 11 different days during a range of hydrologic conditions. Measurements were made when streamflows at the upstream Liberty site ranged from approximately 16,000 to 125,000 ft3/s (fig. 6; table 3).
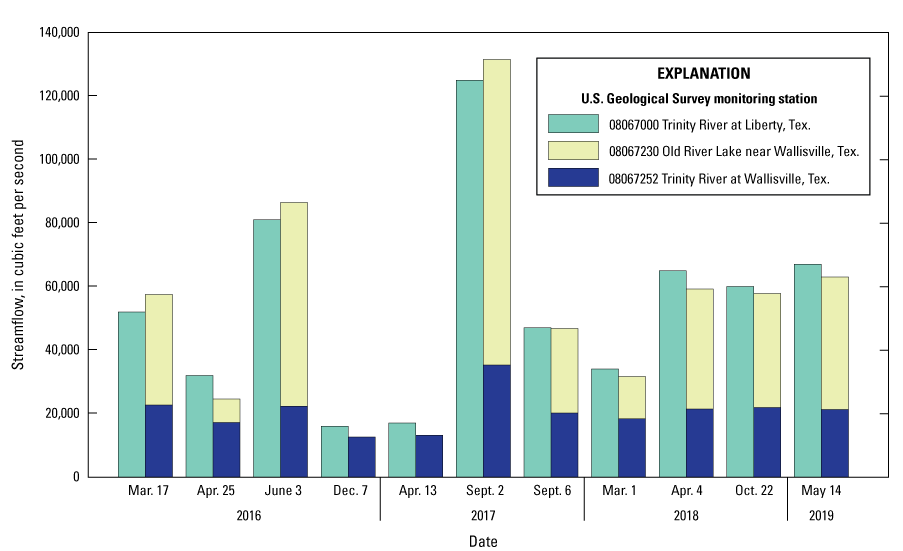
Instantaneous streamflow at U.S. Geological Survey monitoring stations 08067000 Trinity River at Liberty, Texas, 08067230 Old River Lake near Wallisville, Tex., and 0806752 Trinity River at Wallisville, Tex., during selected high-flow events.
Table 3.
Summary of computed and instantaneous streamflow measurements at U.S. Geological Survey monitoring stations in the lower Trinity River Basin, 2016–19.[Dates are in month/day/year format; ft3/s, cubic feet per second; NM, not measured; —, not calculated]
| Date | Streamflow (ft3/s) | Difference in streamflow between Liberty site and the sum of Wallisville site and Old River Lake site | Difference in streamflow between Wallisville site and Old River Cutoff site (ft3/s) |
||||||
|---|---|---|---|---|---|---|---|---|---|
| Short name for monitoring station (table 1) | |||||||||
| Liberty site1 | CWA Canal site | Wallisville site | Old River Lake site | Old River Cutoff site | Sum of Old River Lake and Wallisville sites | ft3/s | Percent | ||
| 3/17/2016 | 52,000 | 870 | 22,700 | 35,700 | 14,100 | 58,400 | 6,400 | 12.3 | 8,600 |
| 4/25/2016 | 32,000 | 850 | 17,200 | 7,350 | 11,200 | 24,550 | −7,450 | −23.3 | 6,000 |
| 6/3/2016 | 81,000 | 870 | 22,300 | 64,200 | 10,500 | 86,500 | 5,500 | 6.8 | 11,800 |
| 12/7/2016 | 16,000 | 780 | 12,600 | NM (tidal) | 9,920 | — | — | — | 2,680 |
| 4/13/2017 | 16,700 | 830 | 13,200 | NM (tidal) | 8,760 | — | — | — | 4,440 |
| 9/2/2017 | 125,000 | 840 | 35,300 | 97,100 | 15,500 | 132,400 | 7,400 | 5.9 | 19,800 |
| 9/6/2017 | 47,000 | 935 | 20,200 | 26,600 | 13,600 | 46,800 | −200 | −0.4 | 6,600 |
| 3/1/2018 | 34,000 | 775 | 18,400 | 13,200 | 13,400 | 31,600 | −2,400 | −7.1 | 5,000 |
| 4/4/2018 | 65,000 | 860 | 21,400 | 37,800 | 14,300 | 59,200 | −5,800 | −8.9 | 7,100 |
| 10/22/2018 | 60,000 | 945 | 21,800 | 35,900 | 14,100 | 57,700 | −2,300 | −3.8 | 7,700 |
| 5/14/2019 | 67,000 | 870 | 21,000 | 41,700 | 13,900 | 62,700 | −4,300 | −6.4 | 7,100 |
Two of the 11 days when discrete streamflow measurements were made were during low-flow events when streamflow at the Liberty site did not exceed approximately 16,700 ft3/s. The corresponding streamflows at the Old River Lake site remained influenced by flood tides resulting in a reversal in the direction of flow (negative streamflow value) at the time of the measurements. During the low-flow event measured on April 13, 2017, when the streamflow at the Liberty site was approximately 16,700 ft3/s, the streamflow at the Wallisville site was 13,200 ft3/s (fig. 7). This reduction of 3,500 ft3/s (21 percent) from the Liberty site downstream to the Wallisville site is consistent with streamflow losses reported by Lucena and Lee (2017) from the main channel of the Trinity River into distributary channels, wetlands, and canals that branch off from the main channel for a similar magnitude of streamflow. The CWA Canal is one of several canals in the study area that divert water from the Trinity River and the only canal where streamflow is measured. During the low-flow event measured on April 13, 2017, approximately 830 ft3/s was diverted from the Trinity River into the CWA Canal. The remaining volume of water (approximately 2,670 ft3/s) was likely diverted out of the main channel of the Trinity River into the various diversion pathways throughout the delta, but it was not large enough to attenuate the tidal-flow pattern typically observed in Old River Lake. A similar streamflow pattern was observed during another low-flow event on December 7, 2016, when streamflows at the Liberty and Wallisville sites were 16,000 ft3/s and 12,600 ft3/s, respectively, a difference of 3,400 ft3/s in streamflow between the two sites (where approximately 780 ft3/s was diverted into the CWA Canal). Even though not all freshwater outputs were quantified, it is likely that during low-flow events a portion of the water diverted out of the main channel of the Trinity River was stored in the channels, lakes, and wetlands in the delta of the Trinity River.
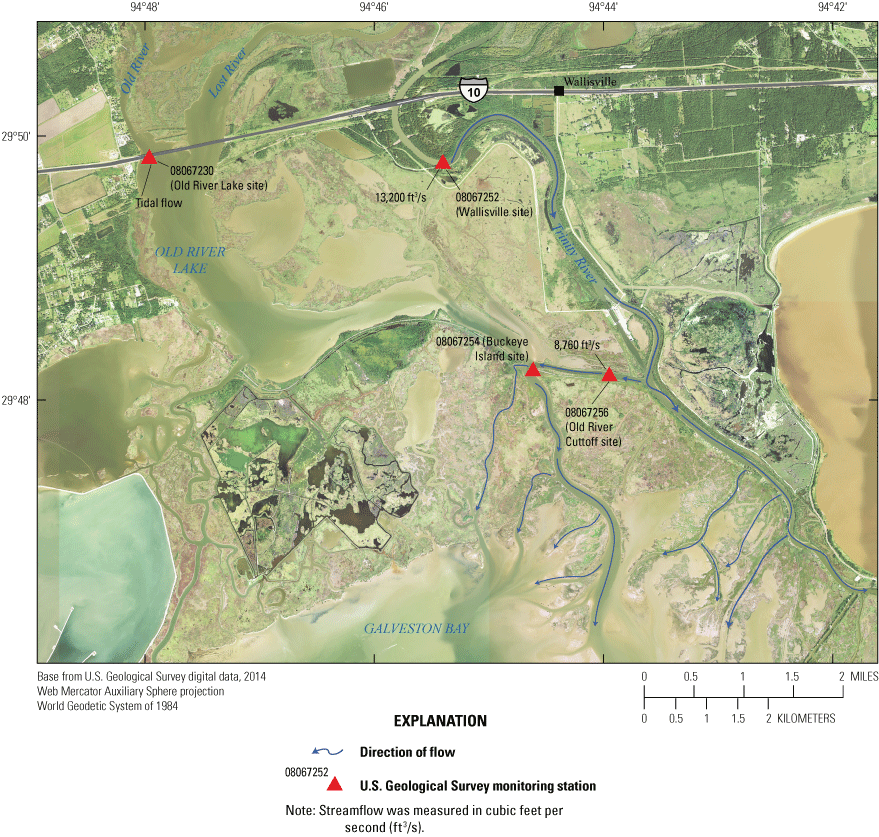
Direction of flow and instantaneous streamflows measured at U.S. Geological Survey monitoring stations 08067230 Old River Lake near Wallisville, Texas, 08067252 Trinity River at Wallisville, Tex., and 08067256 Old River Cutoff at Buckeye Island near Anahuac, Tex., on April 13, 2017.
During 9 of the 11 days when discrete streamflow measurements were made, streamflow at the Liberty site exceeded 30,000 ft3/s, and streamflow at the Old River Lake site was large enough to attenuate the tidal-flow patterns. During these high-flow events, the combined streamflow measured at the Old River Lake and Wallisville sites was of similar magnitude to the estimated streamflow at the Liberty site (fig. 6). For example, on June 3, 2016, the streamflow at the Wallisville site was 22,300 ft3/s, and streamflow at the Old River Lake site was 64,200 ft3/s (fig. 8), resulting in a total of 86,500 ft3/s when combined. The streamflow measured at the Liberty site was approximately 81,000 ft3/s, only 5,500 ft3/s (less than 7 percent) less than the combined streamflow at the Old River Lake and Wallisville sites; this small discrepancy is likely attributed to a combination of factors not measured as part of this study, such as measurement uncertainty and local surface runoff downstream from the Liberty site. In addition, about 870 ft3/s was diverted from the main channel of the Trinity River into the CWA Canal. Considering all pertinent streamflow data from June 3, 2016, approximately 74 percent of the estimated freshwater inflow of 86,500 ft3/s was measured at the Old River Lake site, and approximately 26 percent was measured in the main channel of the Trinity River.
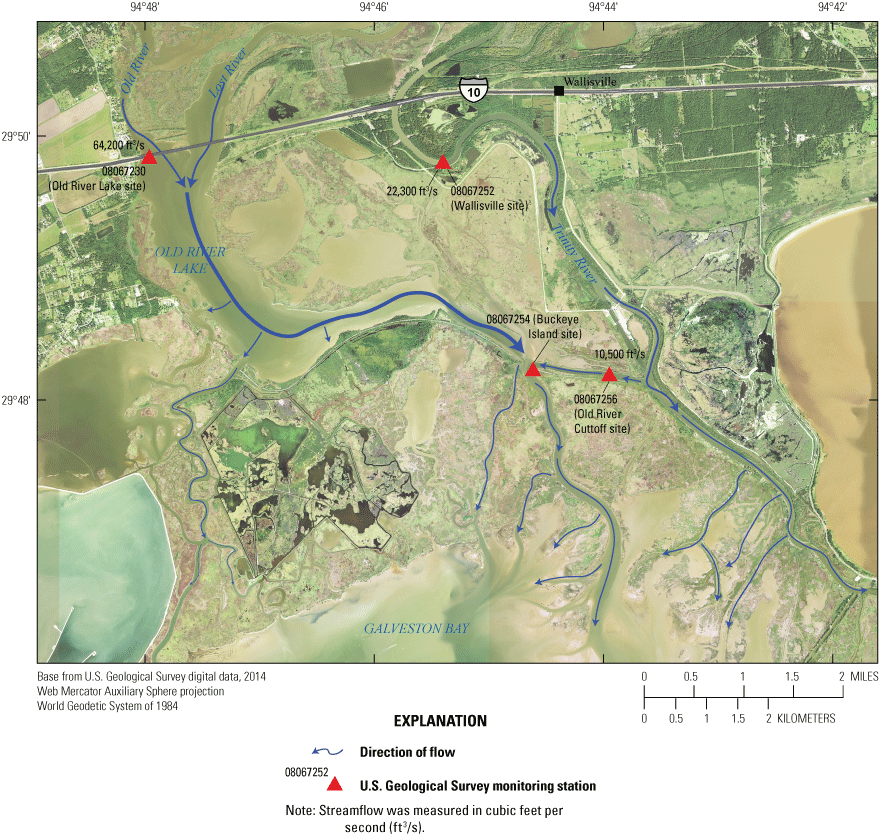
Direction of flow and streamflows measured at U.S. Geological Survey monitoring stations 08067230 Old River Lake near Wallisville, Texas, 08067252 Trinity River at Wallisville, Tex., and 08067256 Old River Cutoff at Buckeye Island near Anahuac, Tex., on June 3, 2016.
Data from discrete measurements made during the remaining high-flow events (fig. 6; table 3) indicate that a portion of the freshwater inflow, ranging from 30 to 74 percent of the total inflow, was delivered to Galveston Bay through pathways other than main channel of the Trinity River. Water that was diverted out of the main channel of the Trinity River south of Moss Bluff, Tex. (and was not stored or lost as a result of evapotranspiration, infiltration, or withdrawals) flowed into Old River Lake and ultimately into Galveston Bay through pathways that included the Old River and Lost River. As the magnitude of streamflow increased, the proportion of water diverted out of the main channel of the Trinity River also increased. During events when streamflow at the Liberty site exceeded approximately 40,000 ft3/s, the volume of freshwater traveling through Old River Lake exceeded the volume of water traveling through the main channel of the Trinity River. As a result, Old River Lake and its network of hydrologically connected channels likely became the primary pathways for freshwater inflow into Galveston Bay.
Distribution of Streamflow Downstream from the Old River Lake and Wallisville Sites
To assess the distribution of flow downstream from the Old River Lake and Wallisville sites, streamflow measurements were made at the Old River Cutoff site on 11 different days representing various hydrologic conditions (table 3). Results from these measurements indicate that the Old River Cutoff is a distributary stream that flows out of the Trinity River rather than a tributary stream that flows into the Trinity River. Approximately 3.5 miles downstream from the Wallisville site, a portion of the water from the main channel of the Trinity River flows into the Old River Cutoff and combines with Old River at the Buckeye Island site (figs. 7, 8). During the low-flow event measured on April 13, 2017, in which the streamflow at the Wallisville site was 13,200 ft3/s, the streamflow at the Old River Cutoff site was 8,760 ft3/s, approximately 66 percent of the total streamflow measured at the Wallisville site. Similarly, during the high-flow event on June 3, 2016, in which the streamflow at the Wallisville site was 22,300 ft3/s, the streamflow at the Old River Cutoff site was 10,500 ft3/s, approximately 47 percent of the total streamflow measured at the Wallisville site, flowing in the direction towards Old River Lake (fig. 7). During the measurements made between 2016 and 2019, including low-flow events, approximately 44 to 79 percent of the streamflow originating from the main channel in the lowermost reaches of the Trinity River traveled through the Old River Cutoff, mixed with the Old River at the Buckeye Island site, and then entered Galveston Bay through the distributaries and estuarine wetlands in the lower delta plain (fig. 8). The redistribution of streamflow into the Old River Cutoff is the consequence of sediment deposition in the form of a large shoal immediately downstream from the confluence between the Trinity River and the Old River Cutoff, which has caused a reduction of transport capacity in the main channel of the Trinity River (Letter and others, 2015). The Old River Cutoff (figs. 7, 8) has become the most hydraulically efficient pathway for inflow to Galveston Bay, and as the shoal continues to grow, the portion of streamflow that travels through the Old River Cutoff to Galveston Bay will likely increase, essentially making the Old River Cutoff the main pathway for inflow traveling from the main channel of the Trinity River into Galveston Bay (Letter and others, 2015).
Downstream from the confluence of the Trinity River and Old River Cutoff, the main channel of the Trinity River occasionally receives water from Lake Anahuac during localized runoff events in which water flows over the reservoir’s spillway. Because Lake Anahuac was not monitored as part of this study, its influence on freshwater, nutrient, and suspended-sediment delivery into Galveston Bay cannot be estimated. It is possible that its overall contribution of freshwater inflow into Galveston Bay is negligible when compared to the contributions of the main channel of the Trinity River and Old River Lake during high-flow events driven by Lake Livingston releases; however, during events primarily driven by local runoff, Lake Anahuac might be an important contributor of freshwater inflow into Galveston Bay. Additional data collected at this location during localized runoff events would allow for the quantification of Lake Anahuac’s contribution of freshwater inflow and associated sediment and nutrients into Galveston Bay.
Results indicate that even during low-flow events, the hydrologically connected wetlands, lakes, and distributary channels in the delta of the Trinity River play an important role in the delivery of freshwater inflow into Galveston Bay. During these low-flow events, Old River Lake (figs. 7, 8) and the surrounding wetlands likely provide storage for floodwaters, and the freshwater inflow to Galveston Bay is primarily delivered through the main channel of the Trinity River and the Old River Cutoff. During high-flow events, however, the Old River Lake and surrounding wetlands may be the primary pathways for freshwater inflow entering Galveston Bay through the delta of the Trinity River and not the main channel. Because the delta of the Trinity River is a dynamic system, water may be rerouted to other channels, causing the distribution of streamflow to continually change over time and continuously reshaping how freshwater inflow and associated sediment and nutrients are delivered to Galveston Bay.
Discrete Suspended-Sediment Concentrations and Loads
Suspended-sediment samples were collected at the Old River Lake and Wallisville sites on 13 different days between March 17, 2016, and May 14, 2019, during a range of hydrologic conditions (fig. 9A, table 1.3). Nine samples were collected during high-flow events when releases from Lake Livingston caused a rise in streamflow greater than 20,000 ft3/s at the Liberty site. Four samples were collected when streamflow at the Liberty site was less 20,000 ft3/s, including three samples that were collected during a low-flow event when releases from Lake Livingston caused a rise in streamflow at the Liberty site that did not exceed 20,000 ft3/s, and one sample that was collected during tidal-flow conditions when tides, instead of releases from Lake Livingston, dominated streamflow patterns in the lower Trinity River Basin; collectively these four samples are hereinafter referred to as samples representing “low-flow conditions.” Starting December 7, 2016, nine samples were also collected at the Buckeye Island site. The suspended-sediment concentrations and percentages of fine-sized particles (smaller than 0.0625 mm) measured in samples collected during 2016–19 at each monitoring station are included in table 1.3 and are available through NWIS (USGS, 2021).
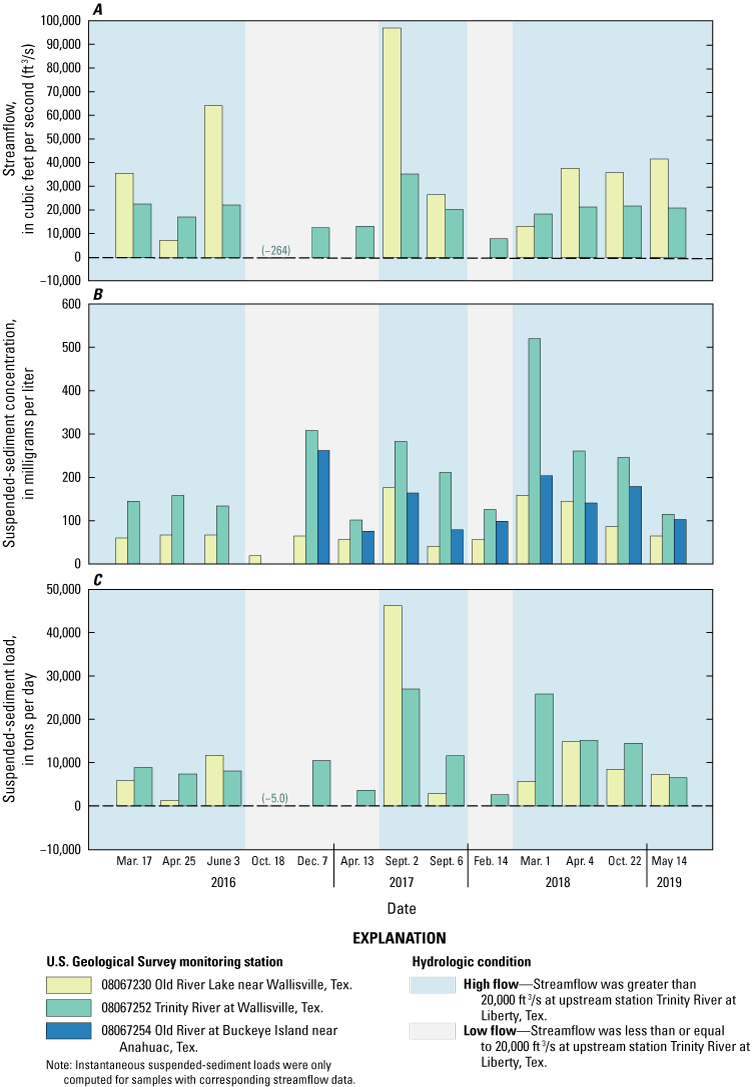
A, Streamflow, B, suspended-sediment concentrations, and C, daily suspended-sediment load associated with samples collected at U.S. Geological Survey monitoring stations 08067230 Old River Lake near Wallisville, Texas, 08067252 Trinity River at Wallisville, Tex., and 08067254 Old River at Buckeye Island near Anahuac, Tex., 2016–19.
The suspended-sediment concentrations were higher at the Wallisville site than at the Old River Lake site in 12 of the 13 samples collected (fig. 9B). Suspended-sediment concentrations are likely higher at the Wallisville site than at the Old River Lake site because of increased mobilization and resuspension of sediment particles at the Wallisville site associated with high water velocities. During high-flow events, mean water velocity ranged from 2.8 to 3.9 feet per second (ft/s) at the Wallisville site, whereas mean water velocity ranged from 0.4 to 2.1 ft/s at the Old River Lake site. At the Old River Lake site, these low water velocities would have allowed suspended sediment to settle, thus reducing concentrations. Suspended-sediment concentrations at the Buckeye Island site were typically greater than at the Old River Lake site, but lower than at the Wallisville site, likely because the Buckeye Island site represents a mixing point for water flowing from Old River Lake and the main channel of the Trinity River.
Water velocity also influences the size distribution of suspended-sediment particles. In a sand-bed river, such as the lower Trinity River, when water velocities increase, the percentage of sand-sized particles increases (Lucena and Lee, 2017). The concentrations of sand-sized particles were computed by multiplying the percentage of suspended-sediment particles larger than 0.0625 mm by the suspended-sediment concentration. Because water velocities are typically greater at the Wallisville site than at the Old River Lake site, the concentrations of sand-sized particles observed at the Wallisville site were greater than the concentrations of sand-sized particles observed at the Old River Lake site and ranged from less than (<) 1 to 265 mg/L at the Wallisville site compared to <1 to 74 mg/L at the Old River Lake site.
Instantaneous suspended-sediment loads were computed at the Old River Lake and Wallisville sites by multiplying the streamflows from discrete measurements by the corresponding concentrations from suspended-sediment samples (fig. 9A, B) and a conversion factor (0.0027) (Porterfield, 1972) to obtain suspended-sediment loads in tons per day, which are shown in figure 9C. At the Old River Lake site, instantaneous suspended-sediment loads were only available for samples collected during high-flow events, when high streamflows attenuated tidal-flow patterns (fig. 9A, C). Instantaneous suspended-sediment loads during high-flow events ranged from 6,510 to 26,900 tons per day at the Wallisville site and from 5,780 to 46,100 tons per day at the Old River Lake site. For six of the nine samples collected during high-flow events, suspended-sediment loads were higher at the Wallisville site than at the Old River Lake site. The suspended-sediment load at the Old River Lake site increased as streamflow increased, and when streamflow at the Old River Lake site exceeded 40,000 ft3/s, the suspended-sediment load at the Old River Lake site surpassed the suspended-sediment load at the Wallisville site. These results indicate that the Old River Lake plays an important role in transporting suspended sediment into Galveston Bay during high-flow events. When streamflows at the Liberty site exceeded approximately 20,000 ft3/s, Old River Lake became a secondary pathway for suspended-sediment delivery into Galveston Bay, but the main channel in the Trinity River remained the primary pathway. When streamflows at the Liberty site exceeded approximately 60,000 ft3/s, however, Old River Lake (and likely its distributary channels) may be the primary pathway for suspended-sediment delivery into Galveston Bay. The distribution of the large suspended-sediment loads associated with these high-flow events through Old River Lake is corroborated by the visible formation of the delta primarily where the Old River enters Galveston Bay instead of where the main channel of the Trinity River enters Galveston Bay (figs. 7, 8).
Regression-Computed Suspended-Sediment Daily Concentrations and Loads
Suspended-sediment concentrations were computed at the Liberty and Wallisville sites for the duration of 11 hydrologic events representing different streamflows by using the regression equations developed for each monitoring station. Suspended-sediment loads through an entire hydrologic event were computed by multiplying the regression-equation-derived suspended-sediment concentrations by the corresponding streamflow and a constant (0.000028) to convert the units to tons per 15 minutes (Porterfield, 1972). Daily suspended-sediment loads at the Liberty and Wallisville sites were computed by summing the tons-per-15-minute values. Daily suspended-sediment loads at the Liberty and Wallisville sites are depicted in appendix 2, along with instantaneous suspended-sediment loads computed from samples collected at the Old River Lake site during the high-flow events.
During all hydrologic events that were sampled, except during December 6–8, 2016, the computed daily mean suspended-sediment concentrations and total suspended-sediment loads were higher at the Liberty site than at the Wallisville site (table 4). During the high-flow event that started on March 9, 2016, and ended on April 10, 2016, mean suspended-sediment concentrations at the Liberty and Wallisville sites were 212 and 156 mg/L, respectively. Suspended-sediment loads at the Liberty and Wallisville sites followed a similar pattern throughout the high-flow event, but the daily suspended-sediment loads were consistently lower at the Wallisville site than at the Liberty site (fig. 2.1). The total sediment load at the Liberty site throughout the duration of the event was 65,100 tons, whereas the total sediment load at the Wallisville site was 9,200 tons, which is only approximately 14 percent of the sediment load measured at the Liberty site. Continuous monitoring was not done during March 9–April 10, 2016, at other locations along the lower Trinity River, including the Old River Lake site; therefore, accounting for the remaining approximately 86 percent of the sediment load remaining is not possible. However, suspended-sediment sample results indicate that at least a portion of the unmeasured sediment load is diverted into Old River Lake and associated distributary channels. Data from suspended-sediment samples collected March 17, 2016, indicate that the instantaneous suspended-sediment loads at the Old River Lake and Wallisville sites were 5,800 and 8,900 tons (fig. 9C), respectively, totaling 14,700 tons. On March 17, 2016, the estimated suspended-sediment load at the Liberty site was 36,400 tons, 60 percent greater than the combined suspended-sediment load computed from samples collected at the Old River Lake and Wallisville sites. This pattern of lower suspended-sediment loads at the Old River Lake and Wallisville sites compared to the Liberty site was observed during most events (app. 2). Overall, approximately 25 percent of the total sediment load measured during events at the Liberty site was measured at the Wallisville site, indicating that only a portion of the suspended-sediment load from the Liberty site reached Galveston Bay through the main channel of the Trinity River during the measured events, and that the lower Trinity River likely serves as a sink of suspended sediment. This stored suspended sediment may later be remobilized, allowing the system to adjust to localized sediment-load shortages when sediment supply from upstream reaches is low (Phillips and others, 2004).
Table 4.
Summary of suspended-sediment concentrations and loads computed by using regression equations for U.S. Geological Survey monitoring stations 08067000 Trinity River at Liberty, Texas, and 08067252 Trinity River at Wallisville, Tex., during selected hydrologic events, 2016–19.[Dates are in month/day/year format; mg/L, milligrams per liter]
A limitation of this study is that sediment load at the Old River Lake site, which is an important pathway for suspended sediment entering Galveston Bay at high flows, was not continuously quantified. Additional continuous monitoring data at the Old River Lake site could facilitate understanding the effects of sediment storage in the delta of the Trinity River on the quantity and timing of suspended-sediment delivery into Galveston Bay.
Water-Quality Conditions
Water-quality samples were collected, and physicochemical properties were measured at the Wallisville, Old River Lake, and Buckeye Island sites concurrently with collection of samples for suspended-sediment analysis. Results from physicochemical measurements and water-quality samples at each monitoring station are provided in tables 1.3 and 1.4. Summary statistics for physicochemical measurements and nutrient and suspended-sediment concentrations at each water-quality monitoring station are provided in table 5.
Table 5.
Summary statistics for physicochemical measurements, nutrient concentrations, and suspended-sediment characteristics in samples collected at U.S. Geological Survey monitoring stations 08067230 Old River Lake near Wallisville, Texas, 08067252 Trinity River at Wallisville, Tex., and 08067256 Old River Cutoff at Buckeye Island near Anahuac, Tex., 2016–19.[mg/L, milligrams per liter; µS/cm at 25 °C, microsiemens per centimeter at 25 degrees Celsius; °C, degrees Celsius; FNU, Formazin Nephelometric Units; N, nitrogen; <, less than; P, phosphorus; mm, millimeter]
Physicochemical Properties
Physicochemical properties of dissolved oxygen concentration, pH, specific conductance, water temperature, and turbidity were measured onsite during each sampling event of this study (table 1.3). The lowest dissolved oxygen concentrations were measured at all sites after Hurricane Harvey (August 2017) and ranged from 4.0 to 4.4 mg/L (table 5). During low-flow conditions on October 18, 2016, the specific conductance at the Old River Lake site was 9,470 microsiemens per centimeter at 25 degrees Celsius, a high value for the location, indicating an incoming tide at the time of sampling. A corresponding high specific conductance was not observed at the Wallisville site because the saltwater barrier operated by the U.S. Army Corps of Engineers approximately 2 river miles downstream from the Wallisville site prevents saltwater from entering the Trinity River.
The results from a one-way analysis of variance (ANOVA test; Helsel and others, 2020) for each parameter indicate that the means of the measured physicochemical properties were not significantly different (p-value greater than 0.05) between sites. Because physicochemical properties such as temperature and pH can affect the concentrations of nutrients, similarities in physicochemical properties between sites indicate that any potential differences in the concentrations of total or dissolved nutrients are likely not driven by these properties and might result from physical and biological processes, including sedimentation and biological uptake.
Nutrient Concentrations
Concentrations of ammonia, nitrate plus nitrite, nitrite, total nitrogen, total dissolved nitrogen, orthophosphate, and total phosphorus in samples collected at the Old River Lake, Wallisville, and Buckeye Island sites during 2016–19 are included in table 1.4.
Nitrogen Concentrations
Nitrate plus nitrite concentrations ranged from <0.040 to 0.663 mg/L at the Old River Lake site, from <0.040 to 0.658 mg/L at the Wallisville site, and from 0.122 to 0.673 mg/L at the Buckeye Island site (table 5; fig. 10A). Total dissolved nitrogen concentrations ranged from 0.40 to 1.20 mg/L at the Old River Lake site, from 0.38 to 1.11 mg/L at the Wallisville site, and from 0.50 to 1.10 mg/L at the Buckeye Island site (table 5; fig. 10B). Total nitrogen concentrations ranged from 0.62 to 1.19 mg/L at the Old River Lake site, 0.43 to 1.29 mg/L at the Wallisville site, and 0.73 to 1.29 mg/L at the Buckeye Island site (table 5: fig. 10C).
At the Old River Lake site, nitrate plus nitrite concentrations and total dissolved nitrogen concentrations were lower in samples collected during low-flow conditions than in samples collected during high-flow events (fig. 10A, B). For three of the four samples collected during low-flow conditions nitrate plus nitrite and total dissolved nitrogen concentrations at the Old River Lake site were less than those at the Wallisville site. These lower concentrations at the Old River Lake site may be associated with various physical and biogeochemical processes, including the transformation and biological uptake of nitrate, nitrite, and other species of nitrogen resulting from extended water residence times (Bowden, 1987; Jansson and others, 1994) and relatively small inputs of nitrogen during low-flow conditions (Lucena and Lee, 2017). Extended water residence times are not usually observed at the Wallisville site during low-flow conditions because of continuous releases from Lake Livingston. The releases may be a continuous source of nutrients in the main channel of the Trinity River during low-flow conditions and might also limit the potential for transformation and biological uptake that result in higher concentrations.
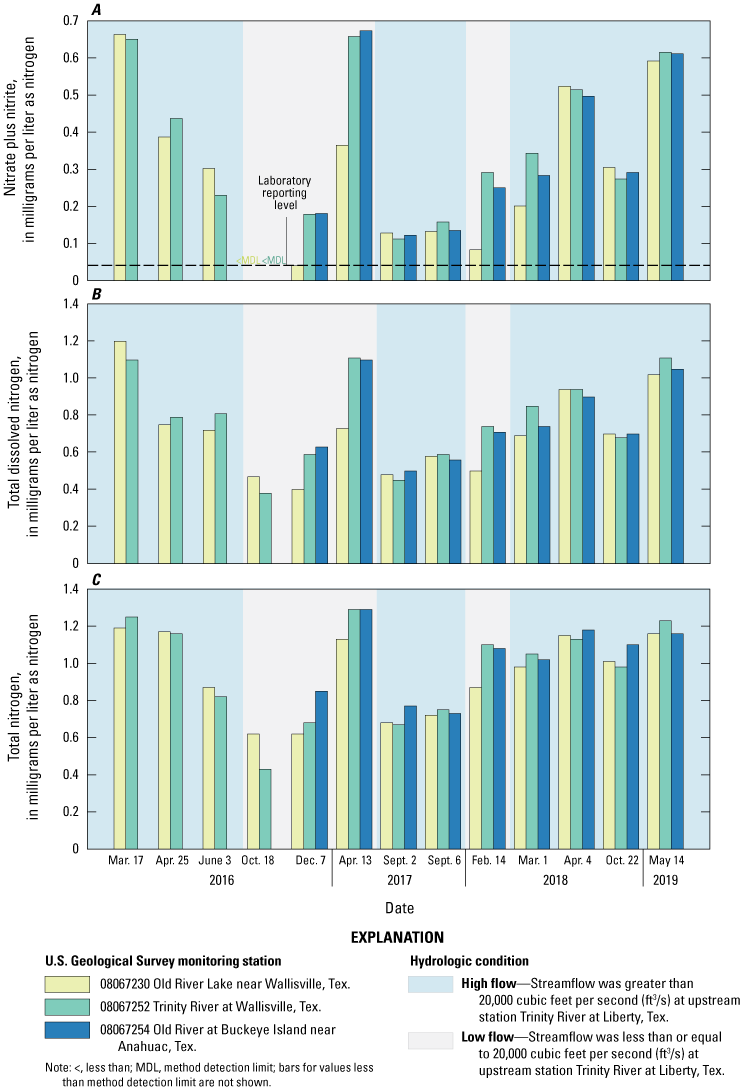
Concentrations of A, nitrate plus nitrite, B, total dissolved nitrogen, and C, total nitrogen in samples collected at U.S. Geological Survey monitoring stations 08067230 Old River Lake near Wallisville, Texas, 08067252 Trinity River at Wallisville, Tex., and 08067254 Old River at Buckeye Island near Anahuac, Tex., 2016–19.
Nitrate plus nitrite and total dissolved nitrogen concentrations were similar between the Wallisville and Buckeye Island sites and were generally higher in samples collected during high-flow events than during low-flow conditions. Total nitrogen concentrations were similar among the three sites for all samples (fig. 10C). For samples collected on September 2 and 6, 2017, concentrations of the three nitrogen species were the lowest among all samples collected during high-flow events. These samples were collected after the peak streamflow caused by Hurricane Harvey. Low concentrations in samples collected during these two dates may be attributed to various factors, including the timing of sample collection and the origin of the water flowing through the system. Because sample collection occurred after the peak streamflow (fig. 11), it is possible that some of the nitrogen mobilized during the storm had already been flushed into Galveston Bay. Also, during Hurricane Harvey, approximately 1,690,000 acre-ft of water were measured at the Liberty site, whereas 1,046,000 acre-ft of water (as measured from the Goodrich site) were released from Lake Livingston. This difference in water volumes between the Goodrich and Liberty sites indicates that approximately 38 percent (644,000 acre-ft) of the measured streamflow at the Liberty site originated predominantly from localized surface runoff. During most high-flow events in the lower Trinity River Basin, effects of localized runoff are typically minor when compared to the volumes of water released from Lake Livingston (Lucena and Lee, 2017). The large amount of localized surface runoff generated by Hurricane Harvey, however, may have affected nitrogen concentrations through dilution, resulting in nutrient concentrations that were less than those observed during high-flow events almost entirely driven by Lake Livingston releases.
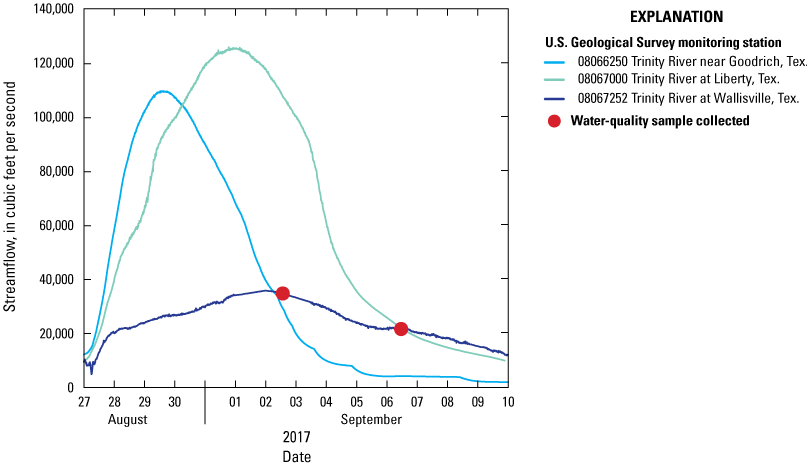
Instantaneous streamflow at U.S. Geological Survey monitoring stations 08066250 Trinity River near Goodrich, Texas, 08067000 Trinity River at Liberty, Tex., and 08067252 Trinity River at Wallisville, Tex., during Hurricane Harvey, August–September 2017.
To determine the effect streamflow variability may have on the relative amounts of ammonia, nitrate, nitrite, and organic nitrogen at each site, the percentage of the composition of each species of nitrogen was computed for each sample. Censored values for ammonia, nitrate, and nitrite were substituted by using one-half the method reporting limit, a widely used practice, albeit one that has no theoretical basis (Helsel, 1990; Helsel and others, 2020). Maximum likelihood and robust methods are recommended over simple substitution for censored values (Helsel and others, 2020); however, the chosen substitution method was used because censored results represent a relatively small percentage (less than 1 percent for ammonia and nitrite and less than 5 percent for nitrate) of the total nitrogen in each sample and thus do not appreciably affect the overall proportion of each species of nitrogen.
For most samples, organic nitrogen was the predominant nitrogen species, ranging from approximately 40 to 95 percent at the Old River Lake site, 46 to 94 percent at the Wallisville site, and 46 to 82 percent at the Buckeye Island site (fig. 12). Nitrate was the second most predominant nitrogen species, ranging from approximately 3 to 55 percent at the Old River Lake site, 5 to 52 percent at the Wallisville site, and 16 to 52 percent at the Buckeye Island site. The proportion of nitrite and ammonia ranged from approximately 0.1 to 2 percent and 0.1 to 7 percent, respectively, at all three sites.
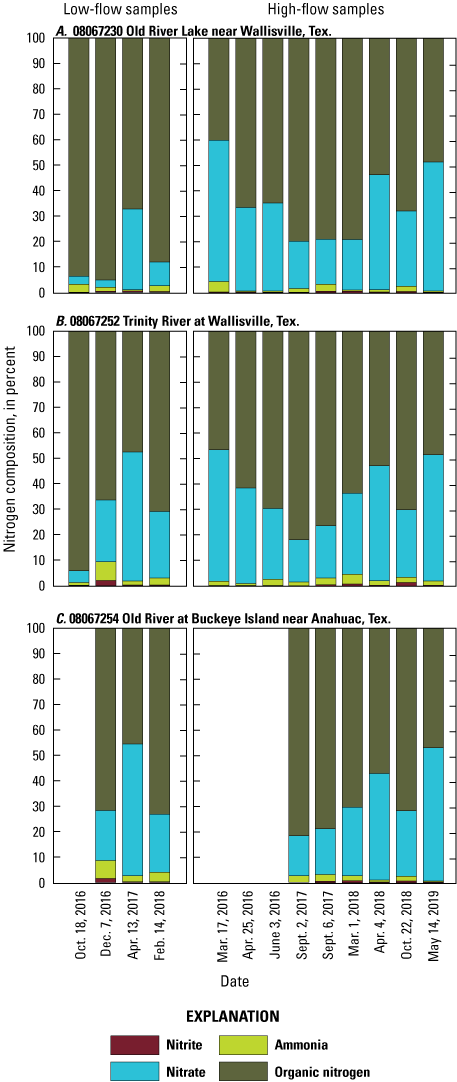
Percentages of nitrogen constituents in water-quality samples collected at U.S. Geological Survey monitoring stations A, 08067230 Old River Lake near Wallisville, Texas, B, 08067252 at Wallisville, Tex., and C, 08067254 Old River at Buckeye Island near Anahuac, Tex., 2016–19.
Lucena and Lee (2017) documented that increases in streamflow associated with Lake Livingston releases typically cause a decrease in the proportion of organic nitrogen and an increase in the proportion of nitrate at the Wallisville site. Shifts in the nitrogen composition are hypothesized to result from changes in the source of nitrogen inputs to the lower Trinity River, which include natural inputs derived from wetlands and forested areas as well as nitrogen from fertilizers carried in runoff in the upper Trinity River Basin. Similar shifts were also observed at the Old River Lake site (fig. 12A). During high-flow events, the proportions of each nitrogen species were similar among the three sites (fig. 12), indicating that the travel path through wetlands and channels surrounding Old River Lake likely does not affect the relative concentrations of the various nitrogen species present in freshwater inflow to Galveston Bay. It is possible that water residence times in Old River Lake during high-flow events are too short to allow transformation and biological uptake of nitrogen at appreciable levels. During low-flow conditions, the proportion of each nitrogen species varied among the three sites in response to the magnitude of the streamflow released from Lake Livingston. When releases from Lake Livingston were not large enough to influence the tidal flow at the Old River Lake and Wallisville sites, such as during October 18, 2016, the proportions of nitrogen species were similar between sites. However, when releases from Lake Livingston were large enough to attenuate tidal flow at the Wallisville site, but too small to divert water into Old River Lake, such as during December 7, 2016, the proportions of organic nitrogen and nitrate were considerably different between the Wallisville and the Old River Lake sites. Results indicate that, similar to the suspended-sediment distribution, the predominant source of the nitrate and organic nitrogen being delivered to Galveston Bay during low-flow conditions is the main channel of the Trinity River and that both the Old River Lake and the main channel of the Trinity River are pathways for nitrate and organic nitrogen entering Galveston Bay during high-flow events.
Phosphorus Concentrations
Total phosphorus concentrations ranged from 0.113 to 0.179 mg/L at the Old River Lake site, from 0.049 to 0.204 mg/L at the Wallisville site, and from 0.107 to 0.200 mg/L at the Buckeye Island site (table 5; fig. 13A). Orthophosphate concentrations ranged from 0.016 to 0.066 mg/L at the Old River Lake site, from 0.012 to 0.060 mg/L at the Wallisville site, and from 0.022 to 0.061 mg/L at the Buckeye Island site (table 5; fig. 13B).
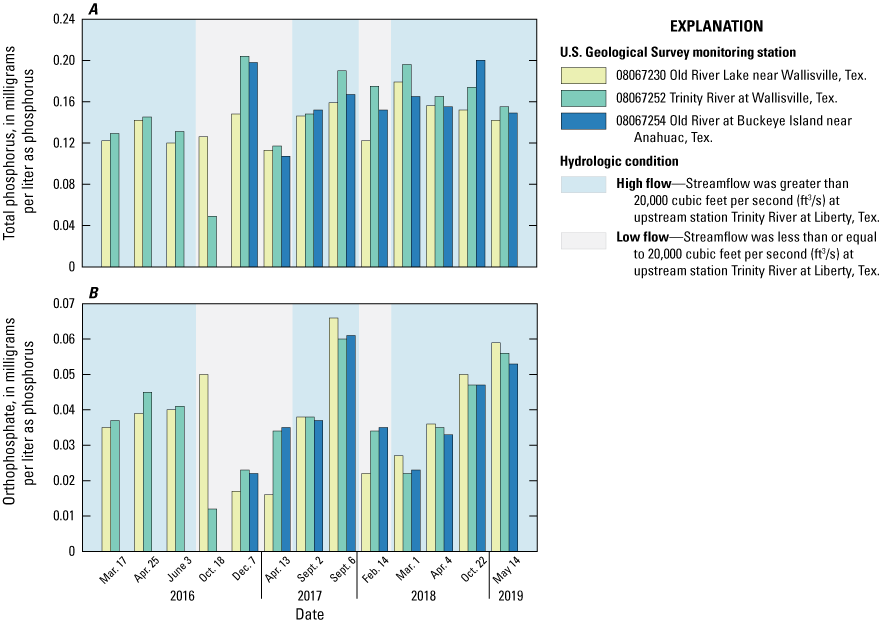
Concentrations of A, total phosphorus and B, orthophosphate in samples collected at U.S. Geological Survey monitoring stations 08067230 Old River Lake near Wallisville, Texas, 08067252 Trinity River at Wallisville, Tex., and 08067254 Old River at Buckeye Island near Anahuac, Tex., 2016–19.
Concentrations of total phosphorus and orthophosphate were lower at the Old River Lake site than at the Wallisville and Buckeye Island sites in three of the four samples collected during low-flow conditions (fig. 13A, B), possibly as a result of longer water residence times allowing a decrease in concentration associated with the settling of the carrier sediment and biological uptake of phosphorus. During the low-flow conditions on October 18, 2016, phosphorus concentrations at the Old River Lake site were at least two times greater than at the Wallisville site. This spike in phosphorus concentrations can likely be attributed to surface runoff from a localized precipitation event near Old River Lake that occurred during the week prior to sample collection (National Oceanic and Atmospheric Administration, 2021).
During high-flow events, concentrations of total phosphorus followed a similar pattern at the three monitoring stations (fig. 13A). This pattern of high total phosphorus concentrations during high-flow events is consistent with previous findings by Lucena and Lee (2017) in samples collected during 2014–16 at the Wallisville site. Total phosphorus concentrations increased proportionally with suspended-sediment concentrations, likely as a result of adsorption of dissolved phosphorus onto sediment particles. Because total phosphorus concentrations are normally closely tied to suspended-sediment concentrations in freshwater and estuarine systems (He and Xu, 2018), and because suspended-sediment concentrations are consistently lower at the Old River Lake site than at the Wallisville site, it would be reasonable to expect total phosphorus concentrations at the Old River Lake site to be less than those at the Wallisville site. However, during high-flow events, total phosphorus concentrations were similar at the Old River Lake and Wallisville sites. Phosphate sorption capacity decreases as particle size increases because fine-sized (smaller than 0.0625 mm in diameter) particles provide a larger surface area (Wang and others, 2006). The concentrations of total phosphorus may also be affected by the size distribution of suspended-sediment particles. At the Wallisville site, suspended-sediment concentrations were greater than at the Old River Lake site, but the proportion of fine-sized suspended-sediment particles ranged from 32 to 60 percent during high-flow events (table 1.4). At the Old River Lake and Buckeye Island sites, fine-sized sediment particles were predominant in all samples collected during high-flow events, ranging from 58 to 100 percent and from 79 to 88 percent, respectively (table 1.4). This variability in particle size distribution likely results in similar concentrations of total phosphorus among monitoring stations during high-flow events. At all monitoring stations, total phosphorus concentrations increased as the concentration of fine-sized particles increased (fig. 14). When fitting a linear regression equation to the data points from each monitoring station, the resulting slopes were similar (0.00033 to 0.00044), indicating that total phosphorus concentrations at the observed range increase at a similar rate at each site in response to an increase in concentrations of fine-sized particles. Because total phosphorus concentrations are closely tied to the fine-sized suspended-sediment concentrations, the main channel of the Trinity River and Old River Lake are likely important sources of phosphorus during high-flow events.
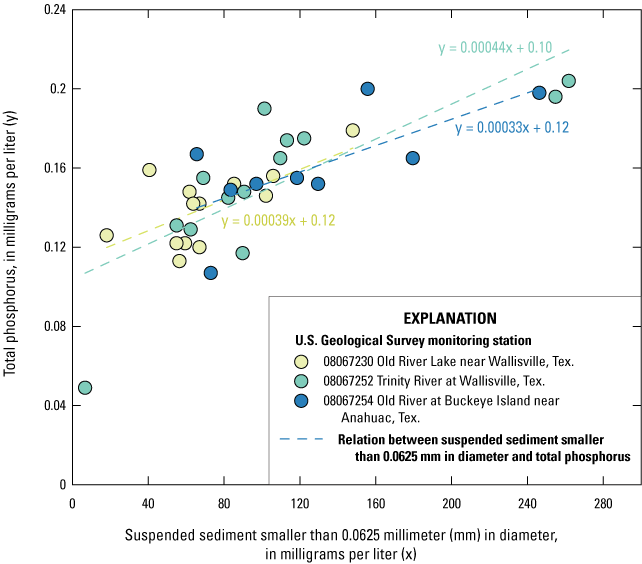
Relation between fine-sized suspended-sediment concentrations and total phosphorus in samples collected at U.S. Geological Survey monitoring stations 08067230 Old River Lake near Wallisville, Texas, 08067252 Trinity River at Wallisville, Tex., and 08067254 Old River at Buckeye Island near Anahuac, Tex., 2016–19.
Nutrient Loads
Instantaneous loads of each constituent were computed at the Old River Lake and the Wallisville sites when samples had a corresponding streamflow measurement and reported constituent concentrations that were greater than the method detection limit. To obtain the load amount, in tons per day, the constituent concentration was multiplied by the corresponding instantaneous streamflow and a conversion factor (0.0027) (Porterfield, 1972) (fig. 15).
Instantaneous loads of all nutrients were higher at the Old River Lake site than at the Wallisville site during seven of the nine high-flow events (fig. 15). Concentrations at the two sites were similar, but streamflow was substantially higher at the Old River Lake site. During the remaining two high-flow events (April 25, 2016, and March 1, 2018), nitrogen and phosphorus loads were lower at the Old River Lake site than at the Wallisville site, resulting from lower streamflow and concentrations at the Old River Lake site and indicating that the roles of the main channel of the Trinity River and the Old River Lake in nitrogen and phosphorus delivery to Galveston Bay are likely tied to the magnitude of the event. When streamflows at the Liberty site were less than approximately 20,000 ft3/s, the main channel of the Trinity River was the primary pathway for nitrogen and phosphorus to Galveston Bay. However, once streamflow at the Liberty site exceeded 20,000 ft3/s, the contribution of nutrient loading through Old River Lake to Galveston Bay increased proportionally to the nutrient loading in the main channel; when streamflow at the Liberty site exceeded approximately 50,000 ft3/s, Old River Lake likely became the primary pathway for nutrient delivery into Galveston Bay.
The characterization of the role that the Old River Lake plays in nutrient delivery to Galveston Bay described in this report is based on a few discrete samples representing suspended-sediment and nutrient loads on specific days. Additional continuous monitoring data at the Old River Lake site would allow for a more complete assessment of how the diversion of freshwater into Old River Lake affects the quantity and timing of nutrients entering Galveston Bay from the Trinity River.
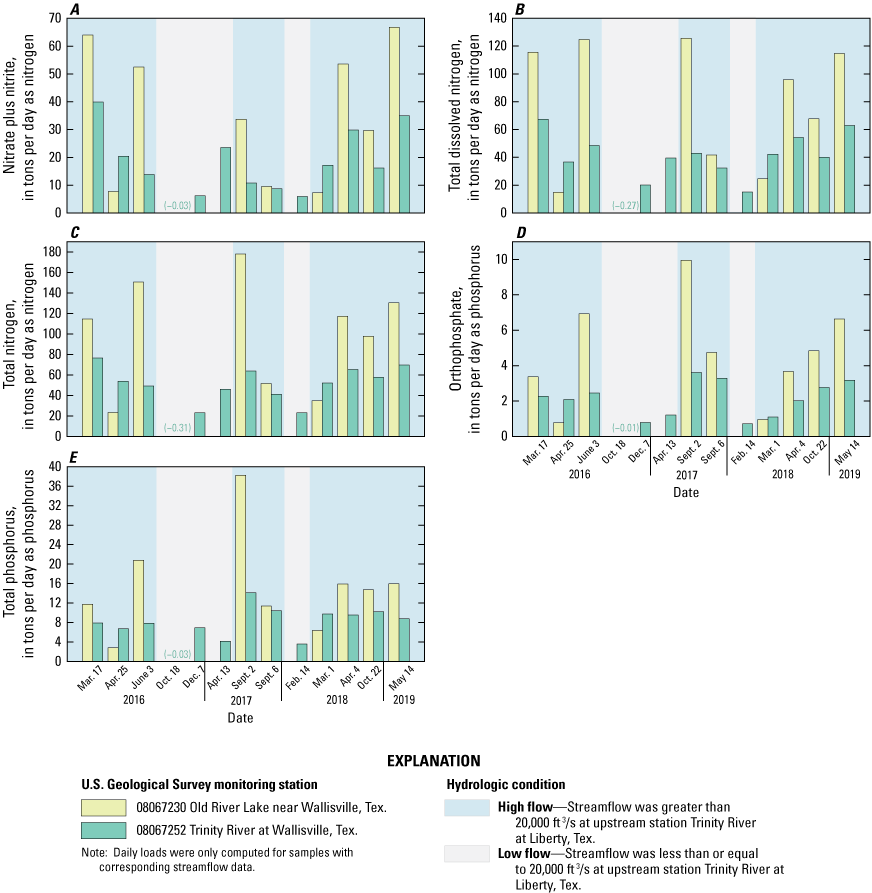
Computed loads of A, nitrate plus nitrite, B, total dissolved nitrogen, C, total nitrogen, D, orthophosphate, and E, total phosphorus, associated with samples collected at U.S. Geological Survey monitoring stations 08067230 Old River Lake near Wallisville, Texas, and 08067252 Trinity River at Wallisville, Tex., 2016–19.
Summary
The U.S. Geological Survey (USGS), in cooperation with the Texas Water Development Board, collected streamflow and water-quality data at USGS monitoring stations in the lower Trinity River Basin from January 2016 to December 2019 to characterize the distribution of streamflow, nutrients, and suspended sediment entering Galveston Bay from the Trinity River. Results from previous studies indicate that water from the main channel of the Trinity River is likely diverted into surrounding wetlands and water bodies and is stored or discharged directly into Galveston Bay through distributary channels in the delta. This study provides an assessment of the distribution of streamflow in the various channels that form the delta of the Trinity River to evaluate the effect of streamflow diversions on the eventual supply of freshwater inflow, nutrients, and suspended sediment to Galveston Bay.
Instantaneous streamflow data and continuous streamflow records from USGS monitoring stations in the delta of the Trinity River were used to quantify freshwater inflow into Galveston Bay and to assess the distribution of streamflow in the delta of the Trinity River Basin. In this report, periods in which releases from Lake Livingston caused a rise in streamflow farther downstream at USGS station 08067000 Trinity River at Liberty, Tex. (hereinafter referred to as the “Liberty site”) that did not exceed 20,000 cubic feet per second (ft3/s) are referred to as “low-flow events,” and periods in which streamflow at the Liberty site exceeded 20,000 ft3/s are referred to as “high-flow events.”
Based on streamflow records at USGS station 08066250 Trinity River near Goodrich, Tex., daily mean outflow from Lake Livingston Dam into the lower Trinity River ranged from 974 to 108,400 ft3/s during 2016–19. During this study, it was estimated that only about 55 percent of the total water volume released from Lake Livingston was accounted for at USGS station 08067252 Trinity River at Wallisville, Tex. (hereinafter referred to as the “Wallisville site”), which is approximately 8 river miles upstream from where the Trinity River enters Galveston Bay. The difference in water volumes between what is released from Lake Livingston and what is measured at the Wallisville site is consistent with findings from previous studies and indicates that a large part of the volume released from Lake Livingston does not reach Galveston Bay through the main channel of the Trinity River.
To assess the distribution of streamflow and estimate the amount of water diverted from the main channel of the Trinity River into distributary channels, instantaneous streamflow measurements were made at USGS station 08067230 Old River Lake near Wallisville, Tex. (hereinafter referred to as the “Old River Lake site”) and Wallisville site on 11 different days during a range of hydrologic conditions. Streamflow measured at the Old River Lake site during high-flow events corresponds to the approximate total streamflow diverted from the main channel of the Trinity River farther upstream into distributaries. Data from streamflow measurements made during the high-flow events indicate that a portion of the freshwater inflow, ranging from 30 to 74 percent of the total inflow, was likely delivered to Galveston Bay through pathways other than the main channel of the Trinity River, including Old River Lake. As the magnitude of streamflow increased, the proportion of water diverted out of the main channel of the Trinity River also increased. When streamflow at the Liberty site, located upstream from the Wallisville site, exceeded approximately 40,000 ft3/s, Old River Lake and its network of hydrologically connected channels likely became the primary pathway for freshwater inflow entering Galveston Bay.
To assess the distribution of streamflow downstream from the Old River Lake and Wallisville sites, streamflow measurements were made at station 08067256 Old River Cutoff at Buckeye Island near Anahuac, Tex. (hereinafter referred to as the “Old River Cutoff site”) on the same days when measurements were made at the Old River Lake and Wallisville sites. During these measurements, approximately 44 to 79 percent of the streamflow originating from the main channel in the lowermost reaches of the Trinity River traveled through the Old River Cutoff, mixed with the Old River at USGS station 08067254 Old River at Buckeye Island near Anahuac, Tex. (hereinafter referred to as the “Buckeye Island site”), and then entered Galveston Bay through the distributaries and estuarine wetlands in the lower delta plain. These results indicate that the Old River Cutoff is currently the main pathway for inflow traveling from the main channel of the Trinity River into Galveston Bay. Because the delta of the Trinity River is a dynamic system, water may be rerouted to other channels, causing the distribution of streamflow to change over time, continuously reshaping how freshwater inflow is delivered to Galveston Bay.
Water quality was characterized from discrete samples collected during a range of hydrologic conditions at the Old River Lake, Wallisville, and Buckeye Island sites in order to evaluate the effects of streamflow diversions on the supply of suspended sediment and nutrients into Galveston Bay. Most of the water-quality samples were collected during high-flow events. However, a small number of samples were collected when the streamflow at the Liberty site was less 20,000 ft3/s, including low-flow events and periods of tidal-flow conditions, referred to as “low-flow conditions.”
Data from suspended-sediment samples collected at the Old River Lake, Wallisville, and Buckeye Island sites were used to evaluate the effects of the distribution of streamflow in the delta of the Trinity River on sediment loading into Galveston Bay. Suspended-sediment concentrations were typically higher at the Wallisville site than at the Old River Lake site, likely because of increased mobilization and resuspension of sediment particles at the Wallisville site associated with high water velocities. During high-flow events, mean water velocity ranged from 2.8 to 3.9 feet per second (ft/s) at the Wallisville site, whereas mean water velocity ranged from 0.4 to 2.1 ft/s at the Old River Lake site. At the Old River Lake site, these low water velocities would have allowed suspended sediment to settle, thus reducing concentrations. Suspended-sediment concentrations at the Buckeye Island site were typically greater than at the Old River Lake site, but less than at the Wallisville site, likely because the Buckeye Island site represents a mixing point for water flowing from Old River Lake and the main channel of the Trinity River. Suspended-sediment loads were also typically higher at the Wallisville site than at the Old River Lake site during high-flow events. However, when streamflows at the Liberty site exceeded approximately 60,000 ft3/s, suspended-sediment loads were higher at the Old River Lake, likely becoming the primary pathway for suspended-sediment delivery into Galveston Bay.
Continuous suspended-sediment loads at the Wallisville and Liberty sites were calculated for the duration of 11 hydrologic events representing different streamflows by using regression equations developed for each monitoring station. Overall, approximately 25 percent of the total suspended-sediment load measured at the Liberty site was measured at the Wallisville site, indicating that only a small portion of the suspended-sediment load from the Liberty site reached Galveston Bay during these events. Based on data from discrete samples, some of this sediment load was diverted into Old River Lake and associated distributary channels.
Results from analysis of nutrient samples indicate that streamflow conditions influence nitrogen concentrations in the delta of the Trinity River. At the Old River Lake site, nitrate plus nitrite and total dissolved nitrogen concentrations were lower during low-flow conditions than during high-flow events. Lower concentrations of nitrate plus nitrite, and total dissolved nitrogen at the Old River Lake site may be associated with various physical and biogeochemical processes, including the transformation and biological uptake of nitrate, nitrite, and other species of nitrogen resulting from extended water residence times and relatively small inputs of nitrogen from the upstream reaches of the Trinity River Basin. During high-flow events, the proportions of each nitrogen species were similar among the three sites, indicating that the travel path through wetlands and channels surrounding Old River Lake likely does not affect the relative concentrations of the various nitrogen species present in freshwater inflow to Galveston Bay. It is possible that water residence times during high-flow events are too short to allow transformation and biological uptake of nitrogen at appreciable levels.
Concentrations of total phosphorus and orthophosphate were lower at the Old River Lake site than at the Wallisville and Buckeye Island sites in three of the four samples collected during low-flow conditions, possibly as a result of longer water residence times allowing a decrease in concentration associated with the settling of the carrier sediment and biological uptake of phosphorus. During high-flow events, concentrations of total phosphorus followed a similar pattern at the three monitoring stations. At all monitoring stations, total phosphorus concentrations increased as the concentration of fine-sized sediment particles increased. Because total phosphorus concentrations are closely tied to the fine-sized suspended-sediment concentrations, the main channel of the Trinity River and Old River Lake are likely important pathways for phosphorus during high-flow events.
Results from analysis of nutrient samples also indicate that the pathways for nutrient delivery from the Trinity River into Galveston Bay are dependent on event magnitude. When streamflows at the Liberty site were low (approximately less than 20,000 ft3/s), the main channel of the Trinity River was the primary pathway for nitrogen and phosphorus entering Galveston Bay. Once streamflow at the Liberty site exceeded 20,000 ft3/s, however, the contribution of nutrient loading through Old River Lake to Galveston Bay increased proportionally to the nutrient loading in the main channel, and when streamflow at the Liberty site exceeded approximately 50,000 ft3/s, Old River Lake likely became the primary pathway for nutrient delivery into Galveston Bay.
The estimates of the distribution of streamflow, nutrients, and sediment among the channels in the lower Trinity River Basin included in this report are limited by the inability to quantify all factors influencing gains and losses within the Trinity River Basin (such as surface runoff, inputs from ungaged tributaries, withdrawals, and evapotranspiration), but estimates indicate that Old River Lake is an important pathway for freshwater, suspended sediment, and nutrients entering Galveston Bay during low-flow conditions and high-flow events. The characterization of the role that the Old River Lake plays in suspended-sediment and nutrient delivery to Galveston Bay described in this report is based on a few discrete samples representing suspended-sediment and nutrient loads on specific days. Additional continuous monitoring data at the Old River Lake site would allow for a more complete assessment of how the diversion of freshwater into Old River Lake affects the quantity and timing of suspended-sediment and nutrients entering Galveston Bay from the Trinity River.
References Cited
Anderson, J.B., Rodriguez, A.B., Milliken, K.T., and Taviani, M., 2008, The Holocene evolution of the Galveston estuary complex, Texas—Evidence for rapid change in estuarine environments, in Response of upper Gulf Coast estuaries to Holocene climate change and sea-level rise: Geological Society of America Special Paper, v. 443, p. 89–104, accessed September 21, 2021, at https://doi.org/10.1130/2008.2443(06).
Bowden, W.B., 1987, The biogeochemistry of nitrogen in freshwater wetlands: Biogeochemistry, v. 4, no. 3, p. 313–348, accessed September 28, 2021, at https://doi.org/10.1007/BF02187373.
Copeland, B.J., 1966, Effects of decreased river flow on estuarine ecology: Water Pollution Control Federation, v. 38, no. 11, p. 1831–1839, accessed September 21, 2021, at https://www.jstor.org/stable/25035675.
Duan, N., 1983, Smearing estimate—A nonparametric retransformation method: Journal of the American Statistical Association, v. 78, no. 383, p. 605–610, accessed October 6, 2021, at https://www.jstor.org/stable/2288126.
Edwards, T.K., and Glysson, G.D., 1999, Field methods for measurement of fluvial sediment: U.S. Geological Survey Techniques of Water-Resource Investigations, book 3, chap. C2, 89 p., accessed October 6, 2021, at https://doi.org/10.3133/twri03C2.
Fishman, M.J., ed., 1993, Methods of analysis by the U.S. Geological Survey National Water Quality Laboratory—Determination of inorganic and organic constituents in water and fluvial sediments: U.S. Geological Survey Open-File Report 93–125, 217 p., accessed October 6, 2021, at https://doi.org/10.3133/ofr93125.
Foreman, W.T., Williams, T.L., Furlong, E.T., Hemmerle, D.M., Stetson, S.J., Jha, V.K., Noriega, M.C., Decess, J.A., Reed-Parker, C., and Sandstrom, M.W., 2021, Comparison of detection limits estimated using single- and multi-concentration spike-based and blank-based procedures: Talanta, v. 228, article 122139, 15 p., accessed October 6, 2021, at https://doi.org/10.1016/j.talanta.2021.122139.
Glysson, D.G., 1987, Sediment-transport curves: U.S. Geological Survey Open-File Report 87–218, 47 p., accessed October 6, 2021, at https://doi.org/10.3133/ofr87218.
Guy, H.P., 1969, Laboratory theory and methods for sediment analysis: U.S. Geological Survey Techniques of Water-Resources Investigations, book 5, chap. C1, 58 p., accessed October 6, 2021, at https://doi.org/10.3133/twri05C1.
He, S., and Xu, Y.J., 2018, Phosphorus fluxes from three coastal watersheds under varied agriculture intensities to the northern Gulf of Mexico: Water (Basel), v. 10, no. 6, article 816, accessed October 7, 2021, at https://doi.org/10.3390/w10060816.
Helsel, D.R., 1990, Less than obvious—Statistical treatment of data below the detection limit: Environmental Science & Technology, v. 24, no. 12, p. 1766–1774, accessed October 6, 2021, at https://doi.org/10.1021/es00082a001.
Helsel, D.R., Hirsch, R.M., Ryberg, K.R., Archfield, S.A., and Gilroy, E.J., 2020, Statistical methods in water resources: U.S. Geological Survey Techniques and Methods, book 4, chapter A3, 458 p., accessed October 6, 2021, at https://doi.org/10.3133/tm4A3.
Hirsch, R.M., 1979, An evaluation of some record reconstruction techniques: Water Resources Research, v. 15, no. 6, p. 1781–1790. [Also available at https://doi.org/10.1029/WR015i006p01781.]
Hoitink, A.J.F., and Jay, D.A., 2016, Tidal river dynamics—Implications for deltas: Reviews of Geophysics, v. 54, no. 1, p. 240–272, accessed October 6, 2021, at https://doi.org/10.1002/2015RG000507.
Houston Advanced Research Center, 2020, State of the bay—A characterization of the Galveston Bay ecosystem (4th ed.): Houston, Texas, Texas Commission on Environmental Quality, accessed September 28, 2021, at https://stateofgalvbay.org.
Jansson, M., Andersson, R., Berggren, H., and Leonardson, L., 1994, Wetlands and lakes as nitrogen traps: Ambio, v. 23, no. 6, p. 320–325, accessed October 6, 2021, at https://www.jstor.org/stable/4314231.
Land, L.F., Moring, J.B., Van Metre, P.C., Reutter, D.C., Mahler, B., Shipp, A.A., and Ulery, R.L., 1999, Water quality in the Trinity River Basin, Texas, 1992–95: U.S. Geological Survey Circular 1171, 44 p., accessed October 6, 2021, at https://doi.org/10.3133/cir1171.
Landers, M.N., Straub, T.D., Wood, M.S., and Domanski, M.M., 2016, Sediment acoustic index method for computing continuous suspended-sediment concentrations: U.S. Geological Survey Techniques and Methods, book 3, chap. C5, 63 p., accessed October 6, 2021, at https://doi.org/10.3133/tm3C5.
Lee, M.T., 2010, A preliminary evaluation of Trinity River sediment and nutrient loads into Galveston Bay, Texas, during two periods of high flow, in Second Joint Federal Interagency Conference, Las Vegas, Nevada, June 27–July 1, 2010, Proceedings: Ninth Federal Interagency Sedimentation Conference and Fourth Federal Interagency Hydrologic Modeling Conference, 12 p., accessed September 17, 2021, at https://acwi.gov/sos/pubs/2ndJFIC/Contents/4B_Lee_20100226.pdf.
Letter, J.V., Jr., Brown, G.L., McAdory, R., and Pratt, T.C., 2015, Numerical modeling of Trinity River shoaling below Wallisville, Texas: U.S. Army Corps of Engineers, Engineer Research and Development Center, Coastal and Hydraulics Laboratory TR-15-1, 184 p., accessed October 6, 2021, at https://usace.contentdm.oclc.org/digital/collection/p266001coll1/id/3671/.
Levesque, V.A., and Oberg, K.A., 2012, Computing discharge using the index velocity method: U.S. Geological Survey Techniques and Methods, book 3, chap. A23, 148 p., accessed October 6, 2021, at https://doi.org/10.3133/tm3A23.
Long, G.L., and Winefordner, J.D., 1983, Limit of detection—A closer look at the IUPAC definition: Analytical Chemistry, v. 55, no. 7, p. 712A–724A, accessed October 6, 2021, at https://doi.org/10.1021/ac00258a724.
Longley, W.L., ed., 1994, Freshwater inflows to Texas bays and estuaries—Ecological relationships and methods for determination of needs: Texas Water Development Board and Texas Parks and Wildlife Department, 386 p., accessed October 6, 2021, at https://www.twdb.texas.gov/publications/reports/other_reports/doc/FreshwaterInflowstoTexasBays.pdf.
Lucena, Z., and Lee, M.T., 2017, Characterization of streamflow, suspended sediment, and nutrients entering Galveston Bay from the Trinity River, Texas, May 2014–December 2015: U.S. Geological Survey Scientific Investigations Report 2016–5177, 37 p., https://doi.org/10.3133/sir20165177.
McEwen, M.C., 1969, Sedimentary facies of the modern Trinity delta, chap. 3 of Lanlford, R.R., and Rogers, J.J.W., eds., Holocene geology of the Galveston Bay area: Houston Geological Society, p. 53–77, accessed October 7, 2021, at https://archives.datapages.com/data/hgssp/data/018/018001/53_hgs0180053.htm.
Mitsch, W.J., and Gosselink, J.G., 2000, The value of wetlands—Importance of scale and landscape setting: Ecological Economics, v. 35, no. 1, p. 25–33. [Also available at https://doi.org/10.1016/S0921-8009(00)00165-8.]
Montagna, P., Vaughan, B., and Ward, G., 2011, The importance of freshwater inflows to Texas estuaries, chap. 6 of Griffin, R.C., ed., Water policy in Texas—Responding to the rise of scarcity: Washington, D.C., The RFF Press, p. 107–127. [Also available at https://doi.org/10.4324/9781936331888.]
Mueller, D.K., Schertz, T.L., Martin, J.D., and Sandstrom, M.W., 2015, Design, analysis, and interpretation of field quality-control data for water-sampling projects: U.S. Geological Survey Techniques and Methods, book 4, chap. C4, 54 p., accessed October 6, 2021, at https://doi.org/10.3133/tm4C4.
Mueller, D.S., Wagner, C.R., Rehmel, M.S., Oberg, K.A., and Rainville, F., 2013, Measuring discharge with acoustic Doppler current profilers from a moving boat (ver. 2.0, December 2013): U.S. Geological Survey Techniques and Methods, book 3, chap. A22, 95 p., accessed October 6, 2021, at https://doi.org/10.3133/tm3A22.
National Oceanic and Atmospheric Administration, 2021, Radar data (ver. 3.0): National Centers for Environmental Information web page, accessed October 7, 2021, at https://www.ncei.noaa.gov/maps/radar/.
Patton, C.J., and Kryskalla, J.R., 2003, Methods of analysis by the U.S. Geological Survey National Water Quality Laboratory—Evaluation of alkaline persulfate digestion as an alternative to Kjeldahl digestion for determination of total and dissolved nitrogen and phosphorus in water: U.S. Geological Survey Water-Resources Investigations Report 03–4174, 33 p., accessed October 7, 2021, at https://doi.org/10.3133/wri034174.
Patton, C.J., and Kryskalla, J.R., 2011, Colorimetric determination of nitrate plus nitrite in water by enzymatic reduction, automated discrete analyzer methods: U.S. Geological Survey Techniques and Methods, book 5, chap. B8, 34 p., accessed October 7, 2021, at https://doi.org/10.3133/tm5B8.
Phillips, J.D., and Slattery, M.C., 2007, Downstream trends in discharge, slope, and stream power in a lower coastal plain river: Journal of Hydrology (Amsterdam), v. 334, no. 1–2, p. 290–303, accessed October 7, 2021, at https://doi.org/10.1016/j.jhydrol.2006.10.018.
Phillips, J.D., Slattery, M.C., and Musselman, Z.A., 2004, Dam-to-delta sediment inputs and storage in the lower Trinity River, Texas: Geomorphology, v. 62, no. 1–2, p. 17–34, accessed October 7, 2021, at https://doi.org/10.1016/j.geomorph.2004.02.004.
Porterfield, G., 1972, Computation of fluvial-sediment discharge: Techniques of Water-Resources Investigations of the U.S. Geological Survey, book 3, chap. C3, 66 p., accessed October 7, 2021, at https://doi.org/10.3133/twri03C3.
Powell, G.L., Matsumoto, J., and Brock, D.A., 2002, Methods for determining minimum freshwater inflow needs of Texas bays and estuaries: Estuaries, v. 25, no. 6, p. 1262–1274, accessed October 7, 2021, at https://doi.org/10.1007/BF02692223.
Rantz, S.E., and others, 1982a, Measurement and computation of streamflow—Volume 1. Measurement of stage and discharge: U.S. Geological Survey Water-Supply Paper 2175, 284 p., accessed October 7, 2021, at https://doi.org/10.3133/wsp2175.
Rantz, S.E., and others, 1982b, Measurement and computation of streamflow—Volume 2. Computation of discharge: U.S. Geological Survey Water-Supply Paper 2175, 631 p., accessed October 7, 2021, at https://doi.org/10.3133/wsp2175.
Rasmussen, P.P., Gray, J.R., Glysson, G.D., and Ziegler, A.C., 2009, Guidelines and procedures for computing time-series suspended-sediment concentrations and loads from in-stream turbidity-sensor and streamflow data: U.S. Geological Survey Techniques and Methods, book 3, chap. C4, 52 p., accessed October 7, 2021, at https://doi.org/10.3133/tm3C4.
Rebich, R.A., Houston, N.A., Mize, S.V., Pearson, D.K., Ging, P.B., and Evan Hornig, C., 2011, Sources and delivery of nutrients to the northwestern Gulf of Mexico from streams in the south‐central United States: Journal of the American Water Resources Association, v. 47, no. 5, p. 1061–1086, accessed October 7, 2021, at https://doi.org/10.1111/j.1752-1688.2011.00583.x.
Rus, D.L., Patton, C.J., Mueller, D.K., and Crawford, C.G., 2013, Assessing total nitrogen in surface-water samples—Precision and bias of analytical and computational methods: U.S. Geological Survey Scientific Investigations Report 2012–5281, 38 p., accessed October 7, 2021, at https://doi.org/10.3133/sir20125281.
Sauer, V.B., and Turnipseed, D.P., 2010, Stage measurement at gaging stations: U.S. Geological Survey Techniques and Methods, book 3, chap. A7, 45 p., accessed October 7, 2021, at https://doi.org/10.3133/tm3A7.
Texas Department of Water Resources, 1981, Trinity-San Jacinto Estuary—A study of the influence of freshwater inflows: Texas Department of Water Resources, 491 p., accessed October 7, 2021, at http://hdl.handle.net/2152/4048.
Texas Water Development Board [TWDB], 2006, Volumetric survey of Lake Anahuac—April 2006 survey: Texas Water Development Board, accessed October 6, 2021, at https://www.twdb.texas.gov/surfacewater/surveys/completed/list/index.asp#anahuac.
Texas Water Development Board [TWDB], 2019, 2021 Regional water plan—Population and water demand projections, accessed March 4, 2021, at https://www.twdb.texas.gov/waterplanning/data/projections/2022/demandproj.asp.
Trinity River Authority of Texas, 2021, Trinity River Basin master plan: Trinity River Authority of Texas web page, accessed October 7, 2021, at https://storymaps.arcgis.com/stories/435a1188d8f3425da9721308d90a7f2d.
Trinity River Authority of Texas, 2022, Lake Livingston: Trinity River Authority of Texas web page, accessed February 3, 2022, at https://www.trinityra.org/lake_information/water_storage/lake_livingston/index.php.
U.S. Environmental Protection Agency, 1993, Method 365.1—Determination of phosphorus by semi-automated colorimetry, revision 2.0: U.S. Environmental Protection Agency, 17 p., accessed May 12, 2021, at https://www.epa.gov/sites/production/files/2015-08/documents/method_365-1_1993.pdf.
U.S. Geological Survey [USGS], 2021, USGS water data for Texas, in USGS water data for the Nation: U.S. Geological Survey National Water Information System database, accessed October 7, 2021, at https://doi.org/10.5066/F7P55KJN. [Information directly accessible at https://waterdata.usgs.gov/tx/nwis/nwis.]
U.S. Geological Survey [USGS], [variously dated], National field manual for the collection of water-quality data: U.S. Geological Survey Techniques of Water-Resources Investigations, book 9, chaps. A1–A10, accessed May 12, 2021, at https://doi.org/10.3133/twri09.
Van Metre, P.C., and Reutter, D.C., 1995, Water-quality assessment of the Trinity River Basin, Texas—Analysis of available information on nutrients and suspended sediment, 1974–91: U.S. Geological Survey Water-Resources Investigations Report 94–4086, 79 p., accessed October 7, 2021, at https://doi.org/10.3133/wri944086.
Wang, S., Jin, X., Bu, Q., Zhou, X., and Wu, F., 2006, Effects of particle size, organic matter and ionic strength on the phosphate sorption in different trophic lake sediments: Journal of Hazardous Materials, v. 128, no. 2–3, p. 95–105, accessed October 7, 2021, at https://doi.org/10.1016/j.jhazmat.2005.07.048.
YSI Incorporated, 2012, 6-Series multiparameter water quality sonde user manual, Revision J: YSI Incorporated, 379 p., accessed February 15, 2022, at https://www.ysi.com/file%20library/documents/manuals/069300-ysi-6-series-manual-revj.pdf.
Zedler, J.B., and Kercher, S., 2005, Wetland resources—Status, trends, ecosystem services, and restorability: Annual Review of Environment and Resources, v. 30, p. 39–74, accessed October 7, 2021, at https://doi.org/10.1146/annurev.energy.30.050504.144248.
Zimmerman, C.F., Keefe, C.W., and Bashe, J., 1997, Method 440.0—Determination of carbon and nitrogen in sediments and particulates of estuarine/coastal waters using elemental analysis, revision 1.4: Cincinnati, Ohio, U.S. Environmental Protection Agency, Office of Research and Development, 10 p., accessed April 5 2021, at https://cfpub.epa.gov/si/si_public_record_report.cfm?Lab=NERL&dirEntryId=309418.
Appendix 1. Supplemental Information
Table 1.1.
Nutrient and suspended-sediment data from quality-control replicate samples collected at U.S. Geological Survey monitoring stations 08067230 Old River Lake near Wallisville, Texas, and 08067252 Trinity River at Wallisville, Tex.[Dates are in month/day/year format; hr, hour; CST, central standard time; mg/L, milligrams per liter; N, nitrogen; P, phosphorus; mm, millimeter; E, estimated; —, not available, RPD, relative percent difference; <, less than]
Table 1.2.
Calibration dataset used to develop a suspended-sediment regression equation for U.S. Geological Survey monitoring station 08067000 Trinity River at Liberty, Texas.[Dates are in month/day/year format; SSC, suspended-sediment concentration; ft3/s, cubic feet per second; log10, base-10 logarithm; mg/L, milligrams per liter]
Data are also available from the U.S. Geological Survey (USGS) National Water Information System (USGS, 2021).
Streamflows estimated from streamflow data collected at USGS station 08066500 Trinity River at Romayor, Texas by using the drainage-area method (Hirsch, 1979).
Table 1.3.
Physicochemical properties measured at U.S. Geological Survey monitoring stations 08067230 Old River Lake near Wallisville, Texas, 08067252 Trinity River at Wallisville, Tex., and 08067254 Old River at Buckeye Island near Anahuac, Tex., 2016–19.[Dates are in month/day/year format; mg/L, milligrams per liter; µS/cm at 25 °C, microsiemens per centimeter at 25 degrees Celsius; °C, degrees Celsius; LED, light-emitting diode; nm, nanometer; FNU, Formazin Nephelometric Units —, no data]
Table 1.4.
Results from water-quality samples collected at U.S. Geological Survey monitoring stations 08067230 Old River Lake at Wallisville, Texas, 08067252 Trinity River at Wallisville, Tex., and 08067254 Old River at Buckeye Island near Anahuac, Tex., 2016–19.[Dates are in month/day/year format; mg/L, milligrams per liter; N, nitrogen; P, phosphorus; mm, millimeter; —, no data; <, less than]
References Cited
Hirsch, R.M., 1979, An evaluation of some record reconstruction techniques: Water Resources Research, v. 15, no. 6, p. 1781–1790. [Also available at https://doi.org/10.1029/WR015i006p01781.]
U.S. Geological Survey [USGS], 2021, USGS water data for Texas, in USGS water data for the Nation: U.S. Geological Survey National Water Information System database, accessed October 7, 2021, at https://doi.org/10.5066/F7P55KJN. [Information directly accessible at https://waterdata.usgs.gov/tx/nwis/nwis.]
Appendix 2. Computed and Instantaneous Suspended-Sediment Loads at Selected U.S. Geological Survey Monitoring Stations in the Lower Trinity River Basin During High-Flow Events, 2016–19
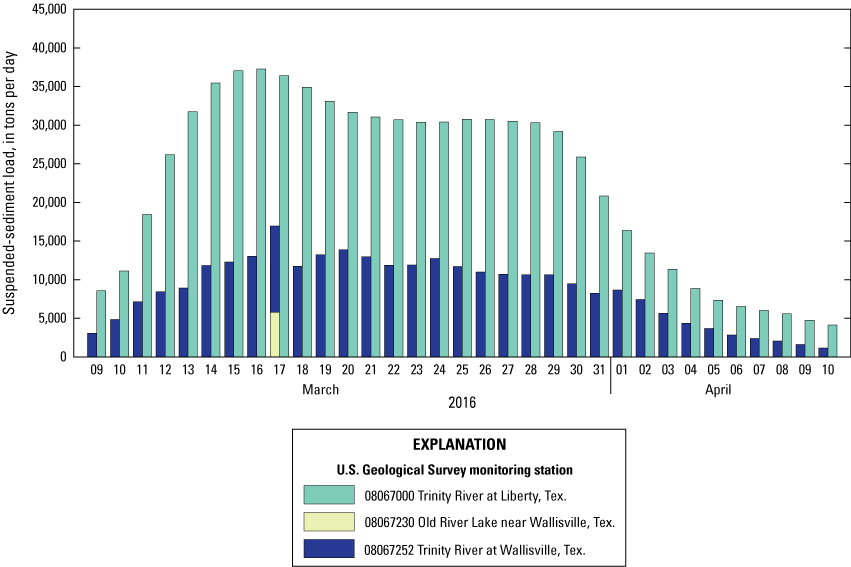
Estimated daily total suspended-sediment loads at U.S. Geological Survey monitoring stations 08067000 Trinity River at Liberty, Texas, and 08067252 Trinity River at Wallisville, Tex., and instantaneous suspended-sediment loads at U.S. Geological Survey monitoring station 08067230 Old River Lake near Wallisville, Tex., during March 9–April 10, 2016.
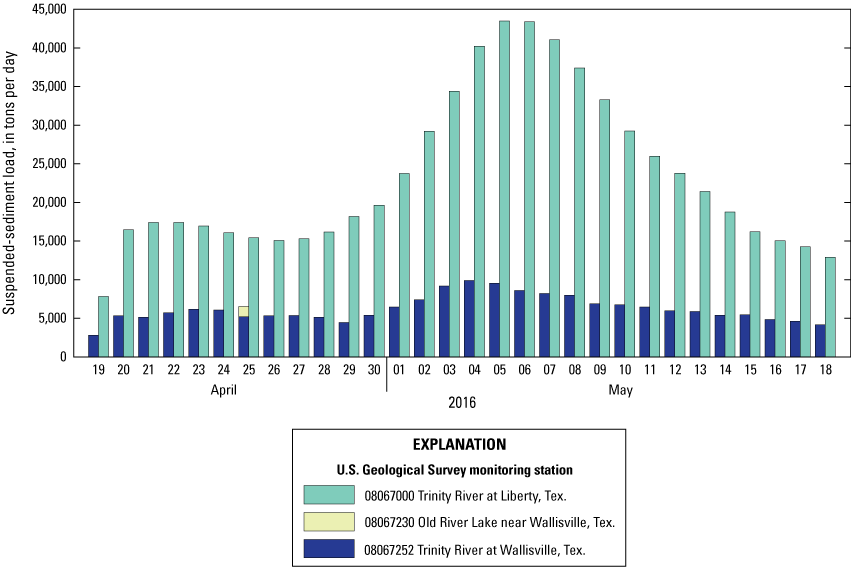
Estimated daily total suspended-sediment loads at U.S. Geological Survey monitoring stations 08067000 Trinity River at Liberty, Texas, and 08067252 Trinity River at Wallisville, Tex., and instantaneous suspended-sediment loads at U.S. Geological Survey monitoring station 08067230 Old River Lake near Wallisville, Tex., during April 18–May 18, 2016.
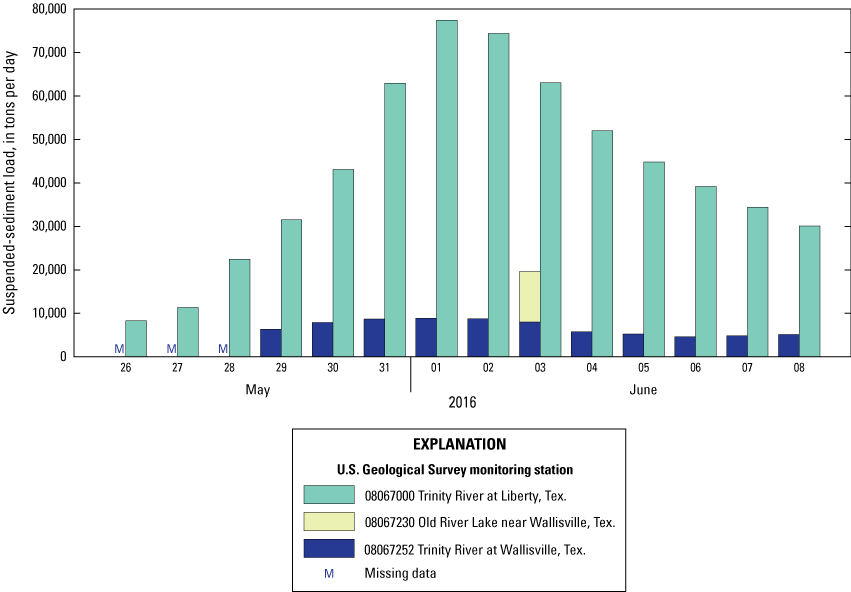
Estimated daily total suspended-sediment loads at U.S. Geological Survey monitoring stations 08067000 Trinity River at Liberty, Texas, and 08067252 Trinity River at Wallisville, Tex., and instantaneous suspended-sediment loads at U.S. Geological Survey monitoring station 08067230 Old River Lake near Wallisville, Tex., during May 26–June 8, 2016.
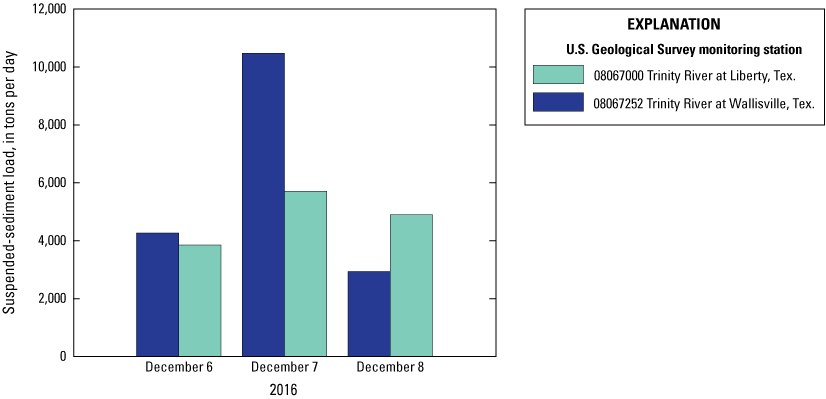
Estimated daily total suspended-sediment loads at U.S. Geological Survey monitoring stations 08067000 Trinity River at Liberty, Texas, and 08067252 Trinity River at Wallisville, Tex., during December 6–8, 2016.
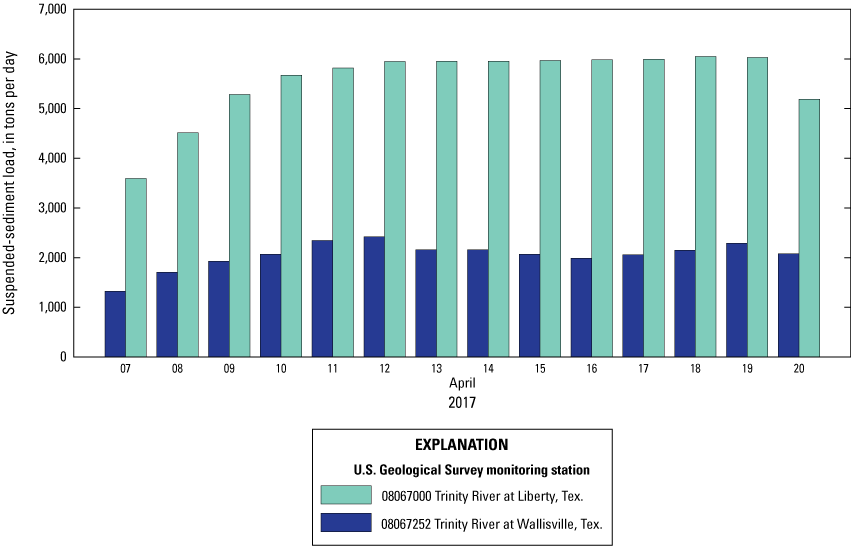
Estimated daily total suspended-sediment loads at U.S. Geological Survey monitoring stations 08067000 Trinity River at Liberty, Texas, and 08067252 Trinity River at Wallisville, Tex., during April 7–20, 2017.
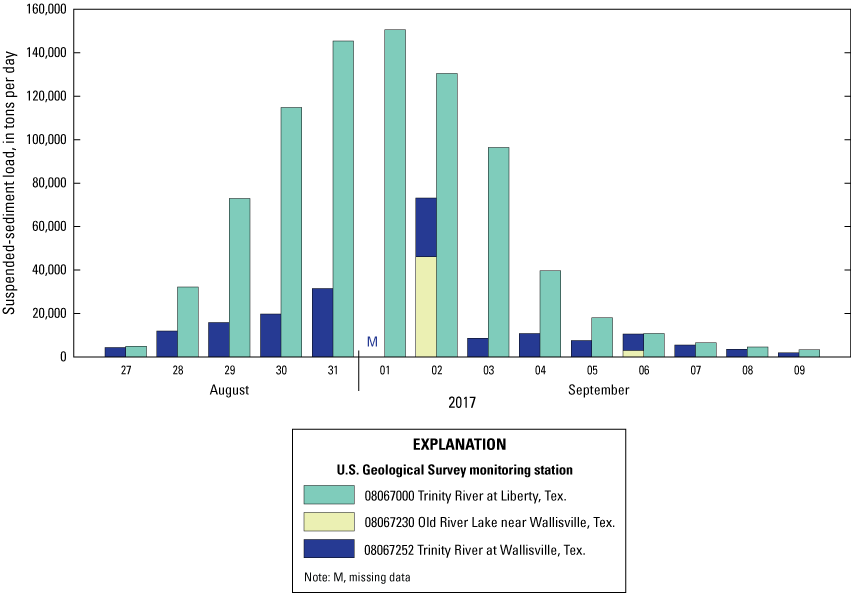
Estimated daily total suspended-sediment loads at U.S. Geological Survey monitoring stations 08067000 Trinity River at Liberty, Texas, and 08067252 Trinity River at Wallisville, Tex., and instantaneous suspended-sediment loads at U.S. Geological Survey monitoring station 08067230 Old River Lake near Wallisville, Tex., during August 27–September 9, 2017.
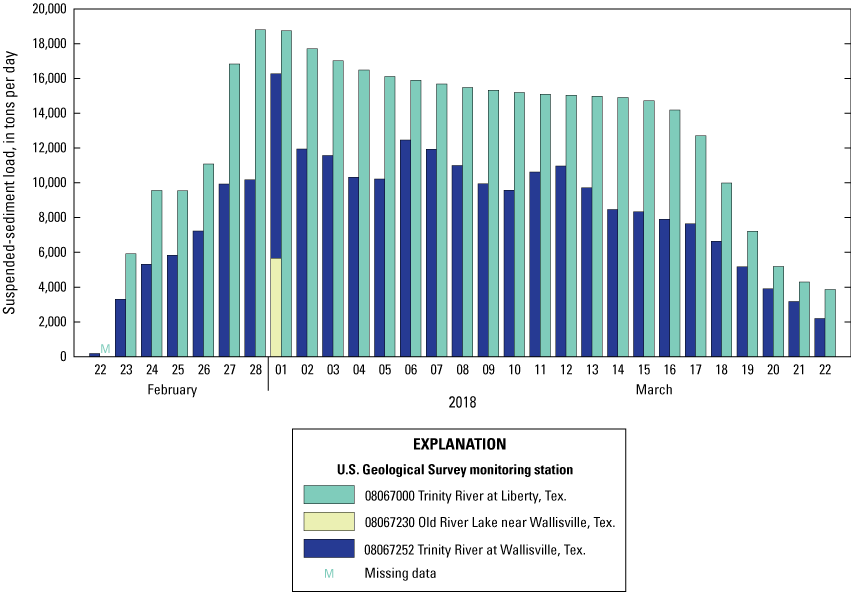
Estimated daily total suspended-sediment loads at U.S. Geological Survey monitoring stations 08067000 Trinity River at Liberty, Texas, and 08067252 Trinity River at Wallisville, Tex., and instantaneous suspended-sediment loads at U.S. Geological Survey monitoring station 08067230 Old River Lake near Wallisville, Tex., during February 22–March 22, 2018.
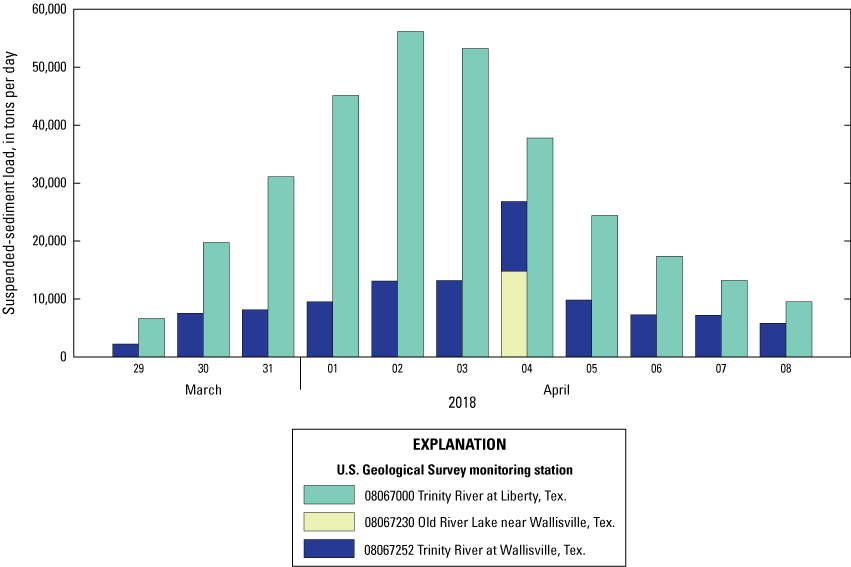
Estimated daily total suspended-sediment loads at U.S. Geological Survey monitoring stations 08067000 Trinity River at Liberty, Texas, and 08067252 Trinity River at Wallisville, Tex., and instantaneous suspended-sediment loads at U.S. Geological Survey monitoring station 08067230 Old River Lake near Wallisville, Tex., during March 29–April 8, 2018.
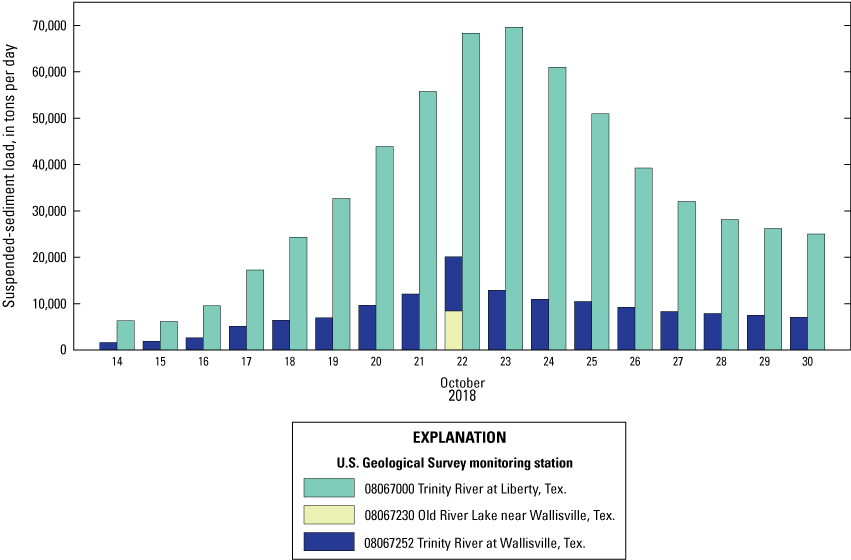
Estimated daily total suspended-sediment loads at U.S. Geological Survey monitoring stations 08067000 Trinity River at Liberty, Texas, and 08067252 Trinity River at Wallisville, Tex., and instantaneous suspended-sediment loads at U.S. Geological Survey monitoring station 08067230 Old River Lake near Wallisville, Tex., during October 14–30, 2018.
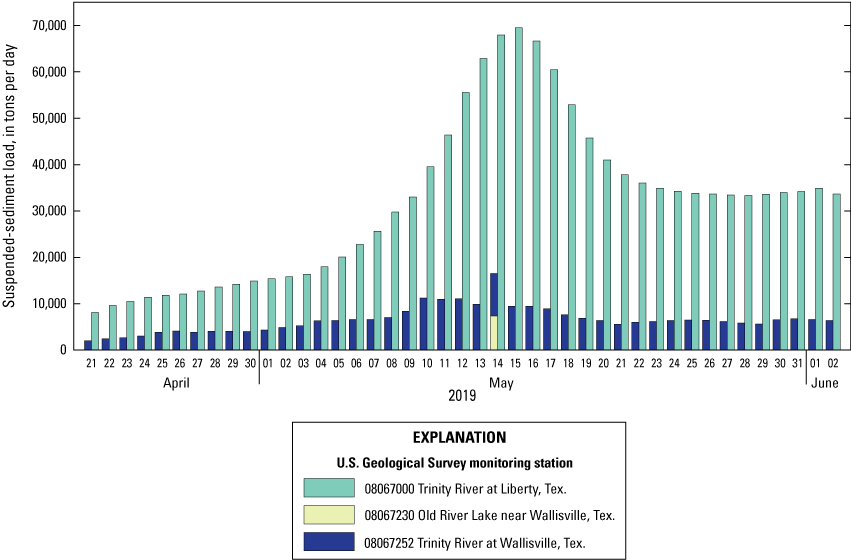
Estimated daily total suspended-sediment loads at U.S. Geological Survey monitoring stations 08067000 Trinity River at Liberty, Texas, and 08067252 Trinity River at Wallisville, Tex., and instantaneous suspended-sediment loads at U.S. Geological Survey monitoring station 08067230 Old River Lake near Wallisville, Tex., during April 21–June 2, 2019.
Conversion Factors
U.S. customary units to International System of Units
Temperature in degrees Celsius (°C) may be converted to degrees Fahrenheit (°F) as follows:
°F = (1.8 × °C) + 32.
Temperature in degrees Fahrenheit (°F) may be converted to degrees Celsius (°C) as follows:
°C = (°F – 32) / 1.8.
Datum
Horizontal coordinate information is referenced to the North American Datum of 1983 (NAD 83) and the World Geodetic System of 1984.
Supplemental Information
Specific conductance is given in microsiemens per centimeter at 25 degrees Celsius (µS/cm at 25 °C).
Concentrations of chemical constituents in water are given in milligrams per liter (mg/L).
For more information about this publication, contact
Director, Oklahoma-Texas Water Science Center
U.S. Geological Survey
1505 Ferguson Lane
Austin, TX 78754-4501
Suggested Citation
Lucena, Z., and Lee, M.T., 2022, Distribution of streamflow, sediment, and nutrients entering Galveston Bay from the Trinity River, Texas, 2016–19: U.S. Geological Survey Scientific Investigations Report 2022–5015, 55 p., https://doi.org/10.3133/sir20225015.
ISSN: 2328-0328 (online)
ISSN: 2328-031X (print)
Study Area
| Publication type | Report |
|---|---|
| Publication Subtype | USGS Numbered Series |
| Title | Distribution of streamflow, sediment, and nutrients entering Galveston Bay from the Trinity River, Texas, 2016–19 |
| Series title | Scientific Investigations Report |
| Series number | 2022-5015 |
| DOI | 10.3133/sir20225015 |
| Year Published | 2022 |
| Language | English |
| Publisher | U.S. Geological Survey |
| Publisher location | Reston, VA |
| Contributing office(s) | Oklahoma-Texas Water Science Center |
| Description | Report: vi, 55 p.; Dataset |
| Country | United States |
| State | Texas |
| Other Geospatial | Galveston Bay |
| Online Only (Y/N) | N |
| Google Analytic Metrics | Metrics page |