

Geohydrology and Water Quality of the Northern and Central Parts of the Tug Hill Glacial Aquifer, Jefferson and Oswego Counties, North-Central New York
Links
- Document: Report (11.0 MB pdf) , HTML , XML
- Tables:
- Table 1.1 (4.54 KB csv) - Physiochemical properties and concentrations of major ions, nutrients, and dissolved oxygen in surface-water samples collected from the northern part of the Tug Hill glacial aquifer, Jefferson and Oswego Counties, north-central New York, 2009 and 2013
- Table 1.2 (7.88 KB csv) - Physiochemical properties and concentrations of major ions, nutrients, trace elements, dissolved gases, and tritium in groundwater samples collected from the northern part of the Tug Hill glacial aquifer, Jefferson and Oswego Counties, north-central New York, 2013
- Table 1.3 (5.34 KB csv) - Physiochemical properties and concentrations of major ions, nutrients, and trace elements in surface-water samples collected from the central part of the Tug Hill glacial aquifer, Oswego County, north-central New York, 2008 and 2013
- Table 1.4 (7.13 KB csv) - Physiochemical properties and concentrations of major ions, nutrients, trace elements, dissolved gases, and tritium in groundwater samples collected from the central part of the Tug Hill glacial aquifer, Oswego County, north-central New York, 2013
- Tables 1.1-1.4 (50.3 KB xlsx)
- Figures:
- Data Releases:
- USGS data release - Geospatial datasets for the geohydrology and water quality of the northern and central parts of the Tug Hill glacial aquifer, Jefferson and Oswego Counties, north-central New York
- USGS data release - Horizontal-to-vertical seismic method (HVSR) soundings in the northern and central parts of the Tug Hill glacial aquifer, Jefferson and Oswego Counties, north-central New York
- Download citation as: RIS | Dublin Core
Acknowledgments
The authors thank the Villages of Adams and Pulaski, Towns of Richland and Orwell, the Sandy Creek/Lacona Joint Water Works, and the Sandy Creek Water District 2 for providing water use data. The authors also thank the residents of the study area who provided information or use of their wells for testing and monitoring. A special thanks to Ed Bugliosi (retired), Shannon Fisher, Brett Hayhurst, Liz Kreitinger, Lacey Pitman, and Jim Reddy of the U.S. Geological Survey for their assistance in the field with data collection.
Abstract
The northern and central parts of the Tug Hill glacial aquifer consist of a 29-mile-long, crescent-shaped, mixture of glaciofluvial, glaciolacustrine, and recent alluvial deposits of predominantly sand and gravel on the western side of the Tug Hill Plateau in Jefferson and Oswego Counties in north-central New York. Approximately 11,400 people are supplied by groundwater that is withdrawn from municipal and nonmunicipal wells in the northern and central parts of the aquifer. In addition, many farms, several industries, and a large New York State fish hatchery also rely on the water from the aquifer.
In the early 2000s, anticipated developmental pressures from potential new industries (including a proposed water-bottling plant in the central part of the Tug Hill glacial aquifer) and expansion of the Fort Drum military base north of Watertown (with the projected increase in population extending into the northern part of the aquifer) prompted the Tug Hill Commission, local municipal officials, and representatives from the New York State Department of Environmental Conservation to initiate a geohydrologic study with the U.S. Geological Survey. The information from this study is intended to help the state, counties, and local communities make sound policy decisions about their use of this large groundwater resource.
The northern part of the Tug Hill glacial aquifer is a combination of glaciofluvial outwash and alluvial sand and gravel in the Sandy Creek Valley northeast of Adams, New York, and mostly glaciolacustrine beach and deltaic sand or sand and gravel north and south of the village of Adams. The southern and eastern areas of the central part of the aquifer are composed mostly of glaciofluvial sediments such as kames, kame moraines, and kame terraces, whereas most of the western areas of the central part are composed mostly of glaciolacustrine sediments such as deltaic sand and beach sand and gravel.
The northern and central parts of the aquifer are unconfined. Recharge to the northern and central parts of the aquifer is from three main sources: (1) precipitation that falls directly onto the aquifer; (2) unchannelized runoff (overland flow) and groundwater from till and bedrock in the Tug Hill Plateau that seeps into the eastern side of the aquifer; and (3) streams that drain the Tug Hill Plateau and flow across and lose water to the aquifer. Groundwater discharges to springs, seeps, headwaters of streams, and wetlands in the middle area of the central part of the aquifer and along the entire western boundary of the northern and central parts of the aquifer; pumping wells; artificial ditches; and deeply incised streams in the northern and central parts of the aquifer. The groundwater discharge to such streams is critical in supporting the salmonid fishery in the central part of the aquifer.
Groundwater levels were measured on July 17, 2014, at 22 wells throughout the northern and central parts of the aquifer. Water-table contours were drawn on the basis of the measured July 2014 water levels, historical water-level data, and surface-water levels where surface water in the channels was expected to be hydraulically connected to the groundwater system. The water table generally slopes from east to west throughout the northern and central parts of the aquifer; this slope also indicates that the direction of groundwater flow is generally from east to west.
Water-quality samples were collected from 23 stream sites during base-flow conditions, and groundwater-quality and other types of environmental samples were collected from 20 wells in the northern and central parts of the Tug Hill glacial aquifer. The results of the sampling indicate that surface water and groundwater are generally of good quality.
Comparison of the median concentration values of major ions in groundwater samples indicated that hardness in the northern part of the aquifer was about twice as great, and concentrations of calcium and sodium were more than three times as great, as in the central part of the aquifer. As was the case with surface water, the much greater median concentrations in groundwater of calcium, hardness, and alkalinity in the northern part of the aquifer are due to the dissolution of limestone that underlies most of that area and to the high-carbonate content of the clasts in the sand and gravel. There was little to no difference among the median values for bromide, fluoride, silica, and iron in the two parts of the aquifer. Concentrations of most other major ions were slightly greater in the northern part than in the central part of the Tug Hill glacial aquifer, except for magnesium, whose concentration was greater in the central part. Median concentrations of nutrients were generally greatest in surface water and groundwater in the northern part of the aquifer.
Introduction
The entire Tug Hill glacial aquifer is a 47-mile (mi)-long, crescent-shaped mixture of glacial deposits of predominantly sand and gravel on the western side of the Tug Hill Plateau in Jefferson, Oswego, and Oneida Counties in north-central New York. The Tug Hill glacial aquifer can be divided into three parts (northern, central, and southern) based on geohydrological setting, depositional history, and type of glacial deposits (fig. 1). In this report, the name “Tug Hill glacial aquifer” refers only to the 29-mi-long northern and central parts of the Tug Hill glacial aquifer. The southern part was not included in this investigation.
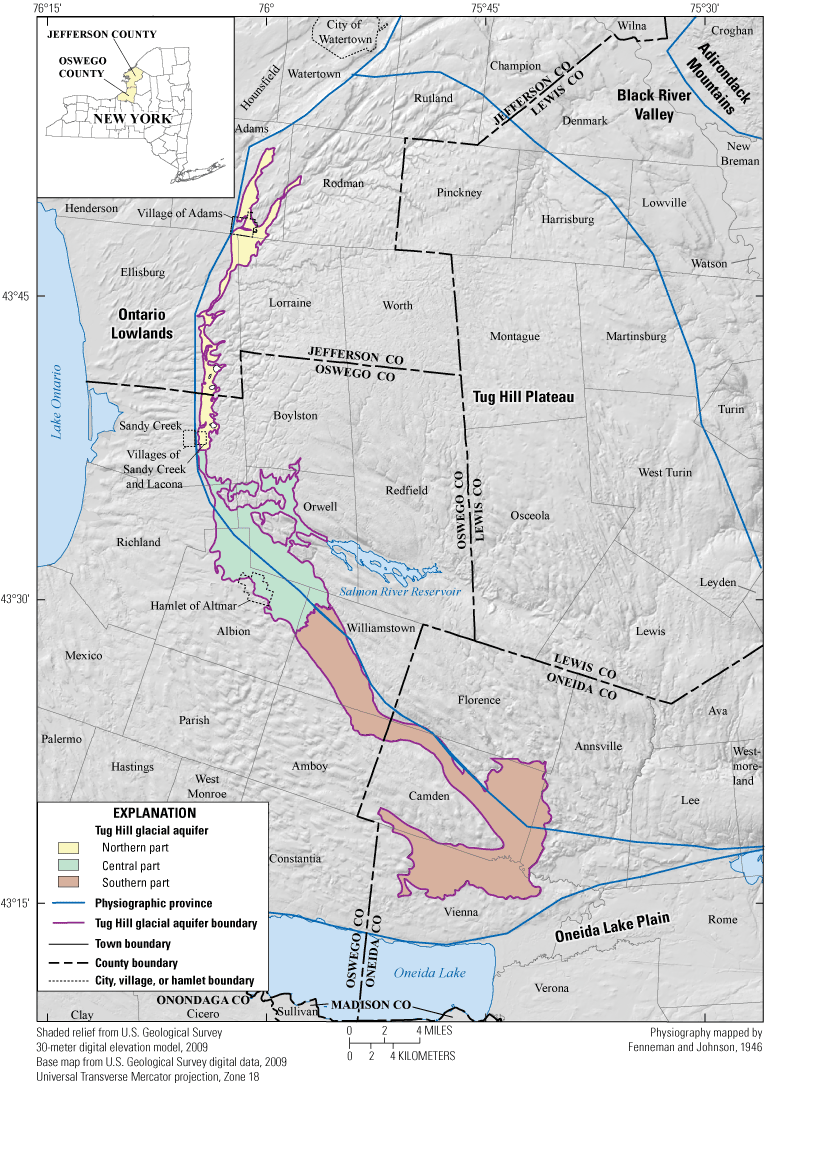
Map showing the physiography and boundaries of the northern, central, and southern parts of the Tug Hill glacial aquifer in north-central New York.
For this report, the division between the northern and central parts of the aquifer was placed about 0.5 mi south of the villages of Sandy Creek and Lacona, N.Y., in Oswego County (fig. 1). The division between the central and southern parts of the aquifer is the surface-water divide between the Salmon River basin, which drains westward into Lake Ontario, and the West Branch Fish Creek basin (fig. 2).
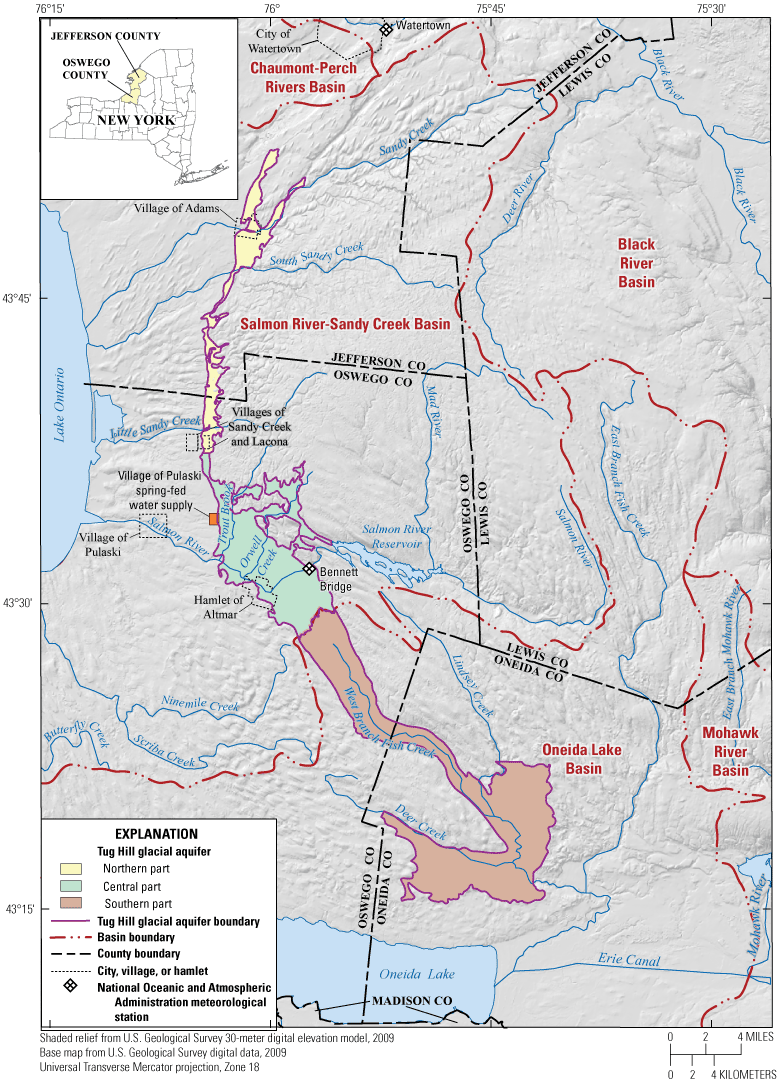
Map showing location of the Tug Hill glacial aquifer in north-central New York, major drainage basins, and meteorological stations in the study area.
In 2006, the U.S. Environmental Protection Agency (EPA) designated the northern part of the Tug Hill glacial aquifer and its watershed that extends eastward onto the Tug Hill Plateau (fig. 1) as a Federal sole source aquifer for drinking water. An aquifer is designated as a sole source aquifer when the aquifer supplies at least 50 percent of the drinking water consumed in the area overlying the aquifer and there are no reasonably available alternative drinking water sources should the aquifer become contaminated (U.S. Environmental Protection Agency, 2019). The Tug Hill glacial aquifer is the source of drinking water for many municipalities, as well as for drinking-water wells for private residences, mobile-home parks, campgrounds, and other facilities. Water from the aquifer is also used in manufacturing, industry, and agriculture. Additionally, the aquifer is tapped by large pumping wells that supply water to the New York State Department of Environmental Conservation (NYSDEC) Fish Hatchery in the hamlet of Altmar.
Development that might affect groundwater resources has been incremental over time, punctuated by a few large industries that established their manufacturing facilities near the village of Pulaski in the mid-1960s; a landfill in the town of Rodman, which began operations in the 1980s; and residential-housing booms caused by the expansion of the military base at Fort Drum near the city of Watertown in the late 1980s and in 2015 (K.H. Malinowski, Tug Hill Commission, written commun., 2007). In 2007, because of concerns about the potential effects of these developments on the Tug Hill glacial aquifer, the Tug Hill Commission (THC) received requests from local officials and agencies in the region for information about the aquifer’s characteristics, capacity, and interaction with surface water. Specific water issues raised by local officials and agencies in the region included the following:
-
designation of the northern part of the aquifer as a sole source aquifer for the villages of Sandy Creek and Lacona (fig. 1) in 2006;
-
exploration of springs in the aquifer to be tapped by a commercial water-bottling company in the towns of Orwell, Albion, and Williamstown;
-
industrial wells that are being phased out and were subsequently acquired by the town of Richland to be used for a municipal water supply
-
basement flooding in the town of Richland;
-
bacterial contamination that was detected in the village of Pulaski’s spring-fed water supply;
-
need for replacement of a failing production well at the NYSDEC Fish Hatchery in the hamlet of Altmar;
-
increased need for residential drinking-water supplies in growing communities; and
-
risk to wild steelhead and salmon production, especially in Trout Brook and Orwell Creek (fig. 2)—two of the best salmon- and steelhead-producing steams in the Lake Ontario watershed (McKenna and Johnson, 2000). The habitats in each of these streams rely heavily on groundwater that discharges into the streams. Large groundwater withdrawals could intercept groundwater that would otherwise have discharged into these streams, resulting in a lower water table, lower base flows, and likely negative effects on fish habitat.
In July 2007, the THC, local officials, and agency representatives from the U.S. Geological Survey (USGS) and the NYSDEC met to discuss these issues. The group concluded that there was a compelling need to better understand and explain the dynamics of the Tug Hill glacial aquifer to help communities make sound policy decisions about groundwater use. Specific information was needed to determine, as follows:
-
the sustainability of groundwater supply to support substantial economic activities that are dependent upon a reliable groundwater source (for example, community water supplies, agriculture, tourism, recreation, and manufacturing);
-
the changes in aquifer recharge caused by changing climate and weather; and
-
the roles of groundwater in base flow and water temperature in key cold-water tributaries—especially Trout Brook, Orwell Creek, Lindsey Creek, and Little Sandy Creek—that provide critical year-round nursery habitat for much of the wild steelhead-trout fishery along Lake Ontario in New York.
The group recommended that, in addition to collecting more geohydrologic data with which to develop a better understanding of how the aquifer works, numerical groundwater-flow models for each part of the Tug Hill glacial aquifer be constructed by the USGS to provide a tool to help State and local officials manage the groundwater resource. A proposal to collect more detailed information on how the aquifer works and to construct numerical groundwater-flow models was developed by the USGS and presented to the THC in September 2007. The proposal was accepted by the THC later that year (K.H. Malinowski, Tug Hill Commission, written commun., 2007). Initially, all three parts of the Tug Hill glacial aquifer (northern, central, and southern parts) were to be included in the study; however, funding limitations precluded including the southern part of the aquifer in the study. All interested parties decided to proceed with a study of the northern and central parts of the aquifer because these areas were more likely to face development issues and included sensitive habitat related to salmonid viability. The original planned scope of the study of the northern and central parts of the aquifer included two phases: a data collection and construction of regional groundwater-flow models. Funding restrictions, however, allowed for only the data-collection phase of the program to be completed. This report documents that data-collection phase.
Purpose and Scope
This report provides a regional appraisal of the geohydrology and water quality of the northern and central parts of the Tug Hill glacial aquifer in Jefferson and Oswego Counties. The report describes the geometry and glacial origin of the northern and central parts of the Tug Hill glacial aquifer, sources of recharge and discharge to those areas, groundwater withdrawals, groundwater-flow directions, and groundwater and surface-water quality. Maps show the northern and central aquifer boundaries, well locations, water levels, and selected geohydrologic sections; generalized bedrock and surficial geology; regional potentiometric-surface altitudes and directions of groundwater flow in the unconfined aquifer; and gains and losses of waterflow in selected streams. Groundwater-withdrawal rates and water-quality analyses of selected well data are also included in the report.
Physiographic Setting
The northern and central parts of the Tug Hill glacial aquifer roughly coincide with the boundary between the Tug Hill Plateau and the Ontario Lowlands (fig. 1). The Tug Hill Plateau is an upland area that rises from altitudes of about 500 to 600 feet (ft) above the North American Vertical Datum of 1988 (NAVD 88) along its western edges to an altitude of 2,000 ft across the top of the plateau. The plateau consists of slightly southwestward-dipping sedimentary rocks that are overlain in most places by 5 to 40 ft of glacial deposits (Miller and others, 1988). This plateau is a remnant of the Allegheny Plateau to the south (not shown).
Total precipitation ranges from 45 to 55 inches per year (in/yr), and snowfall can be heavy, averaging more than 140 in/yr (figs. 3 and 4); daily accumulations of more than 1 ft are not uncommon during some winters (National Oceanic and Atmospheric Administration, 2014; locations of meteorological sites shown on fig. 2). The greatest mean monthly total snowfall (145 inches [in.]) from 2003 to 2014 was recorded at the Bennett Bridge meteorological station in the central part of the study area, with amounts decreasing northward to the Watertown station (94.3 in.; fig. 2; table 1). The snowfall was heaviest from December through February (fig. 3) at both stations. Mean monthly total precipitation (rainfall plus snowmelt) increased slightly (table 1) from Bennett Bridge (44.6 in.) to Watertown (46.3 in.). The amount of snowfall is critical for providing recharge to much of the aquifer (Miller and others, 2007).
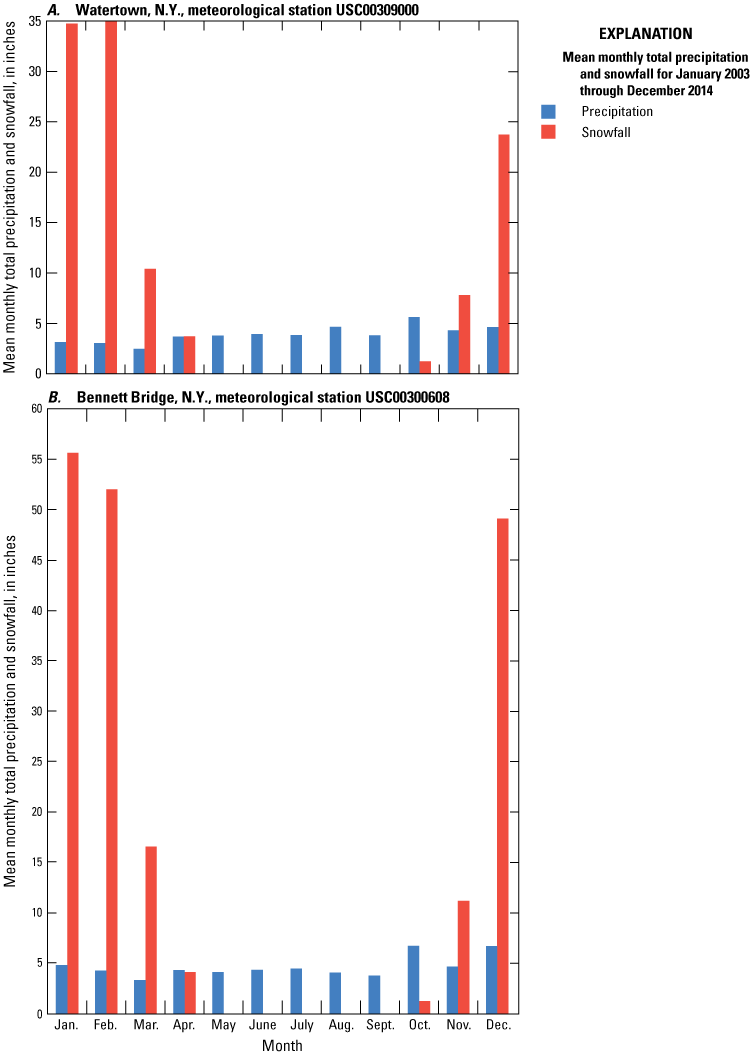
Graphs showing mean monthly total precipitation and snowfall at the A, Watertown and B, Bennett Bridge meteorological stations in the northern and central Tug Hill glacial aquifer study area in New York from January 2003 through December 2014. Locations of meteorological stations are shown on figure 2.
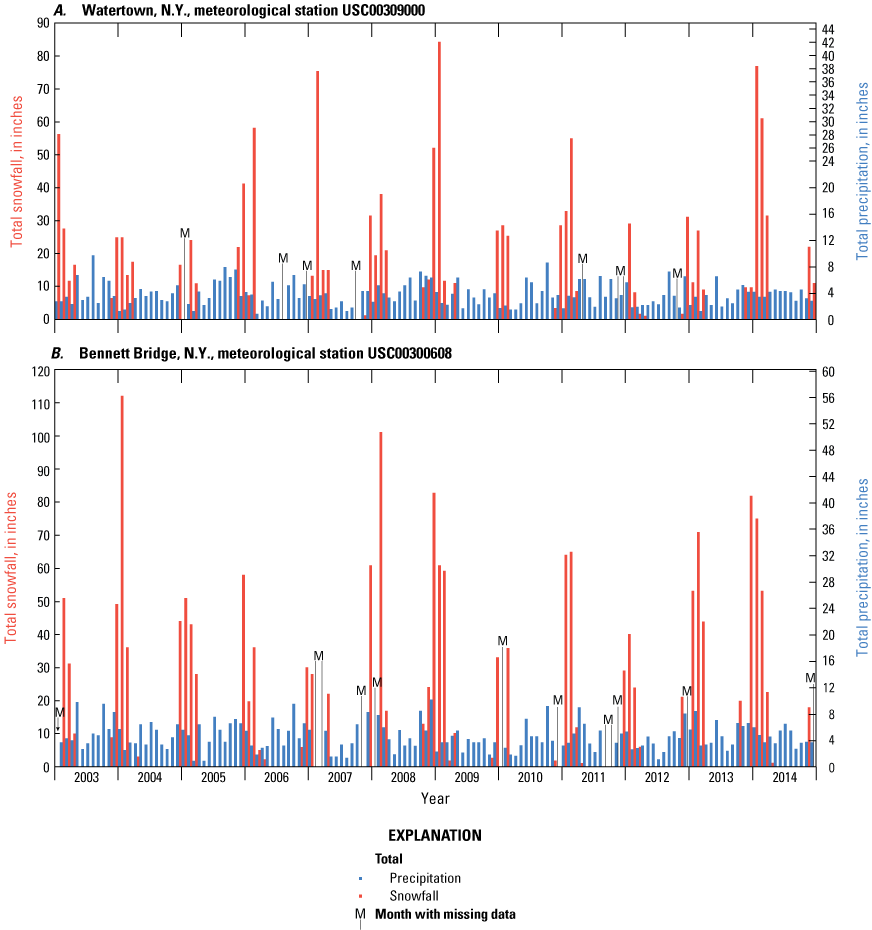
Graphs showing total monthly precipitation and monthly total snowfall, in inches, for the A, Watertown and B, Bennett Bridge meteorological stations in the northern and central Tug Hill glacial aquifer study area in New York from January 2003 to December 2014. Locations of meteorological stations are shown on figure 2.
Table 1.
Mean monthly total precipitation and snowfall at meteorological stations at the A, Watertown and B, Bennett Bridge meteorological stations in New York from 2003 to 2014.[Locations of meteorological stations are shown on figure 2. in., inch]
Previous Reports
In the late 1980s, the USGS studied the general geohydrology of the Tug Hill glacial aquifer at a regional scale that included mapping the aquifer boundary, depicting the geologic framework, and determining the potentiometric (water-level) surface and other general aquifer characteristics (Miller and others, 1988). During the early 1990s, the USGS used analytical methods and a two-dimensional numerical groundwater-flow model to determine the locations of recharge areas that contribute water to six municipal production wells that tap the Tug Hill glacial aquifer (Zarriello, 1993); that study emphasized the Lacona-Sandy Creek well field. In the mid-2000s, the USGS assessed the Pulaski and Lacona-Sandy Creek well-field areas, which included constructing a three-dimensional numerical groundwater-flow model (Miller and others, 2007).
Data Collection
The data presented in this report include both historical data and data collected for this study (Fisher and Keto, 2022a, b). Historical data were obtained from drillers’ logs, bedrock and surficial geologic maps, precipitation records, and water-use reports obtained from local municipalities and State and Federal Government agencies. Geohydrologic and water-quality data were collected during this study. The types of data that were collected included groundwater levels measured by electric tape and types of geohydrologic units that were penetrated during test-well drilling; water-levels were measured in selected wells by continuously recording data loggers; streamflow discharge at selected sites; depth-to-bedrock soundings made by using the horizontal-to-vertical spectral-ratio (HVSR) seismic method; and water-quality sampled at selected surface-water and groundwater sites.
Geologic Data
The geologic mapping presented in this report builds upon and refines the mapping done by several researchers including Miller and Muller (1979, 1980), Jordan and Miller (1980), Miller (1980a-f, 1981a, b, 1982), Anderson and others (1982), and Miller and others (1988, 2007). The geologic information was collected for this report using HVSR seismic surveys, satellite imagery, light detection and ranging (lidar), and field mapping.
Well-Site Inventory and Test-Well Drilling
Data in the well-site inventory are from 174 wells (Fisher and Keto, 2022a) distributed throughout the northern and central parts of the Tug Hill glacial aquifer. The sources of well records compiled in the report include two test wells drilled for this project, logs of wells drilled for the NYSDEC fish hatchery at the hamlet of Altmar, the USGS National Water Information System (NWIS), a previously published USGS report about water quality in the Tug Hill area (Risen and Reddy, 2011), and reports obtained from the NYSDEC’s Well Driller Registration Program.
Two test wells were drilled in the Sandy Creek Valley in the town of Adams (fig. 1) for the purposes of locating a possible bedrock fault suggested by the surrounding topography, determining whether the aquifer was continuous or separated in two parts, and whether the groundwater was potable and could be considered for further exploration for a potential water supply for the town and village of Adams. The wells were drilled by using an air-rotary drilling rig. The first well (J 231; fig. 5A, inset B) was drilled to a depth of 202 ft below land surface and finished in limestone bedrock. The second well (J 230; fig. 5A) was drilled to a depth of 42 ft below land surface and finished in the unconfined sand-and-gravel Tug Hill glacial aquifer. Samples of soil and rock drill cuttings were examined to determine the underlying material. Six test wells in the study area (fig. 5) were equipped with data loggers that continually measured water level, water temperature, and barometric pressure to determine water-level and temperature trends during the period of the study.
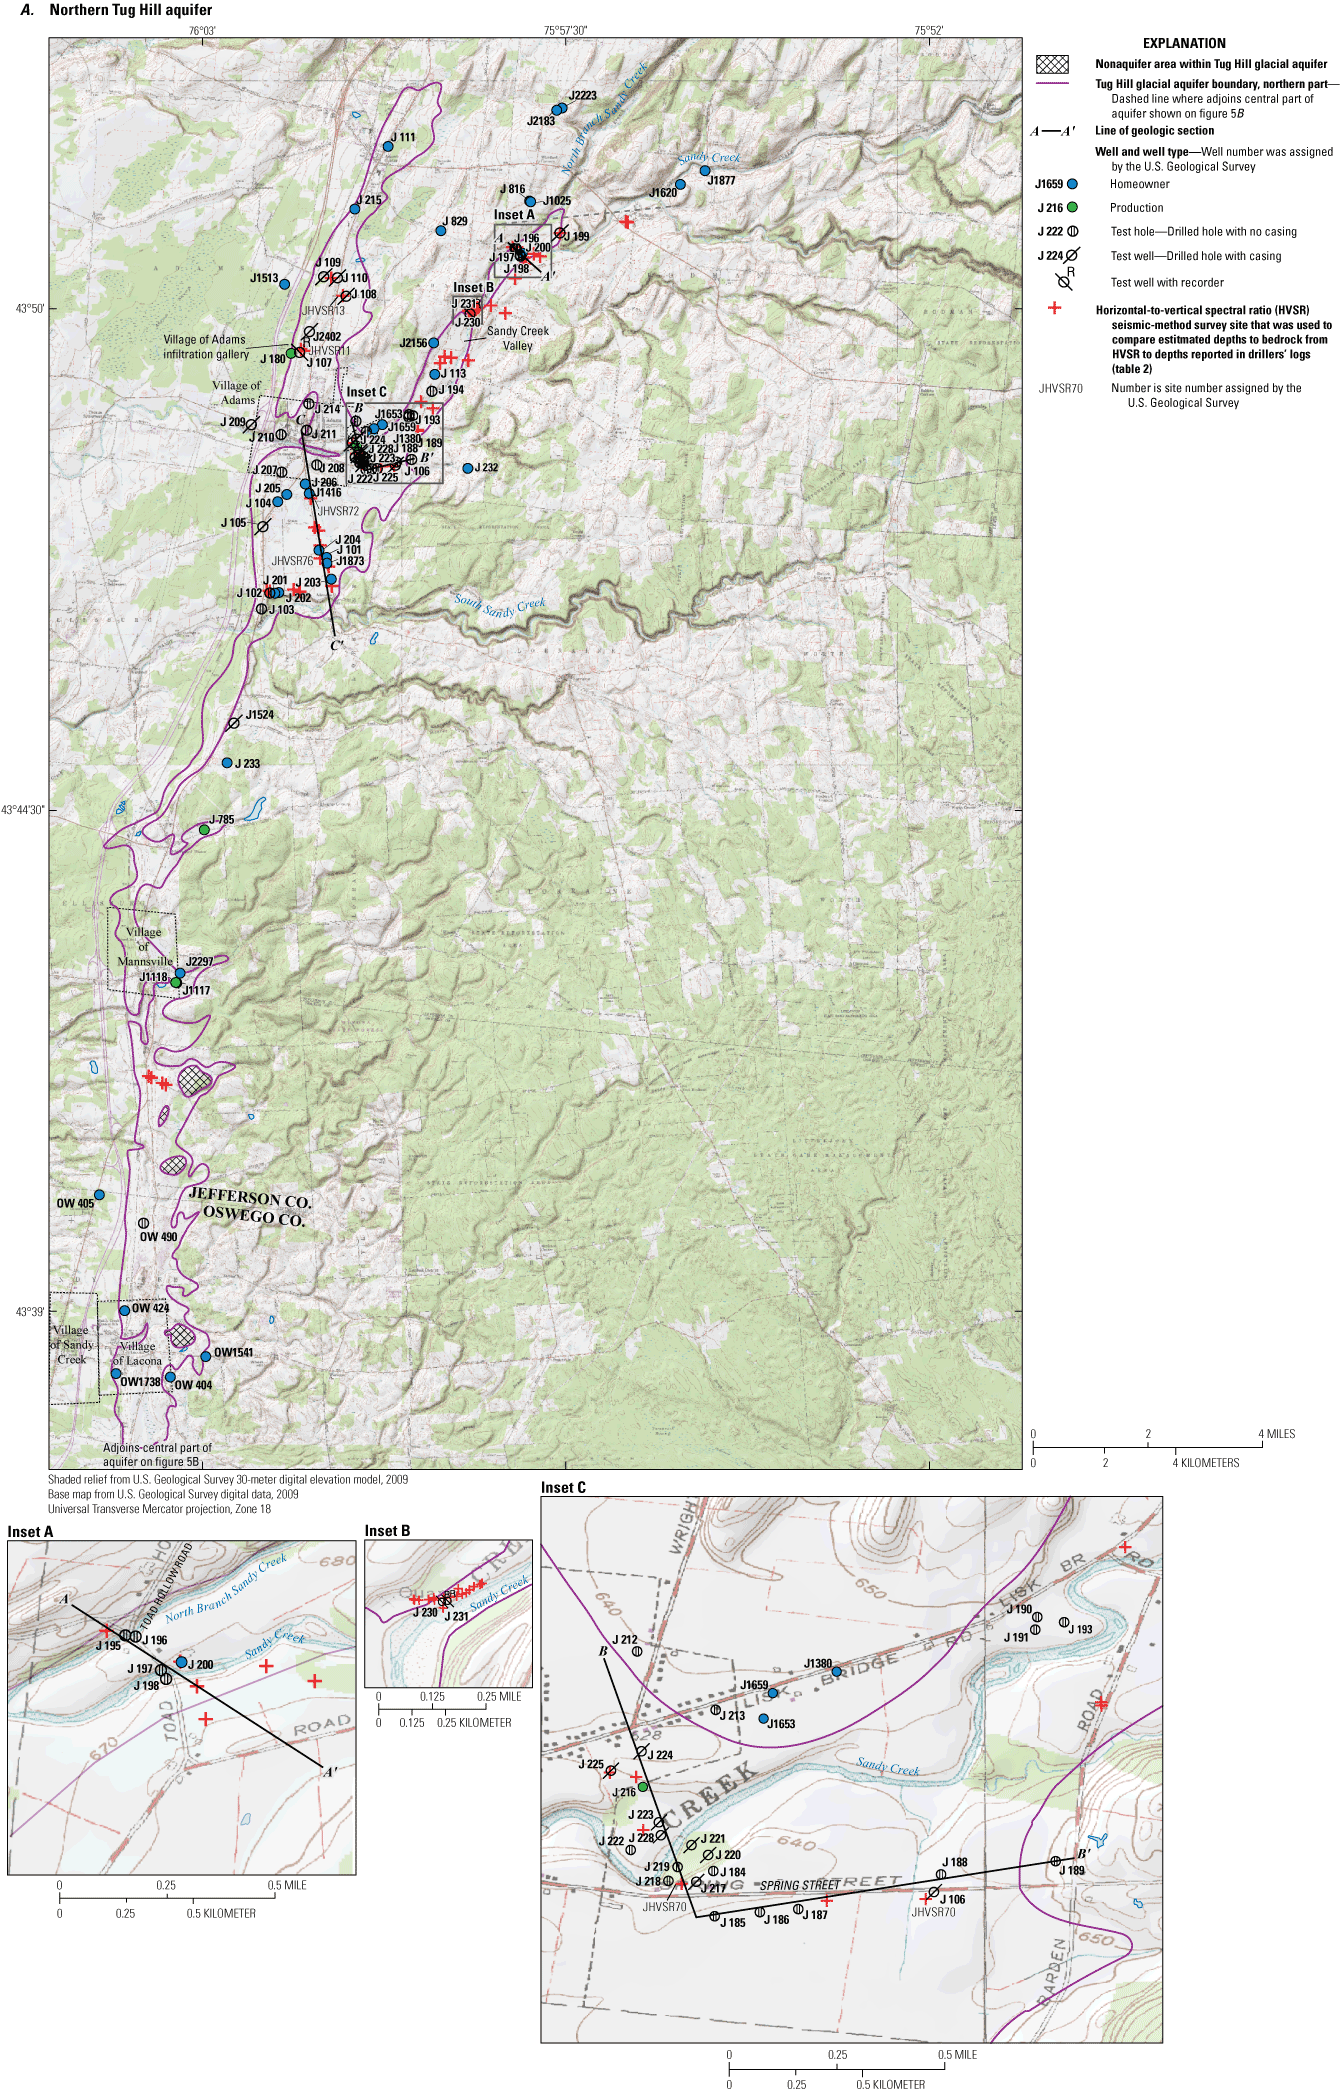
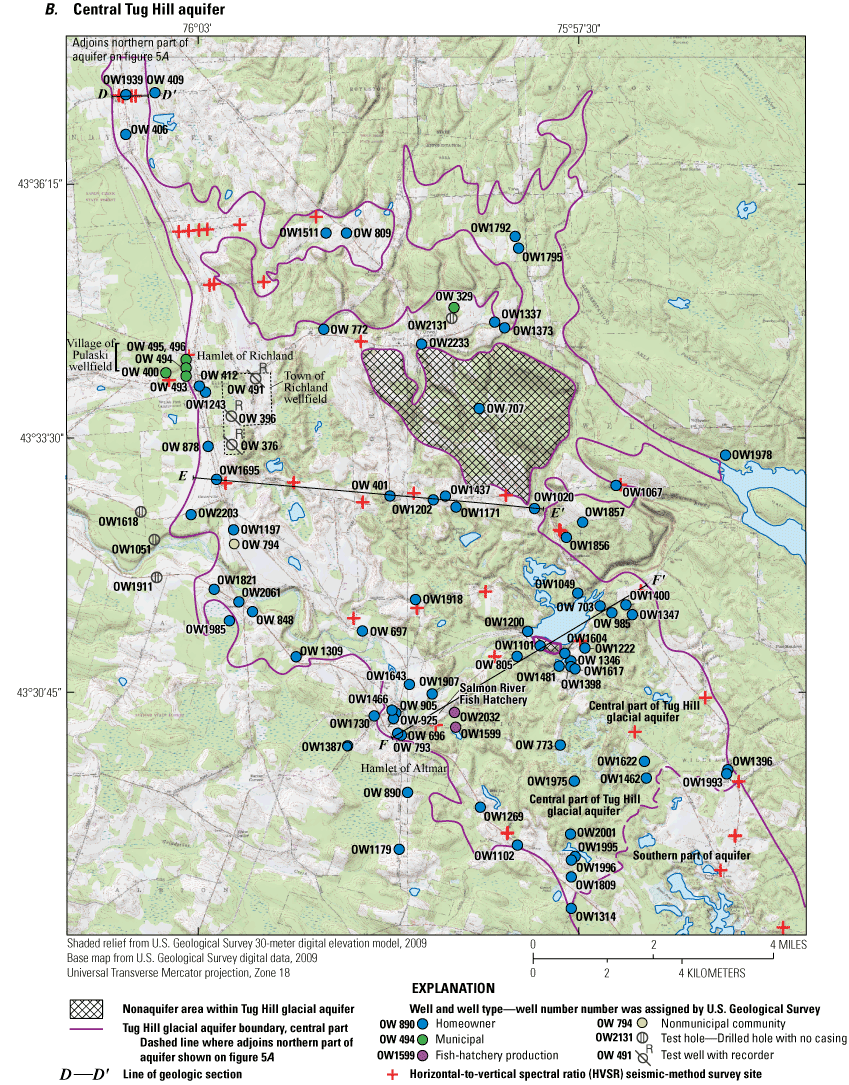
Maps showing locations of wells, horizontal-to-vertical spectral-ratio seismic surveys, and lines of geologic sections, in the A, northern and B, central parts of the Tug Hill glacial aquifer in Jefferson and Oswego Counties, north-central New York. [A full-size version of panel A is available at https://doi.org/10.3133/sir20225039.]
Land-surface altitudes of well locations were obtained by using three methods: (1) standard surveying techniques (Kenney, 2010), (2) digital elevation models (DEMs), or (3) drillers’ estimates from well-completion reports. The altitudes of the potentiometric surface of the aquifer were then determined by two methods: (1) subtracting the depth to groundwater below land surface from the land-surface altitude and (2) using the altitudes of topographic contours at points where they intersect the stream channels in areas where the groundwater and surface water are likely to be hydraulically connected.
Streamflow Measurements
Streamflow was measured at Sandy Creek and Sandy Creek tributaries on June 2, 2009, and during low flow at 15 sites along Pekin Brook, Beaverdam Brook, Beaverdam Brook tributary, Trout Brook, and Orwell Creek on May 29, 2008. The techniques used for streamflow measurements are outlined by Rantz and others (1982).
HVSR Surveys
The HVSR method was used to approximate the thickness of sediment and depth to bedrock at selected sites throughout the study area (Fisher and Keto, 2022b). The HVSR method uses a single, broad-band three-component seismometer to record ambient seismic noise. It is considered a passive seismic method because it does not require an artificial seismic source, such as explosives or hammer blows. The HVSR method measures vertical and two horizontal (north-south and east-west) components of ambient seismic noise, which includes microtremors induced by wind, and anthropogenic activity. The ratio of the averaged horizontal-to-vertical frequency spectrum is used to determine the fundamental site resonance frequency, which can be interpreted using regression equations to estimate sediment thickness and depth to bedrock (Lane and others, 2008).
Water-Quality Sampling and Analysis
Samples were collected from surface water and groundwater. These samples, along with replicates and a blank sample, were collected and analyzed in accordance with the USGS manual for water-quality data collection (U.S. Geological Survey, 2004). Samples collected from surface-water and groundwater sites were analyzed at the USGS National Water Quality Laboratory (NWQL) in Denver, Colorado, for physiochemical properties, nutrients, major ions, and trace elements. Additionally, groundwater was analyzed for tritium, dissolved gases, and chlorofluorocarbons (CFCs; for age dating of groundwater) at the USGS Groundwater Dating Laboratory in Reston, Virginia. Data on water temperature, dissolved oxygen, specific conductance, and pH were also recorded on site during each sample collection. Censored data were treated as values in determining statistics for water quality.
In total, 23 surface-water environmental samples were collected in the study area: in the northern part of the study area, 13 were collected on June 2, 2009, and 1 sample was collected on November 6, 2013, and in the central part of the aquifer, 8 samples were collected on May 29, 2008, and 1 sample was collected on November 5, 2013.
A total of 21 groundwater environmental samples were collected at well sites in the study area between September and November 2013; in addition, three quality-control samples were collected. Samples were collected from a variety of types of wells, including homeowner, observation, testing, and large pumping wells distributed throughout the northern and central parts of the Tug Hill glacial aquifer. Before water samples were collected from homeowner wells, each well was purged until at least three well volumes of water had been removed or until physiochemical properties (pH, specific conductance, temperature, and dissolved oxygen) had stabilized. Water was collected from sample points in the home plumbing that either bypassed or were upstream of filtration or chemical treatment.
Three groundwater samples were collected at a nested pair of test wells drilled for this study in the Sandy Creek Valley. The deep well finished in bedrock was sampled twice (once during drilling and again 1 week after drilling was completed), and the shallow well, which was finished in the unconfined sand and gravel aquifer, was sampled 1 week after drilling was completed. Samples were collected after the wells had been purged for approximately 1.5 hours (more than 10 casing volumes each) or until physical properties had stabilized. All three samples were analyzed for physiochemical properties, nutrients, major ions, trace elements, tritium, dissolved gases, and CFCs. In addition, because gas bubbles had been detected in the water from the bedrock well during drilling and sampling, a sample was collected and analyzed for methane isotopes.
Continuous temperature data were also collected by dataloggers installed at six surface-water sites throughout the Tug Hill glacial aquifer. Locations of temperature datalogger sites are described in the “Water Quality” section of this report. The temperature dataloggers were placed and secured in stream reaches where disturbance by people would be minimal. The dataloggers were secured to metal rods that were driven into the streambed in stream pools (the deepest part of the stream at each location). Data were collected hourly and then aggregated into a daily mean temperature for analysis.
Geology
Bedrock Geology
The bedrock geology underlying the northern and central parts of the Tug Hill glacial aquifer was mapped by Isachsen and Fisher (1970). The bedrock units that underlie the study area are composed of sedimentary rocks of Upper (younger rocks) to Middle (older rocks) Ordovician age. In general, rocks are older from the southeast to northwest (fig. 6). The northern part of the aquifer is underlain by limestone and shale of the Trenton Group, the Utica Shale (black), and shale and siltstone of the Pulaski and Whetstone Gulf Formations (Isachsen and Fisher, 1970; Miller and others, 1988). The central part of the aquifer is underlain by shale and siltstone of the Pulaski and Whetstone Gulf Formations and by the fine-grained Oswego Sandstone.
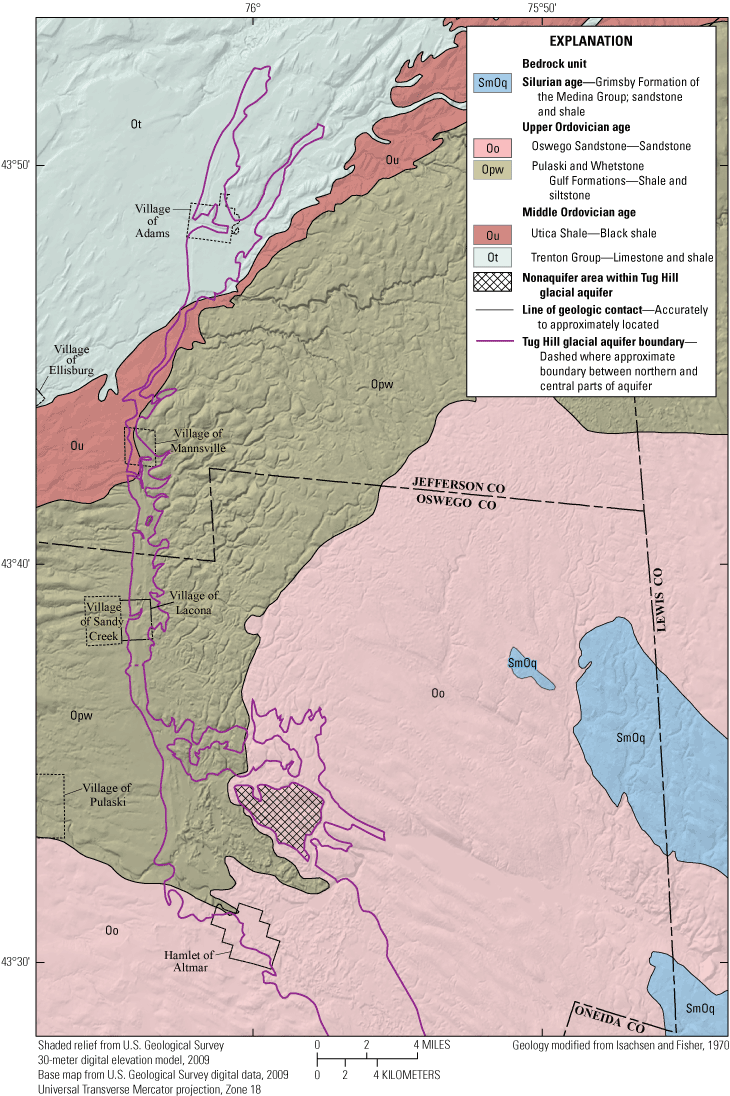
Map showing bedrock geology underlying the Tug Hill glacial aquifer in the western part of the Tug Hill Plateau, north-central New York.
The bedrock dips to the south at about 50 feet per mile (Miller, 1982). Bedrock altitude from well data collected for this study range from 516 ft to 763 ft in the northern part of the Tug Hill glacial aquifer and from 451 to 1,018 ft in the central part (fig. 7). In general, the bedrock surface decreases in altitude westward from the top of the Tug Hill Plateau to Lake Ontario.
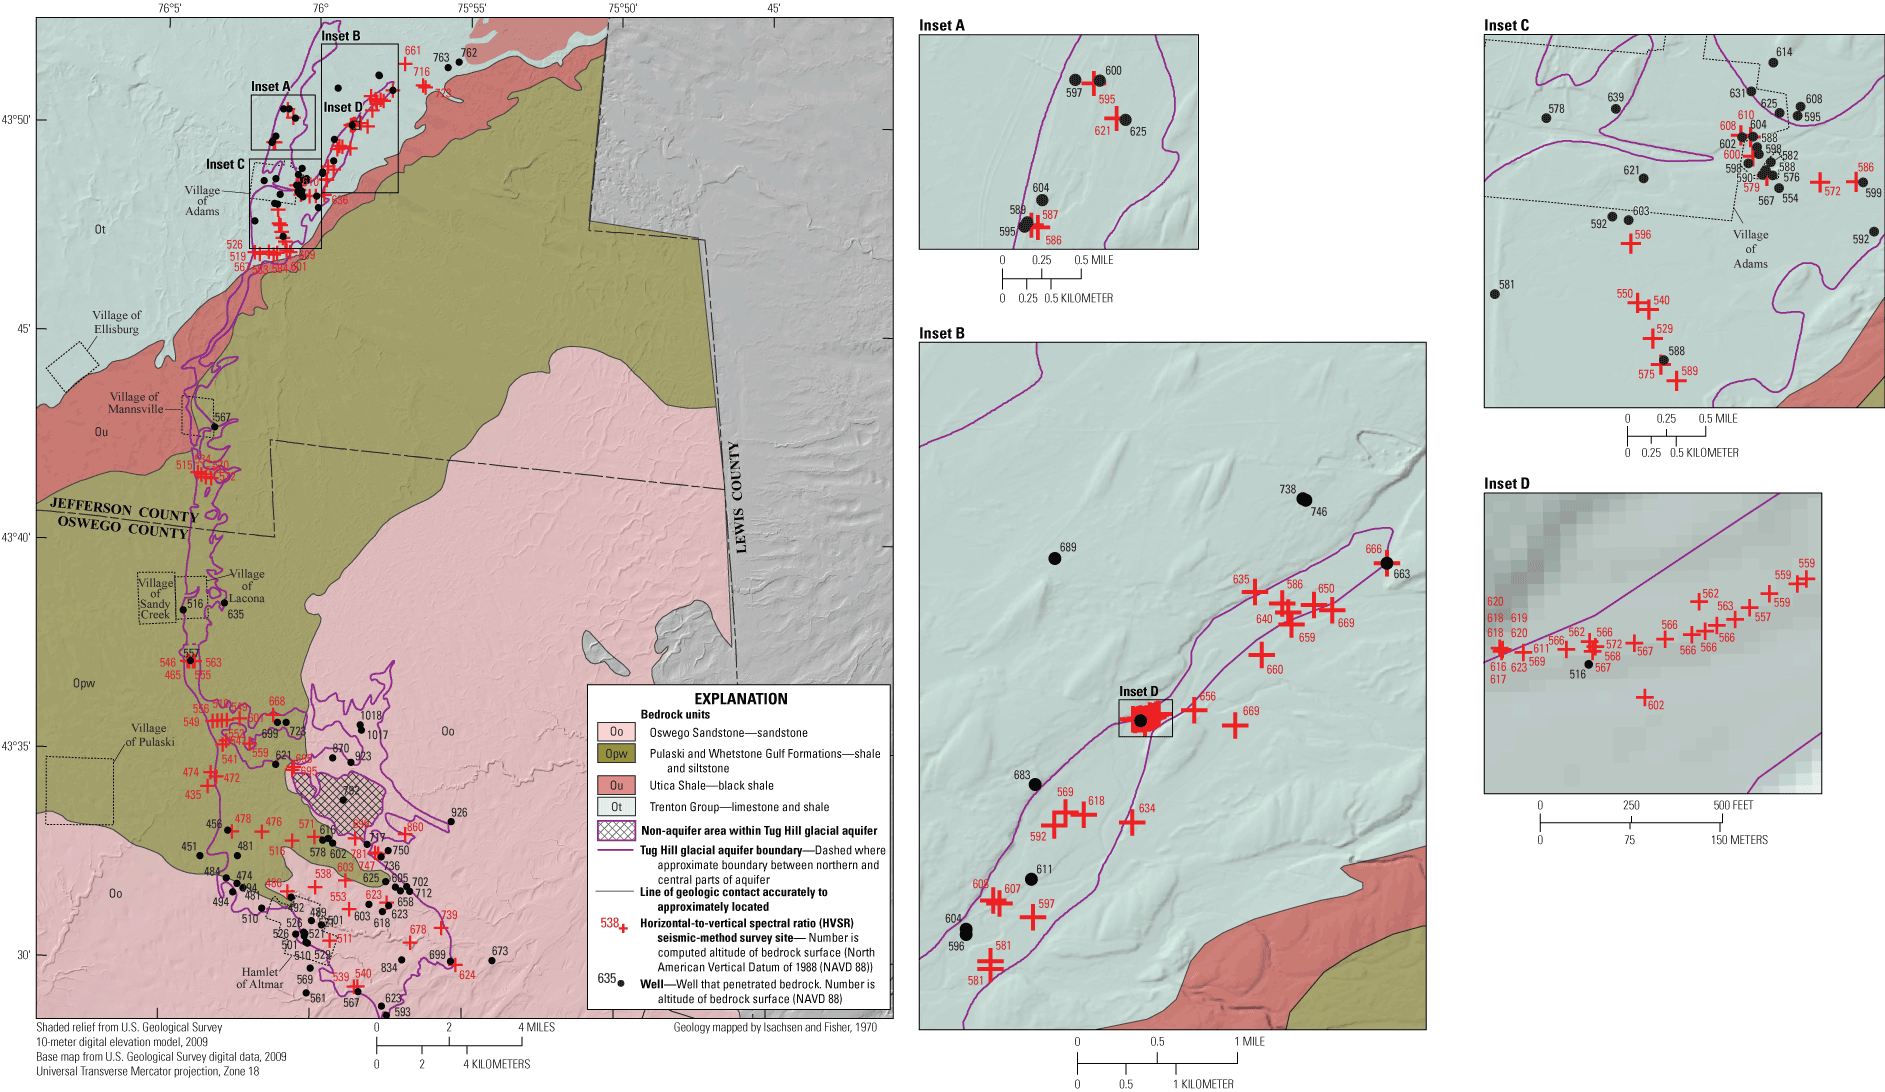
Map showing altitude of bedrock surface underlying the northern and central parts of the Tug Hill glacial aquifer, Jefferson and Oswego Counties, north-central New York. [A full-size version of figure 7 is available at https://doi.org/10.3133/sir20225039.]
Surficial Geology
Unconsolidated deposits that compose the Tug Hill glacial aquifer resulted from deposition of coarse-grained sediments during the last continental glaciation (which ended approximately 11,500 years ago), wave action along the shoreline of proglacial Lake Iroquois (about 11,400 years ago), and deposition of fluvial sediments by postglacial streams. The glacial history and distribution of glacial deposits and their relation to the succession of ice-margin advances and retreats are explained in detail by Miller and others (1988), and the extent of proglacial Lake Iroquois and profiles of its beach deposits are also shown in Miller and others (1988, figs. 7 and 8, p. 17–18). The distribution of geologic deposits mapped by Miller and others (1988) was modified by using new data collected during this investigation (fig. 8).
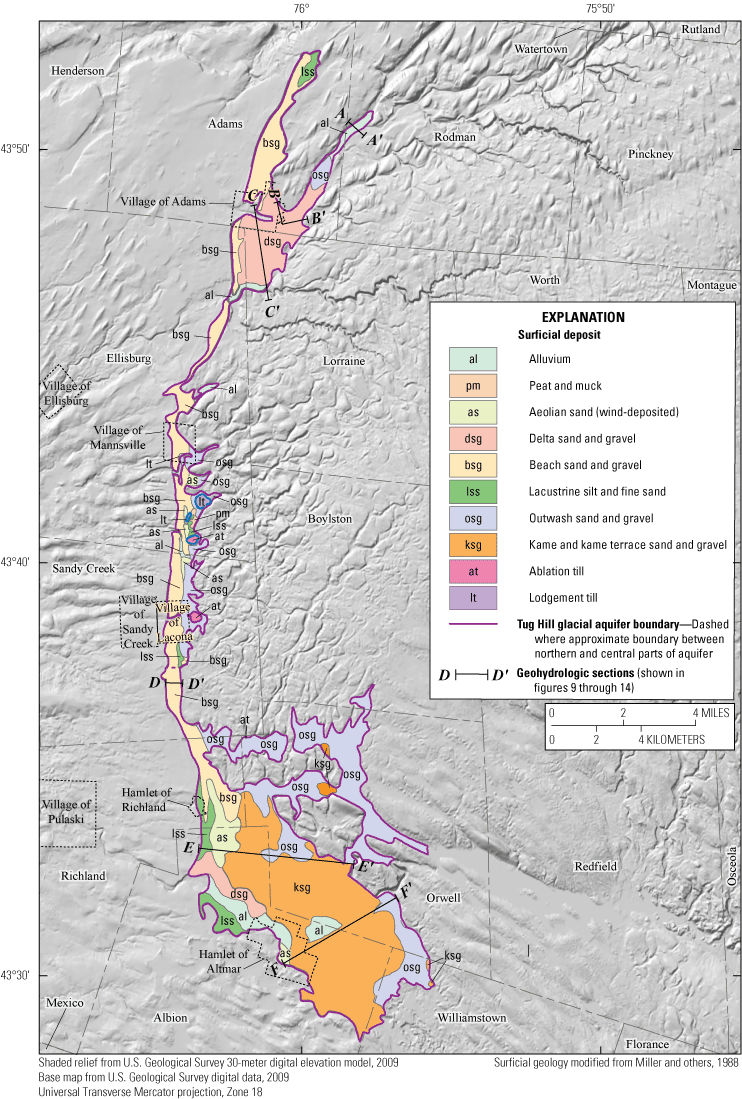
Map showing surficial geology of the northern and central parts of the Tug Hill glacial aquifer in Jefferson and Oswego Counties, north-central New York.
The study area contains unstratified (not layered) and stratified (layered) sediment. Unstratified deposits are mostly lodgment till ( l t) that was deposited directly by the glacier. Till is unsorted sediment that has a fine-grained matrix with some pebbles, cobbles, and boulders that are embedded in it, and it tends to be firm and dense because it had been compacted by the weight of the overlying glacier. Till has low hydraulic conductivity (low permeability) and generally does not yield useful amounts of water to wells—therefore, it is not part of the aquifer. In many places, till forms the boundaries of the sides and bottom of the aquifer. Stratified sediments have been sorted by water into layers: they are fine grained (fine sand, silt, and clay) in glaciolacustrine lake-bottom deposits and coarse grained (medium-to-coarse-grained sand, gravel, and cobbles) in glaciofluvial, alluvial, and shoreline glaciolacustrine deposits in beaches and the upper parts of deltas. Because fine-grained deposits have low hydraulic conductivity (low permeability) and typically do not yield useful amounts of water to wells, they are not considered part of the aquifer. Coarse-grained stratified sediments compose the aquifer because their relatively high hydraulic conductivity and permeability make it possible for them to yield useful quantities of water to wells.
Northern Part of the Aquifer
The northern part of the Tug Hill glacial aquifer system is composed of several types of coarse-grained glaciofluvial and glaciolacustrine deposits as well as some recently deposited alluvium (fig. 8). Outwash ( o s g) and recent alluvium ( a l) form the aquifer in the Sandy Creek Valley east of the village of Adams. Where southwestward-flowing meltwater in Sandy Creek Valley had exited from its narrow valley just east of the village of Adams, it had debouched into a wide embayment that was part of proglacial Lake Iroquois and deposited a wide delta ( d s g). The delta is composed of either sand ( l s s) or sand and gravel ( d s g). The sediments that compose the delta generally grade from coarse to fine-grained material from east to west and with increasing depth below the land surface; the exception is the western margin of the delta, which had been locally reworked into a coarse-gravel beach deposit by wave action along the shoreline of proglacial Lake Iroquois ( b s g; fig. 8). The remaining aquifer area in the northern part is composed of a series of long and narrow beach ridges that had also been developed by wave action along the shoreline of proglacial Lake Iroquois where it had lapped up against the western flank of the Tug Hill Plateau. The beach deposit is composed of well sorted sand and gravel on the tops of beach ridges and medium- to coarse-grained sand on the lower western flanks of the beaches near shallow offshore areas of the lake.
The fine-grained lake-bottom sediments consisting of fine sand, silt, and some clay ( l s s) that were deposited in relatively deep water in former proglacial Lake Iroquois make up the rest of the stratified deposits in the northern part of the Tug Hill glacial aquifer. These fine-grained sediments settled out of suspension and were deposited at the bottom of the lake. In some places in the northern part of the Tug Hill glacial aquifer, these sediments of low hydraulic conductivity (and low permeability) form the boundary of the western side and bottom of the aquifer. The sediments grade westward from fine sand near the shoreline of Lake Iroquois to distal silt and clay in the deeper and quieter water that was farther from the shoreline.
Central Part of the Aquifer
Most of the central part of the Tug Hill glacial aquifer is dominated by a 2-mi-wide and 6.5-mi-long kame and kame-terrace sand and gravel deposit ( k s g; fig. 8). Along the northern and western sides of the aquifer are minor amounts of other types of deposits, including a narrow band of sand and gravel beach deposits ( b s g) that were deposited along the shoreline of Lake Iroquois and a deltaic plain ( d s g) that was deposited where the Salmon River had debouched into Lake Iroquois. In addition, along the eastern side of the aquifer are minor amounts of outwash sand and gravel that were deposited by meltwater streams; in some places, the outwash deposits might subsequently have become mixed with alluvial sand and gravel that drained meltwater from the Tug Hill Plateau during the postglacial period (fig. 8).
Geohydrology of the Tug Hill Glacial Aquifer
The underlying bedrock, along with till that mantles it in some places, forms the bottom of the aquifer. The types of glacial deposits (beach, outwash, kame, and others) that overlie the bedrock often have distinct landforms that are characteristic of those types of deposits and therefore influence the aquifer geometry. The northern and central parts of the Tug Hill glacial aquifer are unconfined. Groundwater and most streams in the northern and central parts of the aquifer generally flow westward from the western edge of the Tug Hill Plateau across or through the aquifer. Recharge that ultimately comes from precipitation replenishes the aquifer with water and supplies the base flow in streams that flow over the aquifer. Groundwater discharges to pumping wells and infiltrates into stream channels, wetlands, and springs.
Aquifer Geometry
Northern Part of the Aquifer
Well and seismic data in the entire northern part of the aquifer indicate that the unconsolidated deposits range in thickness from 4 to 136 ft, with a median thickness of 38 ft. The aquifer geometry in the northern part of the aquifer varies depending on the geologic setting. Northeast of Adams, part of the Tug Hill glacial aquifer occupies a 5-mi-long by 0.4-mi-wide reach of the linear northeast-southwest-trending Sandy Creek Valley (fig. 5A). The aquifer in the Sandy Creek Valley is composed of 25- to 40-ft-thick deposits of outwash ( o s g) and alluvial ( a l) sand and gravel (figs. 8 and 9). Section A–A′ near Toad Hollow Road in the town of Rodman (figs. 5A, 8, and 9) shows that at least 20 ft of lodgment till underlie the 30 to 40 ft of sand and gravel; however, there are no data to determine whether the till extends to bedrock or other types of unconsolidated deposits underlie the till. Depth to bedrock in the center of the valley is about 80 ft below land surface based on a HVSR measurement in the center of the valley (fig. 9).
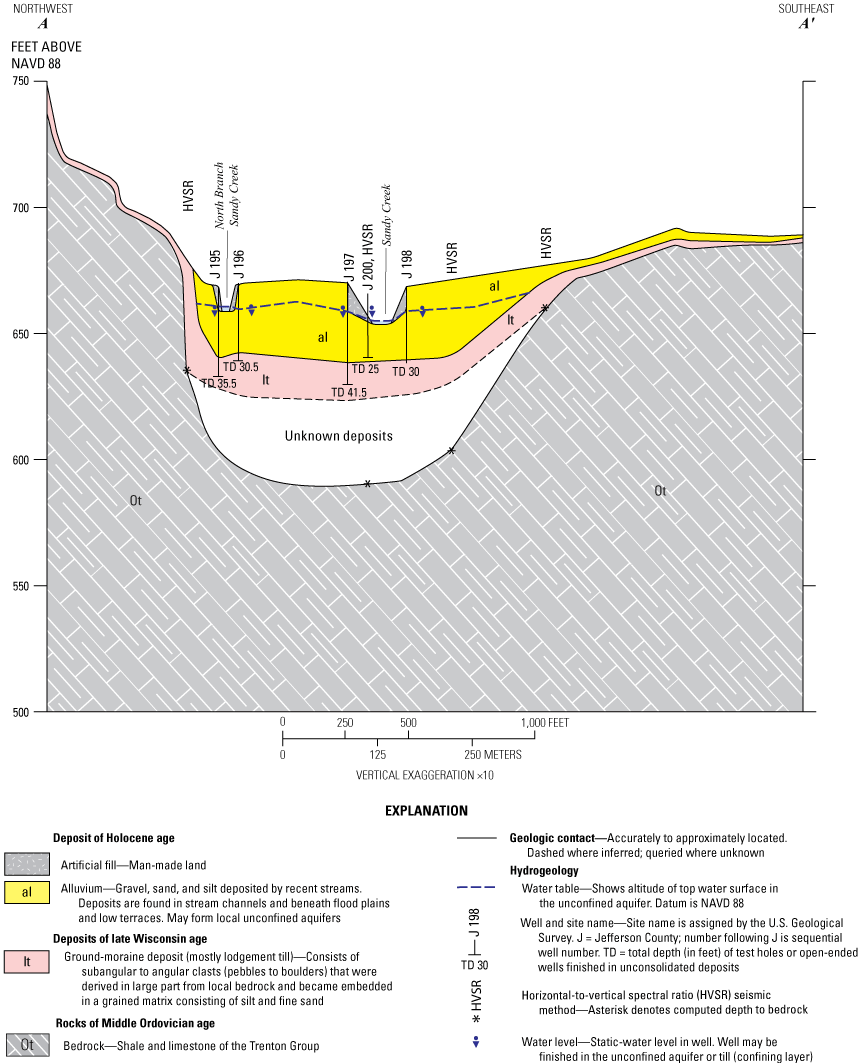
Geohydrologic section A–A′ across Sandy Creek Valley, along Toad Hollow Road (County Route 155), town of Rodman, Jefferson County, north-central New York. Location of section shown on figures 5A and 8. town boundaries are shown on figure 1.
Approximately 1.5 mi east of the village of Adams, the aquifer in the 0.4-mi-wide Sandy Creek Valley expands out to the west and southwest, forming a broad, 2.2-mi-wide deltaic plain ( d s g; fig. 8). The delta consists mostly of sand, gravel, and pebbly sand in the upper part and mostly sand with some silt and till in the deeper zones (figs. 10 and 11). In general, the deltaic sand and gravel aquifer is 30 to 40 ft thick in the eastern part (fig. 10) and 40 to 55 ft thick in the western part. Locally, deposits are as much as 100 ft thick over a buried bedrock valley that underlies the central part of the delta (fig. 11). The buried valley beneath the delta is in the relatively soft and easily erodible Utica Shale ( Ordovician u) along its contact with the hard and resistant Trenton Limestone ( Ordovician t; fig. 11). It is likely that this contact was a bedrock control for the formation of the buried valley because of preferential erosion of the softer Utica Shale that proceeded along the contact.
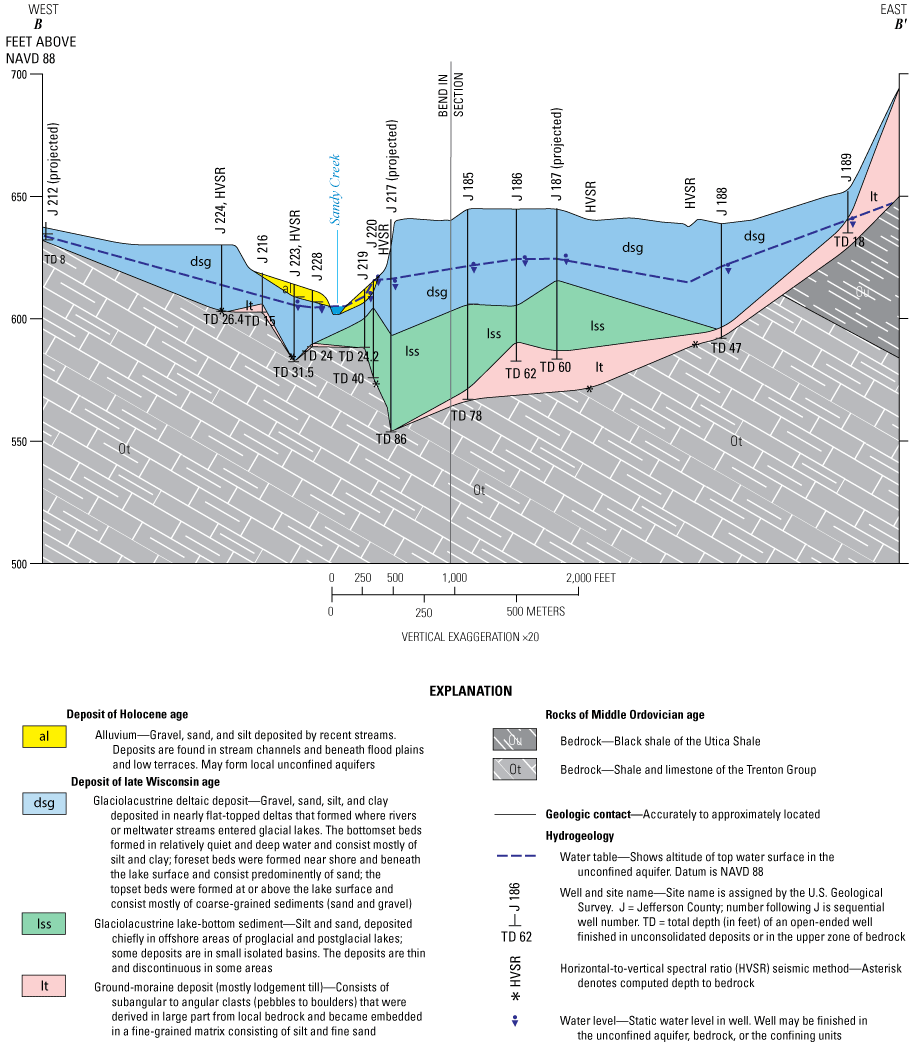
Geohydrologic section B–B′ across Sandy Creek Valley, village of Adams, and along Spring Street, town of Adams, Jefferson County, north-central New York. Location of section shown on figures 5A and 8. Town boundaries are shown in figure 1.
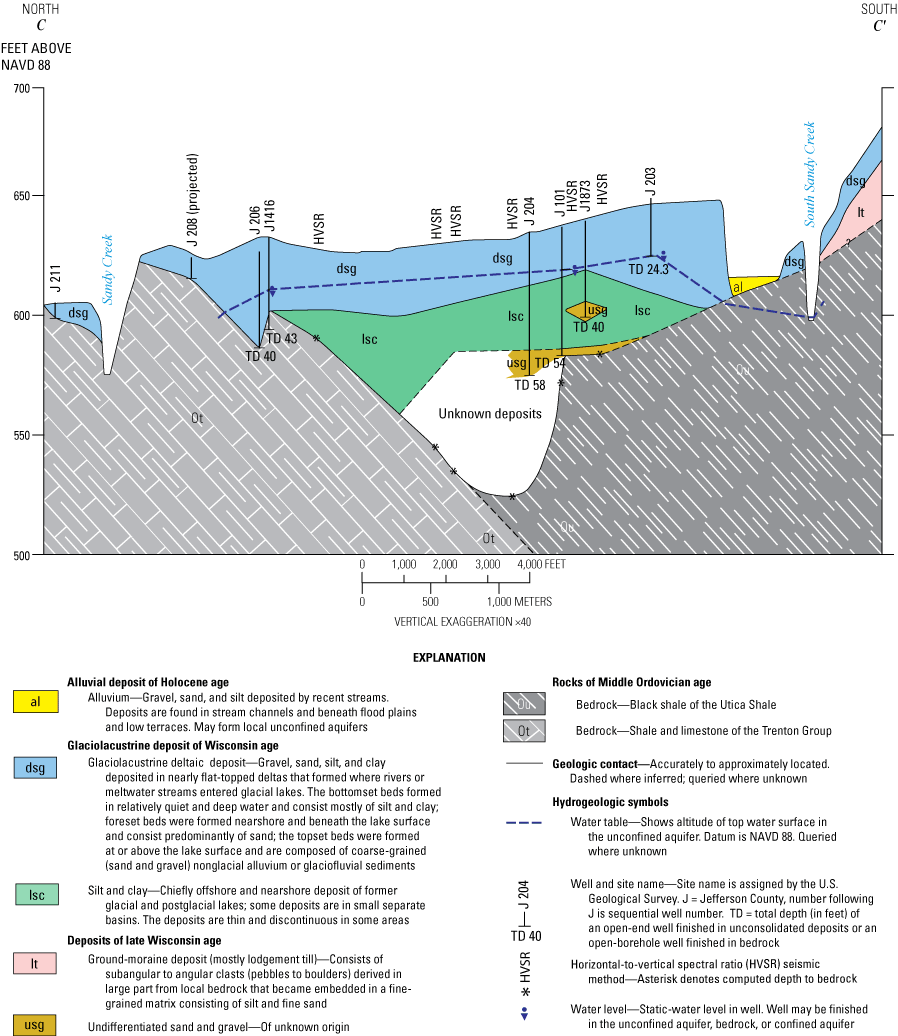
Geohydrologic section C–C′ across Sandy Creek Valley, village of Adams, and South Sandy Creek Valley, town of Lorraine, Jefferson County, north-central New York. Location of section shown on figures 5A and 8. Town boundaries are shown in figure 1.
The western side of the deltaic plain has been reworked into a beach ridge ( b s g; fig. 8) by wave action along the shoreline of proglacial Lake Iroquois. Beach ridges also form most of the narrow reaches of the aquifer to the north of and at the village of Adams as well as to the south of the deltaic plain (fig. 8). Well and seismic data indicate that the beach-ridge deposits range in thickness from 20 to 50 ft in the northern part of the aquifer (fig. 5A; Fisher and Keto, 2022a, b).
Central Part of the Aquifer
Because of differences in the sedimentary depositional history during deglaciation of the central and northern parts of the Tug Hill glacial aquifer, the composition of the aquifer material differs between the two parts. The largest difference is the deposition of a large kame-moraine deposit ( k s g) that dominates the central part of the aquifer (fig. 8) but is absent in the northern part. Similarities between the two aquifer parts include deltas and extensive beach ridges.
From well and seismic data collected for this study in the central part of the Tug Hill glacial aquifer, unconsolidated deposits range in thickness from 5 to 130 ft, with a median thickness of 43.5 ft. Geohydrologic section D–D′ (figs. 5B, 8, and 12) depicts the typical framework in the northern area of the central part of the aquifer. In this area, beach sand-and-gravel deposits were deposited along the shoreline of proglacial Lake Iroquois, which bounded the western flank of the Tug Hill Plateau in this area. These beach deposits typically range in thickness from 20 to 40 ft and directly overlie bedrock or a thin till layer above the bedrock. The bedrock and till form the bottom of the aquifer.
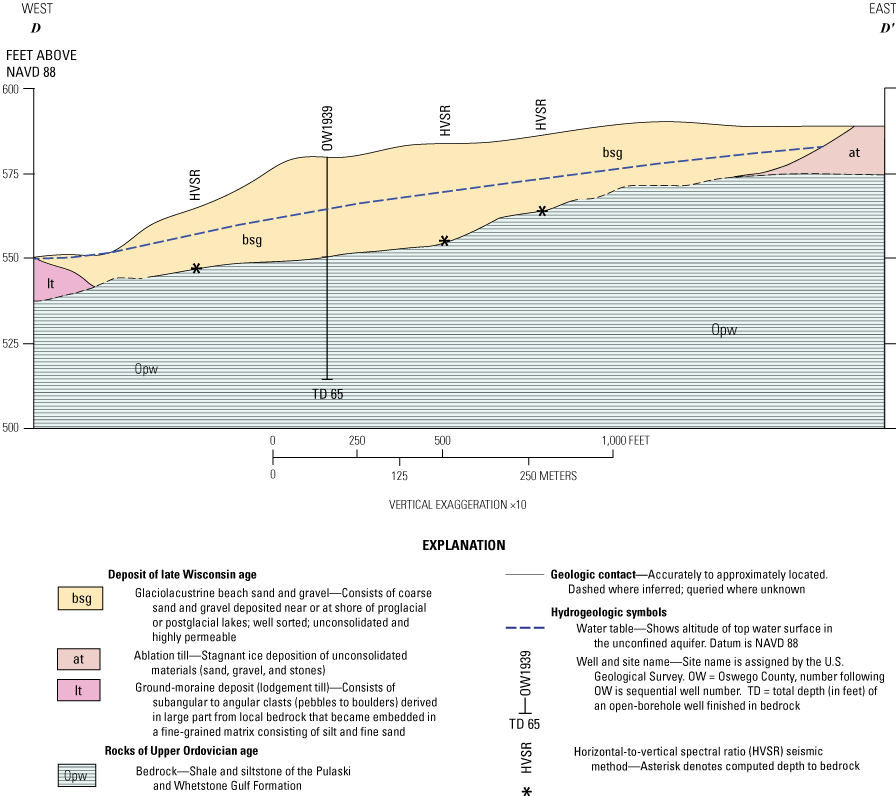
Geohydrologic section D–D′ along Edwards Road, town of Sandy Creek, Oswego County, north-central New York. Location of section shown on figures 5B and 8. Town boundaries are shown on figure 1.
Section E–E′ (figs. 5B, 8, and 13) typifies the middle portion of the central part of the aquifer, which is dominated by a large complex of kames, kame deltas, and kame terraces ( k s g) that were deposited at the ice front of the retreating glacier. In some places in the western part of the aquifer, lake silt and fine sand ( l s s) and some minor amounts of aeolian sand (sand dunes; a s) overlie lacustrine, beach, and kame deposits (fig. 13).
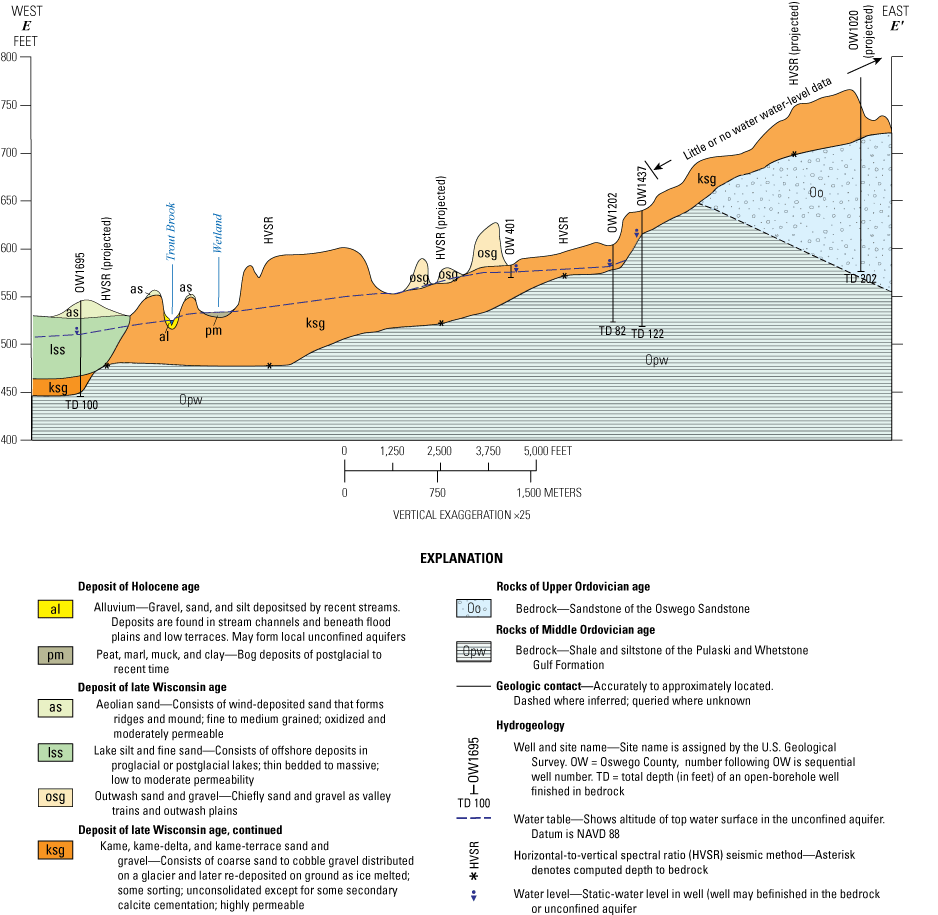
Geohydrologic section E–E′ in the towns of Albion and Orwell, Oswego County, north-central New York. Location of section shown on figures 5B and 8. Town boundaries are shown on figure 8.
Section F–F′ (figs. 5B, 8, and 14) typifies the aquifer framework in the southernmost area of the central part of the Tug Hill glacial aquifer, which is also dominated by a large complex of very hummocky kames, kame deltas, and kame terraces ( k s g). In this area, outwash sand and gravel overlie some of the kame deposits in some places in the eastern part of the aquifer (fig. 14).

Geohydrologic section F–F′ in the towns of Albion and Orwell, Oswego County, north-central New York. Location of section shown on figures 5B and 8. Town boundaries are shown on figure 8.
Bedrock
Although bedrock is not a major part of this report because most homeowners, farms, and businesses above the Tug Hill glacial aquifer have wells that tap the glacial aquifer (which usually supplies ample amounts of good-quality water), bedrock is mentioned briefly here because, in most places, it is directly beneath the Tug Hill glacial aquifer and forms the bottom boundary of the Tug Hill glacial aquifer. In some places, wells are finished in the bedrock where the glacial aquifer is thin or seasonally unsaturated; however, bedrock aquifers generally yield less water to wells, and the water is of poorer quality.
From north to south, bedrock underlying the northern part of the Tug Hill glacial aquifer consists of the Middle Ordovician Trenton Group composed of limestone and shale ( Ordovician t; fig. 6), the fine-grained black Utica Shale ( Ordovician u); and the Upper Ordovician Pulaski and Whetstone Gulf Formations composed of shale and siltstone ( Ordovician p w). Well yields are usually greater in the limestone units than in the shale and siltstone units, especially where wells penetrate solution-widened fractures in the limestone (Waller and Allen, 1975; Kantrowitz and Snavely, 1982).
From north to south, bedrock underlying the central part of the Tug Hill glacial aquifer consists of the Upper Ordovician Pulaski and Whetstone Gulf Formation composed of shale and siltstone ( Ordovician p w; fig. 8) and the Oswego Sandstone ( Ordovician o; fig. 6). These rocks have lower hydraulic conductivity than the Tug Hill glacial aquifer. Some water-transmitting fractures in these rocks might yield amounts of usable water sufficient to supply homeowners and small farms (Miller, 1982).
Although most water in the Tug Hill glacial aquifer is derived ultimately from precipitation that infiltrates at the surface of the aquifer, a small amount of groundwater from the underlying bedrock enters the bottom of the glacial aquifer. This recharge to the glacial aquifer from bedrock occurs where the bedrock is hydraulically connected to the glacial aquifer, and the hydraulic head is greater in the bedrock than in the glacial aquifer. This relation between bedrock and the glacial aquifer was found in the Sandy Creek Valley (2.5 mi northeast of Adams) where two test wells were drilled, one into bedrock (J 231) and one into the overlying Tug Hill glacial aquifer (J 230), to determine the direction of vertical flow and recharge potential from the underlying bedrock to the Tug Hill glacial aquifer (figs. 5A and 15). The altitude of the water level in the 202-ft-deep bedrock well was 2 ft higher (altitude 648.34 ft) than the water level in the 42-ft-deep well (altitude 646.04 ft) that is finished in the Tug Hill glacial aquifer; this difference indicates that groundwater flows vertically upward from the bedrock to the Tug Hill glacial aquifer at this site. It is unknown whether this relation occurs elsewhere in the Tug Hill glacial aquifer or the reverse relation exists (groundwater flowing from the Tug Hill glacial aquifer to the underlying bedrock). More nested pairs of wells would be needed to determine the groundwater interactions between the Tug Hill glacial aquifer and the underlying bedrock.
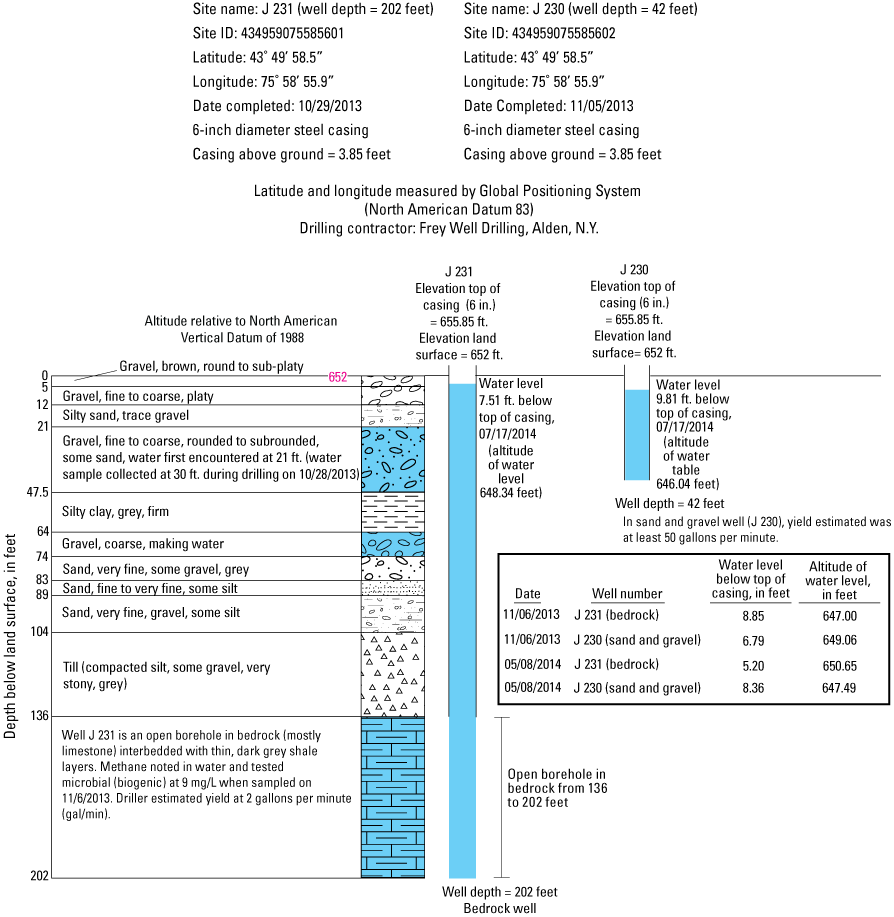
Well-log and construction details of U.S. Geological Survey test wells J 231 and J 230 near the abandoned quarry adjacent to Fuller Road, town of Adams, north-central New York. Locations of test wells shown on inset maps in figure 5A.
Although bedrock units were not generally a major part of this report, the top of the bedrock is an important component in the aquifer framework because it is the geologic unit immediately beneath the bottom of the Tug Hill glacial aquifer. The altitude of the bedrock surface differs throughout the northern and central parts of the Tug Hill glacial aquifer. The depth to and altitude of the top of bedrock were determined from well records (Fisher and Keto, 2022a) and 139 HVSR seismic surveys (Fisher and Keto, 2022b). HVSR seismic surveys were conducted to determine the depth to bedrock in areas for which there were few well data. These data indicate that, in the northern part of the glacial aquifer, the bedrock surface ranges in altitude from 516 to 763 ft, with a median altitude of 595 ft, and in the central part of the aquifer, the bedrock surface ranges in altitude from 451 to 1,018 ft, with a median altitude of 568 ft (fig. 7). Well and seismic data indicate that the depth to bedrock below land surface in the northern part of the aquifer ranges from 4 to 136 ft and in the central part from 5 to 130 ft deep.
Several seismic surveys were conducted at well sites to enable comparison of the computed seismic bedrock depth to the bedrock depth measured in the well. The seismic surveys generally agreed with the well data. The percent difference between the depths to bedrock reported on drillers’ logs (table 2) and calculated as simple, one-peak solutions on the basis of HVSR data (Lane and others, 2008) for nearby wells was between 0 and 56 percent.
Table 2.
Comparison of depths to bedrock estimated from horizontal-to-vertical spectral ratio seismic surveys and depths reported on drillers’ logs for selected wells in the Tug Hill glacial aquifer, Jefferson and Oswego Counties, north-central New York.[Data are from Fisher and Keto (2022b). Locations of horizontal-to-vertical spectral ratio (HVSR) sites are shown on figures 5 and 7. J, Jefferson County; OW, Oswego County; ft, foot]
Groundwater Levels and Flow Direction
Groundwater-level data were collected throughout the northern and central parts of the Tug Hill glacial aquifer in the mid-1980s (Miller and others, 1988) and for this study from 2008 to 2014 (fig. 16A and B; Fisher and Keto, 2022a). In addition, groundwater-level data had been collected in two small parts of the Tug Hill glacial aquifer (hamlet of Richland and villages of Sandy Creek and Lacona) during the early to mid-2000s (Miller and others, 2007). For this study, synoptic groundwater-level measurements were made in 22 wells during an average annual water-level period on July 17, 2014. The average annual water-level period for the study area was based on groundwater data that had been collected since 1999 at the USGS long-term monitoring well OW5013, Oswego County, New York. These synoptic measurements and select earlier groundwater-level measurements that were made from 1985 to 2014 during a period of approximately average annual water-level conditions (mid-May through July) were used to construct a contour map depicting a regional approximation of the altitudes of the water table in the Tug Hill glacial aquifer (fig. 16A and B). This regional approximation was drawn at mixed contour intervals of 10 and 20 ft (fig. 16A and B). The configuration of the water-table contours is useful in determining groundwater-flow directions because groundwater flows in the direction approximately perpendicular to the contour lines.
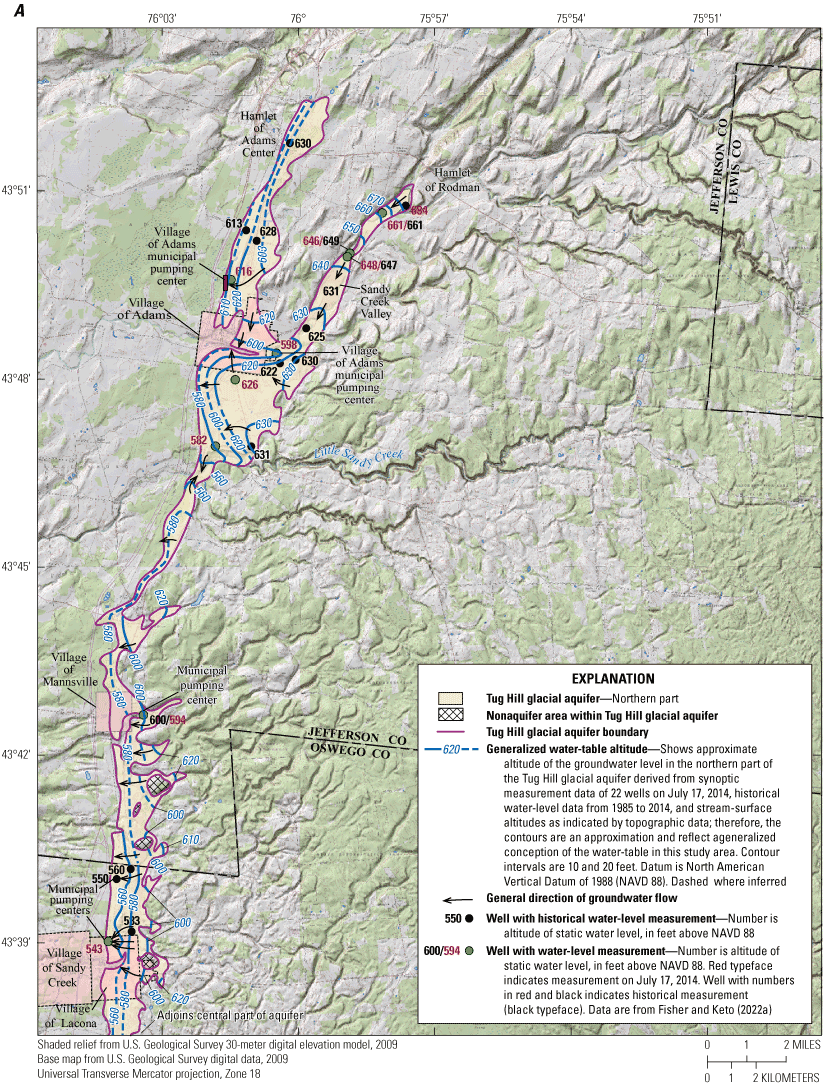

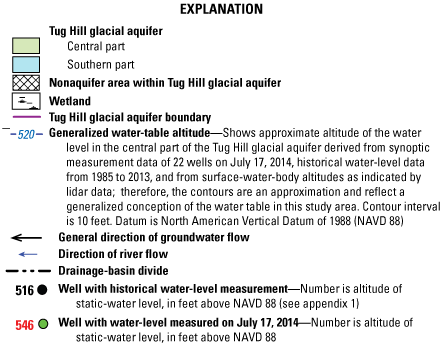
Maps showing synoptic groundwater-level data and generalized water-surface altitudes in the unconfined aquifers in the A, northern part, and B, central part of the Tug Hill glacial aquifer, Jefferson and Oswego Counties, north-central New York.
The synoptic groundwater-level data were the primary control for constructing the configuration of groundwater contours (fig. 16A and B). In addition to the synoptic groundwater-level data, the configuration of the contours was also guided by using historical groundwater-level data and surface-water altitudes where topographic contours cross surface-water bodies in areas where the groundwater system is hydraulically connected to surface water (in stream channels, ponds, and wetlands). Although there may have been slight positive trends in precipitation and snowfall from 1985 to 2014 at the Watertown and Bennett Bridge meteorological stations (figs. 2 and 17), it is reasonable to use historical groundwater-level data in the regional assessment of the altitude of the water table because the trends over the 29-year period are not statistically significant; this result indicates that there have been few significant changes in precipitation and snowfall during that period. The temporal-trend slopes were based on the Mann-Kendall test (Salmi and others, 2002), and are as follows: Watertown precipitation, +0.207 in/yr; Bennett Bridge precipitation, +0.278 in/yr; Watertown snowfall, +1.063 in/yr; and Bennett Bridge snowfall, +1.744 in/yr. These trend tests indicate that precipitation and snowfall have been relatively constant or have increased slightly from 1985 to 2014 in the Tug Hill region (fig. 17). In addition, use of the generalized regional water table was considered reasonable because continuous water-level data from wells OW 491, OW 376, OW 396, and J 107 show that the altitude of the water table does not normally fluctuate annually by more than 15 ft (fig. 18). Therefore, construction of water-level contours at 10- and 20-ft intervals is reasonable for a regional approximation of average annual water levels in the unconfined Tug Hill glacial aquifer.
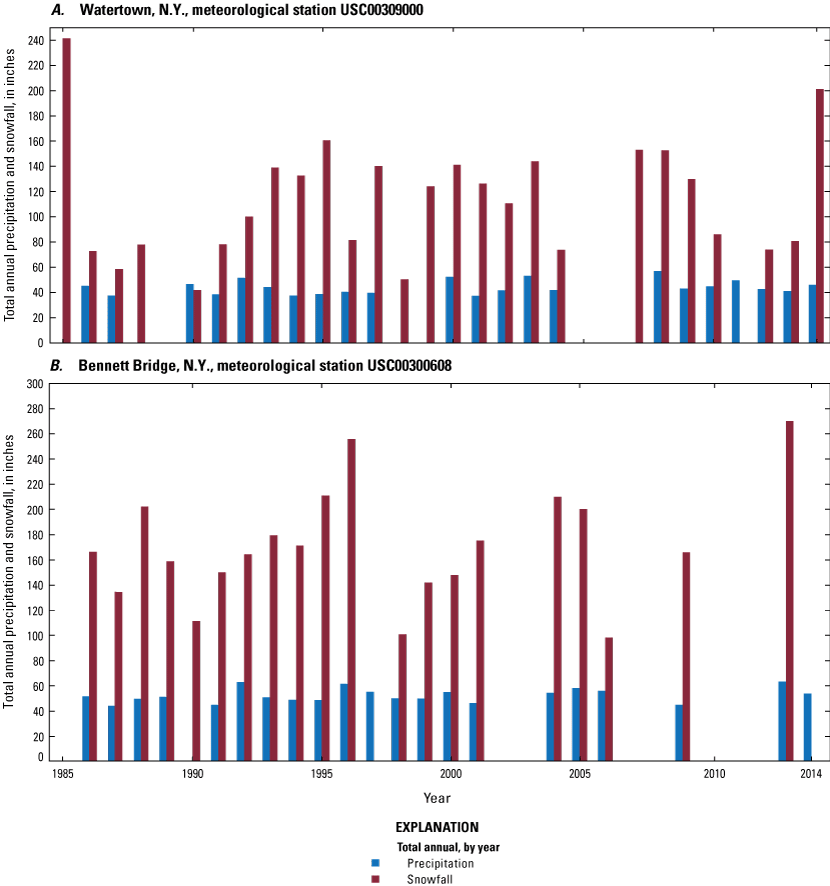
Graphs showing total annual precipitation and annual snowfall, in inches, for the National Oceanic and Atmospheric Administration meteorological stations at A, Watertown and B, Bennett Bridge, north-central New York, from 1985 to 2014.
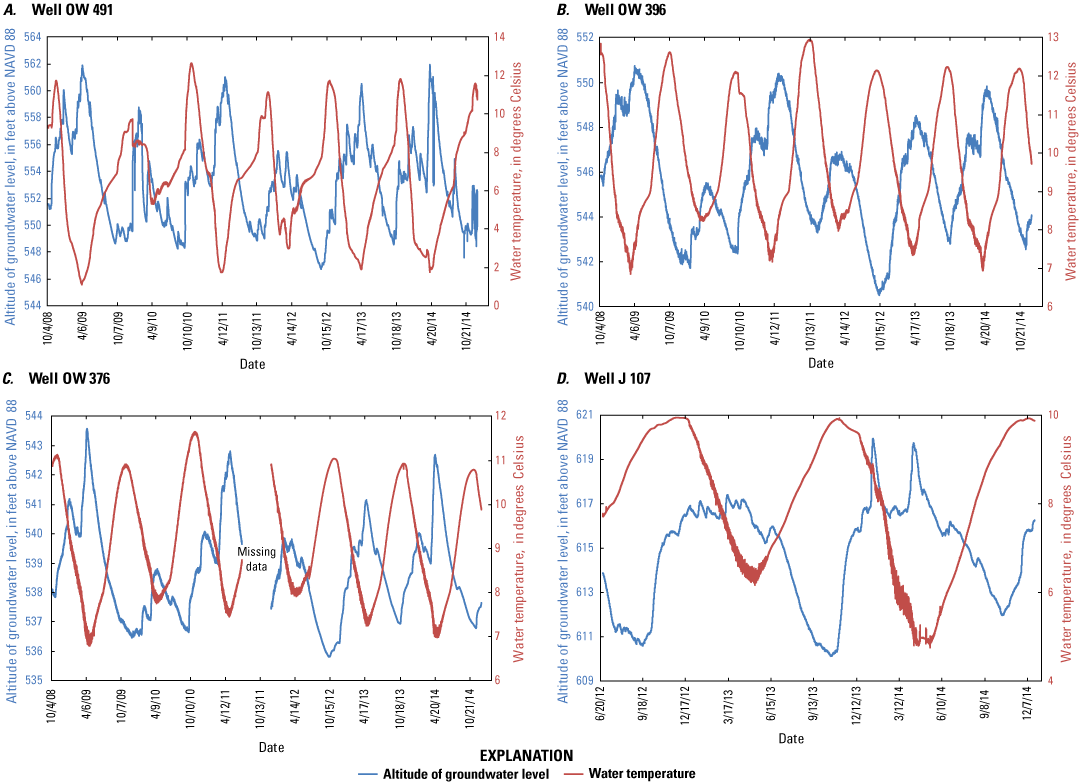
Graphs showing the altitudes of groundwater levels and water temperatures for test wells A, OW 491, B, OW 396, and C, OW 376 in Oswego County, north-central New York, from October 10, 2008, to July 17, 2014, and D, J 107 in Jefferson County, north-central New York, from June 26, 2012, to December 22, 2014.
Northern Part of the Aquifer
The Sandy Creek Valley northeast of the village of Adams, was investigated in detail because (1) the northernmost extent of the aquifer boundary was uncertain (on the basis of evidence that the aquifer might extend farther upgradient in the valley to the northeast than previously mapped by Miller and others, 1988), (2) the village of Adams was exploring nearby areas for an additional source of water, and (3) the linear shape of the valley might have been a result of faulting in the bedrock. In this case, a transmissive rubble zone might have developed along the fault and thus provided a significant local aquifer beneath the Tug Hill glacial aquifer.
If the suspected fault zone were sufficiently fractured and the gradient in hydraulic head vertical and upward within the zone, then a potentially abundant source of groundwater could feasibly flow upward through the rubble zone in the bedrock and recharge the overlying Tug Hill glacial aquifer. HVSR passive seismic surveys in the Sandy Creek Valley were used to determine the altitude of the top surface of bedrock (fig. 7) and detect any indication of fault displacement. Also, two-dimensional electrical resistivity surveys conducted by a hydrogeological consultant for the village of Adams (Hydrosource Associates Inc., 2012), indicated that there was a structural anomaly (possible fault) in this valley.
To find answers to the issues listed above, two USGS test wells (J 230 and J 231) were completed in the Sandy Creek Valley on October 29, 2013 (well logs shown on fig. 15). The test wells were at the previously mapped northernmost extent of the aquifer boundary (Miller and others, 1988), which is between two drumlins (composed of till) that constrict and narrow the Sandy Creek Valley (fig. 5A, inset D). Well J 230 was drilled to a depth of 42 ft below land surface and was finished as an open-end casing in sand and gravel of the Tug Hill glacial aquifer (fig. 15). After well J 230 was developed for 2 hours, the driller reported a visual estimated yield of more than 100 gallons per minute (gal/min); however, this estimate was lowered to about 50 gal/min by the USGS after a volumetric measurement was made of the discharge of the pumped water from the well.
Well J 231 was drilled to a depth of 202 ft below land surface and was finished as an open borehole in the bedrock from depths 136 to 202 ft (fig. 15). Bedrock was first encountered at 136 ft (fig. 15). After well J 231 was developed for 2 hours, the bedrock well yielded only a small amount of water (2 gal/min). During the drilling of well J 231 on October 28, 2013, a groundwater sample was collected from a sand-and-gravel zone at the depth of 30 ft; groundwater samples were collected from both finished wells on November 6, 2013, to characterize the quality of water in the bedrock and in the sand and gravel aquifers and to determine if there was a hydraulic connection between the two aquifers (the results of the chemical analyses are discussed in the “Water Quality” section of this report).
Water levels that were measured in both wells on November 6, 2013, May 8, 2014, and July 17, 2014, indicated that the hydraulic-head relation between the bedrock and sand and gravel aquifers varied: the hydraulic head was higher in the sand and gravel aquifer by 2.06 ft on November 6, 2013, and higher in the bedrock aquifer by 3.16 ft on May 8, 2014, and 2.30 ft on July 17, 2014. However, subsequent water-level measurements (fig. 19) collected by a continuous water-level recorder (data logger with pressure transducer) indicated that the water level in the bedrock well (J 231) was consistently higher than that in the sand and gravel well (J 230) by about 2 to 3 ft during the data-collection period. Therefore, the water-level data indicates that, most of the time, there is a hydraulic potential for upward vertical movement of groundwater from the bedrock into the overlying sand and gravel in this area (fig. 19). Even though there exists a hydraulic potential for a vertical component of groundwater movement from the bedrock upward into the overlying Tug Hill glacial aquifer, two layers of relatively impermeable sediment and low hydraulic conductivity separate the Tug Hill glacial aquifer from the bedrock—a 16.5-ft thick layer of firm silty clay at depths of 47.5 to 64 ft and a 32-ft-thick layer of compacted till at depths of 104 to 136 ft that directly overlies the bedrock (fig. 15). Because of the small differences in water levels and the two relatively impermeable units that separate the bedrock from the Tug Hill glacial aquifer, discharge rates from bedrock to the Tug Hill glacial aquifer in this immediate area are likely to be low.

Graph showing the altitudes of groundwater levels measured in test wells J 230 (finished in the unconfined sand gravel aquifer) and J 231 (finished in the bedrock aquifer) in Jefferson County, north-central New York, from November 8, 2013, to July 17, 2014, and total daily precipitation at the National Oceanic and Atmospheric Administration (NOAA) meteorological station USC00309000 at Watertown, New York, from November 1, 2013, to July 31, 2014. Locations of wells shown on inset map in figure 5A.
Water-level data (fig. 20) collected from a pressure transducer that was installed in Sandy Creek (station identifier 04250730; fig. 21A) at a bridge about 1 mi south of the test wells J 230 and J 231 was used to determine the degree of interaction between surface water and groundwater in the bedrock and the Tug Hill glacial aquifer in the Sandy Creek Valley. The relation between the altitudes of the hydraulic heads in the bedrock and Tug Hill glacial aquifer and the altitudes of the stream stages in Sandy Creek are shown in figure 20. These data indicate that water levels in the Tug Hill glacial aquifer rise and fall rapidly and correlate with time and the stage fluctuations in the stream, but the water levels in the bedrock aquifer have a more muted response to fluctuations in stream stage. The water levels after a large snowfall followed by an immediate warming trend and rain during the last 10 days of November 2014 are shown in the inset (detail) graph on figure 20: the stream stage and the groundwater levels in the Tug Hill glacial aquifer increased rapidly, but the rise in the water level in the bedrock aquifer was slower and more gradual. Also, there was a lag in the timing of the water-level peak in the bedrock aquifer after the snowstorm and the melting of the snow (fig. 20, inset [detail] graph).
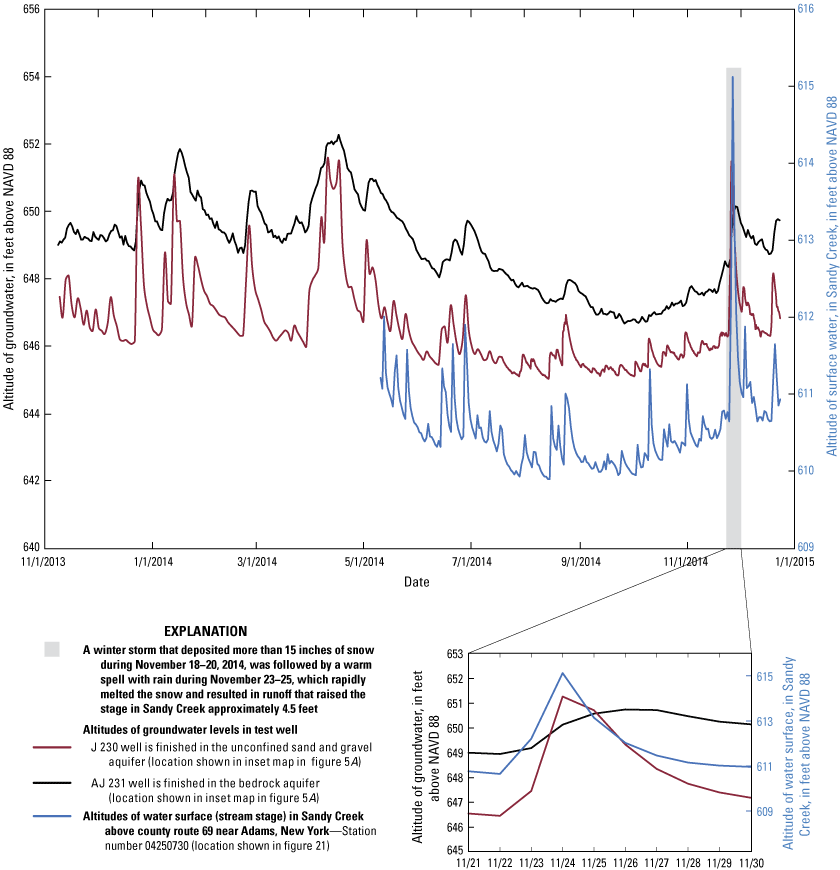
Graphs showing altitudes of groundwater levels in test wells J 230 (finished in the unconfined sand and gravel aquifer) and J 231 (finished in the bedrock aquifer) in Jefferson County, north-central New York, from November 8, 2013, to December 22, 2014, and of the water surface in Sandy Creek near Adams, north-central New York, from May 8, 2014, to December 22, 2014. Location of wells shown on inset maps in figure 5A.

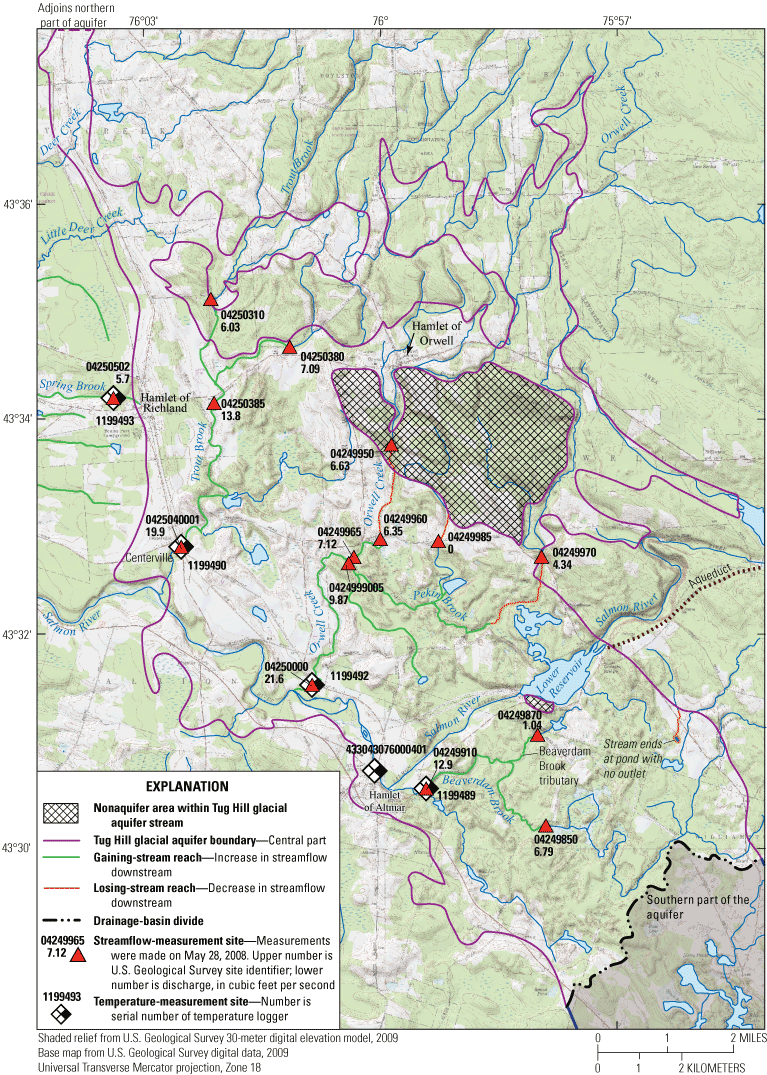
Maps showing streamflow gains and losses and locations of six stream-temperature-measurement sites in A, the northern part of the Tug Hill glacial aquifer (June 2, 2009), and B, the central part of the Tug Hill glacial aquifer (May 29, 2008) in Jefferson and Oswego Counties, north-central New York.
Because groundwater levels in bedrock usually follow, but lag behind those of the water levels in the Tug Hill glacial aquifer and of the stream stage in Sandy Creek (fig. 20), this trend suggests that either there is a small hydraulic connection between the bedrock, the Tug Hill glacial aquifer, and Sandy Creek at the test well site (even though there are two relatively impermeable units separating the Tug Hill glacial aquifer from the bedrock at the drill sites of test wells J 230 and J 231; fig. 5A) or the hydraulic connection may be in an area in the aquifer other than the test well site, possibly where the confining units are thinner or absent. One example of where the confining bed is absent is on the northwestern valley wall about 0.45 mi to the north of test wells J 230 and J 231 where bedrock is exposed in the stream channel of Sandy Creek; at this location, the stream impinges against the valley wall.
The regional direction of groundwater flow in the northern part of the Tug Hill glacial aquifer is from east to west, with all water ultimately discharging into Lake Ontario. Locally, the direction of groundwater flow depends on the geologic and hydrologic setting. In the Sandy Creek Valley, northeast of the village of Adams, the direction of flow is from the valley walls to Sandy Creek, which is the main groundwater sink in the valley (fig. 16A). In the beach deposits, north and south of the village of Adams, groundwater enters the eastern sides of the beaches and flows westward through the narrow aquifer and discharges to the headwaters of many small streams and wetlands that border the western side of the aquifer. In the broad deltaic plain part of the aquifer, south and east of the village of Adams, groundwater enters the eastern side of the delta and then fans out across the plain. Groundwater in the northern part of the fan flows to the northwest and discharges into Sandy Creek in the village of Adams. In the central part of the delta, groundwater generally flows to the west and discharges to wetlands and to the headwaters of many small streams that border the western side of the aquifer, which also flow to the west and discharge into Lake Ontario. In the southern part of the delta, groundwater flows to the southwest and discharges into Little Sandy Creek (fig. 16A), which also flows westward and empties into Lake Ontario (fig. 2).
Central Part of the Aquifer
The regional direction of groundwater flow in the central part of the Tug Hill glacial aquifer is predominantly from east to west (fig. 16B). Locally, the direction of groundwater flow is highly variable and depends on the local geologic and hydrologic setting. The direction of groundwater flow is controlled mostly by the distribution of sources of recharge and the configuration of the discharge areas, such as the stream and wetland network over the aquifer. It is difficult to describe or generalize the direction of groundwater flow in the central part of the aquifer because the direction of flow is complex and highly variable; it can change within a short distance because of the numerous wetlands that are scattered throughout this part of the aquifer and the complex network of streams that flow in many directions (all directions except eastward). The arrows, which are perpendicular to the contours on the water-table map (fig. 16B), depict the approximate directions of groundwater flow. Because water-level data were not available for the easternmost area of the central part of the aquifer, the altitudes of the water table could not be determined in these areas.
Groundwater Recharge and Surface-Water Interaction
Northern Part of the Aquifer
Groundwater in the northern part of the Tug Hill glacial aquifer is recharged by (1) precipitation that falls directly on the aquifer, (2) unchannelized runoff from till and bedrock hills that border the eastern side of the aquifer, (3) losses from streams that drain the Tug Hill Plateau and discharge water into the eastern area of the aquifer, and (4) groundwater inflow from the till and bedrock on the adjoining Tug Hill Plateau (Miller and others, 2007) or in some places from bedrock underlying the glacial aquifer. Streamflow gain-and-loss measurements were made on June 2, 2009, in selected streams that flow over the Tug Hill glacial aquifer in and near the village of Adams (fig. 21A; table 3) to determine the amount of recharge that the aquifer receives from losing streams and the amount that discharges from the aquifer to gaining reaches of streams. The results of these measurements indicated that most stream reaches were gaining streamflow (receiving discharge from the aquifer) except for two tributaries to Sandy Creek on the eastern side of the aquifer between USGS sites 04250736 (1.2 cubic feet per second [ft3/s]) and 04250737 (0.81 ft3/s) and sites 04250738 (0.04 ft3/s) and 04250739 (0.0 ft3/s). Both these reaches (fig. 21A, orange lines) were losing streamflow to the aquifer. The streamflow gain-and-loss measurements made for this study are consistent with the conceptual recharge model proposed by Miller and others (2007, fig. 17).
Table 3.
Streamflow measurements for selected streams in the northern and central parts of the Tug Hill glacial aquifer, Jefferson and Oswego Counties, north-central New York on June 2, 2009, and May 29, 2008, respectively.[Total sums of computed values may not equal sums of components because of independent rounding. USGS, U.S. Geological Survey; no., number; ft3/s, cubic foot per second; Mgal/d, million gallons per day; Mgal/yr, million gallons per year; CR, County Road]
Water-temperature data were collected from Sandy Creek Tributary 5 (fig. 21A) in the village of Adams from May 2008 to September 2009 (fig. 22) to determine the interaction between surface water and groundwater in this area of the northern part of the aquifer. The temperature data for the northern part of the aquifer at Sandy Creek Tributary 5 at Adams, N.Y. (USGS station number 04250747) shows an increase in surface-water temperature from 39.9 degrees Fahrenheit (°F; 4.4 degrees Celsius [°C]) in early spring 2009 to more than 60.1°F (15.6 °C) during summer the same year (fig. 22), indicating that groundwater discharges into the stream keep the brook at cool temperatures. The temperature at other streams that received less groundwater seepage or were warmed by sunlight rose to upper 60s to low 70s during summer.
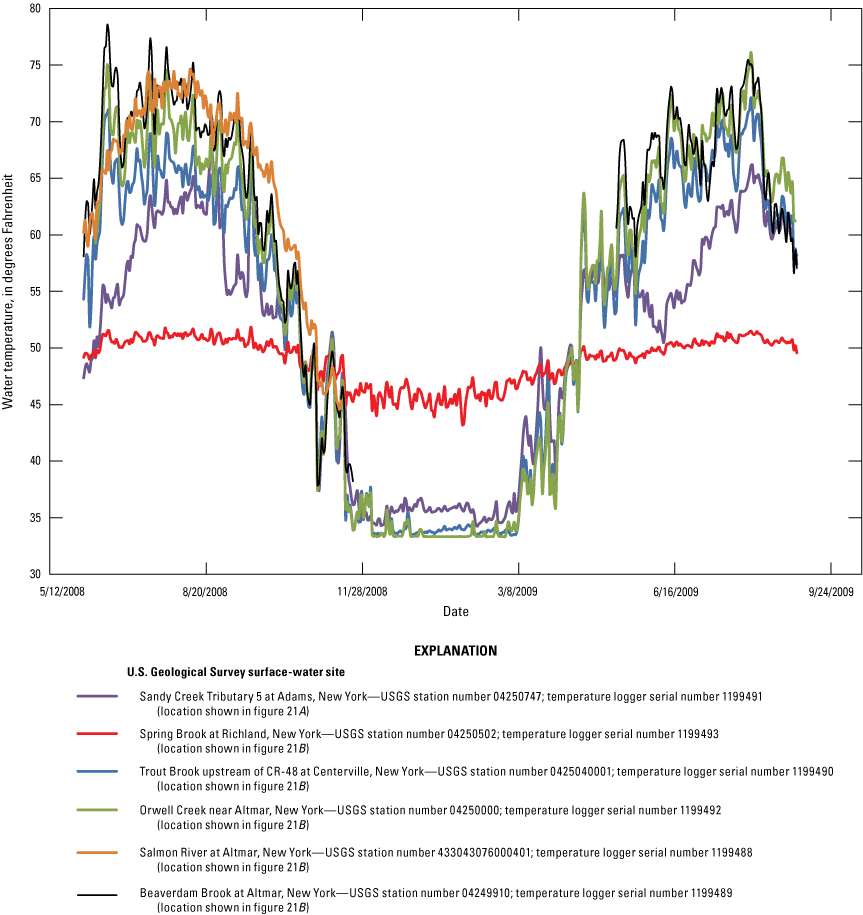
Graph showing water-temperature data from selected surface-water sites in Jefferson and Oswego Counties, north-central New York. Locations of sites shown in figure 21A and B.
Central Part of the Aquifer
Groundwater in the central part of the Tug Hill glacial aquifer receives recharge from precipitation that falls directly on the aquifer and from upland sources of recharge in the eastern part of the aquifer (Miller and others, 1988). These upland sources along the eastern margin of the aquifer include (1) unchannelized runoff that seeps into the aquifer from adjoining till and bedrock hillsides, (2) groundwater inflow (subsurface flow) that flows into the aquifer from the till and bedrock on the adjoining Tug Hill Plateau, and (3) seepage losses from streams that drain the Tug Hill Plateau and which flow over and lose water to the aquifer (Miller and others, 2007). Streamflow gain-and-loss measurements were also made in selected streams in the central part of the aquifer on May 29, 2008 (fig. 21B; table 3). The results of these measurements indicate that the stream reaches in the central and western parts of the aquifer gained streamflow except along the eastern margin of the aquifer, where streams generally lost water to the aquifer.
Water-temperature data were collected from Trout Brook, Spring Brook, Orwell Creek, and Beaverdam Brook (fig. 21B) from May 2008 to September 2009 and from the Salmon River from May to November 2008 (fig. 22) to determine the interaction between surface water and groundwater in these select sites in the central part of the aquifer. The water-temperature data (fig. 22) from Trout Brook near Centerville (0425040001), Orwell Creek near Altmar (04250000), Beaverdam Brook at Altmar (04249910), and Salmon River at Altmar (433043076000401) indicate that the water temperature cools to or below the freezing point during the winter, warms during spring, and peaks in the upper 60s to mid-70s during July and early August. Trout Brook was slightly cooler by 1.8 to 3.6 °F (1 to 2 °C) than other streams in the central part of the aquifer, presumably because either it receives more cooler groundwater discharging into its channel or its channel is better shaded by vegetation or both. Spring Brook at Richland (04250502), however, shows a temperature pattern different from the patterns for the other stream sites. At this site, large amounts of groundwater discharge to springs at the head of Spring Brook. The water temperature of Spring Brook (fig. 21B) is nearly constant between 46.0 and 48.0 °F (7.8 and 8.9 °C) all year, which indicates that most, if not all, of the water is from nearby sources of groundwater entering the channel (fig. 22). This groundwater, which has had little exposure to warmer and colder ambient air temperatures, stabilizes the low temperature of the water in this stream.
Groundwater Discharge and Withdrawals
In general, groundwater in the northern and central parts of the Tug Hill glacial aquifer discharges to (1) domestic, agricultural, and commercial pumping wells and large production wells for municipalities and a fish hatchery; (2) springs, seeps, headwaters of streams, and wetlands along the western boundary of the aquifer; and (3) wetlands and main trunks of major streams within the middle areas of the aquifer. An estimate of the average annual groundwater withdrawals from the northern and central parts of the Tug Hill glacial aquifer (table 4) was compiled mostly from water-use data reported by municipalities (annual water-quality reports) from 2012 to 2017 and from the estimated number of persons that rely on nonmunicipal withdrawals from domestic water-supply wells finished in the Tug Hill glacial aquifer (Maupin and others, 2014). Total and subtotal withdrawal values are rounded to three significant figures. All computed values are rounded independently, so the sums of individual rounded numbers may not equal the totals. These population data include the reported number of people served by municipal water and an estimate of the number of people who rely on individual domestic wells that tap the Tug Hill glacial aquifer outside areas served by municipal water. The number of homes outside areas served by municipal water systems was tallied by inspecting satellite imagery and tax-parcel maps for Jefferson and Oswego Counties. Water use for nonmunicipal withdrawals (table 4) in gallons per day was estimated by multiplying the number of homes outside areas served by municipal systems and that tap the Tug Hill glacial aquifer by the average number of persons per household (2.5), and then by the average daily water use of 75 gallons per person per day (Kenny and others, 2009). The results for estimated or reported total use were then converted to millions of gallons per year.
Table 4.
Estimated annual groundwater withdrawals from municipal-supply systems and nonmunicipal wells in the northern and central parts of the Tug Hill glacial aquifer, Jefferson and Oswego Counties, north-central New York, from 2012 to 2017.[Most values rounded to three significant figures; total sums of computed values may not equal sum of components because of independent rounding. Totals are rounded to three significant digits. Pumpage uses include fire, system flushing, churches, municipal buildings, and cemeteries. gal/d, gallon per day; Mgal/yr, million gallons per year; NA, not applicable; NYSDEC, New York State Department of Environmental Conservation]
Data are from U.S. Census Bureau (2011).
Estimated from Kenny and others (2009).
Data are from Village of Adams (2013).
Estimated as upper limit from 2010 census data (U.S. Census Bureau, 2011).
Data are from Village of Pulaski (2018).
Data are from Town of Richland (2014).
Data are from Town of Orwell (2015).
Approximately 11,400 people are supplied by groundwater that is withdrawn from municipal and nonmunicipal wells in the northern and central parts of the Tug Hill glacial aquifer (table 4). The estimated total annual groundwater withdrawal from the combined northern and central parts of the aquifer is about 1,220 million gallons per year (Mgal/yr); this total does not include nonmunicipal water used by industries and businesses. Water-use data were not available for all municipalities for all years; however, because population and withdrawal amounts did not vary much between 2012 and 2017, it was reasonable to compute an estimated average annual withdrawal for that period by using data from various years during that period.
Northern Part of the Aquifer
The estimated average annual groundwater withdrawal from the northern part of the Tug Hill glacial aquifer in 2012 was 217 Mgal/yr (table 4). Of that amount, 197 Mgal/yr was withdrawn by municipalities (village of Adams, hamlet of Adams Center, and the village of Mannsville), and about 20 Mgal/yr was withdrawn by individual homeowners and farms that were not served by municipal water. Other unaccounted users of groundwater withdrawn from the northern part of the Tug Hill glacial aquifer include industries and businesses that are not supplied by municipal water.
In addition to pumping withdrawals, groundwater discharges from the aquifer to many wetlands and springs (not shown) mainly along the western margins of the northern part of the Tug Hill glacial aquifer and to the streams that gain groundwater as they flow from east to west across the aquifer. The discharge measurements on June 2, 2009, in the northern part of the aquifer indicate that all but three stream reaches had gained flow from groundwater seeping into their channels (fig. 21A; table 3).
Central Part of the Aquifer
The estimated average-annual groundwater withdrawal from the central part of the Tug Hill glacial aquifer during 2014–17 was about 1,000 Mgal/yr (table 4). Of that amount, about 261 Mgal/yr was withdrawn by municipalities (villages of Sandy Creek, Lacona, and Pulaski; hamlet of Orwell; and town of Richland), 701 Mgal/yr withdrawn by the NYSDEC Salmon River fish hatchery, and about 43 Mgal/yr withdrawn by individual homeowners and farms that are not served by municipal water. Other unaccounted users of groundwater withdrawn from the central part of the Tug Hill glacial aquifer include industries and businesses that were not supplied by municipal water.
As in the northern part of the Tug Hill glacial aquifer, groundwater in the central part of the aquifer discharges to springs, seeps, and the headwaters of streams in wetlands along the western boundary of the aquifer; and to wetlands and main trunks of major streams in the middle zones of the aquifer. The largest discharge zone in the central part of the Tug Hill glacial aquifer is in the hamlet of Richland, where exceptionally large amounts of groundwater discharge to springs that form the headwaters to Spring Brook (fig. 21B). Four dug wells (OW 493, OW 494, OW 495, and OW 496; locations of wells shown in fig. 5B) in this spring-discharge zone are used to tap the aquifer and supply water to the village of Pulaski (village 3.8 mi west of the wells; fig. 2).
On May 29, 2008, the spring discharge into the headwaters of Spring Brook at Richland (site 4250502; fig. 21B) was measured to be about 5.70 ft3/s (table 3), equal to about 3.7 Mgal/d or 1,350 Mgal/yr (table 3), which is almost twice the discharge (701 Mgal/yr) of the second largest user of groundwater, the fish hatchery (table 4). Streamflow measurements made on May 29, 2008, in the central part of the Tug Hill glacial aquifer indicate that most stream reaches in the central and western parts of the aquifer gained flow from groundwater discharging into stream channels (fig. 21B).
Water Quality
Surface-water samples were collected in the northern and central parts of the Tug Hill glacial aquifer. In the northern part of the aquifer, the samples were collected from streams during average annual base-flow conditions at 13 sites on June 2, 2009, and at one site during base-flow conditions on November 6, 2013 (fig. 23A). In the central part of the aquifer, samples were collected from streams during average annual base-flow conditions at nine sites on May 29, 2008, and one site on November 5, 2013 (fig. 23B). The surface-water samples from the northern and central parts of the Tug Hill glacial aquifer were analyzed for physiochemical properties, major ions, nutrients, and dissolved oxygen. In addition to the analyses listed above, trace elements were analyzed in the sample from Trout Brook below County Route 2 at Richland, N.Y. (site 04250385; fig. 23B) at the USGS NWQL in Denver.
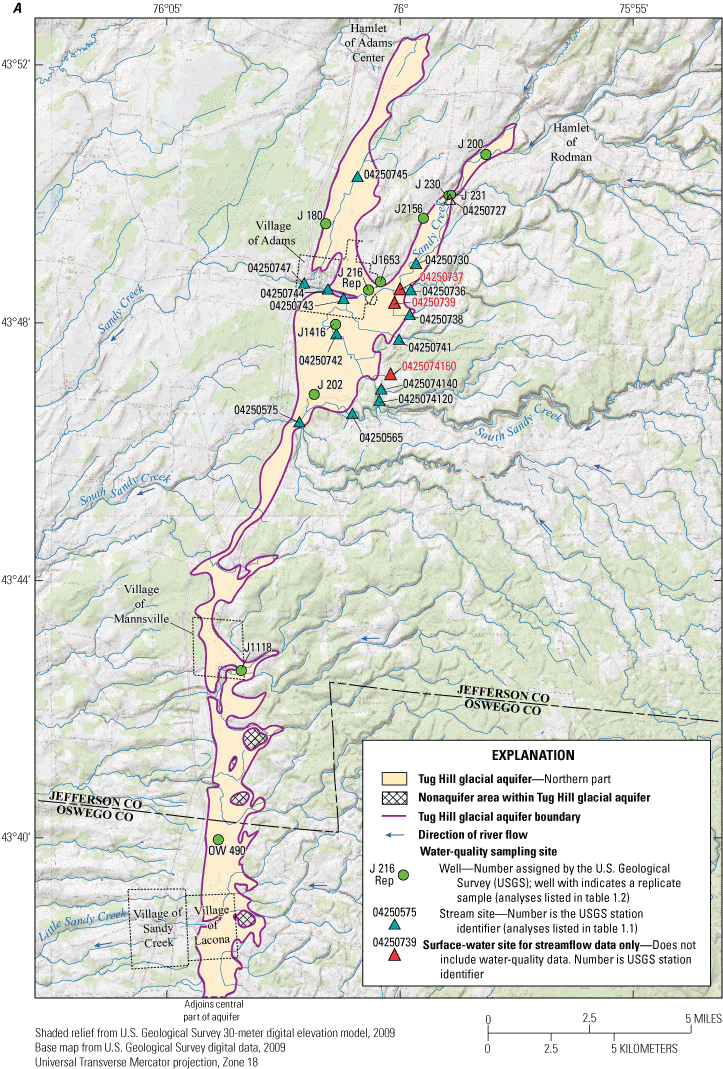
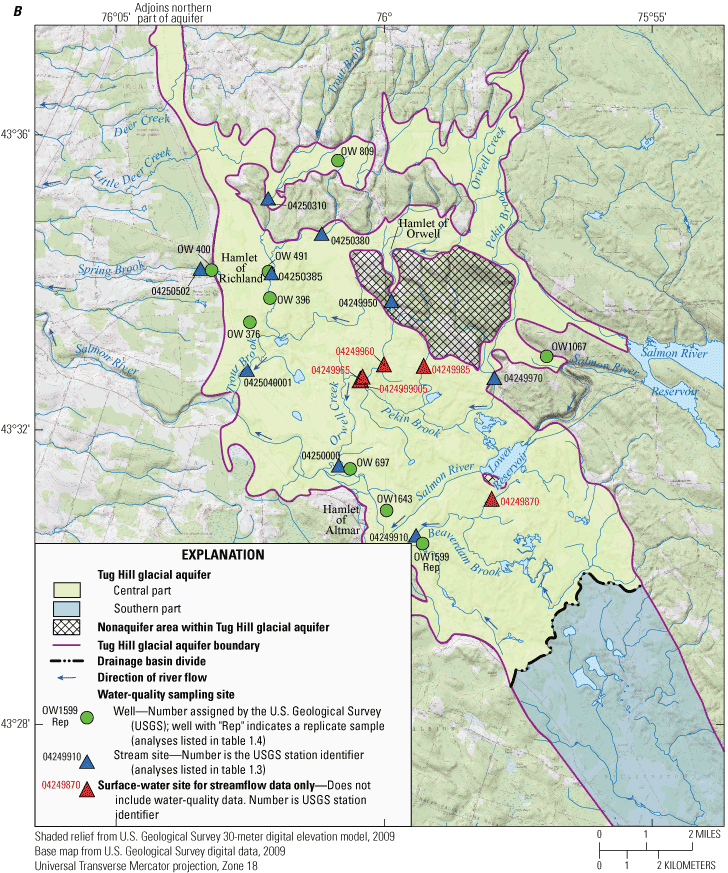
Maps showing the locations of surface-water and groundwater sampling sites and streamflow-measurement sites in the A, northern, and B, central parts of the Tug Hill glacial aquifer in Jefferson and Oswego Counties, north-central New York.
Groundwater-quality and environmental samples were collected from 20 wells—11 in the northern part (fig. 23A) and 9 in the central part (fig. 23B) of the aquifer. These samples were analyzed for physiochemical properties, major ions, nutrients, trace elements, dissolved gases, CFCs, and tritium. Twenty-three samples were analyzed from the 20 wells, including two replicate samples (one for well J 216 in the northern part of the aquifer and another for well OW1599 in the central part of the aquifer) and one blank sample (collected at well OW1643 in the central part of the aquifer). In the northern part of the Tug Hill glacial aquifer, all sampled wells were finished in sand and gravel except the two wells J 231 and J 2156, which were drilled into limestone bedrock. In the central part of the Tug Hill glacial aquifer, all sampled wells were finished in sand and gravel except for three wells—OW 809, OW1067, and OW1643—which were drilled into shale or sandstone bedrock. Physiochemical properties, major ions, nutrients, and trace elements were analyzed by the USGS NWQL in Denver, and dissolved gases were analyzed by the USGS Isotope Laboratory in Reston.
Quality of Surface Water and Groundwater in the Northern Part of the Tug Hill Glacial Aquifer
Surface Water
Thirteen surface-water samples were collected in conjunction with streamflow measurements to determine gains or losses in selected streams and tributaries during average annual base-flow conditions in and near the village of Adams on June 2, 2009. Another sample was collected from Sandy Creek on November 6, 2013, near test wells J 230 and J 231 northeast of the village of Adams (fig. 23A). The samples were tested for physiochemical properties, major ions, nutrients, and dissolved oxygen. Results of chemical analyses of surface-water samples are presented in table 1.1.
Physiochemical Properties
Dissolved oxygen concentrations ranged from 4.6 to 12.4 milligrams per liter (mg/L), with a median value of 9.9 mg/L. The pH of samples ranged from 7.0 to 8.8, with a median value of 8.0. Measured pH values of all but 1 of the 14 samples were within the accepted secondary maximum contaminant level (SMCL) range of 6.5 to 8.5 for pH (U.S. Environmental Protection Agency, 2006). The pH value of the sample from the Sandy Creek tributary at Lawrence Road near Adams (station number 04250736) slightly exceeded the SMCL at pH 8.8. Specific conductance ranged from 77 to 796 microsiemens per centimeter (μS/cm), with a median value of 195 μS/cm. Water temperature ranged from 52.9 to 60.3 °F, with a median temperature of 54.5 °F. Stream discharge at these sites ranged from 0.04 to 113 ft3/s, with a median flow of 1.20 ft3/s.
Major Ions
Water hardness as calcium carbonate (CaCO3) ranged from 29 to 247 mg/L, with a median of 90 mg/L. The cation detected in the greatest concentration (92.4 mg/L) was calcium. Calcium concentrations ranged from 8.19 to 92.4 mg/L, with a median of 28.8 mg/L (table 1.1). Magnesium concentrations ranged from 2.09 to 4.60 mg/L, with a median of 3.54 mg/L. Potassium concentrations ranged from 0.42 to 1.61 mg/L, with a median of 0.84 mg/L. Sodium concentrations ranged from 1.87 to 66.9 mg/L, with a median of 5.35 mg/L. Iron concentrations ranged from 28.9 to 1,120 micrograms per liter (µg/L), with a median of 45.0 µg/L. Manganese concentrations ranged from 2.45 to 451 µg/L, with a median of 16.2 µg/L. The anion detected in the greatest concentration (114 mg/L) was chloride. Chloride concentrations ranged from 0.64 to 114 mg/L, with a median of 5.57 mg/L. Sulfate concentrations ranged from 1.71 to 13.2 mg/L, with a median of 6.40 mg/L. The concentrations of iron and manganese separately exceeded the New York State Department of Health (NYSDOH) drinking-water standard of 300 µg/L in the sample from the station at Sandy Creek tributary to tributary 4 at Lawrence Road, near Adams (0425074120), with concentrations of iron and manganese of 1,120 and 451 µg/L, respectively.
Nutrients
The predominant nitrogen constituents in surface-water samples from the northern part of the Tug Hill glacial aquifer were nitrate plus nitrite, whose concentration ranged from 0.02 to 1.43 mg/L as nitrogen (N), with a median of 0.18 mg/L. Concentrations of nitrogen greater than 10 mg/L as N can be a human health concern (U.S. Environmental Protection Agency, 2006), and large amounts of nitrogen can cause excessive plant and algal growth, depleting oxygen and stressing organisms in streams. Concentrations of nitrite ranged from less than 0.001 to 0.025 mg/L as N, with a median of less than 0.002 mg/L as N. None of the surface-water samples had concentrations that exceeded EPA or NYSDOH drinking-water standards for nitrate or nitrite. Concentrations of orthophosphate—also commonly known as soluble-reactive phosphorus (SRP)—ranged from 0.005 to 0.025 mg/L as phosphorus (P), with a median of 0.015 mg/L as P. There are no drinking-water standards for phosphorus and orthophosphate.
Groundwater
In the northern part of the Tug Hill glacial aquifer, 11 wells were sampled between August 27 and December 5, 2013—of those, USGS test well J 231 was sampled twice, once during drilling when the bottom of the casing was in sand and gravel (Tug Hill glacial aquifer) at a depth of 30 ft and once after it was finished in bedrock at a depth of 202 ft (fig. 15). of the 11 sampled wells, 3 were municipal wells, 3 were USGS test wells, and 5 were homeowner wells. Water samples that were collected from three municipal-supply wells included one sample each from the villages of Adams, Mannsville, and Sandy Creek/Lacona. In addition, a replicate sample was collected at the village of Adams municipal well (J 216). Water-quality analyses of all samples included measurements of physiochemical properties, major ions, nutrients, and trace elements. Dissolved gases were collected at two wells (J 202 and J 231), CFCs were analyzed in samples collected at three wells (J 202, J 231, and J1653), and tritium was analyzed in a sample collected from one well (J 202). In the northern part of the Tug Hill glacial aquifer, all sampled wells were finished in sand and gravel except for two sampled wells—J 231 and J2156, which were finished in bedrock (mostly limestone interbedded with thin shale beds).
Physiochemical Properties
Concentrations of dissolved oxygen ranged from 0.10 to 9.7 mg/L, with a median value of 1.3 mg/L, and pH measurements ranged from 6.9 to 9.0, with a median value of 7.4 (table 1.2). All but 1 of the 12 samples had measurements that were within the accepted SMCL pH range of 6.5 to 8.5 (U.S. Environmental Protection Agency, 2006). The exception was well J 231, which was completed in bedrock (limestone with some shale). Specific conductance ranged from 191 to 688 μS/cm, with a median value of 479 μS/cm (table 1.2). Water temperatures were between 49.6 °F and 56.3 °F, with a median of 54.2 °F. Dissolved solids ranged between 102 and 346 mg/L, with a median of 222 mg/L.
Major Ions
Water hardness as CaCO3 ranged from 30.0 to 287 mg/L, with a median of 209 mg/L. The greatest cation concentration was 104 mg/L for calcium. Calcium concentrations ranged from 5.02 to 104 mg/L, with a median value of 69.6 mg/L. Magnesium concentrations ranged from 4.09 to 25.2 mg/L, with a median of 5.63 mg/L. Potassium concentrations ranged from 0.92 to 4.78 mg/L, with a median of 1.37 mg/L. Sodium ranged from 5.22 to 129 mg/L, median of 13.8 mg/L. Iron concentrations ranged from less than 4.0 to 249 µg/L, with a median of 23.3 mg/L. Manganese concentrations ranged from less than 0.15 to 356 µg/L, with a median of 8.19 mg/L. None of the major ion concentrations exceeded drinking-water standards except in samples from well OW 490, where the 356-µg/L concentration of manganese exceeded the NYSDOH drinking-water standard of 300 µg/L. The relatively high concentrations of alkalinity that ranged from 81.1 to 292 mg/L (median 180 mg/L) indicate that the dominant anion for the wells sampled is bicarbonate and the type of water is predominantly calcium bicarbonate. Chloride concentrations ranged from 0.83 to 55.3 mg/L, with a median of 21.5 mg/L. Sulfate concentrations ranged from 0.46 to 38.8 mg/L, with a median of 12.3 mg/L.
Nutrients
The predominant nitrogen constituents in groundwater samples from the northern part of the Tug Hill glacial aquifer were nitrate plus nitrite, whose concentrations ranged from less than 0.040 mg/L to 3.3 mg/L as N, with a median of 0.39 mg/L as N. Nitrite concentration ranged from less than 0.001 to 0.008 mg/L as N, with a median of less than 0.001 mg/L as N. Concentrations of orthophosphate ranged from less than 0.004 to 3.1 mg/L as N, with a median of less than 0.004 mg/L as N. None of the groundwater samples had concentrations that exceeded EPA or NYSDOH drinking water standards for nitrate or nitrite.
Trace Elements
In general, concentrations of trace elements were slightly greater in the sample from well J 231 (finished in bedrock) than in samples from wells finished in the sand and gravel deposits of the Tug Hill glacial aquifer (table 1.2). The greatest detected concentrations of trace elements were for barium (340 µg/L), boron (539 µg/L), lithium (185 µg/L), and strontium (728 μg/L). The other trace elements that were detected were aluminum (13.3 μg/L), copper (13.2 μg/L), molybdenum (15.3 μg/L), and zinc (23.5 μg/L), but these concentrations were well below EPA or NYSDOH drinking-water standards. Arsenic concentrations ranged from less than 0.100 to 0.36 μg/L, with a median of less than 0.100 μg/L. Concentrations of arsenic did not exceed the EPA and NYSDOH maximum contaminant level (MCL) of 10 μg/L in any samples.
Dissolved Gases and Groundwater Age
Along with measurements of the concentrations of CFCs in groundwater, measurements of the concentrations of certain dissolved gases in groundwater—such as oxygen, argon, dinitrogen, carbon dioxide, and methane—aid in dating groundwater. Samples were collected for dissolved-gas analysis at wells J 202 and J 231 in the northern part of the Tug Hill glacial aquifer. Dissolved oxygen concentrations in water sampled from these two wells were 0.3 and 0.1 mg/L, respectively. Argon, carbon dioxide, dinitrogen, and methane concentrations in samples from the two wells were 0.841 and 0.765 mg/L, 0.5 and 0.4 mg/L, 27.4 and 25.2 mg/L, and 3.08 and 10.9 mg/L, respectively.
Samples were collected for analysis of CFCs from wells J 202, J 231, and J1653 on November 6, 2013. Wells J 202 and J1653 are finished in the Tug Hill glacial aquifer, and well J 231 is finished in bedrock (limestone with some shale). CFC age dates of samples taken from an unconsolidated aquifer are sometimes unreliable because some processes, such as urban and industrial contamination, microbial degradation of CFCs, and sorption of CFCs onto particulate organic carbon and mineral surfaces, can modify the apparent age of the sample. The samples collected for this study did not show evidence of contamination and thus are considered to provide a valid approximation of the age of groundwater from these wells. The estimated age ranges reported by the USGS Groundwater Dating Laboratory in Reston, based on the concentrations of CFCs and dissolved gases in the samples collected, were from the early 1950s for well J 202 and late 1950s to early 1960s for well J 231. Well J1653 was estimated to have contained water from the early to mid-1970s.
Tritium, which has a half-life of 12.43 years (Lucas and Unterweger, 2000), has been used as a tracer of young waters. Tritium input to groundwater has spiked following atmospheric testing of nuclear devices that began in 1952 and reached a maximum in 1963–64 (Clark and Fritz, 1997). Tritium concentrations in water during this time exceeded 500 tritium units (TU). Concentrations of tritium can be used to estimate whether groundwater has been recharged before or after 1953. A concentration of 1 TU is equivalent, in terms of radioactivity, to 3.2 picocuries per liter (pCi/L). Atmospheric concentrations have gradually declined since 1963–64, and present-day groundwater typically contains less than 1 to 10 TU (Clark and Fritz, 1997). Groundwater that does not contain detectable tritium (less than 0.8 TU) is assumed to have been recharged before 1953. Groundwater that contains detectable tritium (more than 0.8 TU) is assumed to contain a component that was recharged after 1953 (Cordy and others, 2000). The sample from well J 202 had a tritium concentration of 8.5 pCi/L, or about 3 TU, indicating that the water was recharged after 1953.
Quality of Surface Water and Groundwater in the Central Part of the Tug Hill Glacial Aquifer
Surface Water
Nine surface-water samples were collected in the central part of the Tug Hill glacial aquifer in conjunction with streamflow measurements to determine streamflow gains or losses in selected streams and tributaries. Eight of the nine surface-water samples were collected on May 29, 2008, and one sample was collected on November 5, 2013 (fig. 23B; table 1.3). All the samples were analyzed for physiochemical properties, major ions, and nutrients, and the sample from the Trout Brook below County Route 2 at Richland station (04250385) was also analyzed for trace elements.
Physiochemical Properties
The measured pH of the samples ranged from 5.4 to 8.0, with a median value of 7.4. All but one of the nine samples were within the accepted SMCL pH range of 6.5 to 8.5 (U.S. Environmental Protection Agency, 2006); that sample, with a measured pH of 5.4, was taken from Trout Brook below County Route 2 at Richland (04250385). Specific conductance ranged from 65.5 to 251 μS/cm, with a median of 99.2 μS/cm. Water temperature ranged from 39.6 to 64.4 °F, with a median temperature of 48.9 °F. Stream discharge at the sites ranged from 4.3 to 21.6 ft3/s, with a median of 6.85 ft3/s.
Major Ions
The cation detected in the greatest concentration was calcium, which ranged from 6.73 to 34.5 mg/L, with a median of 9.22 mg/L. Magnesium concentrations ranged from 2.19 to 6.19 mg/L, with a median of 2.69 mg/L. Potassium concentrations ranged from 0.22 to 0.80 mg/L, with a median of 0.37 mg/L. Sodium concentrations ranged from 1.54 to 11.0 mg/L, with a median of 2.87 mg/L. Iron concentrations ranged from 5.00 to 73.0 µg/L, with a median of 35.0 µg/L. Manganese concentrations ranged from 1.80 to 28.9 µg/L, with a median of 9.10 µg/L. Alkalinity concentrations ranged from 25.1 to 97.7 mg/L, with a median of 32.8 mg/L. Chloride concentrations ranged from to 1.94 to 11.6 mg/L, with a median of 3.86 mg/L. Sulfate concentrations ranged from 3.45 to 7.53 mg/L, with a median of 4.36 mg/L. Results of the major ions analyses indicate that the water type is dominated by calcium bicarbonate.
Nutrients
The predominant nitrogen constituents in surface-water samples from the central part of the Tug Hill glacial aquifer were nitrate plus nitrite, whose concentrations ranged from 0.06 to 1.11 mg/L as N, with a median of 0.24 mg/L as N. In seven of the nine samples, nitrite was not detected in concentrations above reporting limits of 0.001 and 0.002 mg/L as N; in two samples, the nitrite concentrations were estimated to be at or below 0.002 mg/L as N. None of the surface-water samples had concentrations that exceeded EPA or NYSDOH drinking-water standards for nitrate or nitrite. Orthophosphate ranged from 0.003 to 0.009 mg/L as P, with a median of less than 0.006 mg/L as P.
Trace Elements
Trace elements were measured in the samples collected at only one site, Trout Brook below County Route 2 at Richland (04250385), in the central part of the Tug Hill glacial aquifer (fig. 23B). Concentrations of trace elements at this site were well below Federal and State drinking-water standards.
Groundwater
Of the 9 wells where 11 samples were withdrawn on September 24 and November 5, 2013, wells OW1599 (QA2) and OW1643 (QA1) were sampled for quality control with a replicate and a blank sample, respectively (fig. 23B; table 1.4). The analyses of all samples included measurements of physiochemical properties and chemical constituents, including major ions, nutrients, and trace elements. To estimate the age of the groundwater in well OW1599, a sample was collected for analysis of dissolved gases and tritium. Of the nine wells sampled, six were completed in sand and gravel deposits, and three were completed in bedrock (two in shale and one in sandstone). Two municipal wells serving the town of Richland and the village of Pulaski (wells OW 491 and OW 400, respectively) were sampled. Two samples were collected from a well supplying the Salmon River Fish Hatchery (well OW1599), and five samples were collected from four homeowner wells.
Physiochemical Properties
Dissolved oxygen concentrations ranged from 0.20 to 7.6 mg/L, with a median value of 4.0 mg/L (table 5), and pH values ranged from 4.2 to 8.6, with a median value of 7.7. All but four of the samples (OW 396, OW 400, OW 491, and OW 809) had measurements that were within the accepted SMCL pH range of 6.5 to 8.5 (U.S. Environmental Protection Agency, 2006). The measurement from the sample from OW 396 exceeded the accepted range by only one-tenth of a pH unit (8.6). Specific conductance ranged from 112 to 291 μS/cm, with a median value of 228 μS/cm. Water temperatures were between 47.5 and 57.9 °F, with a median of 49.8 °F. Dissolved solids ranged between 58.0 and 145 mg/L, with a median of 124 mg/L. Dissolved solids concentrations in all samples were well below the recommended value for drinking water of 500 mg/L.
Table 5.
Comparison of the median values of physiochemical properties and concentrations of major ions, nutrients, and trace elements in surface-water and groundwater samples collected in the northern and central parts of the Tug Hill glacial aquifer, Jefferson and Oswego Counties, north-central New York, 2008 to 2013.[Temperatures are listed in degrees Celsius (°C); to convert to degrees Fahrenheit, multiply by 1.8 and add 32. Parm code, U.S. Geological Survey National Water Information System parameter code; mg/L, milligram per liter; μg/L, microgram per liter; μS/cm, microsiemens per centimeter at 25 degrees Celsius; <, less than; —, not analyzed or insufficient number of samples; N, nitrogen; P, phosphorus; SW, surface water; GW, groundwater]
Major Ions
Water hardness as CaCO3 ranged from 42.6 to 148 mg/L (soft to moderately hard), with a median of 81.1 mg/L. The hardness values in the central part of the aquifer are lower than those in the northern part of the Tug Hill glacial aquifer and this difference is likely because of the differences in rock types of the clasts that compose the sand and gravel in the two aquifer parts. Because large areas of the northern part of the aquifer are underlain by limestone, the clasts that compose the aquifer are also carbonate rich. Carbonate rocks such as limestone dissolve relatively readily and contribute to high values of hardness in groundwater, whereas noncarbonate rocks, such as the shale, siltstone, and sandstone that underlie and compose the clasts in the central part of the aquifer, do not dissolve as readily as carbonate material.
The major cation detected in the greatest concentration was calcium, ranging from 11.8 to 38.7 mg/L, with a median value of 20.0 mg/L. Magnesium concentrations ranged from 3.13 to 12.1 mg/L, with a median of 7.40 mg/L. Potassium concentrations ranged from 0.53 to 3.48 mg/L, with a median of 0.77 mg/L. Sodium concentrations ranged from 1.95 to 26.0 mg/L, with a median of 4.65 mg/L. Iron concentrations ranged from less than 4.00 to 564 µg/L, with a median of 13.4 µg/L. Iron and manganese concentrations exceeded NYSDOH drinking-water standards in one sample, from the fish hatchery well OW1599. The relatively high concentrations of alkalinity that ranged from 43.6 to 145 mg/L, with a median of 106 mg/L (table 1.4) indicate that the dominant anion for the wells sampled is bicarbonate, and that the type of water is predominantly calcium bicarbonate. Chloride concentrations were detected in relatively low concentrations, which ranged from 0.61 to 11.5 mg/L, with a median of 4.86 mg/L. Sulfate concentrations ranged from 0.17 to 13.7 mg/L, with a median of 4.76 mg/L.
Nutrients
The predominant nitrogen constituent in groundwater samples from the central part of the Tug Hill glacial aquifer was nitrate, ranging in concentration from less than 0.040 to 1.52 mg/L, with a median of 0.091 mg/L. Nitrite, as nitrogen, ranged in concentration from less than 0.001 and 0.002 mg/L, with a median of less than 0.001 mg/L. Orthophosphate concentrations ranged from less than 0.004 to 0.007 mg/L, with a median of 0.005 mg/L. None of the groundwater samples had concentrations that exceeded Federal or State drinking-water standards for nitrate or nitrite.
Trace Elements
The greatest detected concentrations of trace elements were for strontium, barium, boron, lithium, zinc, and copper—220, 164, 153, 45.8, 13.2, and 10.6 mg/L, respectively. Arsenic concentrations ranged from less than 0.04 to 4.40 μg/L, with a median of less than 0.505 μg/L. The concentration of arsenic did not exceed the EPA or NYSDOH MCL of 10 µg/L in any samples. All other trace-element concentrations were also below any EPA or NYSDOH drinking-water limits.
Dissolved Gases and Groundwater Age
Along with CFCs, several other dissolved gases (carbon dioxide, dissolved nitrogen, and methane) whose concentrations are useful for determining the ages of groundwater were analyzed in one sample that was collected from well OW1599 on November 5, 2013, in the central part of the Tug Hill glacial aquifer (fig. 23B). The concentrations of carbon dioxide, dissolved nitrogen (dinitrogen) gas, and methane were 5.9, 20.4, and less than 0.001 mg/L, respectively. The USGS Groundwater Dating Laboratory in Reston reported that some CFC analyses have been shown to give unreliable age dates for water in unconsolidated aquifers if atmospheric contamination could have affected the results. The results of the analysis of this sample, however, did not show evidence of atmospheric contamination; for this reason, these results are thought to be a valid approximation of the age of groundwater from this well. The USGS Groundwater Dating Laboratory in Reston reported an estimated age range of the groundwater sampled from well OW1599 to be the mid- to late 1970s.
Tritium was also measured to estimate the age of the groundwater sampled in well OW1599. The tritium concentration was 49.4 pCi/L, or about 15 TU. This concentration of 15 TU indicates that groundwater at this site is from precipitation that recharged the aquifer after 1953 and probably before the 1980s; this date range includes the CFC age-date range of mid-to-late 1970s for this sample.
Comparison of Water Quality in the Northern and Central Parts of the Tug Hill Glacial Aquifer
Median values of physiochemical properties and concentrations of chemical constituents of surface-water and groundwater samples collected in the northern part of the Tug Hill glacial aquifer were compared with measurements of the same properties in samples collected in the central part of the aquifer. The data indicate that, overall, there were some differences in the quality of surface water and groundwater between the northern and central parts of the Tug Hill glacial aquifer (fig. 24).
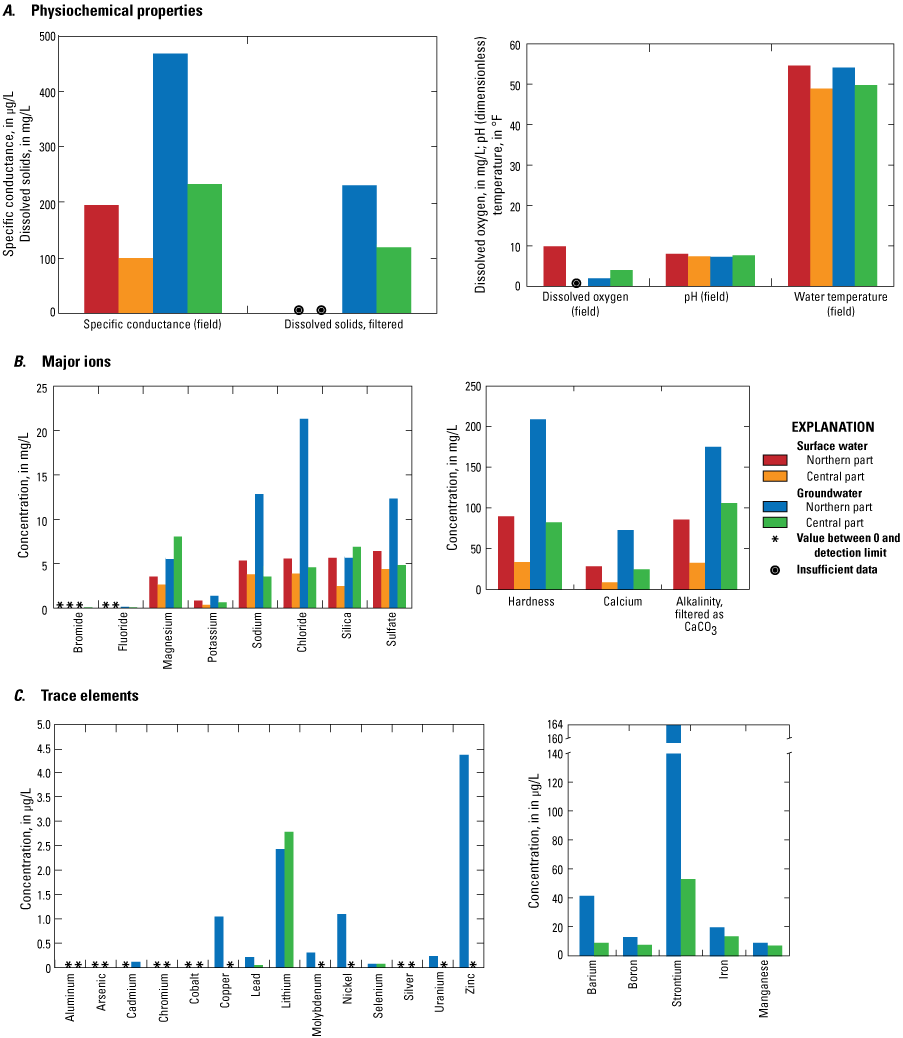
Graphs showing comparisons of median values of physiochemical properties and concentrations of major ions and trace elements in groundwater and surface water samples collected in the northern and central parts of the Tug Hill glacial aquifer, Jefferson and Oswego Counties, north-central New York, in 2013. µS/cm, microsiemens per centimeter; mg/L, milligram per liter; °F, degree Fahrenheit; µg/L, microgram per liter.
Surface Water
Four median values of physiochemical properties of surface water—pH and water temperature—were slightly greater and specific conductance was much greater in the northern part of the Tug Hill glacial aquifer than in the central part. Three median concentrations of major ions in surface water—hardness (dissolved calcium and magnesium), calcium, and alkalinity—were much greater and most other major ions were slightly greater in the northern part of the Tug Hill glacial aquifer than in the central part probably because of the dissolution of the limestone that underlies most of that area and the high-carbonate content of the clasts in the sand and gravel. All median concentrations of nutrients in surface water were slightly greater in the northern part than in the central part of the Tug Hill glacial aquifer except for nitrate plus nitrite as nitrogen, which was about the same in both parts.
Groundwater
For median values of physiochemical properties of groundwater, dissolved oxygen was about two times greater in the central part of the Tug Hill glacial aquifer than in the northern part, and pH was slightly greater (by 0.3 pH unit) in the central part than in the northern part. Median values for specific conductance were about twice as great, dissolved solids were about two times as great, and water temperature was slightly greater (by 4.4 °F) in groundwater samples from the northern part than from the central part of the aquifer (fig. 24; tables 1.2 and 1.4).
For median values of concentrations of major ions in groundwater, hardness as CaCO3 in the northern part of the aquifer was about twice as great and concentrations of calcium and sodium were more than three times as great as those in the central part. As was the case with surface water, the much greater median concentrations for calcium, hardness, and alkalinity in the northern part of the aquifer are likely caused by the dissolution of the limestone that underlies most of that area and to the high-carbonate content of the clasts in the sand and gravel. There was little or no difference in median concentrations between the two parts of the aquifer for silica and iron. Concentrations of most other major ions were slightly greater in the northern part than in the central part of the Tug Hill glacial aquifer; the exceptions were bromide, silica, and magnesium whose concentrations were greater in the central part. There were few differences in median values of concentrations of nutrients in groundwater between the northern and central parts of the Tug Hill glacial aquifer except for nitrate plus nitrite as nitrogen, which was higher in the northern part (with a median of 0.391 mg/L) than in the central part (with a median of 0.091 mg/L).
Median concentrations of the trace elements barium, boron, lead, nickel, strontium, uranium, and zinc in groundwater were much greater in the northern part than in the central part of the Tug Hill glacial aquifer (fig. 24). Median concentrations of copper, and molybdenum were slightly greater in groundwater from the northern part than in the central part. There was little or no difference in the median concentrations of aluminum, antimony, arsenic, beryllium, cadmium, chromium, lithium, selenium, and silver between the two parts of the aquifer.
Summary
In the early 2000s, anticipated developmental pressures from potential new industries (including a proposed water-bottling plant in the central part of the aquifer) and expansion of the Fort Drum military base north of Watertown, New York (with the projected increase in population extending into the northern part of the aquifer), prompted the Tug Hill Commission, local municipal officials, and agency representatives from the New York State Department of Environmental Conservation to initiate a geohydrologic study with the U.S. Geological Survey in 2007. The information from this study is expected to help the State, counties, and local communities make sound policy decisions about use of this large groundwater resource.
The entire Tug Hill glacial aquifer (the northern, central, and southern parts) is a 47-mile long, crescent-shaped aquifer. This report presents data collected for the first phase of a program to describe the geohydrology and water quality of the northern and central parts of the Tug Hill glacial aquifer in Jefferson and Oswego Counties in north-central New York. More specifically, the report describes the geometry, glacial origin, groundwater and surface-water interactions, groundwater withdrawals, water-table altitudes and directions of flow, and groundwater and surface-water quality of the northern and central parts of the Tug Hill glacial aquifer.
The northern and central parts of the Tug Hill glacial aquifer comprise a 29-mile-long, crescent-shaped mixture of glaciofluvial, glaciolacustrine, and recent alluvial deposits of predominantly sand and gravel on the western side of the Tug Hill Plateau in Jefferson and Oswego Counties in north-central New York. The data that were collected and compiled for this study are intended to support the construction and calibration of numerical groundwater-flow models for each part of the aquifer in a future second phase of the program.
The northern part of the Tug Hill glacial aquifer is a combination of glaciofluvial outwash and alluvial sand and gravel in the Sandy Creek Valley northeast of Adams, N.Y., and mostly glaciolacustrine beach and deltaic sand or sand and gravel north and south of the village of Adams. The southern and eastern parts of the central part of the glacial aquifer are composed mostly of glaciofluvial sediments such as kames, kame moraines, and kame terraces, whereas most of the western areas of the central part are composed mostly of glaciolacustrine sediments such as deltaic sand and beach sand and gravel.
Recharge to the aquifer in the northern and central parts of the aquifer, which are unconfined, is from three main sources: (1) precipitation that falls directly onto the aquifer; (2) unchannelized runoff (overland flow) and groundwater inflow from till and bedrock in the Tug Hill Plateau that seeps into the eastern side of the aquifer; and (3) streams that drain the Tug Hill Plateau and then flow across and lose water to the aquifer. Groundwater discharges to (1) springs, seeps, headwaters of streams, and wetlands in the middle of the central part of the aquifer and along the entire western boundary of the northern and central parts of the aquifer, (2) production wells, (3) artificial ditches, and (4) deeply incised streams in the northern and central parts of the aquifer. The groundwater discharge to the local streams is critical to supporting the salmonid fishery in the central part of the aquifer (Bishop and others, 2018).
Groundwater levels were measured on July 17, 2014, at 22 wells throughout the northern and central parts of the aquifer. Water-table contours were drawn on the basis of these 2014 water levels, historical water-level data, and surface-water altitudes at sites where surface water was expected to be hydraulically connected to the groundwater system. The water table generally slopes from east to west throughout the northern and central parts of the aquifer; the direction of this slope indicates that the direction of groundwater flow is also generally from east to west.
Approximately 11,400 people are supplied by groundwater that is withdrawn from municipal and nonmunicipal wells in the northern and central parts of the Tug Hill glacial aquifer. In addition, many farms, several industries, and a large New York State fish hatchery also rely on the water from the aquifer. The estimated total of the annual groundwater withdrawals from the combined northern and central parts of the aquifer is about 1,220 million gallons per year. Water used by industries and businesses but not supplied and measured by municipal water utilities was not accounted for in this estimate.
Water-quality samples were collected at 21 sites from streams during base-flow conditions, and groundwater-quality and environmental samples were collected from 20 wells in the northern and central parts of the Tug Hill glacial aquifer. Water-quality analyses of the samples indicated that surface water and groundwater are generally of good quality. In one stream sample from Sandy Creek tributary to tributary 4 at Lawrence Road, near Adams (station number 0425074120), the concentrations of the iron and manganese major ions were 1,120 and 451 micrograms per liter (µg/L), respectively. These concentrations exceeded the New York State Department of Health (NYSDOH) drinking-water standard of 300 µg/L for both iron and manganese. None of the concentrations of nitrate or nitrite in surface-water samples exceeded U.S. Environmental Protection Agency (EPA) or NYSDOH drinking-water standards. In groundwater samples, concentrations of nitrate or nitrite did not exceed EPA or NYSDOH drinking-water standards, and concentrations of iron and manganese exceeded drinking-water standards for trace elements in only three samples.
Comparison of the median concentrations of the trace elements barium, boron, lead, nickel, strontium, uranium, and zinc in groundwater were much greater in the northern part than in the central part of the Tug Hill glacial aquifer. Median concentrations of copper and molybdenum were slightly greater in groundwater from the northern part than in the central part. There was little or no difference in the median concentrations of aluminum, antimony, arsenic, beryllium, cadmium, chromium, lithium, selenium, and silver between the two parts of the aquifer.
References Cited
Anderson, H.R., Stelz, W.G., Mier, J.B., Miller, T.S., and Allen, R.V., and Muller, E.H., 1982, Geohydrology of the glaciolacustrine aquifer in the Fulton area, Oswego County, New York: U.S. Geological Survey Open-File Report 82–83, 7 sheets, scale 1:24,000. [Also available at https://doi.org/10.3133/ofr8283.]
Bishop, D., Verdoliva, F., Sawchuck, D.J., 2018, Lower Salmon River restoration and recreation enhancement plan: New York State Department of Environmental Conservation, 52 p., accessed May 2022 at https://www.dec.ny.gov/docs/fish_marine_pdf/r7lsrrrep.pdf.
Cordy, G.E., Gellenbeck, D.J., Gebler, J.B., Anning, D.W., Coes, A.L., Edmonds, R.J., Rees, J.A.H., and Sanger, H.W., 2000, Water quality in the central Arizona basins, Arizona, 1995–98: U.S. Geological Survey Circular 1213, 38 p., accessed June 2014 at https://doi.org/10.3133/cir1213.
Fenneman, N.M., and Johnson, D.W., 1946, Physiographic divisions of the conterminous U.S: U.S. Geological Survey dataset, scale 1:7,000,000, accessed February 3, 2014, at https://catalog.data.gov/dataset/physiographic-divisions-of-the-conterminous-u-s.
Fisher, B.N., and Keto, D.S., 2022a, Geospatial datasets for the geohydrology and water quality of the northern and central parts of the Tug Hill glacial aquifer, Jefferson and Oswego Counties, north-central New York: U.S. Geological Survey data release, https://doi.org/10.5066/P98E5NW8.
Fisher, B.N., and Keto, D.S., 2022b, Horizontal-to-vertical seismic method (HVSR) soundings in the northern and central parts of the Tug Hill glacial aquifer, Jefferson and Oswego Counties, north-central New York: U.S. Geological Survey data release, https://doi.org/10.5066/P9WBXE5F.
Isachsen, Y.W., and Fisher, D.W., 1970, Adirondack sheet, in Geologic map of New York: New York State Museum and Science Service, Map and Chart Series 1, scale 1:250,000. [Also available at http://www.nysm.nysed.gov/staff-publications/geologic-map-new-york-adirondack-sheet-1250000.]
Jordan, R.J., and Miller, T.S., 1980, Surficial geology of Redfield quadrangle, Oswego County, New York: U.S. Geological Survey Open-File Report 80–1118, 1 sheet. [Also available at https://doi.org/10.3133/ofr801118.]
Kantrowitz, I.H., and Snavely, D.S., 1982, Availability of water from aquifers in upstate New York: U.S. Geological Survey Open-File Report 82–437, 2 sheets, scale 1:500,000. [Also available at https://doi.org/10.3133/ofr82437.]
Kenney, T.A., 2010, Levels at gaging stations: U.S. Geological Survey Techniques and Methods, book 3, chap. A19, 60 p. [Also available at https://doi.org/10.3133/tm3A19.]
Kenny, J.F., Barber, N.L., Hutson, S.S., Linsey, K.S., Lovelace, J.K., and Maupin, M.A., 2009, Estimated use of water in the United States in 2005: U.S. Geological Survey Circular 1344, 20 p. [Also available at https://doi.org/10.3133/cir1344.]
Lane, J.W., Jr., White, E.A., Steele, G.V., and Cannia, J.C., 2008, Estimation of bedrock depth using the horizontal-to-vertical (HVSR) ambient-noise seismic method, in Symposium on the Application of Geophysics to Engineering and Environmental Problems, April 6–10, 2008, Philadelphia, Pennsylvania, Proceedings: Denver, Colo., Environmental and Engineering Geophysical Society, 13 p. [Also available at https://doi.org/10.3997/2214-4609-pdb.177.170.]
Lucas, L.L., and Unterweger, M.P., 2000, Comprehensive review and critical evaluation of the half-life of tritium: Journal of Research of the National Institute of Standards and Technology, v. 105, no. 4, p. 541–549. [Also available at https://doi.org/10.6028/jres.105.043.]
Maupin, M.A., Kenny, J.F., Hutson, S.S., Lovelace, J.K., Barber, N.L., and Linsey, K.S., 2014, Estimated use of water in the United States in 2010: U.S. Geological Survey Circular 1405, 56 p., https://doi.org/10.3133/cir1405.
McKenna, J.E., Jr., and Johnson, J.H., 2000, Stream fish assemblages and habitat associations in the vicinity of the Salmon River, New York [abs.], in Great lakes, great rivers 2000—A vision for tomorrow, 43d Conference of the International Association for Great Lakes Research, May 21–26, 2000, Cornwall, Ontario: Ann Arbor, Mich., International Association for Great Lakes Research, p. A106.
Miller, T.S., 1980a, Surficial geology of Orwell quadrangle, Oswego County, New York: U.S. Geological Survey Open-File Report 80–1116, 1 sheet. [Also available at https://doi.org/10.3133/ofr801116.]
Miller, T.S., 1980b, Surficial geology of part of Boylston Center quadrangle, Oswego County, New York: U.S. Geological Survey Open-File Report 80–1115, 1 sheet. [Also available at https://doi.org/10.3133/ofr801115.]
Miller, T.S., 1980c, Surficial geology of part of Ellisburg quadrangle, Oswego County, New York: U.S. Geological Survey Open-File Report 80–9, 1 sheet. [Also available at https://doi.org/10.3133/ofr809.]
Miller, T.S., 1980d, Surficial geology of part of Sandy Creek quadrangle, Oswego County, New York: U.S. Geological Survey Open-File Report 80–1114, 1 sheet. [Also available at https://doi.org/10.3133/ofr801114.]
Miller, T.S., 1980e, Surficial geology of part of Worth Center quadrangle, Oswego County, New York: U.S. Geological Survey Open-File Report 80–967, 1 sheet. [Also available at https://doi.org/10.3133/ofr80967.]
Miller, T.S., 1980f, Surficial geology of Richland quadrangle, Oswego County, New York: U.S. Geological Survey Open-File Report 80–763, 1 sheet. [Also available at https://doi.org/10.3133/ofr80763.]
Miller, T.S., 1981a, Surficial geology of part of Westdale quadrangle, Oswego County, New York: U.S. Geological Survey Open-File Report 81–147, 1 sheet. [Also available at https://doi.org/10.3133/ofr81147.]
Miller, T.S., 1981b, Surficial geology of Williamstown quadrangle, Oswego County, New York: U.S. Geological Survey Open-File Report 81–148, 1 sheet. [Also available at https://doi.org/10.3133/ofr81148.]
Miller, T.S., 1982, Geology and ground-water resources of Oswego County, New York: U.S. Geological Survey Water-Resources Investigations Report 81–60, 37 p. [Also available at https://doi.org/10.3133/wri8160.]
Miller, T.S., and Muller, E.H., 1979, Surficial geology of Pulaski quadrangle, Oswego County, New York: U.S. Geological Survey Open-File Report 79–1343, 1 sheet. [Also available at https://doi.org/10.3133/ofr791343.]
Miller, T.S., and Muller, E.H., 1980, Surficial geology and well guides in Oswego County, in Geological Survey research 1980: U.S. Geological Survey Professional Paper 1175, p. 122. [Also available at https://doi.org/10.3133/pp1175.]
Miller, T.S., Bugliosi, E.F., Hetcher-Aguila, K.K., and Eckhardt, D.A., 2007, Hydrogeology of two areas of the Tug Hill glacial-drift aquifer, Oswego County, New York: U.S. Geological Survey Scientific Investigations Report 2007–5169, 42 p. [Also available at https://doi.org/10.3133/sir20075169.]
Miller, T.S., Sherwood, D.A., and Krebs, M.M., 1988, Hydrogeology and water quality of the Tug Hill glacial aquifer in northern New York: U.S. Geological Survey Water-Resources Investigations Report 88–4014, 60 p., 24 pls., scale 1:24,000. [Also available at https://doi.org/10.3133/wri884014.]
National Oceanic and Atmospheric Administration, 2014, Climate data online: National Oceanic and Atmospheric Administration database, accessed August 29, 2014, at https://www.ncdc.noaa.gov/cdo-web/.
Rantz, S.E., and others, 1982, Measurement and computation of streamflow—Volume 1, measurement of stage and discharge: U.S. Geological Survey Water Supply Paper 2175, [variously paged]. [Also available at https://doi.org/10.3133/wsp2175.]
Risen, A.J., and Reddy, J.E., 2011, Groundwater quality in the eastern Lake Ontario basin of New York, 2008: U.S. Geological Survey Open-File Report 2011–1074, 32 p. https://doi.org/10.3133/ofr20111074.
Salmi, T., Määttä, A., Anttila, P., Ruoho-Airola, T., and Amnell, T., 2002, Detecting trends of annual values of atmospheric pollutants by the Mann-Kendall test and Sen’s slope estimates—The Excel template application MAKESENS: Helsinki, Finland, Ilmatieteen Laitos, Meteorologiska Institutet, Finnish Meteorological Institute, 35 p.
Sandy Creek/Lacona Joint Water Works and Sandy Creek Water District 2, 2017, Annual drinking water quality report for 2016: Sandy Creek/Lacona Joint Water Works, 5 p., accessed August 2016, 2017, at http://www.sandycreekny.us/Annual%20Water%20Quality%20Report%20WD_2%20%20for%202016.pdf.
Town of Orwell, 2015, Annual drinking water quality report for 2014: Town of Orwell, 6 p., accessed July 25, 2018, at http://www.townoforwell-ny.us/documents/2014/20140000_annual_water_quality_report.pdf.
Town of Richland, 2014, Annual drinking water quality report for 2013: Town of Richland, New York, 4 p., accessed August 26, 2014, at http://www.townofrichland.org/forms/water_department/Annual%20Drinking%20Water%20Report.pdf.
U.S. Census Bureau, [2011], Decennial census of population and housing—2010: U.S. Census Bureau data, accessed February 15, 2014, at https://www.census.gov/2010census/.
U.S. Environmental Protection Agency, 2019, Overview of the drinking water sole source aquifer program: U.S. Environmental Protection Agency web page, accessed March 20, 2019, at https://www.epa.gov/dwssa/overview-drinking-water-sole-source-aquifer-program.
U.S. Geological Survey, 2004, National field manual for the collection of water-quality data: U.S. Geological Survey Techniques and Methods of Water-Resources Investigations, book 9, chaps. A1–A9, accessed October 2010 at https://water.usgs.gov/owq/FieldManual/.
U.S. Geological Survey, 2009, USGS water data for the nation: U.S. Geological Survey National Water Information System database, https://doi.org/10.5066/F7P55KJN.
Village of Adams, 2013, 2012 water quality report: Village of Adams, New York, 2 p., accessed November 10, 2016, at https://www.townofadams.com/pdf/2012_water_quality.pdf.
Village of Pulaski, 2018, Annual drinking water quality report for 2017: Village of Pulaski, New York, 5 p., accessed June 26, 2018, at https://villagepulaski.digitaltowpath.org:10789/content/Generic/View/3:field=documents;/content/Documents/File/142.pdf.
Zarriello, P.J., 1993, Determination of the contributing area to six municipal ground-water supplies in the Tug Hill glacial aquifer of northern New York, with emphasis on the Lacona-Sandy Creek well field: U.S. Geological Survey Water-Resources Investigations Report 90–4145, 51 p. [Also available at https://doi.org/10.3133/wri904145.]
Appendix 1. Concentrations of Water-Quality Constituents in Water Samples From the Tug Hill Glacial Aquifer, New York
Physiochemical properties and concentrations of major ions, nutrients, and dissolved oxygen in surface-water samples collected from the northern part of the Tug Hill glacial aquifer, Jefferson and Oswego Counties, north-central New York, 2009 and 2013.
[Data are from U.S. Geological Survey (2009). Table available for download at https://doi.org/10.3133/sir20225039. Sampling-site locations are shown on figure 23A. USGS, U.S. Geological Survey; ID, identification number; NWIS, National Water Information System; NY, New York; CR, county route; Br., bridge; Rd., road; mg/L, milligram per liter; µS/cm, microsiemens per centimeter at 25 degrees Celsius; °F, degree Fahrenheit; ft3/s, cubic foot per second; N, nitrogen; P, phosphorus; e, estimated value (constituent was detected in the sample but with low or inconsistent recovery); —, not analyzed; <, less than; NA, not applicable]
Physiochemical properties and concentrations of major ions, nutrients, trace elements, dissolved gases, and tritium in groundwater samples collected from the northern part of the Tug Hill glacial aquifer, Jefferson and Oswego Counties, north-central New York, 2013.
[Data are from U.S. Geological Survey (2009). Table available for download at https://doi.org/10.3133/sir20225039. Sampling-site locations are shown on figure 23A. USGS, U.S. Geological Survey; NWIS, National Water Information System; QA, quality assurance; ft, foot; bls, below land surface; S&G, sand and gravel; mg/L, milligram per liter; µS/cm, microsiemens per centimeter at 25 degrees Celsius; µg/L, microgram per liter; °F, degree Fahrenheit; ft3/s, cubic foot per second; yr, year; N, nitrogen; P, phosphorus; CaCO3, calcium carbonate; dinitrogen (N2), dissolved nitrogen gas; CFC, chlorofluorocarbon; e, estimated value (constituent was detected in the sample but with low or inconsistent recovery); NA, not applicable; —, not analyzed; <, less than]
Physiochemical properties and concentrations of major ions, nutrients, and trace elements in surface-water samples collected from the central part of the Tug Hill glacial aquifer, Oswego County, north-central New York, 2008 and 2013.
[Data are from U.S. Geological Survey (2009). Table available for download at https://doi.org/10.3133/sir20225039. Sampling site locations are shown in figure 23B. USGS, U.S. Geological Survey; ID, identification number; NWIS, National Water Information System; NY, New York; N, nitrogen; P, phosphorus; mg/L, milligram per liter; µS/cm, microsiemens per centimeter at 25 degrees Celsius; µg/L, microgram per liter; °F, degree Fahrenheit; ft3/s, cubic foot per second; e, estimated value (constituent was detected in the sample but with low or inconsistent recovery); NA, not applicable; —, not analyzed; <, less than]
Physiochemical properties and concentrations of major ions, nutrients, trace elements, dissolved gases, and tritium in groundwater samples collected from the central part of the Tug Hill glacial aquifer, Oswego County, north-central New York, 2013.
[Data are from U.S. Geological Survey (2009). Table available for download at https://doi.org/10.3133/sir20225039. Sampling-site locations are shown in figure 23B. USGS, U.S. Geological Survey; NWIS, National Water Information System; QA, quality assurance; S&G, sand and gravel; mg/L, milligram per liter; µS/cm, microsiemens per centimeter at 25 degrees Celsius; µg/L, microgram per liter; °F, degree Fahrenheit; yr, year; N, nitrogen; P, phosphorus; dinitrogen (N2), dissolved nitrogen gas; e, estimated value (constituent was detected in the sample but with low or inconsistent recovery); na, not applicable; —, not analyzed; <, less than]
Reference Cited
U.S. Geological Survey, 2009, USGS water data for the nation: U.S. Geological Survey National Water Information System database, https://doi.org/10.5066/F7P55KJN.
Conversion Factors
Inch/Pound to International System of Units
Temperature in degrees Fahrenheit (°F) may be converted to degrees Celsius (°C) as °C = (°F – 32) / 1.8.
Datums
Vertical coordinate information is referenced to the North American Vertical Datum of 1988 (NAVD 88) where light detection and ranging (lidar) and digital elevation model (DEM) data were used and to the National Geodetic Vertical Datum of 1929 (NGVD 29) elsewhere.
Horizontal coordinate information is referenced to North American Datum of 1983 (NAD 83).
Altitude, as used in this report, refers to distance above the vertical datum.
Supplemental Information
Specific conductance is given in microsiemens per centimeter at 25 degrees Celsius (µS/cm at 25 °C).
Concentrations of chemical constituents in water are given in either milligrams per liter (mg/L) or micrograms per liter (µg/L).
Activities for radioactive constituents in water are given in picocuries per liter (pCi/L).
Abbreviations
CFC
chlorofluorocarbon
DEM
digital elevation model
EPA
U.S. Environmental Protection Agency
HVSR
horizontal-to-vertical spectral ratio
lidar
light detection and ranging
MCL
maximum contaminant level
NAVD
North American Vertical Datum
NOAA
National Oceanic and Atmospheric Administration
NWIS
National Water Information System
NWQL
National Water Quality Laboratory
NYSDEC
New York State Department of Environmental Conservation
NYSDOH
New York State Department of Health
SMCL
EPA secondary maximum contaminant level
SRP
soluble reactive phosphorus
THC
Tug Hill Commission
TU
tritium unit
USGS
U.S. Geological Survey
For more information, contact
Director, New York Water Science Center
U.S. Geological Survey
425 Jordan Road
Troy, NY 12180–8349
dc_ny@usgs.gov
or visit our website at
https://www.usgs.gov/centers/ny-water
Publishing support provided by the Pembroke Publishing Service Center
Suggested Citation
Miller, T.S., Fisher, B.N., and Kappel, W.M., 2022, Geohydrology and water quality of the northern and central parts of the Tug Hill glacial aquifer, Jefferson and Oswego Counties, north-central New York: U.S. Geological Survey Scientific Investigations Report 2022–5039, 54 p., https://doi.org/10.3133/sir20225039.
ISSN: 2328-0328 (online)
Study Area
| Publication type | Report |
|---|---|
| Publication Subtype | USGS Numbered Series |
| Title | Geohydrology and water quality of the northern and central parts of the Tug Hill glacial aquifer, Jefferson and Oswego Counties, north-central New York |
| Series title | Scientific Investigations Report |
| Series number | 2022-5039 |
| DOI | 10.3133/sir20225039 |
| Year Published | 2022 |
| Language | English |
| Publisher | U.S. Geological Survey |
| Publisher location | Reston, VA |
| Contributing office(s) | New York Water Science Center |
| Description | Report: ix, 54 p.; Data Releases: 2; Figures: 2; Tables: 4 |
| Country | United States |
| State | New York |
| County | Jefferson County, Oswego County |
| Other Geospatial | Tug Hill Glacial Aquifer |
| Online Only (Y/N) | Y |
| Additional Online Files (Y/N) | Y |
| Google Analytic Metrics | Metrics page |