

U.S. Geological Survey Response to Hurricane Maria Flooding in Puerto Rico and Characterization of Peak Streamflows Observed September 20–22, 2017
Links
- Document: Report (23.6 MB pdf) , HTML , XML
- Plate: Plate 1 (22.8 MB pdf)
- Appendixes:
- Dataset: USGS National Water Information System database —USGS water data for the Nation
- Data Release: USGS data release —Data files for USGS response to Hurricane Maria flooding in Puerto Rico and characterization of peak streamflows observed September 20–22, 2017
- Version History: Version History (1 kB txt)
- Download citation as: RIS | Dublin Core
Acknowledgments
This work was supported by the Additional Supplemental Appropriations for Disaster Relief Requirements Act, 2018 (P.L. 115-123) and was done in support of, and in collaboration with, various Federal and Puerto Rico agencies, including the U.S. Army Corps of Engineers, Federal Emergency Management Agency, National Oceanic and Atmospheric Administration, Puerto Rico Department of Natural and Environmental Resources, Puerto Rico Electric Power Authority, and Puerto Rico Aqueduct and Sewer Authority. The authors thank all the U.S. Geological Survey (USGS) employees who participated in the data collection, analysis, and review of information presented in this report. The authors also recognize and thank Tony Nieves for allowing the USGS to mount a high-resolution camera on his property to monitor the Lago Guajataca Dam, which was severely damaged during the hurricane. Special recognition is given to Larry Bohman (retired), Chad Ostheimer, Mark Roland, and Christopher Morris, all of whom provided technical reviews of the material presented in this report. The authors also thank Michael Deacon and Kimberly Swidarski for their editorial assistance with the preparation of this report.
Abstract
Hurricane Maria struck the island of Puerto Rico on September 20, 2017, as a Category 4 storm. The hurricane traversed the island from southeast to northwest and produced recorded 48-hour rainfall totals of up to 30.01 inches. Estimates of the human death toll range from 2,975 to 4,645, possibly more.
The U.S. Geological Survey (USGS) hydrologic monitoring network sustained substantial wind and flood damage during the hurricane. Eighty-five of the 300 hydrologic monitoring stations operating in Puerto Rico and the U.S. Virgin Islands prior to the passage of Hurricane Maria were destroyed or damaged. During the weeks and months after the hurricane, USGS field crews in Puerto Rico prioritized repair of the hydrologic monitoring network and collected hydrologic information to characterize the magnitude of observed peak streamflows at 20 streamgage and to develop new theoretical stage-streamflow relations for 58 streamgages where stream channels were substantially altered; the theoretical stage-streamflow relations were used to estimate Hurricane Maria peak streamflows for 39 of those sites. As part of a pilot program, USGS field crews installed continuous slope-area monitoring equipment at two remote streamgages to automate the collection of high-streamflow stage data.
Hurricane Maria peak streamflows and rankings were determined for 73 USGS streamgages in Puerto Rico. New rank 1 period-of-record peak streamflows occurred at 28 sites, rank 2 period-of-record peak streamflows occurred at 17 sites, and rank 3 period-of-record peak streamflows occurred at 9 sites; period-of-record peak streamflows at the remaining 19 sites either ranked from 4th to 20th or were not ranked. Annual exceedance probabilities for 53 unregulated peak streamflows ranged from greater than 50.0 percent (recurrence interval of less than 2 years) to 0.3 percent (recurrence interval of 333 years), with the majority (28 of 53) in the range of 10.0–2.1 percent (recurrence intervals of 10–48 years).
A comparison of period-of-record ranks for the largest flood events that have occurred in Puerto Rico since the 1960s indicated that Hurricane Maria produced more record peak streamflows than either Hurricane Hortense in 1996 or Hurricane Georges in 1998. Limited pre-1960s hydrologic data preclude quantitative comparison with earlier storms.
As part of this study, a maximum peak-streamflow envelope curve for Puerto Rico was developed using historical peak-streamflow information available through 2017. Other post-Hurricane Maria USGS activities summarized in this report include (1) Global Navigation Satellite System surveys at all stations in the USGS hydrologic monitoring network, used to tie the network to the Puerto Rico Vertical Datum of 2002; and (2) telemetered monitoring of the Lago Guajataca Dam in northwestern Puerto Rico, which was damaged and at risk of failure from October to December 2017.
Introduction
The 2017 hurricane season was one of the most active seasons historically in the Atlantic Basin, as indicated by three category 4 or 5 hurricanes (Harvey, Irma, and Maria) that struck the United States and its territories (Camp and others, 2018). Hurricane Maria made landfall on September 20, 2017, as a category 4 storm in southeastern Puerto Rico, near the Yabucoa Municipio (Pasch and others, 2019). Hurricane Maria traversed Puerto Rico from southeast to northwest, with maximum sustained wind speeds of up to 155 miles per hour (mi/h), recorded near Yabucoa, and a maximum 48-hour rainfall total of 30.01 inches (in.), recorded in the southeastern mountains of the island. Figure 1 shows Hurricane Maria’s track through the Atlantic Basin and Caribbean Sea, and across Puerto Rico.
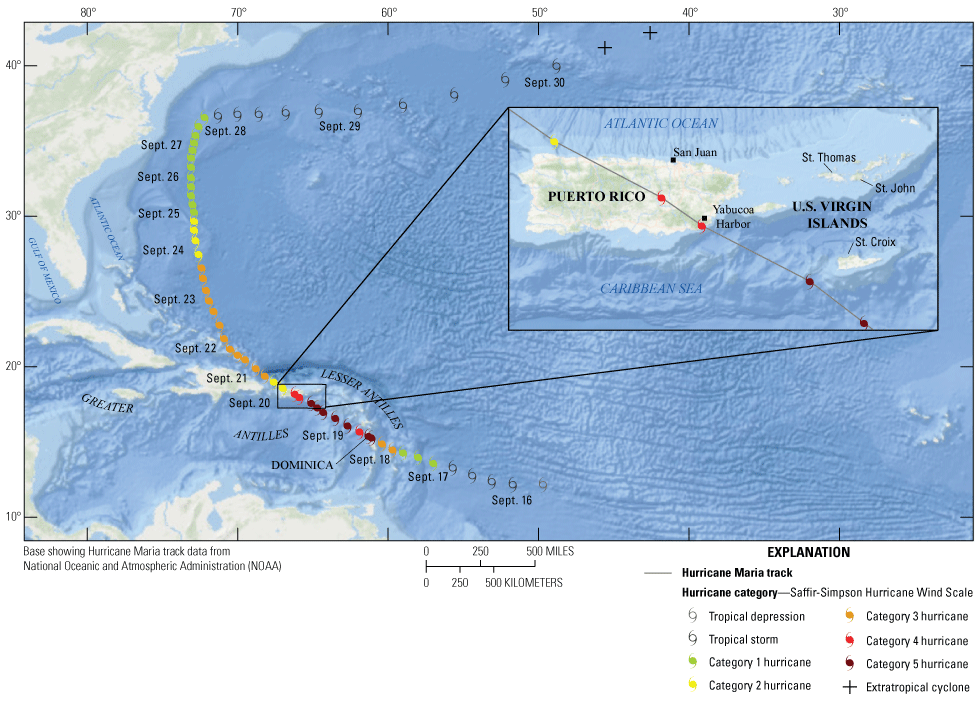
Hurricane Maria track across the Atlantic Basin, Caribbean Sea, and Lesser and Greater Antilles, including Puerto Rico (National Oceanic and Atmospheric Administration [NOAA] National Hurricane Center and Central Pacific Hurricane Center, 2021). Image is the intellectual property of Esri and is used herein under license. Copyright 2019 Esri and its licensors. All rights reserved.
The Milken Institute School of Public Health (2018) estimated that Hurricane Maria caused as many as 2,975 deaths, directly and indirectly, between September 2017 and February 2018. Kishore and others (2018) estimated that Hurricane Maria caused 4,645 deaths, possibly more, directly and indirectly, between September 2017 and December 2017. The National Centers for Environmental Information (2017) characterized Hurricane Maria as the strongest hurricane to affect Puerto Rico since Hurricane San Felipe II, a category 5 storm in September 1928, and as the 10th strongest Atlantic Basin hurricane on record. The cost of damages incurred by Puerto Rico and the U.S. Virgin Islands was about 90 billion U.S. dollars (Pasch and others, 2019). About 388 bridges in Puerto Rico suffered considerable flood damage, including 26 that completely collapsed (Ortiz, 2020). The electric power grid failed, requiring residents to rely on portable generators for several months; power was not fully restored until August 2018 (ABC News, 2018). High winds, heavy rainfall, and flooding disrupted Puerto Rico’s water supply and residential water service; residential water service was not restored to most (about 92 percent) of Puerto Rico residents until the end of November 2017 (Federal Emergency Management Agency, 2018). The Lago Guajataca Dam in northwestern Puerto Rico was severely damaged by flooding and was at risk of failure for several weeks after the hurricane. Local and Federal agencies implemented emergency mitigation measures, including continuous monitoring and spillway repairs, to prevent failure of the dam, flooding of the valley downstream, and the potential for more casualties (Carrasco, 2019).
Hurricane Maria flooding substantially altered stream channels across Puerto Rico and damaged much of the U.S. Geological Survey (USGS) hydrologic monitoring network. The damage severely inhibited the collection of hydrologic data needed for post-flood monitoring of streamflows, ongoing flood-hazard mitigation, and management of the island’s water resources. As soon as conditions on the island were safe for travel, USGS personnel assessed damage to the network infrastructure, implemented repairs, and documented high-water marks left by the flooding;1 all of these activities were prioritized in coordination with needs identified by emergency-response agencies, other USGS cooperators, and the public.
Following large flood events such as Hurricane Maria, documentation of peak stream stages, peak streamflows, and stream-channel geometry changes is needed to correctly characterize the post-flood stage-streamflow relation at affected streamgages. USGS personnel collected at-site hydrologic data to characterize the magnitude of flooding at selected streamgages and conducted longer-term network rehabilitation activities, including field surveys and modeling to establish new stage-streamflow relations for selected streamgages. Subsequent analyses of these data were used to characterize observed Hurricane Maria peak streamflows in terms of their magnitudes, period-of-record rankings, and annual exceedance probabilities (AEPs) based on the study by Ryan and others (2021)2 and historical peak streamflows published by the USGS through water year 2017. (A water year is defined as the 12-month period from October 1 to September 30.) Hurricane Maria flooding also was compared to large historical flood events in Puerto Rico, and period-of-record maximum peak streamflows in Puerto Rico, including those associated with Hurricane Maria, were used to develop a maximum peak-streamflow envelope curve for the island (Crippen and Bue, 1977).
USGS personnel also conducted Global Navigation Satellite Systems (GNSS) surveys to tie the USGS hydrologic monitoring network to the Puerto Rico Vertical Datum of 2002 (PRVD02) and provided telemetered, high-resolution monitoring of damaged infrastructure at the Lago Guajataca Dam from October to December 2017, as part of emergency mitigation measures implemented by local and Federal agencies.
Purpose and Scope
This report documents hurricane damages to the USGS hydrologic monitoring network in Puerto Rico and the U.S. Virgin Islands and summarizes selected activities conducted by the USGS in response to Hurricane Maria flooding in Puerto Rico. These activities include the following:
-
At-site flood studies (indirect measurements) to determine peak streamflows that occurred during and after Hurricane Maria3 at 20 streamgage sites.
-
Hydraulic modeling studies to develop new theoretical stage-streamflow relations (and in some cases estimate the Hurricane Maria peak streamflow) at 58 streamgage sites for which flooding substantially changed the preexisting relation.
-
Implementation of a pilot program to automate the collection of continuous stage-streamflow data at two remote streamgage sites using the continuous slope-area (CSA) method (Wiele and others, 2015).
-
Documentation of Hurricane Maria peak stages, streamflows, and AEPs for selected USGS streamgage sites.
-
Comparison of Hurricane Maria flooding with historical hurricane-related floods in Puerto Rico.
-
Development of a maximum peak-streamflow envelope curve for Puerto Rico (Crippen and Bue, 1977).
-
Documentation of selected other USGS hurricane-response activities. These include GNSS surveys conducted to establish PRVD02 at all monitoring stations in the USGS Puerto Rico hydrologic network and the installation of a telemetered, high-resolution camera used to collect targeted images of the damaged Lago Guajataca Dam from October to December 2017. The images were collected to support emergency mitigation measures implemented by local and Federal agencies.
This report is focused primarily on USGS hurricane-response activities in Puerto Rico. However, the documentation of damages to the USGS hydrologic monitoring network includes both Puerto Rico and the U.S. Virgin Islands because of their integration in terms of network operation and maintenance.
Description of Study Area
Puerto Rico and its three principal offshore islands (Isla de Vieques, Isla de Culebra, and Isla de Mona) are the easternmost islands of the Greater Antilles, bounded on the north by the Atlantic Ocean and on the south by the Caribbean Sea (Ramos-Ginés, 1999). The main island of Puerto Rico is about 110 miles (mi) long and 40 mi wide; the combined area of the islands of Puerto Rico, Isla de Vieques, Isla de Culebra, and Isla de Mona is about 3,471 square miles (mi2; Olcott, 1999). In 2019, the approximate population of Puerto Rico was 3,194,000 (U.S. Census Bureau, 2020).
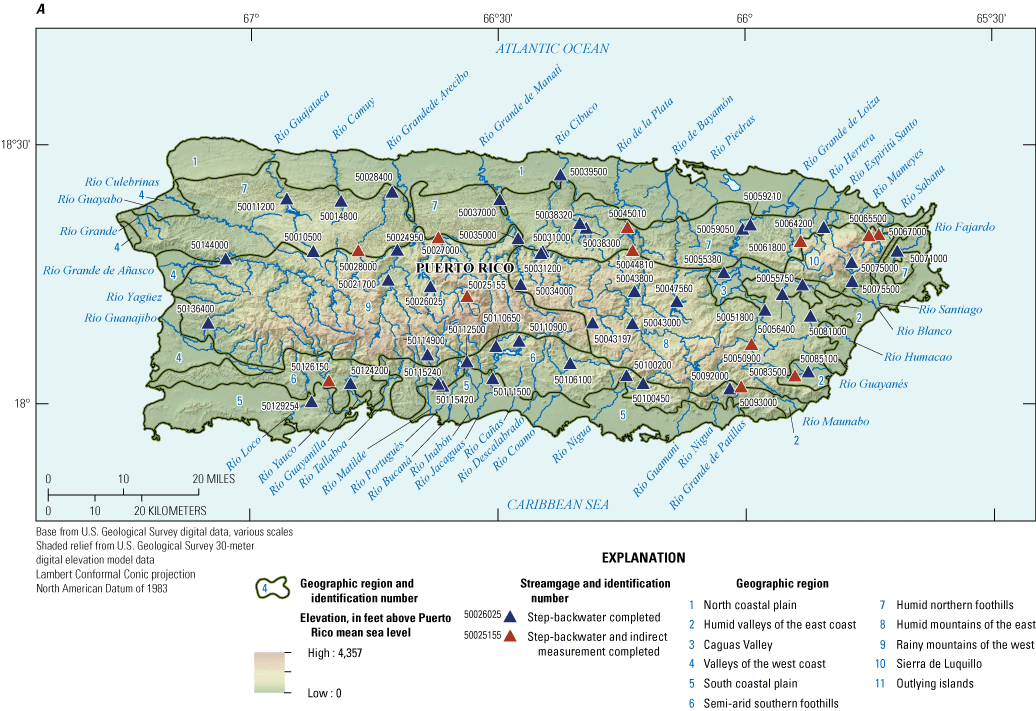
Based on studies of Puerto Rico and its offshore islands conducted in the 1960s by Picó, (1964), Gómez-Gómez and others (2014, table 1) identified 11 geographic regions (fig. 2) with distinct landform (physiography) and climate characteristics: (1) north coastal plain, (2) humid valleys of the east coast, (3) Caguas Valley, (4) valleys of the west coast, (5) south coastal plain, (6) semi-arid southern foothills, (7), humid northern foothills, (8) humid mountains of the east, (9) rainy mountains of the west, (10) Sierra de Luquillo, and (11) Outlying islands (Isla de Vieques, Isla de Culebra, and Isla de Mona). Although finer-scale landform and climate variability may influence site-specific flood characteristics during large hurricane events, these 11 geographic regions provide an effective framework to document Hurricane Maria flooding and its effect on watersheds in different parts of Puerto Rico.
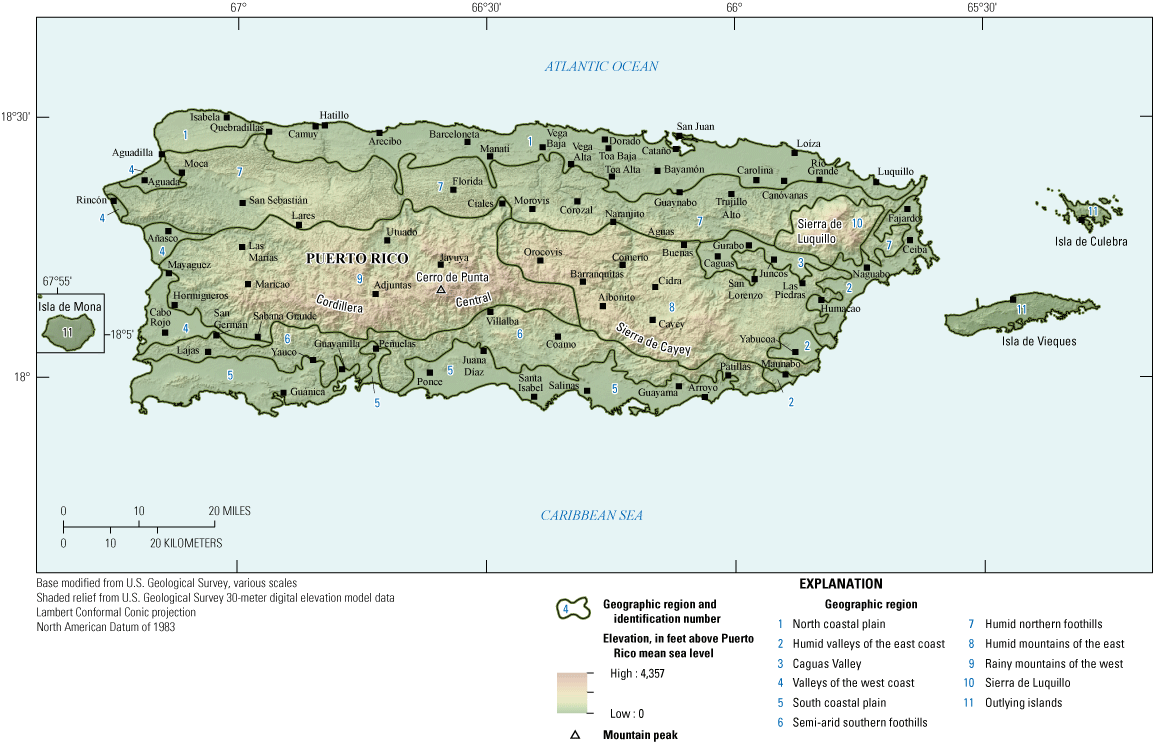
Geographic regions of Puerto Rico (modified from Gómez-Gómez and others, 2014).
Physiography
The principal physiographic feature of Puerto Rico is an east-west mountain range that effectively divides the island into two areas: a northern area that covers two-thirds of the island and a southern area that covers the remaining third of the island (Ramos-Ginés, 1999). The range is composed of the Cordillera Central in the western and central parts of the island, and the Sierra de Cayey in the eastern part (fig. 2); peak elevations range from 3,000 to more than 4,000 feet (ft) above sea level, with the highest point being the Cerro de Punta in the Cordillera Central, having a summit elevation of about 4,390 ft above Puerto Rico mean sea level. A smaller mountain range in northeastern Puerto Rico, the Sierra de Luquillo, supports dense tropical rain forests, whereas semiarid conditions prevail in the southern and southwestern parts of the island. The island’s coastal plains extend inland 8–12 mi on the northern part of the island and 2–8 mi on the southern part; the northern and southern coastal plains are separated from the interior mountains by the northern and southern foothills, respectively.
The Cordillera Central and Sierra de Cayey form the principal drainage divide of the larger watersheds whose stream channels generally are deeply incised into the mountain topography. Stream gradients in the mountains are steep, but streams that drain the northern side of the island are longer and their slopes gentler than those that drain the southern side. Flooding often occurs as the result of intense rainfall in the upper (mountainous) parts of the basins; however, streams on the southern side of the island are more susceptible to flash floods because of their shorter length and steeper upper-basin gradients (Murphy and Stallard, 2012; Ramos-Ginés, 1999). A summary of the principal streams in Puerto Rico and their characteristics is available in Puerto Rico Department of Natural and Environmental Resources (2007).
The USGS delineates watersheds by using a nationwide system based on surface hydrologic features (U.S. Geological Survey and Natural Resources Conservation Service, 2013). This system divides the United States and its territories into 21 regions (2-digit), 222 subregions (4-digit), 370 basins (6-digit), 2,270 subbasins (8-digit), ~20,000 watersheds (10-digit), and ~100,000 subwatersheds (12-digit). Throughout this report, watersheds and USGS streamgage sites in Puerto Rico are referenced to their 10-digit hydrologic unit codes (HUCs) as defined by this watershed accounting system. Figure 3 shows the distribution of the watersheds, referenced to their 10-digit HUCs, for the main island of Puerto Rico and the Isla de Vieques and Isla de Culebra offshore.
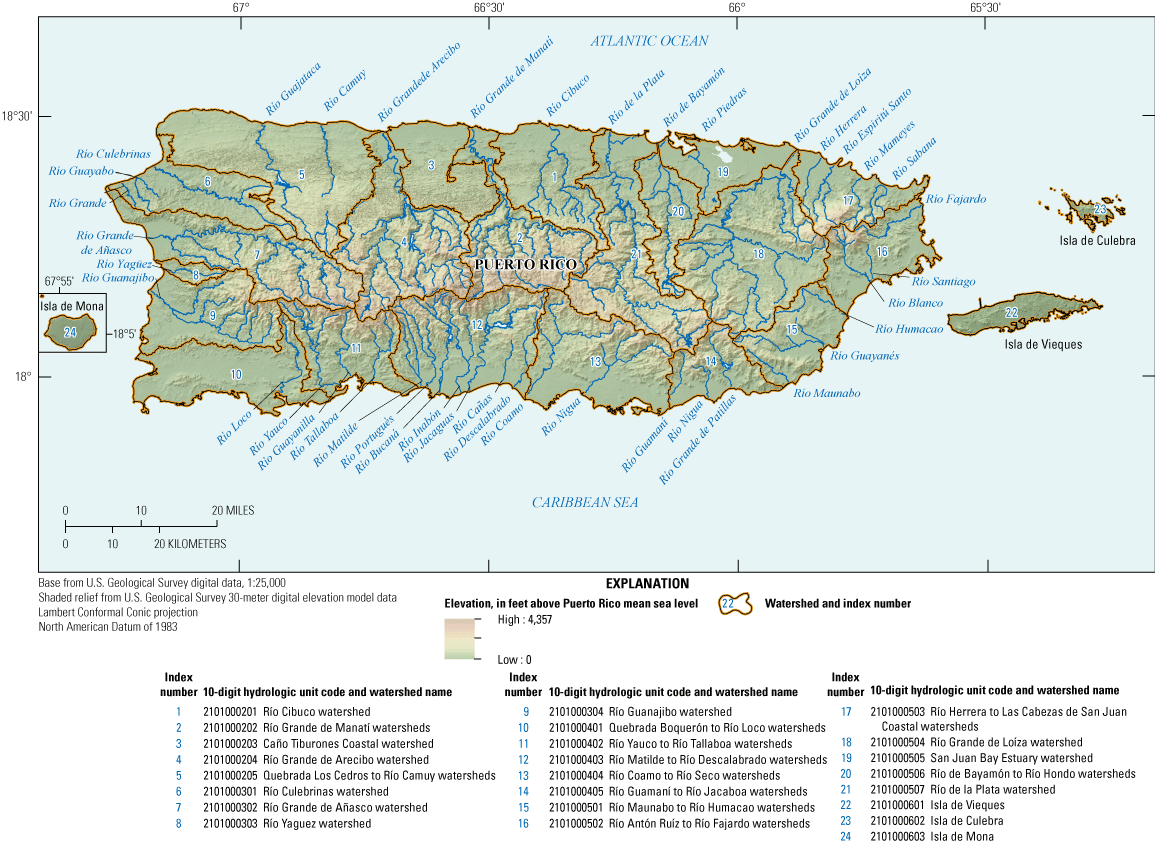
Watersheds of Puerto Rico and associated 10-digit hydrologic unit codes.
Climate
Puerto Rico has a tropical marine climate, and its trade-wind patterns are predominantly from the east-northeast (Murphy and Stallard, 2012). Seasonal temperature variability during the year is minor, with the largest differences of up to nearly 3 degrees Celsius (°C) occurring between the months of December and July; the island-wide average temperature is 25 °C (Jennings and others, 2014). The 30-year mean annual precipitation (period 1991–2020) is shown in figure 4A, B. Mean annual precipitation ranges from 32.49 in. in the southwestern part of the island to more than 150 in. in El Yunque National Forest (National Weather Service [NWS], 2021b).
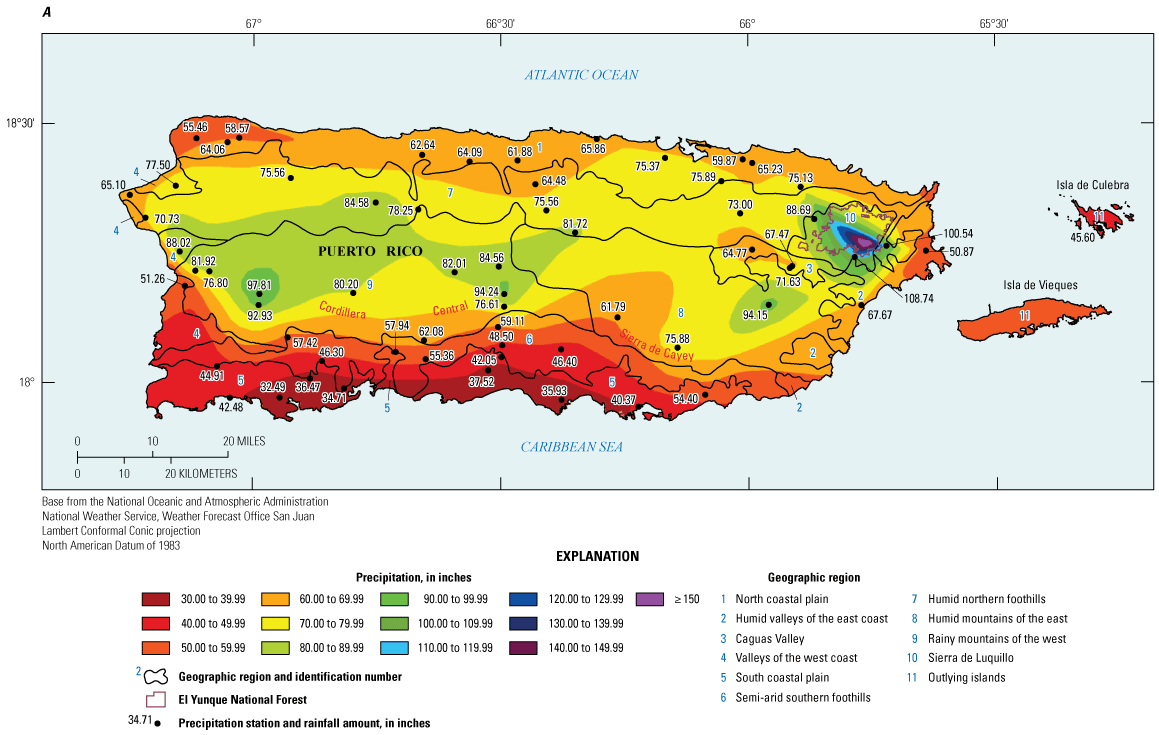
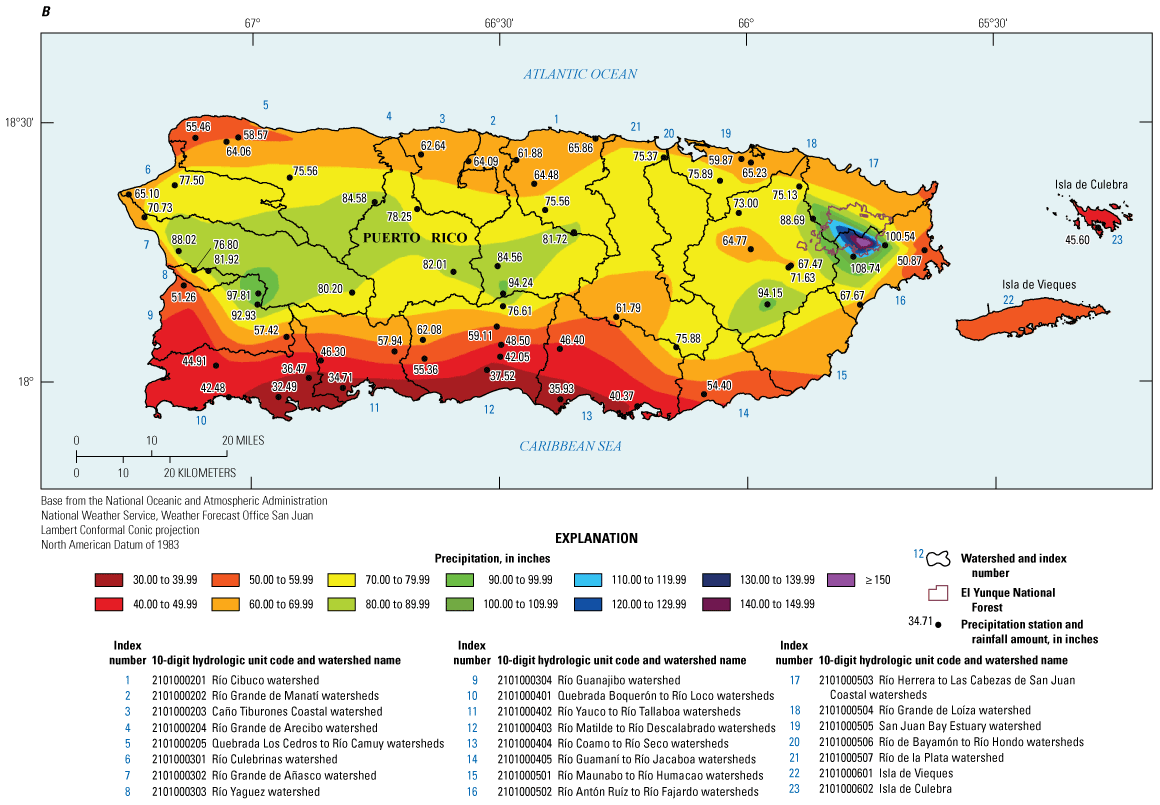
Mean annual precipitation for Puerto Rico, 1991–2020 with, A, geographic region boundaries modified from Gómez-Gómez and others (2014) shown for reference and, B, watersheds of Puerto Rico and associated 10-digit hydrologic unit codes shown for reference. Rasters generated from interpolation of point precipitation data from the National Oceanic and Atmospheric Administration (National Weather Service [NWS], 2021b); Isla de Mona is not shown because no point data were available.
Differences in rainfall patterns across the island reflect the influence of diverse topography (Jennings and others, 2014). The Cordillera Central and Sierra de Cayey mountains form an orographic control for the island’s rainfall (Bush and others, 2009). Rainfall amounts generally are higher in the northeastern part of the island (Sierra Luquillo), whereas drier conditions exist in the southern and southwestern parts. These regional variations in climate and rainfall patterns are characterized as part of the 11 geographic regions identified by Gómez-Gómez and others (2014).
Storm fronts, referred to as “tropical waves,” bring precipitation to Puerto Rico and its neighboring islands during a pronounced rainy season from May to November. Other more isolated rainfall events occur as the result of cold-front systems passing through the region from November to April (Gómez-Gómez and others, 2014). The hurricane season generally lasts from June to November, with hurricanes and tropical storms occurring most frequently between mid-August and late October (National Oceanic and Atmospheric Administration [NOAA] National Hurricane Center and Central Pacific Hurricane Center, 2020).
Weather Conditions Associated With Hurricane Maria
Originating from a tropical wave that formed east of the Lesser Antilles, Hurricane Maria began as a tropical storm on September 16, 2017 (fig. 1). Favorable environmental conditions allowed the storm to undergo rapid intensification as it approached the Lesser Antilles island arc. Hurricane Maria reached category 5 strength on September 18, just before making landfall on the island of Dominica. After weakening slightly as it passed over Dominica, Hurricane Maria achieved its peak intensity over the eastern Caribbean Sea with maximum sustained winds of 175 mi/h (NWS, 2021a) and a pressure of 908 millibars (26.81 in. of mercury), the lowest pressure on record for this part of the Atlantic Basin (Pasch and others, 2019). Hurricane Maria made landfall on September 20, 2017, in the Yabucoa Municipio, Puerto Rico, as a strong category 4 hurricane with maximum sustained winds of 155 mi/h. As the center of the storm moved over southeastern Puerto Rico then into the interior and northwestern Puerto Rico, hurricane force winds spread over the entire island. Heavy rainfall produced major to catastrophic flooding and flash flooding across most of the island.
Hurricane Maria’s center moved offshore from northwestern Puerto Rico on the afternoon of September 20, 2017. Although hurricane-force winds began to diminish when the system moved offshore, tropical-storm-force winds continued into the evening and overnight hours across the island (NWS, 2021a).
Estimated 48-hour rainfall totals for September 19–21, 2017, are shown in figure 5A, B (NWS, 2021a); individual station totals shown on the figure were compiled and published by the National Hurricane Center based on data from various rainfall monitoring sites in Puerto Rico.
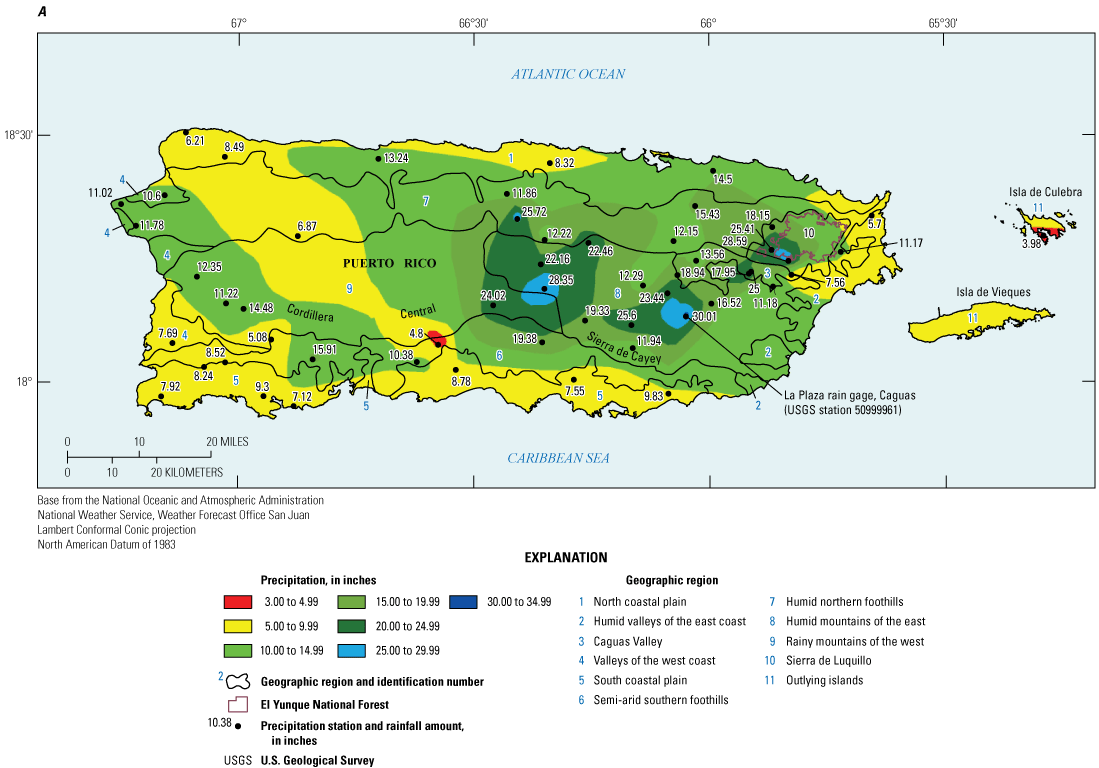
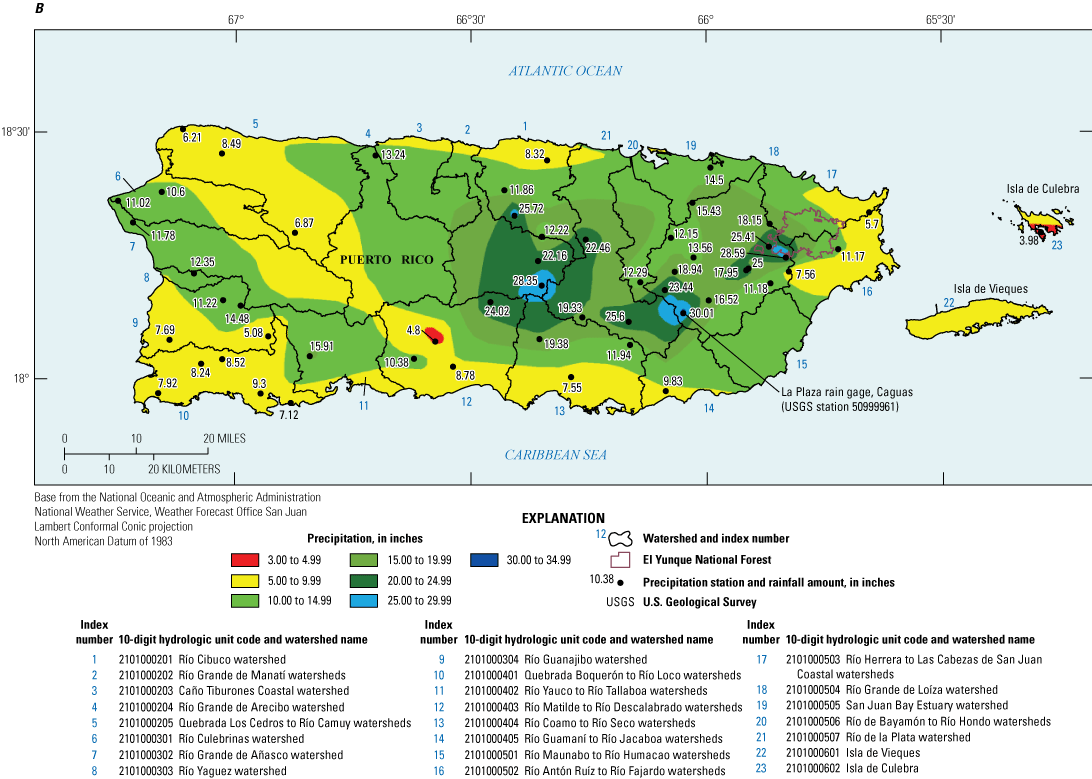
Hurricane Maria estimated 48-hour rainfall totals for Puerto Rico from 8:00 a.m. Atlantic Standard Time (AST) September 19, 2017, to 8:00 a.m. AST September 21, 2017, (modified from National Weather Service [NWS], 2021a), with A, geographic region boundaries modified from Gómez-Gómez and others (2014) shown for reference and, B, watersheds of Puerto Rico and associated 10-digit hydrologic unit codes shown for reference. Isla de Mona is not shown because no point data were available.
Moderate to heavy rains continued to fall over various parts of the island in October and November 2017, causing additional flooding in watersheds still saturated by Hurricane Maria rainfall (NOAA, 2017). As a result, some streams in Puerto Rico experienced peak streamflows in October and November that were higher than those caused by the hurricane.
Damage to the USGS Hydrologic Monitoring Network Caused by Hurricane Maria
Prior to Hurricane Maria, the USGS maintained and operated 300 hydrologic monitoring stations in Puerto Rico and the U.S. Virgin Islands. Specifically, the pre-Hurricane Maria hydrologic monitoring network consisted of the following (appendix 1):
-
78 streamgages (natural streams) that collected continuous records of stream stage (the height of a water surface above an established datum plane) for use in computing streamflows, and in some cases, water-quality or precipitation data.
-
27 canal or diversion monitoring stations that collected continuous records of stream stage for use in computing streamflows that are regulated or managed for specific water-use purposes; as such, they are distinguished from streamgages operated on natural streams.
-
27 lake or reservoir gages that collected continuous records of water-surface levels (elevation), and in some cases, water-quality data.
-
42 water-quality sampling sites. Sampling also was conducted at 12 streamgages.
-
20 standalone precipitation gages and 28 precipitation gages collocated with streamgages or groundwater monitoring stations.
-
101 groundwater wells that collected groundwater elevation data, and in some cases, water-quality data.
-
5 special-purpose monitoring sites (coastal and wetland) that collected site-specific water-quality data and in some cases water-surface levels (elevation) and precipitation data.
Plate 1 shows the pre-Hurricane Maria USGS hydrologic monitoring network in Puerto Rico, Isla de Vieques, and the U.S. Virgin Islands. Damage assessments by USGS personnel determined that 85 hydrologic monitoring stations were damaged or destroyed by high winds and (or) flooding in Puerto Rico (appendix 1). This total includes 48 streamgages, 7 canal gages, 9 lake/reservoir gages, 1 water-quality sampling site, 9 standalone precipitation gages, 10 groundwater wells, and 1 coastal monitoring station. Costs associated with the infrastructure and equipment damage (including gage replacements and other repairs) were estimated at more than 1 million U.S. dollars.
USGS personnel began repairing and rebuilding affected monitoring stations in Puerto Rico as soon as they could be accessed. Personnel prioritized repairs according to needs identified by local and Federal cooperators involved with recovery activities. Some stations were relocated, and several were discontinued; several new stations also were installed as part of the restoration activities. The post-Hurricane Maria USGS monitoring network was fully operational by mid-2018.
Hurricane Maria not only had an economic impact on the USGS hydrologic monitoring network in terms of the cost of reconstruction or repair of monitoring stations, but also produced historical record peak streamflows that caused substantial morphologic changes to stream channels throughout Puerto Rico. The accuracy of computed streamflow from many streamgages was severely compromised because of channel aggradation or degradation. At-site streamflow measurements made over periods of months or years in a variety of streamflow conditions, often in conjunction with hydraulic modeling, were needed to reestablish the accuracy of streamflow records. Hydraulic modeling also was needed at many sites to determine peak streamflows associated with observed flood events.
Methods
Methods used by USGS personnel to characterize peak streamflows and stages associated with Hurricane Maria (and subsequent) flooding, and to characterize post-Hurricane Maria stage-streamflow relations, are described in this section. All data collected and used in support of this study can be accessed from the USGS National Water Information System web interface (NWISWeb; USGS, 2021a), and Gómez-Fragoso and Smith (2022). Streamgage drainage areas cited in this report are consistent with those used by Ryan and others (2021) and may differ within 2 percent or less from those published on NWISWeb, according to drainage-area revision criteria published by the USGS (2012a). Throughout this report, the terms “left” and “left bank,” and “right” and “right bank” refer to viewer orientation when looking downstream.
High-Water Mark Identification and Documentation
High-water marks (HWMs) are evidence of the highest water levels that occurred during a riverine flood or coastal storm-tide event and are critical for reliable determination of peak streamflow by indirect methods described in subsequent sections of the report. USGS field crews followed guidance provided by Koenig and others (2016) to identify and document HWMs, noting the characteristics of each mark and assessing the uncertainty associated with each mark. Documenting HWM uncertainty is important because streamflow computations rely on analyst interpretation of the most reliable HWMs to estimate the peak water-surface profile in the study reach. HWM uncertainty, accompanied by a detailed description and photographs of the mark, is quantified according to the ranges identified in table 1.
Table 1.
High-water mark uncertainty ranges (from Koenig and others, 2016).[±, plus or minus]
Site Topographic Surveys and Characterization of Roughness
Post-flood analyses of peak streamflows and stream-channel conditions require detailed field surveys to characterize HWMs and peak water-surface profiles, channel cross-section geometry, and any relevant hydraulic structures such as bridges or roadways. USGS field crews used total stations (that is, precision electronic/optical instruments with a tiltable telescope and automated data processing and storage capabilities) and real-time kinematic Global Navigation Satellite System (RTK–GNSS) equipment to document the location and elevation of HWMs and hydraulic structures, and for conducting channel cross-section surveys. Whenever possible, surveyed elevations were referenced to both the designated vertical datum used at the streamgage and to PRVD02, geoid 12B (National Geodetic Survey, 2014). Further information describing the horizontal and vertical datums used for the topographic surveys of indirect measurements and step-backwater analysis (SBA) is provided in Gómez-Fragoso and Smith (2022). Surveying protocols adhered to guidance in Benson and Dalrymple (1967), Kenney (2010), and Rydlund and Densmore (2012).
Post-flood field studies also required characterization of channel and floodplain features in terms of a roughness coefficient, which quantifies the degree to which these features resist gravitational forces propelling the streamflow downstream. Roughness typically is characterized by Manning’s roughness coefficients or n-values (hereafter referred to as “Manning’s n-values”), which apply to a longitudinal reach of the channel and floodplain (Chow, 1959).
In practical applications of post-flood analytical methods described in this section, the Manning’s n-values for a given site and flood event are not known and must be estimated by experienced hydrographers for observed site features and conditions. Several methods are available to assist with the estimation process, including the Cowan method (Cowan, 1956) and photographic comparison (for example, Barnes, 1967, for channel roughness; and Arcement and Schneider, 1989, for floodplain roughness).
USGS personnel used one or more of these estimation methods to estimate Manning’s n-values at sites where one-dimensional hydraulic analyses were used to compute peak streamflow or to assess post-flood stage-streamflow relations. Where two-dimensional hydraulic modeling was used to compute peak streamflow, surface roughness was characterized in terms of the drag coefficient. This coefficient is a dimensionless quantity that characterizes the drag or resistance of an object in water as a function of sediment grain-size and vegetation characteristics through the study reach (Barton and others, 2009). Although the drag coefficient can be related computationally to the Manning’s n-values, the underlying physical assumptions associated with the two coefficients differ slightly.
Indirect Measurements of Peak Streamflow and Associated Uncertainty
USGS personnel used standard USGS techniques and methods for one-dimensional indirect measurement of peak streamflows (Benson and Dalrymple, 1967), slope-area measurements (Dalrymple and Benson, 1968), culvert-control measurements (Bodhaine, 1968), width-contraction (bridge) measurements (Matthai, 1967), and road-overflow (weir) measurements (Hulsing, 1967). Access to streamgage sites by USGS field crews during Hurricane Maria flooding was unsafe and (or) physically impossible. Indirect (or post-flood) methods were used to characterize peak streamflows that could not be determined using direct methods such as current-meter or hydro-acoustic measurements, or from preflood stage-streamflow relations. Indirect determination of peak streamflow involves several steps: (1) site reconnaissance to identify an appropriate study reach; (2) onsite identification and flagging of flood HWMs; (3) topographic surveys of HWMs, channel cross-section geometry, and affected structures (such as bridges, culverts, weirs, or flooded roadways); (4) estimates of Manning’s n-values; and (5) hydraulic modeling to compute the peak streamflow using field data collected at the site.
Based on field reconnaissance efforts in October 2017, USGS personnel implemented the most appropriate indirect method(s) to compute peak streamflow at selected sites. Analysts used public-domain software tools developed by USGS or collaborating organizations to facilitate the following types of computations:
-
Slope-area measurements—Using the Slope-Area Computation Program (SAC; Fulford, 1994), the Slope-Area Computation Program Graphical User Interface 1.0 (SACGUI; Bradley, 2013b), and the International River Interface Cooperative (iRIC) SAC module in iRIC 3.0 (Shimizu and Nelson, 2020).
-
Culvert-control measurements—Using the Culvert Analysis Program (CAP), version 97-08 (Fulford, 1998; Bradley, 2013a), and the CAP module in iRIC 3.0 (Shimizu and Nelson, 2020).
-
Width-contraction (bridge) measurements—According to procedures in Matthai (1967) and USGS Surface Water Branch Technical Memo No. 74.14 (USGS, 1974).
-
Road-overflow (weir) measurements—According to procedures in Hulsing (1967) and USGS Surface Water Branch Technical Memo No. 73.01 (USGS, 1972).
Flooding characterized by complex two-dimensional hydraulics cannot be analyzed using the one-dimensional methods described above. Estimation of peak streamflow for complex streamflow conditions requires more advanced modeling tools, some of which are available in the iRIC software platform (Shimizu and Nelson, 2020). Developed by USGS researchers, the iRIC System for Transport and River Modeling (SToRM) is a numerical model that uses the two-dimensional depth-averaged equations (also referred to as the “shallow water equations”) to simulate complex surface-water streamflows (Shimizu and Nelson, 2020). The iRIC SToRM model was used to estimate the Hurricane Maria peak streamflow at one site where flood hydraulics were characterized by valley-wide, two-dimensional streamflow components, low-gradient topography, and coastal backwater conditions.
Characterization of indirect-measurement uncertainty generally is qualitative, based on empirical guidelines and sensitivity analyses conducted for each measurement (comparison of computed streamflows for the feasible range of water-surface profile interpretation, Manning’s n-values, and other computational variables). Benson and Dalrymple (1967) provided an empirical framework for assessing the uncertainty of each measurement:
-
Good—Uncertainty of ±10 percent.
-
Fair—Uncertainty of ±15 percent.
-
Fair to poor—Uncertainty of ±20 percent (modification of Benson and Dalrymple [1967] rating curve system, as defined in this report).
-
Poor—Uncertainty of ±25 percent or greater.
-
Estimate—Uncertainty of ±50 percent or greater (extension of the Benson and Dalrymple [1967] uncertainty ranges, as defined in this report).
Several factors can affect the quality and reliability of an indirect measurement (Costa and Jarrett, 1981; Flaxman, 1974; Jarrett, 1986; Randall and Humphrey, 1984). HWM information and flood-peak water-surface profiles derived from observed HWMs are critical for reliable streamflow computations; HWM composition, quality, and density along each bank of the study reach are among the primary factors in assessing measurement quality. Selection of Manning’s n-values is another source of uncertainty. Manning’s n-values for a given site and flood peak are not known and thus are estimated using established methods and analyst experience. Sediment loads carried by the floodwaters also affect measurement quality. Ideal study reaches having stable, uniform channels with little erosion or sedimentation often do not exist. At sites where substantial sediment movement occurs, channel geometry can be significantly different during and after the flood peak; unstable channels subject to erosion and (or) sedimentation are therefore subject to additional uncertainty in the computed streamflow.
USGS analysts use sensitivity analyses over the feasible range of possible water-surface profile interpretations (elevation and slope), channel roughness (Manning’s n-values), and, in some cases, channel-bed geometry in combination with computational diagnostics, to characterize the uncertainty of each measurement.
SBA Method for Development of Theoretical Stage-Streamflow Relations at Streamgages
The standard-step hydraulic method, often referred to as the “step-backwater analysis method,” is a widely accepted one-dimensional hydraulic analysis used to determine theoretical water-surface elevations at a location of interest for specified streamflows (Chow, 1959; Davidian, 1984). Some applications of the SBA method include the establishment of a stage-streamflow relation (rating curve), definition of flood-inundation extent under specified hydrologic conditions, and computation of water-surface profiles needed for the analysis of hydraulic structures (Davidian, 1984). The SBA method was used by the USGS in Puerto Rico to develop stage-streamflow rating curves for newly installed streamgages, or for existing streamgages where Hurricane Maria caused substantial changes to channel morphology and invalidated the pre-hurricane stage-streamflow relation.
Application of the step-backwater method involves three main components: (1) data collection to characterize the channel and any associated hydraulic structure geometries, (2) selection of boundary conditions at which the model will initiate hydraulic calculations, and (3) development of the stage-streamflow relation for a range of user-selected streamflows and associated computed water-surface elevations at the desired location (Federal Emergency Management Agency, 2016). Convergence tests are conducted for each model to ensure water-surface profiles for a given streamflow have converged to the normal depth at the streamgage cross section, regardless of the water-surface elevation assumed at the downstream boundary; if tests show the model does not converge at the point of interest, the study reach must be extended further downstream. The resulting theoretical relation is particularly useful over the range of medium and high streamflows for which the collection of direct or indirect streamflow measurements is difficult or not possible; ideally, the theoretical relation subsequently will be verified or adjusted using the results of direct or indirect measurements.
Following completion of the field surveys, USGS analysts processed the survey data and developed one-dimensional hydraulic models for a target range of streamflows using the Hydrologic Engineering Center’s River Analysis System (HEC–RAS) computer model developed by the U.S. Army Corps of Engineers (2016). USGS personnel used HEC–RAS version 5.0 to develop theoretical stage-streamflow relations following Hurricane Maria and, in some cases, to estimate the Hurricane Maria peak streamflow for streamgage sites at which indirect measurements could not be made but peak gage heights were available. The term “gage height” (as opposed to the more general term “stage”) refers to the water-surface elevation relative to an arbitrary gage datum and is used in this report when documenting gage readings or water-surface elevations relative to the datum established for a given streamgage.
Additional modeling steps included (1) extension of the field surveying by using light detection and ranging (lidar)-derived data as necessary; (2) adjustment of the survey data, including processing of the Online Positioning User Service solution, rotating surveyed points (if needed), and straightening of cross sections before data input to the model; (3) modifications of original (at-site) channel-roughness subdivisions based on subarea ratio tests (Davidian, 1984); and (4) use of vertical variations in Manning’s n-values. Hydraulic structures, such as weirs and bridges, were surveyed and included in the models where necessary. Additional cross sections were generated using geographic information system (GIS) tools and lidar data when needed to improve model diagnostics and model accuracy.
CSA Method for Indirect Determination of Peak Streamflow and Theoretical Stage-Streamflow Relations
The CSA method is an extension of the conventional slope-area method used for indirect determination of streamflow over a complete hydrograph (Smith and others, 2010). The CSA method has been used extensively by the USGS in Arizona for indirect measurement of streamflows on ephemeral streams (Stewart and others, 2012). Because the CSA method computes streamflows that vary with time over the flood hydrograph, steady-flow assumptions of the conventional slope-area method introduce some error in computed velocities (Wiele and others, 2015); however, other studies assert that these errors become less significant in reaches with steeper slopes (Smith and others, 2010).
Unlike the conventional slope-area method, which determines the water-surface slope from profiles defined by numerous HWMs associated with a flood peak, the CSA method determines water-surface slopes by using a time series of gage-height data recorded at three or more fixed cross-section locations during a streamflow event. Gage-height data are collected using continuously recording pressure transducers (PTs) installed at preselected cross-section locations along the study reach (Wiele and others, 2015).
CSA streamflow computations are made using the CSA2SAC program (Wiele, 2015), an automated algorithm developed by the USGS in Arizona that runs the SAC computer program (Fulford, 1994) during each interval of the recorded gage-height time series. The final product is a complete stage-streamflow hydrograph composed of the series of individual SAC output files.
Results
Results of studies conducted by the USGS to characterize Hurricane Maria flooding and subsequent rainfall events in 2017 are documented in this section of the report. Specifically, the following study results are provided:
-
Indirect measurements made to characterize peak streamflows caused by Hurricane Maria and subsequent flooding in 2017.
-
Post-hurricane stage-streamflow relations and Hurricane Maria peak streamflows determined using SBA methods for selected sites in the USGS streamgage network.
-
Post-hurricane stage-streamflow relations developed using CSA methods for selected sites in the USGS streamgage network.
-
Peak gage heights, streamflows and annual exceedance probabilities for Hurricane Maria flooding of September 20–22, 2017.
-
Comparison of flooding caused by Hurricane Maria and past hurricanes in Puerto Rico.
-
A maximum peak streamflow envelope curve for Puerto Rico.
Indirect Measurements of Peak Streamflows Caused by Hurricane Maria and Subsequent Flooding in 2017
Because of ongoing emergency response activities and the extensive island-wide damage caused by Hurricane Maria, USGS field crews were unable to begin collecting flood HWM information until the middle of October 2017, nearly 4 weeks after passage of the hurricane. Moderate to heavy rainfall continued in many areas during and after this 4-week period, causing additional flooding—with some post-Hurricane Maria flood peaks exceeding those caused by the hurricane itself—and degrading or washing away much of the HWM evidence of interest. As a result, HWMs generally were of poor quality and subject to large uncertainty in terms of determining which HWMs were associated with each flood event.
Figure 6A, B shows the locations of 20 sites for which indirect measurements were surveyed, computed, and published, and 4 sites for which planned indirect measurements either were not surveyed or were later rejected; site locations are shown relative to the geographic regions of the island (fig. 6A) and to the watersheds of Puerto Rico (fig. 6B). Tables 2 and 3 summarize peak streamflow information, physiography, and hydraulic characteristics for the 20 published indirect measurements. Surveyed cross-section and HWM data (horizontal coordinates, elevations, and survey coordinate system) for each study site are available in a USGS data release (Gómez-Fragoso and Smith, 2022). Appendix 2 documents the implementation of indirect-measurement methods after the hurricane and provides detailed site and computational information for selected indirect measurements of peak streamflow resulting from Hurricane Maria and subsequent flooding in 2017.
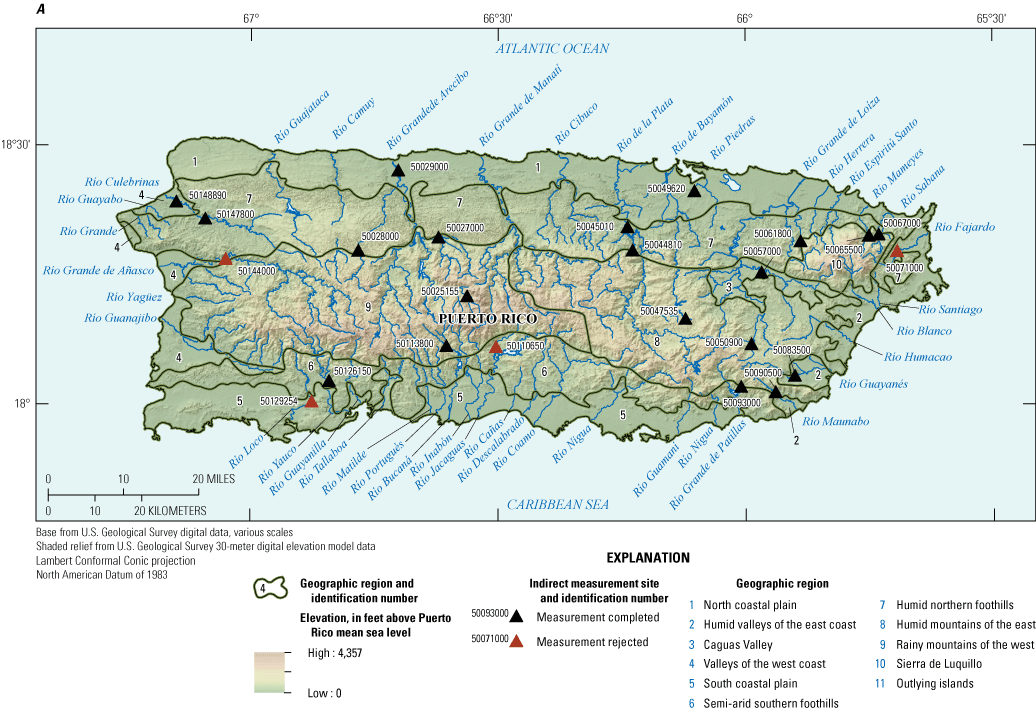
Streamgage locations targeted for indirect measurement of peak streamflow to characterize flooding from September 20 to November 18, 2017, with A, geographic region boundaries modified from Gómez-Gómez and others (2014) shown for reference and, B, watersheds of Puerto Rico and associated 10-digit hydrologic unit codes shown for reference.
Table 2.
Station information, drainage area, peak gage height, peak streamflow and uncertainty, drainage area, date of peak streamflow, and geographic region code for sites at which indirect measurements were made.[Peak streamflow computed by indirect measurement may differ slightly from peak streamflow published in the U.S. Geological Survey (USGS) National Water Information System web interface (NWISWeb; USGS, 2021a), depending on measurement uncertainty and quality of the stage-streamflow rating curve. mi2, square mile; ft, foot; ft3/s, cubic foot per second; ±, plus or minus; %, percent; mm/dd/yyyy, month, day, year; nr, near; PR, Puerto Rico; iRIC, International River Interface Cooperative SToRM, System for Transport and River Modeling; abv, above; blw, below; hwy, highway; Qda., quebrada; Inter, meaning not known]
| Station number |
Station name | Drainage area1 (mi2) |
Peak gage height (ft) |
Peak streamflow (ft3/s) (uncertainty, ± %) |
Date of peak streamflow (mm/dd/yyyy) |
Geographic region code (fig. 6A) |
Hydrologic unit code (fig. 6B) |
Type of indirect measurement and remarks |
|---|---|---|---|---|---|---|---|---|
| 50025155 | Rio Saliente at Coabey nr Jayuya, PR | 8.86 | 13.72 | 14,800 (20) | 9/20/2017 | 9 | 2101000204 | Slope-area (4 sections) |
| 50027000 | Rio Limon abv Lago Dos Bocas, PR | 31.5 | 23.93 | 20,000 (> 25) | 9/20/2017 | 9 | 2101000204 | Slope-area (3 sections) |
| 50028000 | Rio Tanama nr Utuado, PR | 18.0 | 18.42 | 18,000 (> 25) | 9/20/2017 | 7 | 2101000204 | Width contraction (bridge) |
| 50029000 | Rio Grande de Arecibo at Central Cambalache, PR | 200 | 20.35 | 187,000 (> 25) | 9/20/2017 | 1 | 2101000204 | Two-dimensional model (iRIC SToRM) |
| 50044810 | Rio Guadiana nr Guadiana, Naranjito PR | 8.11 | 17.68 | 12,000 (> 25) | 9/20/2017 | 7 | 2101000507 | Slope-area (3 sections) |
| 50045010 | Rio de La Plata blw La Plata Damsite, PR | 2173 | 44.63 | 180,000 (20) | 9/20/2017 | 7 | 2101000507 | Slope-area (4 sections); flow regulated by dam |
| 50047535 | Rio de Bayamon at Arenas, PR | 0.42 | 7.02 | 690 (> 25) | 9/22/2017 | 8 | 2101000506 | Slope-area (4 sections); a smaller peak occurred 9/20/2017 (gage height 6.39 ft, streamflow 502 ft3/s) |
| 50049620 | Qda. Margarita at Caparra Inter. nr Guaynabo, PR | 2.39 | 13.50 | 3,020 (> 25) | 11/18/2017 | 1 | 2101000505 | Slope-area (4 sections) |
| 50050900 | Rio Grande de Loiza at Quebrada Arenas, PR | 6.02 | 11.97 | 4,340 (> 25) | 10/5/2017 | 8 | 2101000504 | Slope-area (3 sections) |
| 50057000 | Rio Gurabo at Gurabo, PR | 60.0 | 31.96 | 86,0003 (> 50) | 9/20/2017 | 3 | 2101000504 | Combination width contraction (bridge) and road overflow (right4) |
| 50061800 | Rio Canovanas nr Campo Rico, PR | 10.2 | 17.33 | 15,500 (15) | 9/20/2017 | 7 | 2101000504 | Slope-area (3 sections) |
| 50065500 | Rio Mamayes nr Sabana, PR | 6.77 | 9.59 | 9,480 (> 25) | 10/15/2017 | 10 | 2101000503 | Slope-area (6 sections) |
| 50067000 | Rio Sabana at Sabana, PR | 3.89 | 17.54 | 6,250 (15) | 10/15/2017 | 10 | 2101000503 | Slope-area (4 sections) |
| 50083500 | Rio Guayanes nr Yabucoa, PR | 16.4 | 24.79 | 5,300 (> 25) | 9/20/2017 | 2 | 2101000501 | Combination width contraction (bridge) and road overflow (left3) |
| 50090500 | Rio Maunabo at Lizas, PR | 5.30 | 11.86 | 4,640 (> 25) | 9/20/2017 | 8 | 2101000501 | Slope-area (4 sections) |
| 50093000 | Rio Marin nr Patillas, PR | 4.09 | 15.32 | 4,300 (15) | 10/15/2017 | 6 | 2101000405 | Slope-area (4 sections) |
| 50113800 | Rio Cerrillos abv Lago Cerrillos nr Ponce, PR | 11.9 | 15.55 | 16,800 (> 25) | 9/20/2017 | 9 | 2101000403 | Slope-area (4 sections) |
| 50126150 | Rio Yauco abv Diversion Monserrate nr Yauco, PR | 32.1 | 16.93 | 26,500 (20) | 9/20/2017 | 6 | 2101000402 | Slope-area (3 sections); gage height estimated |
| 50147800 | Rio Culebrinas at Hwy 404 nr Moca, PR | 70.6 | 43.16 | 54,100 (15) | 9/20/2017 | 7 | 2101000301 | Slope-area (4 sections) |
| 50148890 | Rio Culebrinas at Margarita Damsite nr Aguada, PR | 93.9 | 21.99 | 74,0003 (> 50) | 9/20/2017 | 4 | 2101000301 | Combination width contraction (bridge), culverts and road overflow (left and right4) |
Drainage areas listed in this table may differ within 2 percent or less from those published on the USGS National Water Information System web interface (NWISWeb; USGS, 2021a), according to drainage-area revision criteria published by the USGS (2012a).
Table 3.
Peak streamflow and uncertainty, and hydraulic characteristics of study reaches where indirect measurements were made.[ft3/s, cubic foot per second; %, percent; ±, plus or minus; ft, foot; ft/s, foot per second; ft/ft, foot per foot; nr, near; PR, Puerto Rico; abv, above; >, equal to or greater than; blw, below; hwy, highway; approx., approximately; N/A, not applicable; Inter, meaning not known]
The estimated uncertainty of each computed peak streamflow is shown in tables 2 and 3. As noted previously, deteriorated HWM evidence and multiple flood peaks were among the largest sources of uncertainty for indirect measurements made after the passage of Hurricane Maria. HWMs at many sites were scarce or exhibited large variability in surveyed elevations, making profile interpretation difficult. When multiple peaks occurred during Hurricane Maria flooding and subsequent flooding into October, HWMs recovered by USGS field crews in October potentially reflected a mix of different flood events.
Despite substantial uncertainties associated with indirect measurements made to characterize Hurricane Maria flooding, the measurements generally were judged to be more reliable than estimates made using SBA methods, because they incorporate observed HWM information and water-surface profiles at the time of the flood peak. As such, the indirect measurements were used as calibration data for SBAs made at corresponding streamgages.
The four sites listed below and shown in figure 6A, B were targeted for indirect measurement but ultimately were rejected because of unfavorable site conditions or computational issues; peak streamflows for these sites were estimated from SBAs:
Stage-Streamflow Relations Developed Using SBA and CSA Methods
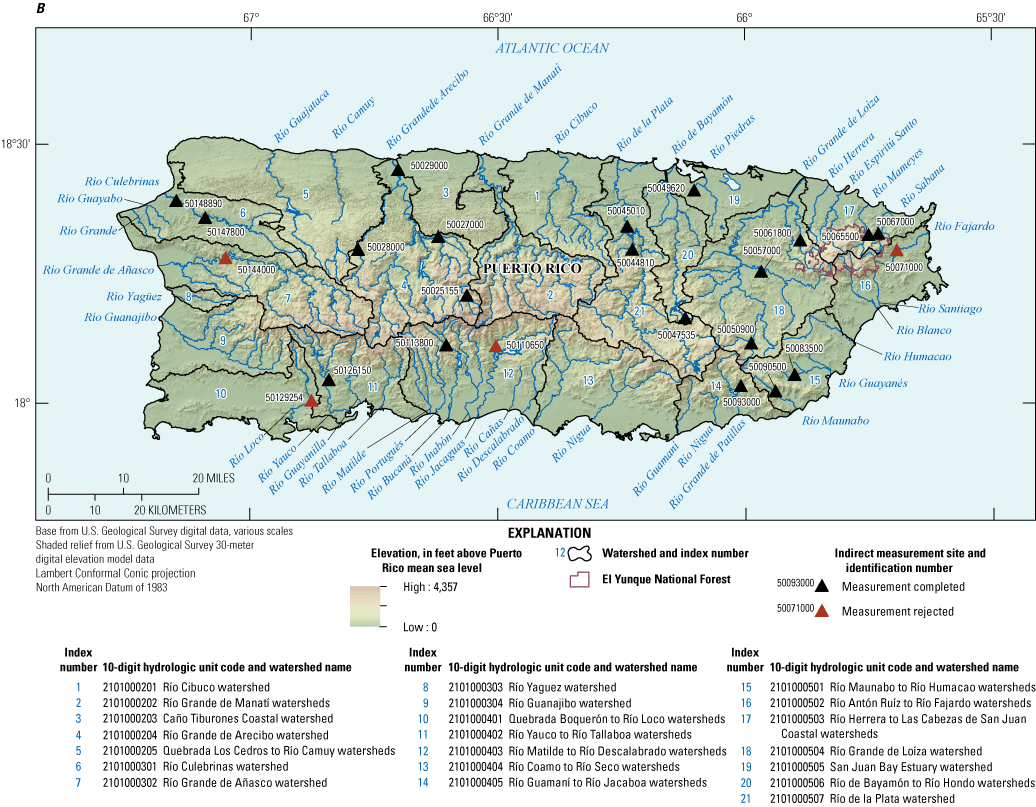
Table 4 summarizes selected reach and hydraulic-modeling characteristics of sites where step-backwater field surveys were conducted for use in developing new stage-streamflow relations. Figure 7A, B shows the locations of the 58 surveyed SBA sites and identifies the sites at which both indirect measurements and SBAs were conducted in 2017 and 2018; site locations are shown relative to the geographic regions of the island (fig. 7A) and to the watersheds of Puerto Rico (fig. 7B).
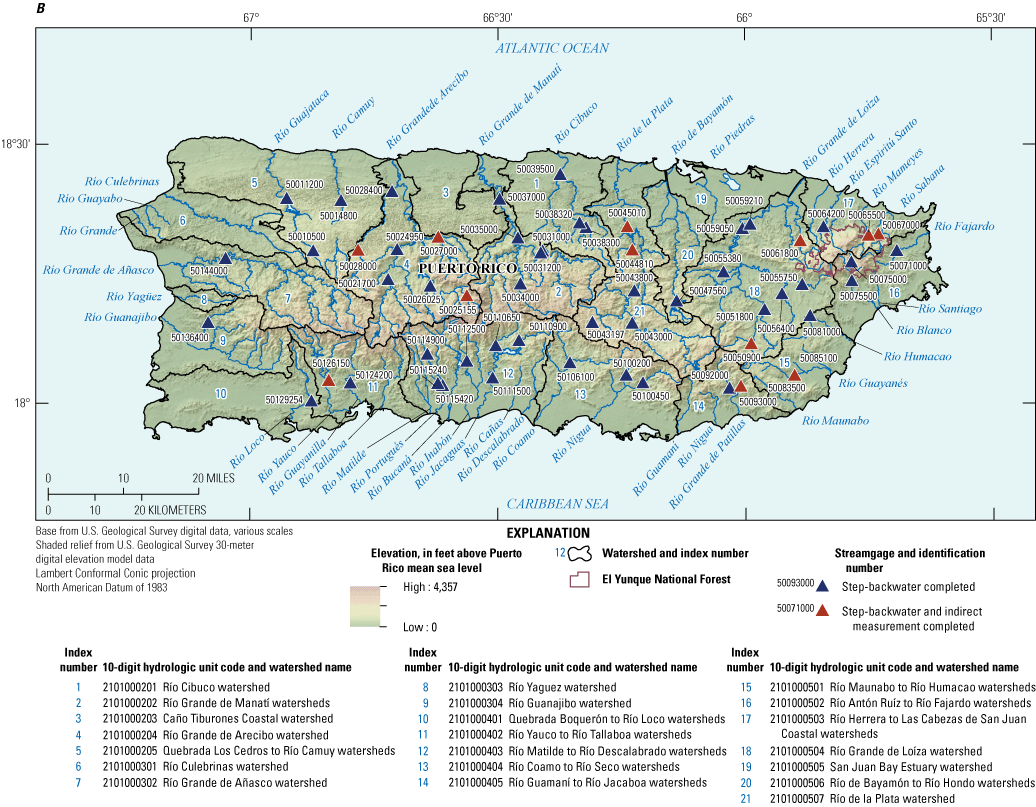
Streamgage locations where step-backwater studies were conducted from March to July 2018, with A, geographic region boundaries modified from Gómez-Gómez and others (2014) shown for reference and, B, watersheds of Puerto Rico and associated 10-digit hydrologic unit codes shown for reference.
Table 4.
A summary of selected reach and hydraulic modeling characteristics for U.S. Geological Survey streamgage sites where step-backwater analyses were conducted in the aftermath of Hurricane Maria.[ft, foot; lidar, light detection and ranging; ft/ft, foot per foot; PR, Puerto Rico; blw, below; nr, near; abv, above; hwy, highway; --, step-backwater analysis not completed; N/A, not applicable because a composite Manning’s n-value was used]
Step-backwater site removed from the candidate site list; an indirect measurement was made using surveyed data.
Study reach has a hydraulic structure, but it was not modeled in the Hydrologic Engineering Center’s River Analysis System (HEC–RAS).
Table 4 indicates which sites required cross-section extension using lidar data. Cross-sectional data for each site listed in table 4 are available as a USGS data release (Gómez-Fragoso and Smith, 2022). Roughness conditions varied widely for streams in the Puerto Rico streamgage network, resulting in assigned Manning’s n-values ranging from 0.020 to 0.120 in the main channel and from 0.024 to 0.210 in the overbank (floodplain) areas (table 4).
Assigned energy-loss coefficients varied for each model, with initial values set to the USGS recommended coefficients and HEC–RAS modeling guidelines for contraction (kc) and expansion (ke). As part of the model-calibration process, some of the initial energy-loss coefficients were adjusted to smooth section-to-section conveyance ratios or to ensure computed water-surface elevations were increasing in the upstream direction. Table 4 shows the range of energy-loss coefficients used for each study reach and the slope used for normal depth calculations. Normal depth was used as the starting water-surface elevation at the modeled cross section furthest downstream, and the slope used for normal depth calculations usually was the thalweg slope of the reach segment furthest downstream; for very low gradient study reaches, however, the slope used for normal depth calculations was based on a reach segment further upstream.
Available post-Hurricane Maria direct and indirect streamflow measurements (that is, those associated with Hurricane Maria or other large flood events that occurred through November 2017) were used to calibrate each model whenever possible (table 5). Historical high-streamflow measurements also were used for model verification at streamgage sites having no recent measurements or having a limited range in magnitude of measured streamflows. In some cases, model results were favorable compared to available streamflow measurements; however, in other cases, modeled water-surface elevations could not be calibrated within a feasible range of modeling parameters to match water-surface elevations associated with the streamflow measurements. For those sites where calibration could not be achieved by making physically reasonable adjustments to the model, future direct and indirect measurements will be used to verify or revise the existing SBA. Estimates of Hurricane Maria peak streamflows were made at 39 streamgage sites using SBA modeling and available peak-stage information. Most estimates were considered poor (rated uncertainty of ±25 percent or greater) unless an indirect measurement could be used to calibrate the model. Each SBA model and computed Hurricane Maria peak streamflow was reviewed and approved according to USGS data-processing standards.
Table 5.
Summary of streamflow measurements used for calibration of step-backwater analyses (SBAs) conducted in 2018.[mm/dd/yyyy, month, day, year; HWM, high-water mark; ft, foot; PR, Puerto Rico; blw, below; abv, above; nr, near; hwy, highway; --, model calibration/verification is not based on specific measurements]
Appendix 3 documents the implementation of SBA methods in 2018 and provides details of SBAs conducted at 4 sites, including a description of reach characteristics, model results, and comparison of the pre-Hurricane Maria stage-streamflow relation with the post-Hurricane Maria stage-streamflow relation (developed based on SBA).
CSA methods were implemented in 2018 at USGS streamgages 50044810 Río Guadiana near Guadiana and 50093000 Río Marín near Patillas. At the time of this report, no CSA analyses of peak streamflows were available for streamgage 50044810 Río Guadiana near Guadiana. CSA analyses were conducted for 18 peak streamflows observed at streamgage 50093000 Río Marín near Patillas, for use in the development of a new stage-streamflow relation. All events occurred in the 2018 water year, and computed peak streamflows varied from 963 cubic feet per second (ft3/s) (elevation of 10.10 ft above gage datum) to 2,250 ft3/s (elevation of 12.47 ft above gage datum). The computations were rated as poor (uncertainty of ±25 percent or greater) because of large uncertainties associated with the measurements (for example, no observed HWMs for verification of sensor readings and substantial scatter of 2-section computations versus the accepted, 4-section computation of peak streamflow). Appendix 4 documents the implementation of CSA methods at both pilot sites and provides a detailed discussion of peak-streamflow computations for CSA measurements made at streamgage 50093000 Río Marín near Patillas.
Peak Gage Heights, Peak Streamflows, and Annual Exceedance Probabilities for Hurricane Maria Flooding, September 20-22, 2017
USGS personnel computed peak streamflows for flood events across the island of Puerto Rico from (1) indirect measurements associated with Hurricane Maria flooding, (2) step-backwater studies conducted in 2018 to characterize Hurricane Maria and post-hurricane stage-streamflow relations, and (3) existing stage-streamflow rating curves that provided valid streamflow data for Hurricane Maria flooding. Table 6 summarizes peak gage heights, peak streamflows, periods of record (PORs), number of annual peak streamflows used for analysis,4 and period of comparable-record ranks (series of annual-maximum peak streamflows) for flooding that occurred September 20–22, 2017, at 73 streamgages in Puerto Rico. The table includes unregulated, regulated, and urbanized sites; regulated and urbanized sites are identified in the “Remarks” column. Hurricane Maria peak streamflows at four sites were exceeded by different flood events during the 2017 water year and therefore are not ranked in the series of annual-maximum peak streamflows (shown as “NR” in table 6).
Table 6.
Station information, period of record, number of peak streamflows used, peak gage height and streamflow, and period of comparable-record ranks for Hurricane Maria flooding at selected U.S. Geological Survey streamgages, September 20–22, 2017.[mm/dd/yyyy, month, day, year; ft, foot; ft3/s, cubic foot per second; abv, above; PR, Puerto Rico; nr, near; blw, below; Hwy, Highway; Qda., Quebrada; Inter., meaning not known; NR, not ranked; POR, period of record; Bo., Barrio]
Period of record reflects water years for which peak streamflow values are published. A water year is defined as the 12-month period from October 1 to September 30 and is designated by the calendar year in which it ends.
The stated number of peak streamflows used may not coincide with period of record, as indicated for specific sites.
The number of years of annual peak streamflows ranges from 4 to 69 (table 6), with a median of 30 years. Hurricane Maria peak streamflows ranked highest for the POR at 28 sites (38.4 percent), second highest for the POR at 17 sites (23.3 percent), and third highest for the POR at 9 sites (12.3 percent). For the remaining 19 sites, Hurricane Maria peak streamflows either ranked from 4th to 20th or were not ranked.
Figure 8A, B shows the spatial distribution (island-wide and within each geographic region and watershed, respectively) of sites in each of the four ranking categories of highest, second highest, third highest, and 4th–20th highest or not ranked. POR peaks ranked highest and second highest occurred throughout the island, consistent with Hurricane Maria’s trajectory across the entire island from southeast to northwest. However, it is apparent from figure 8A, B that peaks ranked third highest and smaller occurred mainly in the eastern and southern parts of the island. Although several factors (watershed characteristics, station periods of record, regional physiography, and long-term precipitation, or the meteorological dynamics of the hurricane itself) might have influenced the spatial distribution of lower-ranked peak streamflows, investigation of those factors is beyond the scope of this report.
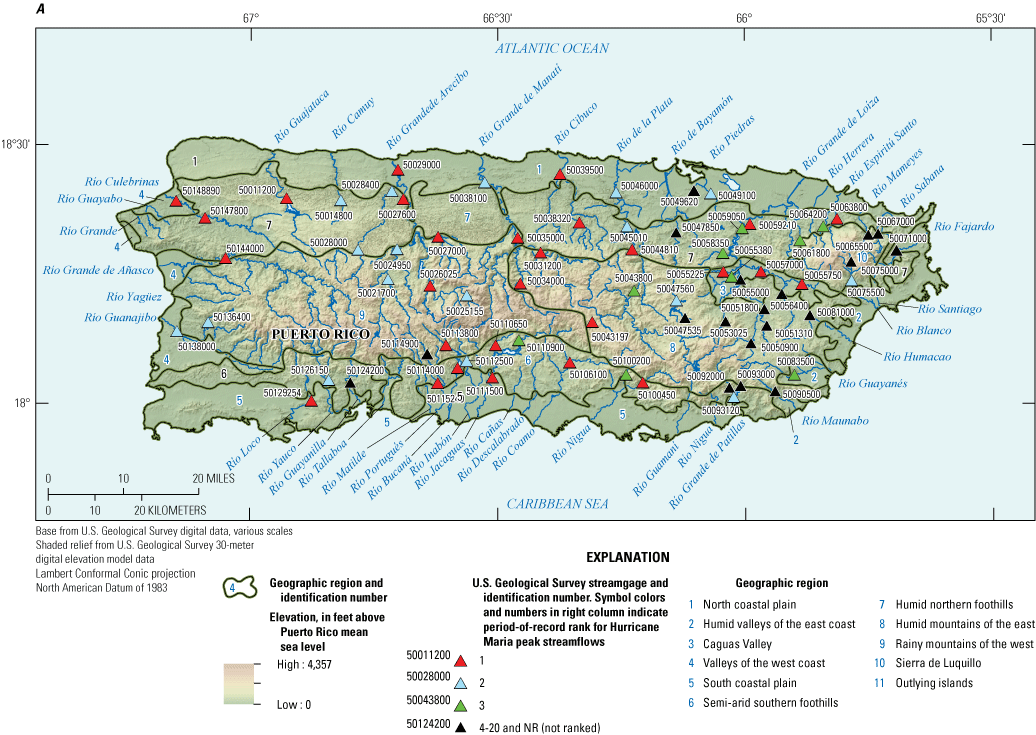
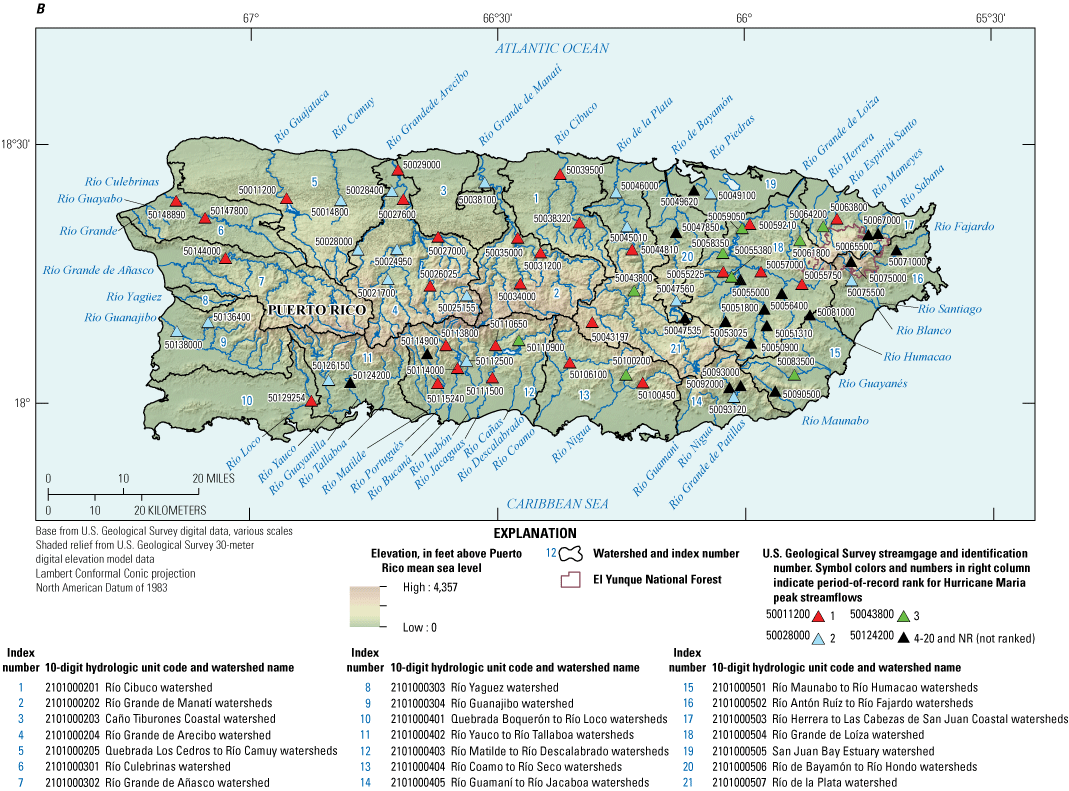
Locations of 73 streamgages where the Hurricane Maria peak streamflow also was the 2017 annual peak streamflow, with, A, the distribution of peak rankings (surrogate for peak magnitudes) shown relative to the geographic region boundaries (modified from Gómez-Gómez and others, 2014) and, B, the distribution of peak rankings (surrogate for peak magnitudes) shown relative to the watersheds of Puerto Rico and associated 10-digit hydrologic unit codes. The geographic region code for each streamgage shown is listed in appendix 1.
Fifty-eight of the 73 streamgages in table 6 have PORs with 20 or more published annual peaks. Because several large historical floods occurred in the 1990s (specifically related to Hurricane Hortense in 1996 and Hurricane Georges in 1998) and earlier, an evaluation of Hurricane Maria peak streamflow ranking for streamgages with at least 20 annual peak streamflows5 provides some historical context. For this subset of 58 sites, 19 (32.8 percent) Hurricane Maria peaks were the highest, 14 (24.1 percent) were the second highest, and 8 (13.8 percent) were the third highest for their respective PORs.
Ryan and others (2021) documented updated flood-frequency analyses and new regional equations for Puerto Rico, including peak-streamflow data through the 2017 water year. The magnitude of an observed peak streamflow relative to the series of annual-maximum peak streamflows for a given site is characterized statistically in terms of the following concepts:
-
Annual exceedance probability (AEP) is the probability (expressed as a percentage) that flooding of a given magnitude will occur in any given year considering the full range of possible annual floods (England and others, 2018).
-
Recurrence interval, also referred to as “return period,” is the average time (usually expressed in years) between occurrences of hydrologic events of a specified type, such as exceedances of a specified high streamflow. As used in this report, the recurrence interval is the inverse of the AEP, expressed in years (USGS, 2020b).
-
Confidence intervals characterize the uncertainty of the AEP estimate in terms of an upper and lower range of the exceedance probability, at a specified-percent confidence level. Uncertainty of the AEP estimates in this report is characterized at the 66.7-percent confidence level (USGS, 2012b).
-
Flood quantiles and associated 95-percent confidence intervals for selected AEPs (for example, 10, 1, and 0.2 percent) provide additional information about the uncertainty associated with computed AEPs for the observed peak streamflows of September 20–22, 2017. This information was computed by Ryan and others (2021) as part of the updated flood-frequency study for Puerto Rico.
AEP estimates (developed using the new flood-frequency analyses and regional equations for Puerto Rico), corresponding recurrence intervals, and associated confidence intervals for 53 unregulated Hurricane Maria peak streamflows that met computational criteria for flood-frequency and AEP analysis are provided in appendix 5. Specific computational criteria were the following:
-
Peak streamflows were not affected by regulation or by urbanization (defined as more than 10 percent impervious area in the watershed).
-
Peak streamflows were not affected by karst.
Estimates were determined using computational procedures documented in USGS Office of Surface Water Technical Memorandum 2013.01 (USGS, 2012b) and England and others (2018); source data for the computations are documented in the report by Ryan and others (2021) and are incorporated into the USGS Web application StreamStats (Ries and others, 2017; https://streamstats.usgs.gov/ss/)
AEPs for the 53 unregulated peak streamflows listed in appendix 5 are summarized by range of exceedance probability in figure 9; they ranged from greater than 50.0 percent (recurrence interval of less than 2 years) to 0.3 percent (recurrence interval of 333 years), with the majority (28 of 53) in the range of 10.0–2.1 percent (recurrence interval of 10–48 years).
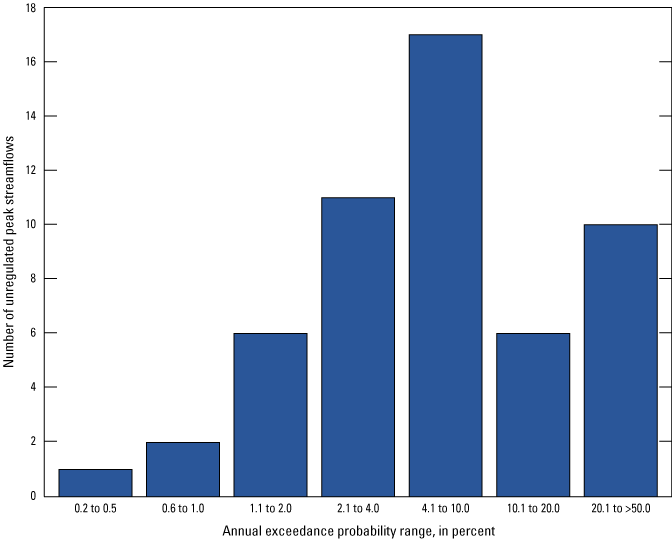
Number of unregulated peak streamflows in Puerto Rico within indicated annual exceedance probability ranges, flooding of September 20–22, 2017.
Hurricane Maria peak streamflows at 16 sites were subject to undetermined effects of regulation from upstream dams; Hurricane Maria peak streamflows at two sites were affected by watershed urbanization (see remarks in table 6). AEP estimates can be computed for both regulated and urbanized sites (USGS, 2012b; England and others, 2018), but the computational process for regulated sites requires (1) evaluation of dam operational protocols over the entire regulated period of record and (2) detailed analysis of peak streamflows generated by flow releases to determine whether or how reservoir storage affected the flood hydrograph. Such analyses were beyond the scope of this study. Historical annual peak streamflows for regulated and urbanized sites in Puerto Rico are publicly available from NWISWeb (USGS, 2021a) for use by readers interested in conducting site-specific AEP analyses.
Comparison of Flooding Caused by Hurricane Maria and Past Hurricanes in Puerto Rico
Hurricane San Ciriaco (1899) is the earliest hurricane for which USGS peak streamflow information in Puerto Rico is available. Table 7 summarizes the chronology, storm category, trajectory, and rainfall totals of the six major (category 3, 4, or 5) hurricanes that directly impacted Puerto Rico between 1899 and 2017. Table 7 also includes Hurricane Hortense (1996), which directly impacted Puerto Rico as a category 1 storm. Although it was not a major hurricane when it passed over Puerto Rico, this storm did cause extensive flooding and either record or near-record historical flood peaks at several USGS streamgage.
Table 7.
Chronology, storm category, trajectory, and rainfall totals for major and selected minor hurricanes that directly impacted the Island of Puerto Rico between 1899 and 2017.[mm/dd/yyyy, month, day, year; in., inch]
| Hurricane | Date of landfall (mm/dd/yyyy) |
Hurricane category at landfall | General trajectory1 | Maximum rainfall and period observed | Information Source | Remarks |
|---|---|---|---|---|---|---|
| San Ciriaco | 08/08/1899 | 4 | Southeast to northwest across entire island | 23 in. over 24 hours | Hartwell (1932), and Schwartz (1992), Landsea and others (2012) | Rainfall data uncertain because of extensive damage to precipitation gages. More than 3,000 fatalities were attributed to the storm. |
| San Felipe II | 09/13/1928 | 5 | Southeast to northwest across entire island | 29 in. over 24 or more hours | Fassig (1928), and Hartwell (1932), Landsea and others (2012) | Rainfall data uncertain because of extensive damage to precipitation gages. 300 fatalities were attributed to the storm; number of deaths reportedly was mitigated significantly by island-wide radio alert-warning and telegraph systems. |
| San Ciprián | 09/27/1932 | 4 | East to west across entire island | 16.7 in. over unspecified period | Hartwell (1932), Landsea and others (2012) | Rainfall data uncertain because of extensive damage to precipitation gages. 225 fatalities were attributed to the storm. |
| Hugo | 09/18/1989 | 3 | Southeast to northwest across northeast corner of island | 13.25 in. over 48 hours | National Research Council (1994) | Hurricane Hugo was category 3 at the time of landfall on Puerto Rico's northeast coast (Hugo was category 4 over the Isla de Vieques). Two fatalities were attributed to the storm. |
| Hortense | 09/10/1996 | 1 | Southeast to northwest across southwest corner of island | Up to 23.99 in. over 24 hours | Torres-Sierra (1997) | At least 18 fatalities were attributed to the storm. |
| Georges | 09/21/1998 | 3 | East to west across entire island | 24.62 in. over 48 hours | Bennett and Mojica (1999) | Prior to Hurricane Maria in 2017, Hurricane Georges was classified as the most destructive hurricane to impact Puerto Rico since San Ciprián in 1932. However, no fatalities were attributed to the storm. |
| Maria | 09/20/2017 | 4 | Southeast to northwest across entire island | Up to 30.01 in. over 48 hours | Pasch and others (2019) | Hurricane Maria was the strongest hurricane to make landfall in Puerto Rico since San Felipe II in 1928. Fatality estimates range from 2,975 and 4,645. |
Detailed trajectory information is provided in references cited in this table and is available graphically from the National Oceanic and Atmospheric Administration (NOAA, 2020).
Although the effects of Hurricane Irma were overshadowed by those of Hurricane Maria, Hurricane Irma indirectly affected Puerto Rico just 2 weeks earlier (September 6–7, 2017) when it passed 50 nautical miles to the north of the island. As a category 5 storm, Hurricane Irma produced 10–15 in. of rainfall in parts of Puerto Rico and 2017 water-year peak streamflows that exceeded those caused by Hurricane Maria at a few USGS streamgages.
Largest Three Historical Flood Events Based on Period-of-Record USGS Streamflow Data
Table 8 summarizes POR ranks 1, 2, and 3 for 58 streamgage sites with at least 20 years of annual peak streamflows. Inspection of the years in which annual peak streamflows ranked 1, 2, and 3 occurred at each streamgage provides a framework to compare the magnitude of Hurricane Maria flooding with past large floods.
Table 8.
Compilation of water years in which rank 1, 2, and 3 period-of-record streamflows occurred at 58 streamgage sites in Puerto Rico with at least 20 years of annual peak-streamflow record.[blw, below; PR, Puerto Rico; nr, near; abv, above; Hwy, Highway; ft3/s, cubic foot per second]
Period of record reflects water years for which annual peak streamflow values are published. A water year is defined as the 12-month period from October 1 to September 30 and is designated by the calendar year in which it ends.
Water-year counts for ranks 1, 2, and 3 show, for the POR available,6 that Hurricane Maria peak streamflows during September 20–22, 2017, Hurricane Georges peak streamflows during September 21–22, 1998, and Hurricane Hortense peak streamflows during September 10, 1996, compose the majority of the top three rank categories (91 of 174 values, or 52.3 percent).7 Figure 10 shows the POR rank 1–3 occurrences for the three flood events. Hurricane Maria flooding generally exceeded that of both Hurricane Georges and Hurricane Hortense in terms of POR rank 1–3 occurrences (the only exception is rank 3, for which the number of Hurricane Maria and Hurricane Hortense occurrences is equal).
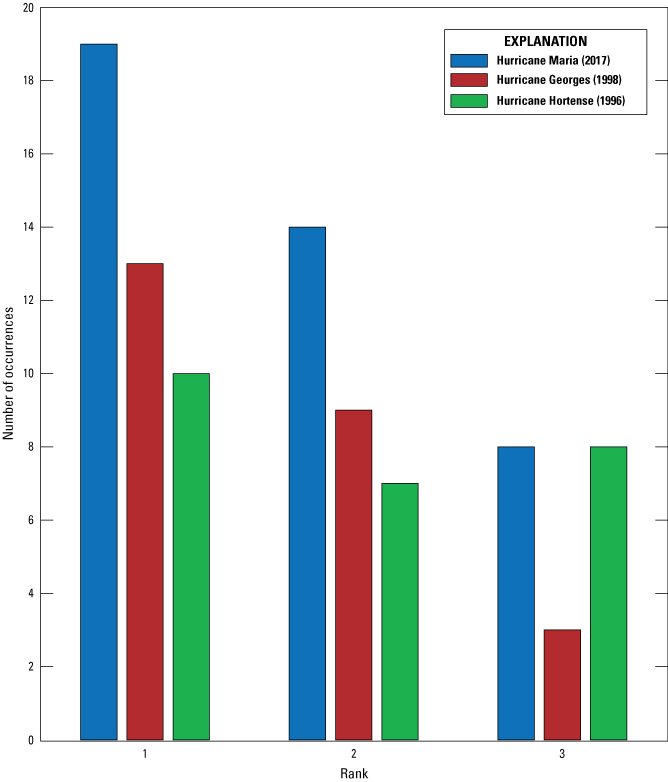
Comparison by rank of the three largest historical flood events in Puerto Rico, based on historical U.S. Geological Survey peak streamflow data from sites with a period of record of at least 20 years.
Results of this comparative analysis are limited by the relatively short PORs available for the 58 streamgages listed in table 8. Of the 58 sites, 33 have annual peak streamflows prior to 1980, but only 7 have annual peak streamflows prior to 1960. Of the seven sites with annual peak streamflows prior to 1960, three have published peak streamflows for the major hurricanes of 1899, 1928, or 1932:
-
Station 50029000 Río Grande de Arecibo at Central Cambalache, Puerto Rico (regulated 1955–2017) has published peak streamflows for Hurricane San Ciriaco in 1899 (195,000 ft3/s), Hurricane San Felipe II in 1928 (105,000 ft3/s), and Hurricane Maria in 2017 (187,000 ft3/s). Undetermined effects of regulation on the Hurricane Maria peak streamflow may preclude direct comparison with those in 1899 and 1928.
-
Station 50038100 Río Grande de Manatí at Highway 2 near Manatí, Puerto Rico (no regulation) has published peak streamflows for Hurricane San Felipe II in 1928 (148,000 ft3/s), Hurricane San Ciprián in 1932 (134,000 ft3/s), and Hurricane Maria in 2017 (167,000 ft3/s).
-
Station 50046000 Río de La Plata at Highway 2 near Toa Alta, Puerto Rico (regulated 1974–2017) has published peak streamflows for Hurricane San Ciriaco in 1899 (157,000 ft3/s), Hurricane San Felipe II in 1928 (120,000 ft3/s), and Hurricane Maria in 2017 (150,000 ft3/s). Undetermined effects of regulation on the Hurricane Maria peak streamflow may preclude direct comparison with those in 1899 and 1928.
Comparison of available historical peak streamflows is evidence that Hurricane Maria flooding was the largest in recent Puerto Rico history, likely since the 1960s. However, the hydrologic significance of Hurricane Maria flooding relative to extreme floods that occurred prior to the 1960s cannot be assessed effectively because of the general lack of historical peak-streamflow information for those floods.
Maximum Peak Streamflow Envelope Curve for Puerto Rico
Crippen and Bue (1977) developed maximum peak streamflow envelope curves for the conterminous United States; the curves are grouped and delineated by regions, generally based on physiography and variations in rainfall intensity. These envelope curves were derived using maximum observed peak streamflows from a selected set of streamgages across the country. Crippen and Bue (1977) limited their study to extreme floods (maximum observed peak streamflows), without reference to their frequency of occurrence. Envelope curves, constructed using graphs of site drainage area versus maximum observed peak streamflow, thereby provide reasonable upper limits for estimates of maximum floods in each region. Observed peak streamflows also can be normalized by site drainage area to provide a numerical means of comparing peak streamflows for sites with different drainage areas. Unit-peak streamflow is defined as peak streamflow divided by site drainage area.
Puerto Rico was not included in the report by Crippen and Bue (1977); however, data compiled as part of this study provided the opportunity to construct an envelope curve for Puerto Rico. Following the methodology described by Crippen and Bue (1977), maximum observed peak streamflows for 119 active streamgages, 56 inactive streamgages, and 6 miscellaneous sites in Puerto Rico (all unaffected by regulation, urbanization, or karst) were available for analysis; drainage areas ranged from 0.25 to 208 mi2 (appendix 6). Sites with drainage areas less than 0.2 mi2 were excluded from the analysis because, as noted by Crippen and Bue (1977), streamflow patterns for such small basins can be dominated by unique conditions not likely to be recognized in larger basins.
Site drainage area versus maximum peak streamflow is plotted for all 181 unregulated sites with one or more years of published peak streamflows in figure 11. The envelope curve, fitted visually, represents an approximate upper limit for peak streamflows in Puerto Rico as a function of their respective drainage areas. Inspection of the envelope curve indicates that Hurricane Maria peak streamflows reflect a smaller range of drainage areas (4.73–134 mi2) than that for the entire dataset (0.25–208 mi2). It is notable that most Hurricane Maria peak streamflows lie below the envelope curve defined by all observed maximum peak streamflows. Only the Hurricane Maria peak streamflow for station 50035000 Río Grande de Manatí at Ciales, Puerto Rico provides definition for the curve, at its uppermost end. (The remarks in appendix 6 identify peak streamflows that define various parts of the curve.) This finding may appear to contradict results of the comparison of Hurricane Maria flooding to past hurricanes in Puerto Rico, presented in the previous section. However, that analysis was conducted on POR ranks of peak streamflows for streamgages having 20 or more years of record, and without consideration of site drainage area. In contrast, the envelope-curve analysis has no requirement for long-term continuity of streamgage operation, as reflected by the inclusion of all streamgages in figure 11 that have one or more years of peak-streamflow data. Moreover, the envelope-curve analysis effectively normalizes the observed POR maximum peak streamflows based on their respective drainage areas.
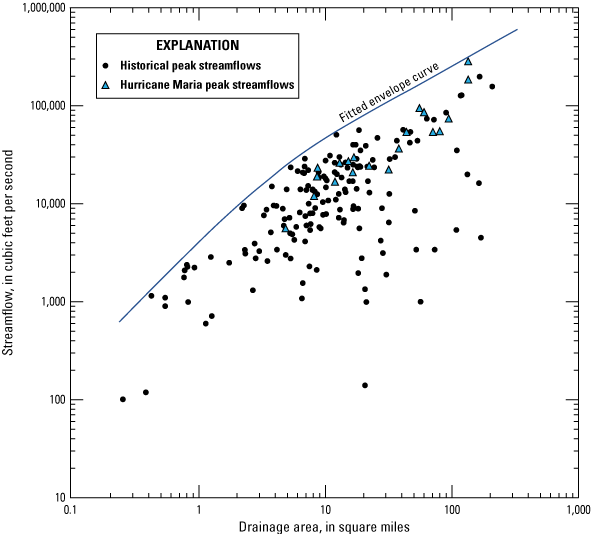
Drainage area versus peak streamflow for the largest period-of-record peak streamflows for 181 unregulated sites in Puerto Rico having one or more years of published peak streamflows. The fitted envelope curve defines the approximate upper limit of peak streamflows as a function of drainage area.
Unit-peak streamflow is a logical metric for characterizing peak streamflows generated at stream locations with different drainage areas and effectively summarizes the graphical information in figure 11. Figure 12 characterizes POR maximum (rank 1) unit-peak streamflows for all 181 peak streamflows listed in appendix 6, the subset of 161 non-Hurricane Maria unit-peak streamflows, and the subset of 20 Hurricane Maria unit-peak streamflows; table 9 provides dataset statistics in tabular form. Figure 12 and table 9 are meant to summarize characteristics of Hurricane Maria POR maximum unit-peak streamflows in the context of POR maximum unit-peak streamflows that have occurred historically in Puerto Rico and do not infer any direct statistical comparison of the datasets.
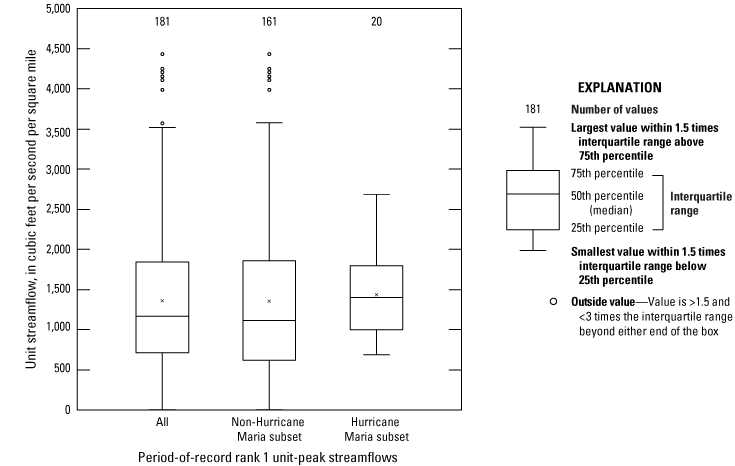
Boxplots showing distributions for all period-of-record rank 1 unit-peak streamflows, non-Hurricane Maria period-of-record rank 1 unit-peak streamflows, and Hurricane Maria period-of-record rank 1 unit-peak streamflows in Puerto Rico.
Table 9.
Minimum, 25th percentile, 50th percentile, 75th percentile, and maximum values for the three datasets (fig. 12) composed of all 181 unit-peak streamflows, 161 non-Hurricane Maria unit-peak streamflows, and 20 Hurricane Maria unit-peak streamflows.[n, number of values in dataset; (ft3/s)/mi2, cubic foot per second per square mile]
The curve was developed specifically for Puerto Rico and may or may not be applicable for the U.S. Virgin Islands and (or) other islands in the Greater Antilles; further analysis of island physiography and regional meteorological conditions would be needed to determine whether broader application of the Puerto Rico envelope curve is reasonable. Finally, future floods in Puerto Rico may lie outside the curve developed in this study. Peak streamflows for such extreme floods could be plotted on the graph in figure 11 and used to develop a new curve that supersedes this one.
Other USGS Activities in Response to Hurricane Maria
USGS personnel conducted several other Hurricane Maria-related activities from 2017 to 2019 to support needs of emergency response agencies, cooperators, and the public. These activities included (1) collecting and documenting coastal HWMs and storm-tide data associated with Hurricane Maria (Byrne, 2019); (2) conducting GNSS surveys to convert the vertical datum of all monitoring sites in the USGS hydrologic network for Puerto Rico to PRVD02; and (3) supporting local and Federal agencies in monitoring the Lago Guajataca Dam, which was at risk of failing because of spillway erosion caused by the heavy rainfall and flooding (Carrasco, 2019). A brief overview of the PRVD02 datum-conversion surveys and Lago Guajataca Dam monitoring is provided in this section of the report.
Conversion of the USGS Hydrologic Network to PRVD02
From March 2018 to December 2019, USGS field crews conducted GNSS surveys at all sites in the Puerto Rico hydrologic monitoring network to determine and publish gage elevations relative to PRVD02. Some of these surveys were conducted in conjunction with SBA surveys used for post-Hurricane Maria streamgage rating curve development. Additional standalone surveys were conducted at all remaining stations in the Puerto Rico network so that the entire network could be referenced to PRVD02. Historically, USGS monitoring stations were referenced to a designated “gage datum” and (or) Puerto Rico mean sea level (selected relative to local topography and, for streamgages, with consideration of stream-channel depth at the site). The approximate true elevation of the station, based on contour elevations in PRVD02/North American Datum of 1983 (NAD 83) 1:24,000-scale topographic maps, often was published along with the local gage datum. In recent years, the USGS has prioritized the nationwide conversion of gage datums to a vertical datum consistent with the National Spatial Reference System through technologies such as Survey-Grade GNSS systems (Rydlund and Densmore, 2012). The USGS prioritized conversion of gage datums to PRVD02 as part of the network restoration activities conducted after the passage of Hurricane Maria.
The GNSS-surveying campaigns were conducted using two approaches: GNSS static and (or) Real-Time Network (RTN) surveys. RTN surveying is similar in concept to RTK surveying discussed earlier, as both GNSS-surveying methods use communication with a reference station to make real-time corrections to the data being collected by a rover station, which is a portable device that collects positioning data relative to a base station. Unlike RTK surveying, for which the reference station is physically located at a monumented or non-monumented benchmark, RTN surveying uses Continuously Operating Reference Stations (CORS) (USGS, 2020a), which continuously sends positioning information to a centralized server. A virtual reference station is created from these CORS, and real-time positioning data (raw data) are properly adjusted (satellite orbit, clock error, among other factors). These adjustments are made through a connection to the internet by linking the rover network to the CORS. The RTN-surveying campaign conducted for the USGS sites in Puerto Rico included checking monumented benchmarks at the start and end of each day to ensure vertical accuracy.
The GNSS-static and RTN-GNSS surveying methods were both completed according to USGS level-quality standards and protocols documented in Rydlund and Densmore (2012). The accepted minimum accuracy standard for the GNSS surveys conducted in Puerto Rico was Level II quality (accuracy ±0.26 ft); however, higher accuracy surveys were conducted at some sites.
Real-Time, High-Resolution Monitoring of Spillway Damage of the Lago Guajataca Dam
USGS streamgage 50010800 Lago Guajataca at damsite near Quebradillas is situated at the Lago Guajataca Dam (plate 1, index number 3 near northwestern corner of Puerto Rico), which impounds the main source of water supply for the northwestern part of Puerto Rico. During the passage of Hurricane Maria, severe flooding occurred in the Río Guajataca watershed, causing uncontrolled flow over the dam spillway and erosion of the spillway structure, making the dam vulnerable to potential failure (Carrasco, 2019). Local and Federal agencies immediately initiated a cooperative effort to address the emergency and mitigate erosion processes threatening the dam. In particular, the Puerto Rico Electric Power Authority and U.S. Army Corps of Engineers needed real-time information to implement temporary dam-safety measures, which required continuous monitoring of the spillway structure and its integrity (USGS, 2017; Carrasco, 2019).
USGS personnel, along with community volunteers, assisted in the logistics and installation of a telemetered high-resolution camera that collected targeted images of the affected area at 30-minute intervals from October to December 2017. Local and Federal agencies were able to access an internet webpage and view near-live imagery of spillway head-cut erosion and progress of mitigation efforts. Figure 13 shows a photograph captured during the emergency (fig. 13A) and a photograph of the components of the high-resolution camera equipment used to collect images (fig. 13B). The image in figure 14 is a panoramic view of the affected area showing the dam, spillway structures, and area of head-cut erosion.
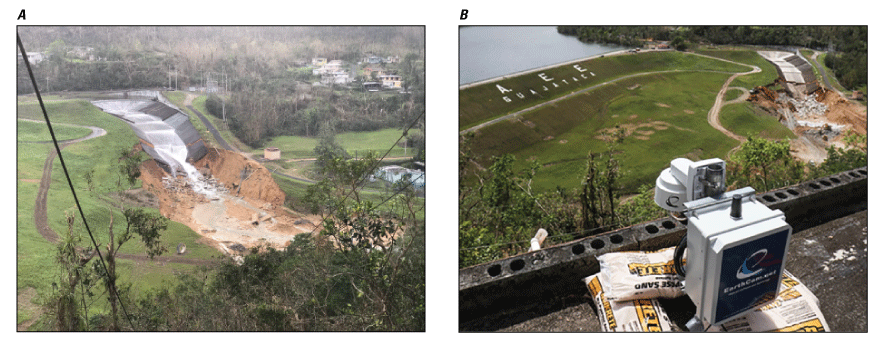
Photographs showing, A, the area affected by the flood of September 20, 2017 (photograph date, October 4, 2017) and, B, the high-resolution camera installed on a neighbor’s rooftop near Lago Guajataca Dam for monitoring the extent of the erosion (photograph date, October 18, 2017). Photographs by John Parks, U.S. Geological Survey.
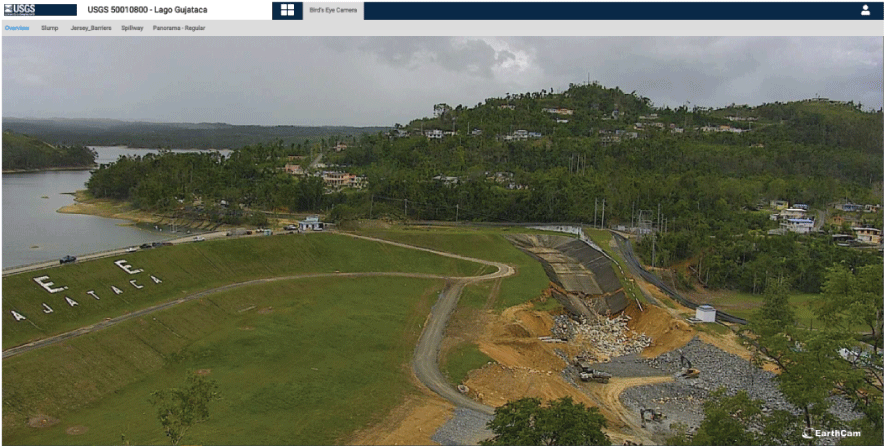
Screenshot of the National Water Information System web interface (NWISWeb, U.S. Geological Survey [USGS], 2021a) showing an image captured with the high-resolution camera installed for monitoring the extent of erosion occurring at the spillway of Lago Guajataca Dam. Image by John Parks, U.S. Geological Survey.
Summary and Conclusions
Hurricane Maria struck the island of Puerto Rico as a category 4 storm on the morning of September 20, 2017, and was one of the deadliest storms to impact Puerto Rico since the late 1800s. It was also the costliest storm in Puerto Rico history, with damage costs of about 90 billion U.S. dollars (including Puerto Rico and the Virgin Islands). Hurricane Maria traversed the entire island from southeast to northwest and produced up to 30.01 inches of rainfall in the 48-hour period from 8:00 a.m. Atlantic Standard Time September 19 to 8:00 a.m. Atlantic Standard Time September 21, 2017. Flooding was extensive across the island, and available hydrologic information indicated the storm produced more period-of-record peak streamflows than any other flood event since at least the 1960s.
The U.S. Geological Survey (USGS) hydrologic network sustained substantial wind and flood damage during the hurricane. Eighty-five of the 300 hydrologic monitoring stations operating in Puerto Rico and the U.S. Virgin Islands prior to the passage of Hurricane Maria were destroyed or damaged, including 48 streamgages that collected continuous records of stream stage for use in computing streamflows. The damage severely inhibited the collection of hydrologic data needed for post-flood monitoring of streamflows, ongoing flood-hazard mitigation, and management of the island’s water resources.
During the weeks and months after the hurricane, USGS field crews in Puerto Rico prioritized repair of the hydrologic monitoring network, and collected hydrologic information to characterize the magnitude of observed peak streamflows at 20 streamgages and to develop new theoretical stage-streamflow relations for 58 streamgages where stream channels were substantially altered; the theoretical stage-streamflow relations were used to estimate Hurricane Maria peak streamflows for 39 of those sites. As part of a pilot program, USGS field crews installed continuous slope-area monitoring equipment at two remote streamgages to collect continuous high-streamflow stage data that otherwise would be difficult to recover for future flood events.
Based on the magnitude and period-of-record rank of peak streamflows at 73 streamgages in the USGS hydrologic network, Hurricane Maria flooding can be characterized in terms of its hydrologic and historical significance. New rank 1 period-of-record peak streamflows occurred at 28 sites, rank 2 period-of-record peak streamflows occurred at 17 sites, and rank 3 period-of-record peak streamflows occurred at 9 sites. Annual exceedance probabilities for 53 unregulated peak streamflows ranged from greater than 50.0 percent (recurrence interval of less than 2 years) to 0.3 percent (recurrence interval of 333 years), with the majority (28 of 53) in the range of 10.0–2.1 percent (recurrence interval of 10–48 years).
As of February 2021, 58 streamgage sites in the USGS network had historical records with at least 20 years of annual peak streamflows. A comparison of period-of-record ranks for the three largest flood events that have occurred in Puerto Rico since the 1960s indicated that Hurricane Maria produced more record-peak streamflows than either Hurricane Hortense (1996) or Hurricane Georges (1998). Earlier hurricanes such as Hurricane San Ciprián in 1932, Hurricane San Felipe II in 1928, or Hurricane San Ciriaco in 1899 may have rivaled Hurricane Maria in terms of flood magnitude, but limited pre-1960s hydrologic data preclude quantitative comparison with those storm events.
This study afforded the opportunity to develop a maximum peak-streamflow envelope curve for Puerto Rico using available peak streamflow information for 119 active streamgages, 56 inactive streamgages, and 6 miscellaneous sites in Puerto Rico that are all unaffected by regulation, urbanization, or karst. The envelope curve developed for this study contributes to the characterization of extreme flooding in Puerto Rico and expands the scope of work done by previous investigators that was limited to the conterminous United States. Twenty Hurricane Maria period-of-record maximum peak streamflows are included in the dataset from which the envelope curve was developed.
In addition to flood documentation, other USGS activities documented in this report include the following:
-
Global Navigation Satellite System and (or) real-time network surveys to convert the preexisting datum of all stations in the USGS hydrologic monitoring network to the Puerto Rico Vertical Datum of 2002. Datum surveys were conducted between March 2018 and December 2019.
-
Remote monitoring of the Lago Guajataca Dam, which was damaged and at risk of failure from October to December 2017. USGS personnel installed a telemetered, high-resolution camera on the dam configured to record and display structural conditions of the dam and spillway online in near-real time.
This report provides some perspective on the scope and magnitude of flooding associated with Hurricane Maria and can be used as a framework for characterizing future extreme-flood events that inevitably will affect Puerto Rico and neighboring islands in the Caribbean. Hurricane Maria was one of the most devastating storms to strike Puerto Rico since the 1800s and undoubtedly will affect its residents, economy, and landscape for many years to come.
References Cited
ABC News, 2018, Nearly 1 year after Hurricane Maria, 100 percent of customers have power in Puerto Rico—Officials: ABC Audio, Tuesday, August 14, 2018, accessed May 18, 2021, at https://abcnews.go.com/US/year-hurricane-maria-100-percent-customers-power-puerto/story?id=57175710.
Arcement, G.J., and Schneider, V.R., 1989, Guide for selecting Manning’s roughness coefficients for natural channel and flood plains: U.S. Geological Survey Water-Supply Paper 2339, 44 p., accessed April 27, 2020, at https://pubs.usgs.gov/wsp/2339/report.pdf.
Barnes, H.H., Jr., 1967, Roughness characteristics of natural channels: U.S. Geological Survey Water Supply Paper 1849, 213 p. [Also available at https://pubs.usgs.gov/wsp/wsp_1849/pdf/wsp_1849.pdf.]
Barton, G.J., McDonald, R.R., and Nelson, J.M., 2009, Simulation of streamflow using a multidimensional flow model for white sturgeon habitat, Kootenai River near Bonners Ferry, Idaho—A supplement to Scientific Investigations Report 2005–5230: U.S. Geological Survey Scientific Investigations Report 2009–5026, 34 p.
Bennett, S.P., and Mojica, R., 1999, Hurricane Georges preliminary storm report: National Oceanic and Atmospheric Administration [NOAA], National Weather Service web page, accessed February 19, 2021, at https://www.weather.gov/sju/1998_georges.
Bodhaine, G.L., 1968, Measurement of peak discharge at culverts by indirect methods: U.S. Geological Survey Techniques of Water-Resources Investigations, book 3, chap. A3, 60 p. [Also available at https://pubs.er.usgs.gov/publication/twri03A3.]
Bradley, D.N., 2013b, Slope-area computation program graphical user interface 1.0—A preprocessing and postprocessing tool for estimating peak flood discharge using the slope-area method: U.S. Geological Survey Fact Sheet 2012–3112, 4 p., accessed February 19, 2021, at https://water.usgs.gov/software/SAC/doc/SAC_GUI-FS_2012-3112.pdf.
Bush, D.M., Neal, W.J., and Jackson, C.W., 2009, Summary of Puerto Rico’s vulnerability to coastal hazards—Risk, mitigation, and management with examples, in Kelley, J.T., Pilkey, O.H., and Cooper, J.A.G., eds., America’s most vulnerable coastal communities: Geological Society of America Special Paper 460, p. 149–165, accessed October 5, 2021, at https://doi.org/10.1130/2009.2460(11).
Byrne, M.J., 2019, Monitoring storm tide, flooding, and precipitation from Hurricane Maria in Puerto Rico and the U.S. Virgin Islands, September 2017: U.S. Geological Survey Open-File Report 2019–1065, 26 p., accessed February 28, 2019, at https://pubs.usgs.gov/of/2019/1065/ofr20191065.pdf.
Camp, J., Scaife, A.A., and Heming, J., 2018, Predictability of the 2017 North Atlantic hurricane season—Royal Meteorological Society: Atmospheric Science Letters, v. 19, article e813, accessed February 25, 2020, https://rmets.onlinelibrary.wiley.com/doi/epdf/10.1002/asl.813.
Carrasco, C., 2019, Guajataca Dam repairs—A successful interagency team effort: U.S. Army Corps of Engineers web page, accessed July 29, 2020, at https://www.saj.usace.army.mil/DesktopModules/ArticleCS/Print.aspx?PortalId=44&ModuleId=16629&Article=1846212.
Dalrymple, T., and Benson, M.A., 1968, Measurement of peak discharge by the slope-area method: U.S. Geological Survey Techniques of Water-Resources Investigations, book 3, chap. A2, 12 p. [Also available at https://pubs.er.usgs.gov/publication/twri03A2.]
Davidian, J., 1984, Computation of water-surface profiles in open channels: U.S. Geological Survey Techniques of Water-Resources Investigations, book 3, chap. Al5, 48 p. [Also available at https://pubs.er.usgs.gov/publication/twri03A15.]
England, J.F., Jr., Cohn, T.A., Faber, B.A., Stedinger, J.R., Thomas, W.O., Jr., Veilleux, A.G., Kiang, J.E., and Mason, R.R., Jr., 2018, Guidelines for determining flood flow frequency—Bulletin 17C (ver. 1.1, May 2019): U.S. Geological Survey Techniques and Methods, book 4, chap. B5, 148 p., accessed October 5, 2021, at https://doi.org/10.3133/tm4B5.
Fassig, O.L., 1928, San Felipe—The hurricane of September 13, 1928, at San Juan, P.R., in Mitchell, C.L., ed., Monthly Weather Review: Washington, D.C., Weather Bureau, September 1928, v. 56, no. 9, W.B. no. 967, p. 350–352, accessed February 19, 2021, at https://www.aoml.noaa.gov/hrd/hurdat/mwr_pdf/1928.pdf.
Federal Emergency Management Agency, 2016, Guidance for flood risk analysis and mapping—Hydraulics—One-dimensional analysis: Federal Emergency Management Agency Guidance Document 80, 16 p., accessed April 15, 2020, at https://www.fema.gov/sites/default/files/2020-02/Hydraulics_OneDimensionalAnalyses_Nov_2016.pdf.
Federal Emergency Management Agency, 2018, 2017 Hurricane season FEMA after-action report: Federal Emergency Management Agency, 65 p., accessed April 16, 2021, at https://www.fema.gov/sites/default/files/2020-08/fema_hurricane-season-after-action-report_2017.pdf#:~:text=Hurricane%20Maria%20severely%20damaged%20o r%20destroyed%20a%20significant,delivery%20in%20Federal%20Emergency%20Management%20Agency%20%28FEMA%29%20history.
Fulford, J.M., 1994, User’s guide to SAC—A computer program for computing streamflow by slope-area method: U.S. Geological Survey Open File Report 94–360, 37 p. [Also available at https://pubs.usgs.gov/of/1994/0360/report.pdf.]
Fulford, J.M., 1998, User’s guide to the U.S. Geological Survey Culvert Analysis Program, version 97–08: U.S. Geological Survey Water-Resources Investigation Report 98–4166, 76 p. [Also available at https://pubs.usgs.gov/wri/1998/4166/report.pdf.]
Gómez-Fragoso, J., and Smith, M., 2022, USGS response to Hurricane Maria flooding in Puerto Rico and characterization of peak streamflows observed September 20–22, 2017: U.S. Geological Survey data release, https://doi.org/10.5066/P908UR17.
Gómez-Gómez, F., Rodríguez-Martínez, J., and Santiago, M., 2014, Hydrogeology of Puerto Rico and the outlying islands of Vieques, Culebra, and Mona: U.S. Geological Survey Scientific Investigations Map 3296, 40 p., 2 pls., accessed October 5, 2021, at https://doi.org/10.3133/sim3296.
Hartwell, F.E., 1932, San Ciprián—Hurricane of September 26–27, 1932, in Humphreys, W.J., ed., Monthly Weather Review—West Indian hurricanes of August and September 1932: Washington, D.C., Weather Bureau, v. 60, no. 9, W.B. no. 1086, p. 178–179, accessed February 19, 2021, at https://www.aoml.noaa.gov/hrd/hurdat/mwr_pdf/1932.pdf.
Hulsing, H., 1967, Measurement of peak discharge at dams by indirect method: U.S. Geological Survey Techniques of Water-Resources Investigations, book 3, chap. A5, 29 p. [Also available at https://pubs.er.usgs.gov/publication/twri03A5.]
Jennings, L.N., Douglas, J., Treasure, E., and González, G., 2014, Climate change effects in El Yunque National Forest, Puerto Rico, and the Caribbean Region: U. S. Department of Agriculture, 60 p., accessed February 28, 2019, at https://www.srs.fs.usda.gov/pubs/gtr/gtr_srs193.pdf.
Kenney, T.A., 2010, Levels at gaging stations: U.S. Geological Survey Techniques and Methods, book 3, chap. A19, 72 p. [Also available at https://pubs.usgs.gov/tm/tm3A19/tm3A19.pdf.]
Kishore, N., Márques, D., Mahmud, A., Kiang, M.V., Rodríguez, I., Fuller, A., Ebner, P., Sorensen, C., Racy, F., Lemery, J., Maas, L., Leaning, J., Irizarry, R.A., Balsari, S., and Buckee, C.O., 2018, Mortality in Puerto Rico after Hurricane Maria: The New England Journal of Medicine, v. 379, no. 2, p. 162–170.
Koenig, T.A., Bruce, J.L., O’Connor, J.E., McGee, B.D., Holmes, R.R., Jr., Hollins, R., Forbes, B.T., Kohn, M.S., Schellekens, M.F., Martin, Z.W., and Peppler, M.C., 2016, Identifying and preserving high-water mark data: U.S. Geological Survey Techniques and Methods, book 3, chap. A24, 47 p. [Also available at https://doi.org/10.3133/tm3A24.]
Landsea, C., Anderson, C., Bredemeyer, W., Carrasco, C., Charles, N., Chenoweth, M., Clark, G., Delgado, S., Dunion, J., Ellis, R., Fernandez-Partagas, J., Feuer, S., Gamache, J., Glenn, D., Hagen, A., Hufstetler, L. Mock, C., Neumann, C., Perez-Suarez, R., Prieto, R., Sanchez-Sesma, J., Santiago, A., Sims, J., Thomas, D., Woolcock, L., and Zimmer, M., 2012, Documentation of Atlantic tropical cyclones changes in HURDAT: National Oceanic and Atmospheric Administration Atlantic Oceanographic and Meteorological Laboratory web page, accessed May 9, 2022, at https://www.aoml.noaa.gov/hrd/hurdat/metadata_master.html.
Matthai, H.F., 1967, Measurement of peak discharge at width contractions: U.S. Geological Survey Techniques of Water-Resources Investigations, book 3, chap. A4, 44 p. [Also available at https://pubs.er.usgs.gov/publication/twri03A4.]
Milken Institute School of Public Health, 2018, Ascertainment of the estimated excess mortality from Hurricane Maria in Puerto Rico: George Washington University and University of Puerto Rico Graduate School of Public Health Project Report, 69 p., accessed July 24, 2020, at https://publichealth.gwu.edu/sites/default/files/downloads/projects/PRstudy/Acertainment%20of%20the%20Estimated%20Excess%20Mortality%20from%20Hurrican e%20Maria%20in%20Puerto%20Rico.pdf.
Murphy, S.F., and Stallard, R.F., 2012, Hydrology and climate of four watersheds in eastern Puerto Rico, chapter C of Water quality and landscape processes of four watersheds in eastern Puerto Rico: U.S. Geological Survey Professional Paper 1789, 42 p., accessed February 20, 2020, at https://pubs.usgs.gov/pp/1789/pdfs/ChapterC.pdf.
National Centers for Environmental Information, 2017, State of the climate—National climate report for September 2017: National Oceanic and Atmospheric Administration [NOAA] National Centers for Environmental Information web page, accessed April 28, 2021, at https://www.ncdc.noaa.gov/sotc/national/201709.
National Geodetic Survey, 2014, GEOID12B readme file—The GEOID12B model: National Oceanic and Atmospheric Administration, National Geodetic Survey, Information Services Branch web page, accessed October 5, 2021, at https://www.ngs.noaa.gov/wp-content/uploads/2018/11/g2012Brme.txt.
National Oceanic and Atmospheric Administration, [NOAA], 2017, October 2017 climate review for Puerto Rico and U.S. Virgin Islands: National Oceanic and Atmospheric Administration [NOAA] web page, accessed February 27, 2019, at https://www.weather.gov/media/sju/climo/monthly_reports/2017/Oct2017.pdf.
National Oceanic and Atmospheric Administration, [NOAA], 2020, Historical hurricane tracks: National Oceanic and Atmospheric Administration [NOAA] web page, accessed December 17, 2020, at https://coast.noaa.gov/hurricanes/#map=4/32/-80.
National Oceanic and Atmospheric Administration [NOAA] National Hurricane Center and Central Pacific Hurricane Center, 2020, Tropical cyclone climatology: National Oceanic and Atmospheric Administration [NOAA] National Hurricane Center and Central Hurricane Center web page, accessed January 17, 2020, at https://www.nhc.noaa.gov/climo/.
National Oceanic and Atmospheric Administration [NOAA] National Hurricane Center and Central Pacific Hurricane Center, 2021, The Saffir-Simpson hurricane wind scale, accessed April 19, 2022, at https://www.nhc.noaa.gov/pdf/sshws.pdf.
National Research Council, 1994, Hurricane Hugo, Puerto Rico, the Virgin Islands, and Charleston, South Carolina, September 17–22, 1989: Washington, D.C., National Academies Press, 296 p. [Also available at https://nap.edu/1993.]
National Weather Service [NWS], 2021a, Major Hurricane Maria, September 20, 2017—Rainfall: National Weather Service web page, accessed June 12, 2021, at https://www.weather.gov/sju/maria2017. [Map accessed June 12, 2021, at https://www.weather.gov/images/sju/Huracanes/Maria/Maria_Rainfall.png.]
National Weather Service [NWS], 2021b, Rainfall and temperature maps for Puerto Rico and U.S. Virgin Islands—Mean annual rainfall 1991–2020: National Weather Service web page accessed January 4, 2022, at https://www.weather.gov/images/sju/climo/monthlymaps/2020-Annual-Normal-Rainfall.png.
Olcott, P.G., 1999, Ground water atlas of the United States—Alaska, Hawaii, Puerto Rico, and the U.S. Virgin Islands: U.S. Geological Survey Hydrologic Investigations Atlas 730–N, 36 p., accessed March 8, 2021, at https://pubs.er.usgs.gov/publication/ha730N.
Ortiz, F., 2020, Coming back from disaster: Federal Highway Administration, v. 83, no. 4, 2 p., accessed February 28, 2020, at https://www.fhwa.dot.gov/publications/publicroads/20winter/02.cfm.
Pasch, R.J., Penny, A.B., and Berg, R., 2019, National Hurricane Center Tropical Cyclone Center—Hurricane Maria: National Oceanic and Atmospheric Administration [NOAA] web page, accessed August 23, 2019, at https://www.nhc.noaa.gov/data/tcr/AL152017_Maria.pdf.
Puerto Rico Department of Natural and Environmental Resources , 2007, Los ríos—Hojas de nuestro ambiente [The rivers—Educational sheets of our environment]: Puerto DRNA, P–013, 2 p., accessed April 20, 2020, at http://drna.pr.gov/historico/biblioteca/publicaciones/hojas-de-nuestro-ambiente.
Ramos-Ginés, O., 1999, Estimation of magnitude and frequency of floods for streams in Puerto Rico—New empirical models: Water-Resources Investigation Report 99–4142, 46 p., accessed February 20, 2020, at https://pubs.usgs.gov/wri/wri994142/pdf/wri99-4142.pdf.
Randall, M.L., and Humphrey, J.H., 1984, Estimating peak flows in unstable channels using indirect methods, in Elliott, C.M., ed., River meandering—Rivers ‘83, American Society of Civil Engineers Conference, New Orleans, La., October 24–26, 1983, Proceedings: American Society of Civil Engineers, p. 574–585.
Ries, K.G., III, Newson, J.K., Smith, M.J., Guthrie, J.D., Steeves, P.A., Haluska, T.L., Kolb, K.R., Thompson, R.F., Santoro, R.D., and Vraga, H.W., 2017, StreamStats, version 4: U.S. Geological Survey Fact Sheet 2017–3046, 4 p., accessed October 5, 2021, at https://doi.org/10.3133/fs20173046. [Supersedes USGS Fact Sheet 2008–3067.]
Ryan, P.J., Gotvald, A.J., and Hazelbaker, C.L., 2021, Development of regression equations for the estimation of the magnitude and frequency of floods at rural, unregulated gaged and ungaged streams in Puerto Rico through water year 2017: U.S. Geological Survey Scientific Investigations Report 2021–5062, 37 p., accessed October 5, 2021, at https://doi.org/10.3133/sir20215062.
Rydlund, P.H., Jr., and Densmore, B.K., 2012, Methods of practice and guidelines for using survey-grade global navigation satellite systems (GNSS) to establish vertical datum in the United States Geological Survey: U.S. Geological Survey Techniques and Methods 11–D1, accessed July 7, 2020, at https://pubs.usgs.gov/tm/11d1/tm11-D1.pdf.
Shimizu, Y., and Nelson, J.M., 2020, iRIC 3.0—International River Interface Cooperative: Foundation of Hokkaido River Disaster Prevention Research Center and U.S. Geological Survey website, accessed April 19, 2020, at https://i-ric.org/en/introduction/.
Smith, C.F., Cordova, J.T., and Wiele, S.M., 2010, The continuous slope-area method for computing event hydrographs: U.S. Geological Survey Scientific Investigation Report 2010–5241, accessed March 9, 2020, at https://pubs.usgs.gov/sir/2010/5241/sir2010-5241.pdf.
Stewart, A.M., Callegary, J.B., Smith, C.F., Gupta, H.V., Leenhouts, J.M., and Fritzinger, R.A., 2012, Use of the continuous slope-area method to estimate runoff in a network of ephemeral channels, southwest Arizona, USA: Journal of Hydrology, v. 472–473, p. 148–158. [Also available at https://doi.org/10.1016/j.jhydrol.2012.09.022.]
Torres-Sierra, H., 1997, Hurricane Hortense—Impact on surface water in Puerto Rico: U.S. Geological Survey Fact Sheet FS–014–97, 4 p., accessed March 9, 2020, at https://doi.org/10.3133/fs01497.
U.S. Army Corps of Engineers, 2016, HEC-RAS River Analysis System—User’s manual (ver. 5.0, February 2016): U.S. Army Corp of Engineers, Institute for Water Resources, Hydrologic Engineering Center, report no. CPD–68, 960 p., accessed April 15, 2019, at https://www.hec.usace.army.mil/software/hec-ras/documentation/HEC-RAS%205.0%20Users%20Manual.pdf.
U.S. Census Bureau, 2020, QuickFacts Puerto Rico: U.S. Census Bureau web page, accessed February 20, 2020, at https://www.census.gov/quickfacts/PR.
U.S. Forest Service, 2020, El Yunque National Forest: U.S. Forest Service website, accessed April 14, 2021, at: https://www.fs.usda.gov/main/elyunque/about-forest.
U.S. Geological Survey, [USGS], 1972, Surface Water Branch technical memorandum no. 73.01: U.S. Geological Survey Surface Water Technical Memorandum 73.01, 2 p. [Also available at https://water.usgs.gov/admin/memo/SW/SW-73-01.pdf.]
U.S. Geological Survey, [USGS], 1974, Surface Water Branch technical memorandum no. 74.14: U.S. Geological Survey Surface Water Technical Memorandum 74.14, 6 p. [Also available at https://water.usgs.gov/admin/memo/SW/74.14memo.pdf.]
U.S. Geological Survey, [USGS], 2012a, Water Mission Area memorandum no. 12.07: U.S. Geological Survey Water Mission Area Memorandum 12.07, 3 p. [Also available at https://water.usgs.gov/admin/memo/policy/wmapolicy12.07.html.]
U.S. Geological Survey, [USGS], 2012b, Surface Water Branch technical memorandum no. 2013.01: U.S. Geological Survey Surface Water Technical Memorandum 2013.01, 7 p. [Also available at https://water.usgs.gov/admin/memo/SW/sw13.01.pdf.]
U.S. Geological Survey, [USGS], 2017, USGS helps restores public safety in Puerto Rico under harsh conditions, accessed April 19, 2022, at https://www.usgs.gov/news/featured-story/usgs-helps-restore-public-safety-puerto-rico-under-harsh-conditions.
U.S. Geological Survey, [USGS], 2018, The National Map—USGS lidar point cloud PR Puerto Rico 2015–2018: U.S. Geological Survey, National Geospatial Program online database, accessed March 10, 2018, at https://nationalmap.gov/viewer.html.
U.S. Geological Survey, [USGS], 2020a, Global Navigation Satellite System—Real-Time Network (RTN) surveying: U.S. Geological Survey web page, accessed February 24, 2020, at https://water.usgs.gov/osw/gps/real-time_network.html.
U.S. Geological Survey, [USGS], 2020b, Water resources of the United States—2009 Annual data report—Definition of terms: U.S. Geological Survey web page, accessed September 8, 2020, at https://wdr.water.usgs.gov/current/termDefs.html.
U.S. Geological Survey [USGS], 2021a, USGS water data for the Nation: U.S. Geological Survey National Water Information System database, accessed March 3, 2021, at https://doi.org/10.5066/F7P55KJN.
U.S. Geological Survey, [USGS], 2021b, NGP standards and specifications—Lidar base specification online: U.S. Geological Survey web page, accessed April 6, 2021, at https://www.usgs.gov/core-science-systems/ngp/ss/lidar-base-specification-online.
U.S. Geological Survey and Natural Resources Conservation Service, 2013, Federal standards and procedures for the national watershed boundary dataset (WBD): Chapter 3 of Section A, Federal Standards Book 11, Collection and Delineation of Spatial Data, accessed October 6, 2021, at: https://pubs.usgs.gov/tm/11/a3/pdf/tm11-a3_4ed.pdf
Wiele, S.M., 2015, CSA2SAC—A program for computing discharge from continuous slope-area data: U.S. Geological Survey Open-File Report 2015–1229, 4 p. [Also available at https://pubs.er.usgs.gov/publication/ofr20151229.]
Wiele, S.M., Heaton, J.W., Bunch, C.E., Gardner, D.E., and Smith, C.F., 2015, Continuous slope-area streamflow records in Mariposa County, Arizona, 2004–2012: U.S. Geological Survey Scientific Investigation Report 2015–5172, 40 p. [Also available at https://pubs.usgs.gov/sir/2015/5172/sir20155172.pdf.]
Appendix 1. U.S. Geological Survey Hydrologic Monitoring Network in Puerto Rico in 2017, Prior to Hurricane Maria
Appendix 2. Indirect Measurements of Peak Streamflow, Made at Selected Sites in Puerto Rico After the Passage of Hurricane Maria
Implementation of Indirect-Measurement Methods
U.S. Geological Survey (USGS) personnel identified priority measurement sites based on (1) observed flood impacts, specifically, the degree of scour and (or) fill and other channel alterations; (2) the needs of flood-response agencies and local water authorities; and (3) a general hydrologic characterization of flooding. To collect existing high-water mark (HWM) evidence as quickly as possible, USGS field crews visited 22 streamgage sites of interest during October 16–28, 2017. During this 13-day period, the field crews selected optimal study reaches for indirect measurements and flagged HWMs for subsequent topographic surveys. The field crews marked HWMs with recoverable identification so that they could be found by later field crews. Identification marks included Parker-Kalon (PK) nails, rebar, wood stakes, chiseled marks, and paint lines; annotated colored flagging was affixed to each of the marks. The field crews also prepared written descriptions, sketches, photographs, and Global Positioning System (GPS) horizontal coordinates obtained with a hand-held GPS unit for subsequent use by the survey teams.
Based on the October reconnaissance, USGS survey teams conducted topographic surveys at 21 of the 22 targeted sites during November 6–28, 2017. Reach characteristics at one site were not suitable for measurement, and therefore the site was not surveyed. During ongoing response activities in 2018–19 by the USGS, 3 of the 21 computed measurements were rejected because of questionable results, specifically, the large uncertainty of HWM profiles or computational diagnostics that exceeded method assumptions. Peak streamflow for those sites was estimated based on step-backwater analyses (SBAs) conducted in 2018. Two additional indirect measurements were computed at USGS streamgages 50029000 and 50057000, originally targeted for step-backwater studies, after it was determined that hydraulic conditions at those sites were incompatible with the step-backwater method.
USGS personnel computed the indirect measurements using methods and public-domain software as outlined in the “Methods” section of this report; the computational process followed USGS standards required for approval and publication of each peak streamflow.
Overview of Selected Measurement Sites
Physiography and watershed characteristics vary markedly across the Island of Puerto Rico. Selected sites in different geographic regions (delineated in fig. 2) and major drainage basins (defined by the 10-digit hydrologic unit boundaries in fig. 3) illustrate post-hurricane stream conditions and measurement activities conducted by USGS personnel in October and November 2017.
Southeastern Puerto Rico
Hurricane Maria rainfall totals in southeastern Puerto Rico ranged from a maximum of 30.01 inches (in.) recorded by USGS precipitation gage 50999961 La Plaza raingage, Caguas (identified as Caguas CAIP4 in Pasch and others, 2019) to between 10.00 and 14.99 in. at lower elevations along the southeast coast (fig. 5A, B).
USGS personnel made four indirect measurements in this part of the island (fig. 6A, B):
-
50050900 Río Grande de Loíza at Quebrada Arenas (elevation 634.98 feet [ft], referenced to the Puerto Rico Vertical Datum of 2002 [PRVD02]), located in the humid mountains of the east (geographic region 8)
-
50083500 Río Guayanés near Yabucoa (elevation 40.15 ft, referenced to PRVD02), located in the humid valleys of the east coast (geographic region 2)
-
50090500 Río Maunabo at Lizas (elevation 188.0 ft, referenced to PRVD02), located in the humid mountains of the east (geographic region 8)
-
50093000 Río Marín near Patillas (elevation 256.00 ft, referenced to PRVD02), located in the semi-arid southern foothills (geographic region 6)
Station 50050900 Río Grande de Loíza at Quebrada Arenas
The Río Grande de Loíza at Quebrada Arenas streamgage is situated in the mountainous, upper Río Grande de Loíza watershed (index number 18, fig. 6B) and has a contributing drainage area of 6.02 square miles (mi2); the streamgage has operated continuously since October 1977. Mean annual precipitation (1991–2020) in the upper watershed generally ranges from 70.00 to more than 90.00 in. (fig. 4B; National Weather Service [NWS], 2021b).
The La Plaza raingage, Caguas precipitation gage is situated in an adjacent watershed, about 4 miles (mi) northwest of the Río Grande de Loíza at Quebrada Arenas streamgage. Although the rain gage recorded the highest 48-hour rainfall total (30.01 in.) during Hurricane Maria, the upper Río Grande de Loíza watershed likely received between 10.00 and 19.99 in. of rainfall during that 48-hour period (fig. 5B). The streamgage continued to operate during and after Hurricane Maria, recording multiple peak streamflows from September 20 (during Hurricane Maria’s passage) to October 18, 2017; the peak streamflow of September 7, 2017 (during Hurricane Irma’s passage) was even higher. Recorded gage-height data (transmitted by satellite at 15-minute intervals) characterize the series of flood events that occurred in September and October 2017 (fig. 2.1). Continued heavy rains after Hurricane Maria likely caused saturated watershed conditions that contributed to the peak streamflows observed in October.
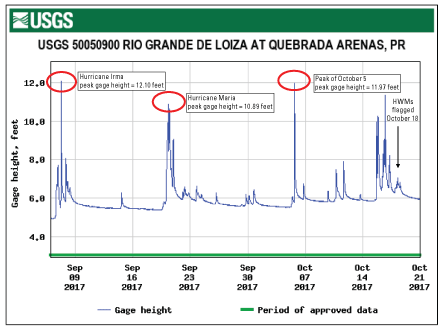
Gage-height record and event peaks for station 50050900 Río Grande de Loíza at Quebrada Arenas, Puerto Rico from September 6, 2017, to October 20, 2017. HWM, high water mark.
USGS personnel determined that 19 HWMs recovered October 18, 2017, characterized the peak streamflow of October 5, 2017. Because of continued heavy rains, observed HWMs were sparse and generally poor in quality. (Figure 2.1 shows the series of smaller floods that occurred between October 6 and 18.) USGS personnel returned in November 2017 to survey HWMs flagged in October, select and survey channel cross sections, and collect additional data needed for slope-area indirect measurement. The team surveyed five cross sections in a 500-ft reach upstream from the gage (installed on the bridge at Route PR–9920, intersecting with Route PR–181, fig. 2.2). Figures 2.2 and 2.3 show the measurement reach location and channel conditions at the time of the field survey.
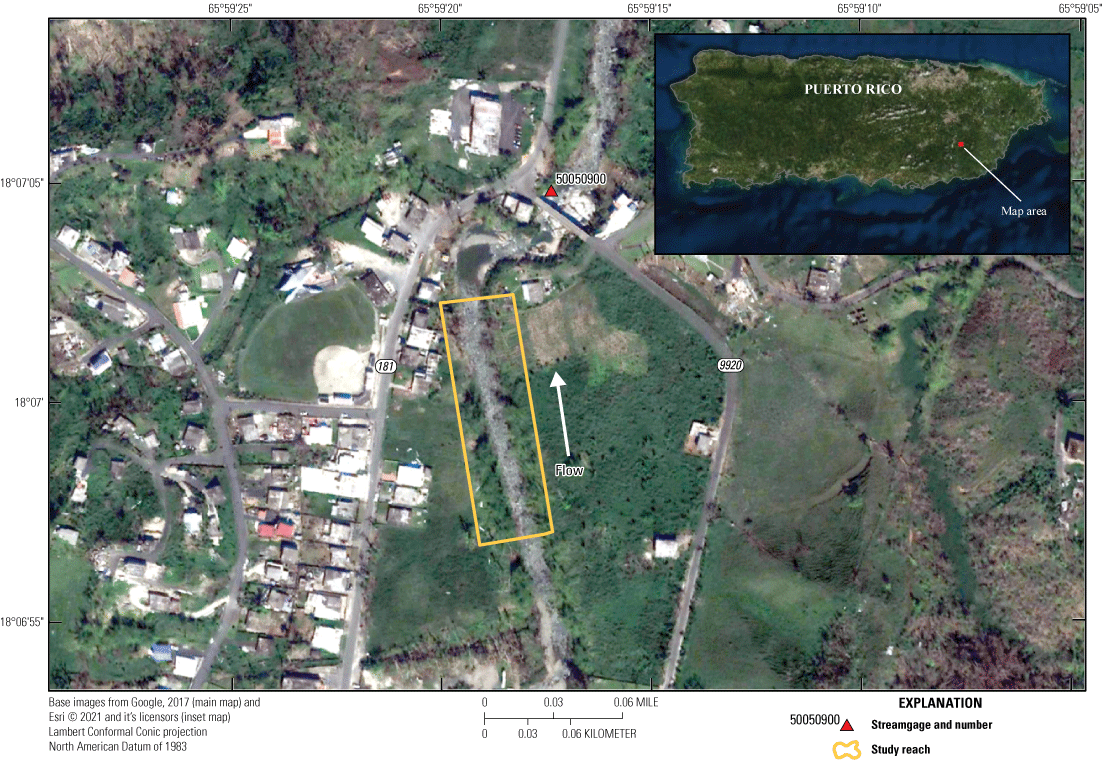
Location of study reach for slope-area measurement at station 50050900 Río Grande de Loíza at Quebrada Arenas.
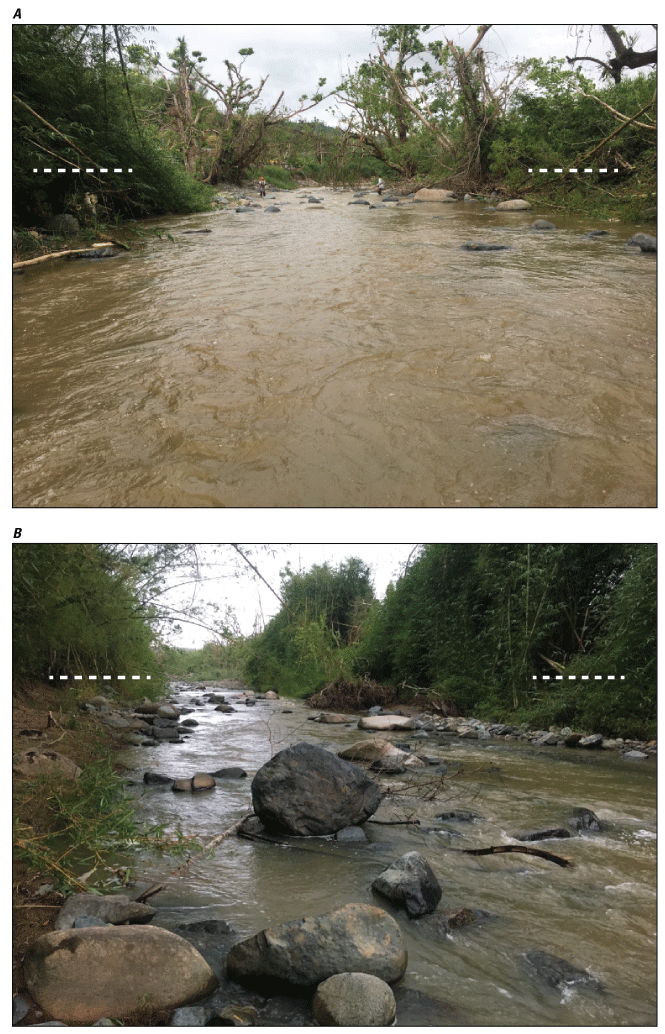
Conditions along study reach for station 50050900 Río Grande de Loíza at Quebrada Arenas, November 7, 2017. A, View downstream from upper end of reach; B, view upstream from lower middle of reach. White dashed lines denote approximate level of observed high-water marks. Photographs by Michael Kohn, U.S. Geological Survey.
Channel bed material was composed of cobbles, boulders, and some sand and gravel; bank vegetation was moderate to heavy (Arcement and Schneider, 1989), including several bamboo colonies on both banks that resisted erosion/removal by flood waters. Assessed roughness values (Manning’s n-values) in the study reach ranged from 0.050 to 0.067, determined using the Cowan method (Cowan, 1956).
Final computations were based on data from three cross sections in a 244-ft, upstream part of the study reach; the two surveyed cross sections furthest downstream were not included in the final analysis because of poor HWM definition and poor computational diagnostics. Computed peak streamflow for the flood of October 5, 2017, was 4,340 cubic feet per second (ft3/s) (gage height of 11.97 ft, gage datum) and a rated uncertainty of ±25 percent or greater, attributed to sparsity and (or) rated uncertainty of observed HWMs. Based on the computed peak streamflow for October 5, 2017, and analysis of the stage-streamflow relation over the entire range in stage, peak streamflow for Hurricane Maria flooding of September 20, 2017, was determined to be 4,000 ft3/s (gage height of 10.89 ft, gage datum).
Station 50090500 Río Maunabo at Lizas
The Río Maunabo at Lizas streamgage is situated in the Río Maunabo Watershed (index number 15, fig. 6B) near Route PR–759 at Lizas, 3 mi northwest of Maunabo (fig. 2.4); the contributing drainage area is 5.30 mi2. The site is less than 4 mi from the southeast coast and is characteristic of coastal streams in the humid valleys of the east coast (geographic region 2, figs. 2 and 6A). Mean annual rainfall in this coastal area ranges from 50.00 to 79.99 in.; 48-hour rainfall for September 19–20, 2017, ranged from 10.00 to 14.99 in. (figs. 4 and 5).
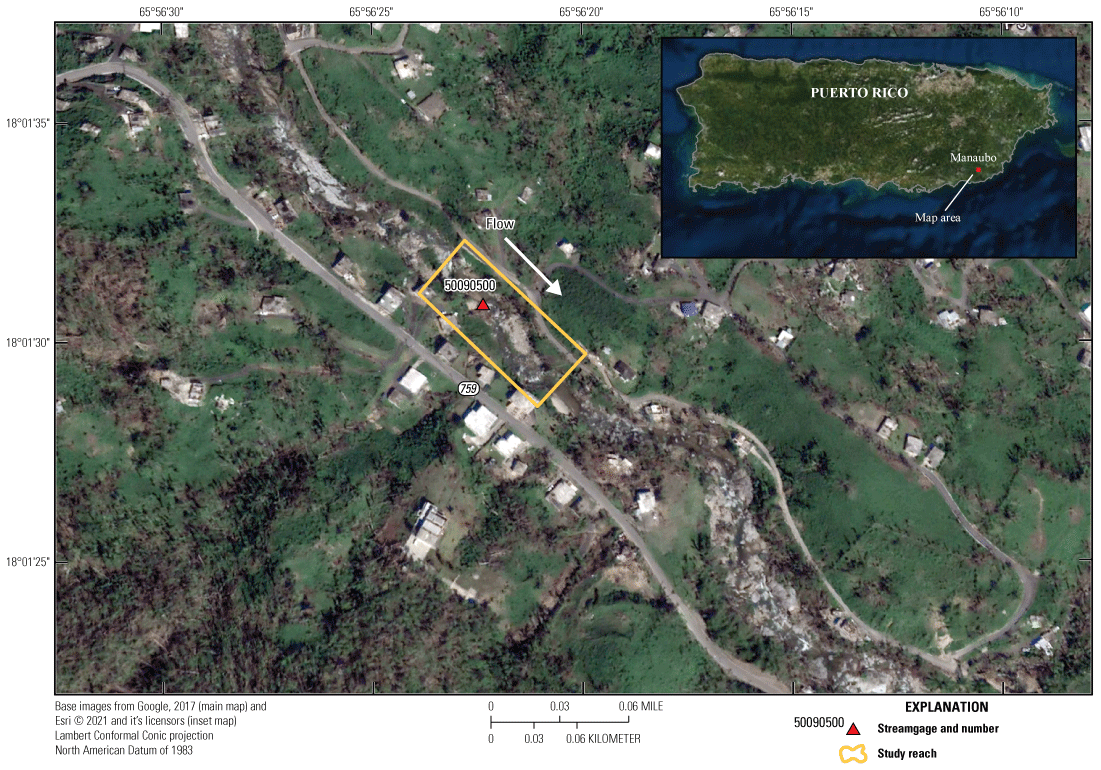
Location of study reach for slope-area measurement at station 50090500 Río Maunabo at Lizas.
The Río Maunabo at Lizas streamgage has been in operation periodically since 1971 and continuously since October 1, 2010. The streamgage was damaged during Hurricane Maria flooding on September 20, 2017, and failed to record the peak gage height; HWMs were recovered from an independent auxiliary gage, which measured a discrete peak gage height of 11.86 ft (gage datum). Recorded gage-height data (transmitted by satellite at 15-minute intervals) and missing periods of record between September 17 and October 20, 2017, are shown in figure 2.5. Based on HWMs observed at the gage during USGS site visits and hydrographic comparison with station 50083500 Río Guayanés near Yabucoa, the Hurricane Maria peak streamflow on September 20, 2017, was determined to be the highest for the September 17 to October 20 period. USGS personnel visited the site October 26, 2017, and flagged 12 HWMs for indirect measurement.
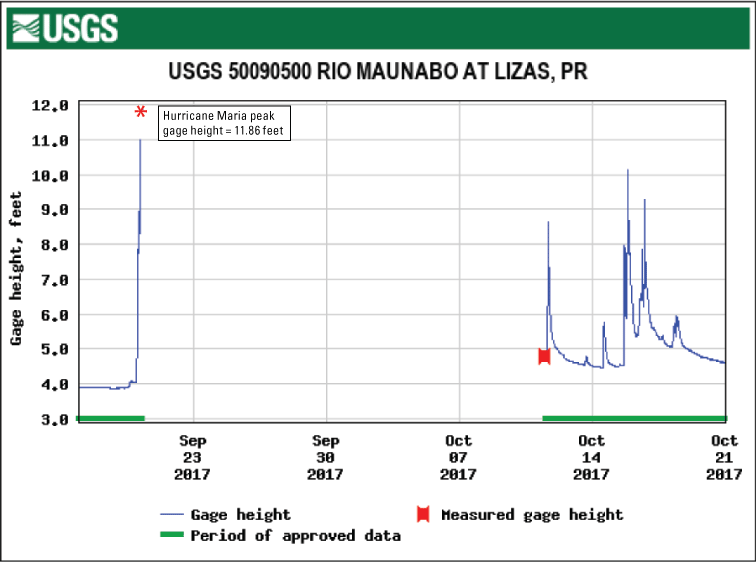
Gage-height record and event peaks for station 50090500 Río Maunabo at Lizas during the period from September 17, 2017, to October 21, 2017. The Hurricane Maria peak streamflow on September 20, 2017, was determined to be the highest peak streamflow during the period.
USGS personnel returned in November 2017 to survey flagged HWMs, select and survey channel cross sections, and collect additional data needed for slope-area measurement. The team surveyed five cross sections in a 340-ft reach that begins about 80 ft upstream from the streamgage and extends about 260 ft downstream from the streamgage. Figures 2.4 and 2.6 show the extent of the measurement reach and channel conditions at the time of the field survey.
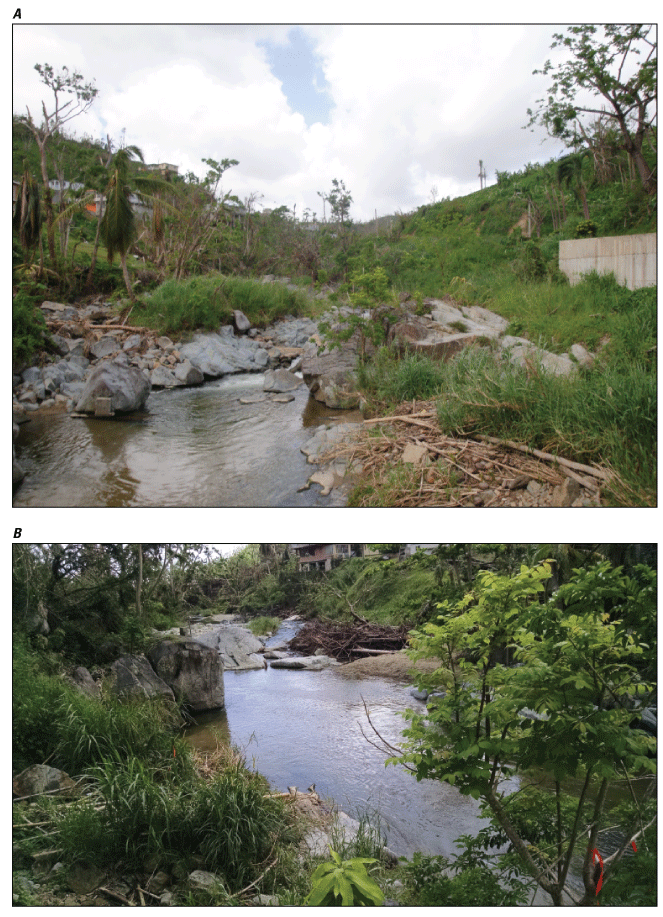
Conditions along study reach for station 50090500 Río Maunabo at Lizas, November 9, 2017. A, View upstream from streamgage; B, view downstream from upstream end of reach. Flood high-water marks are not visible in the photographs. Photographs by Jonathan Lageman, U.S. Geological Survey.
Channel bed material was composed primarily of large irregular boulders, cobbles, and bedrock; the amount of bank vegetation was characterized as small to medium in terms of its effect on roughness (Arcement and Schneider, 1989). Assessed roughness values (Manning’s n-values) in the study reach ranged from 0.054 to 0.095, determined using the Cowan method.
Final computations were based on data from four cross sections in a 220-ft reach; the furthest upstream surveyed cross section was not used in the final analysis because of poor computational diagnostics. Computed peak streamflow for September 20, 2017, was 4,640 ft3/s (gage height of 11.86 ft, gage datum), and a rated uncertainty of ±25 percent or greater attributed to severe irregularities in the channel bed and banks and to scarcity and large uncertainty (±0.40 ft) associated with HWMs recovered in October 2017.
El Yunque National Forest
El Yunque National Forest covers 28,500 acres in the northeastern part of Puerto Rico and is the only tropical rain forest in the U.S. Forest System (U.S. Forest Service, 2020). Mean annual rainfall in the Forest is the highest on the island, ranging from 70.00 to more than 150.00 in. (fig. 4A, B). From inspection of figure 5A, B (NWS, 2021a), the 48-hour rainfall during Hurricane Maria (September 19–21, 2017) ranged from 15.00 to 29.99 in. across El Yunque National Forest.
USGS personnel made indirect measurements at two streamgages that monitor streams in the national forest (fig. 6A, B):
-
50065500 Río Mameyes near Sabana, Puerto Rico (elevation 263.4 ft, referenced to PRVD02)
-
50067000 Río Sabana at Sabana, Puerto Rico (elevation 281.1 ft, referenced to PRVD02)
Both sites are in the Sierra de Luquillo (geographic region 10, fig. 6A) and are within the Río Herrera to Las Cabezas de San Juan Coastal watersheds (index number 17, fig. 6B). The Río Mameyes near Sabana measurement site is characteristic of watersheds in the El Yunque National Forest.
Station 50065500 Río Mameyes Near Sabana
The Río Mameyes near Sabana streamgage, installed on the bridge at Route PR–988, is situated near the mouth of the Río Mameyes, 1.4 mi west of the Town of Sabana (fig. 2.7) contributing drainage area is 6.77 mi2. The streamgage was operated from 1967 to 1973, then reactivated and operated continuously from June 1983 until September 2017. The streamgage was damaged during the Hurricane Maria flooding of September 20, 2017, and failed to record a peak gage height; the streamgage remained inoperable until USGS personnel completed repairs on October 24, 2017.
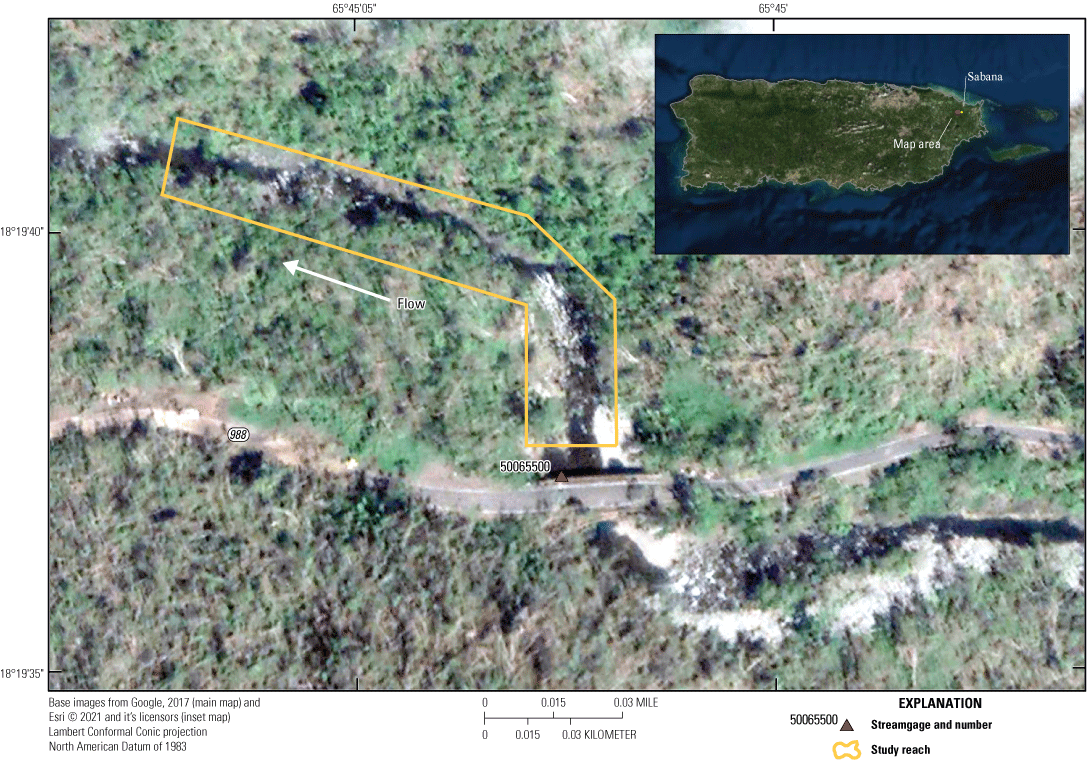
Location of study reach for slope-area measurement at station 50065500 Río Mameyes near Sabana.
USGS personnel visited the site on October 27, 2017, conducted site reconnaissance, and flagged 33 HWMs in a 750-ft slope-area reach downstream from the streamgage. Surveying teams returned on November 11 and 27, 2017, to survey flagged HWMs, select and survey channel cross sections, and collect other data needed for slope-area measurement. The teams surveyed six cross sections in a 695-ft reach (slightly shorter than that delineated by the HWMs) downstream from the streamgage. Figures 2.7, 2.8, and 2.9 show the measurement reach extent and channel conditions at the time field surveys were conducted.
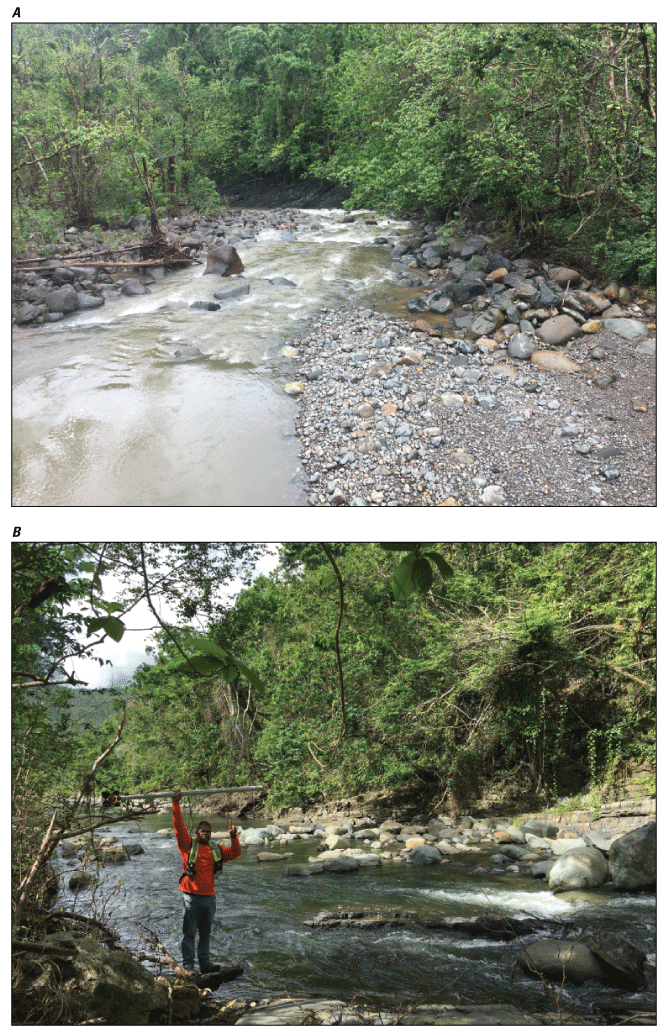
Conditions along study reach for station 50065500 Río Mameyes near Sabana. A, View downstream from the bridge at Route PR–988, November 11, 2017; B, view downstream from upstream end of reach, November 27, 2017; rod held at approximate high-water-mark level for the peak streamflow of October 15, 2017. Photographs by Michael Kohn and Julieta Gómez-Fragoso, U.S. Geological Survey.
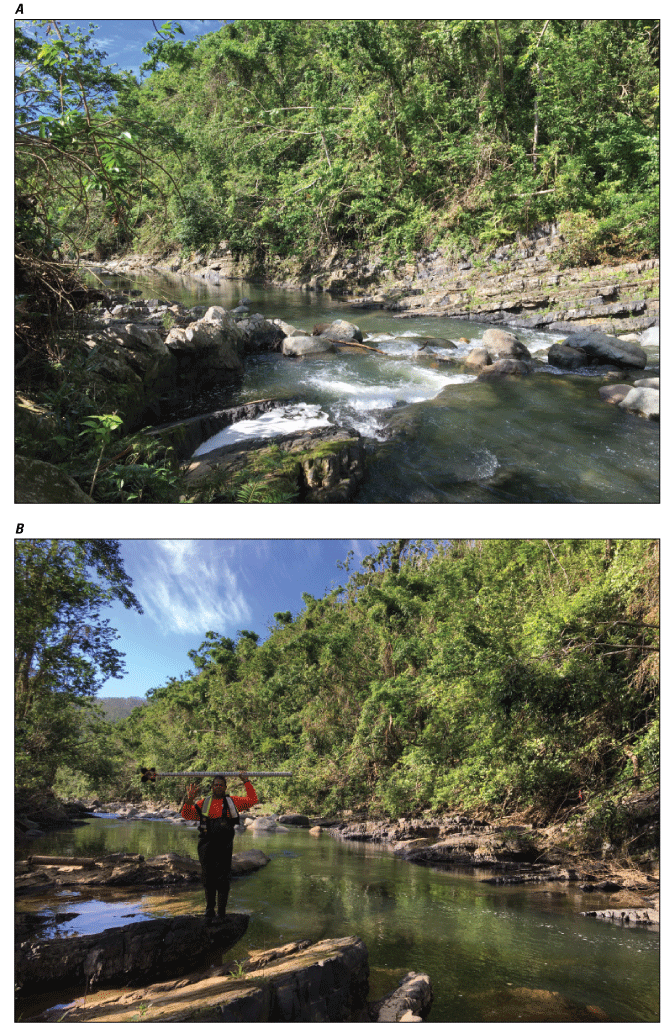
Conditions along study reach for station 50065500 Río Mameyes near Sabana, November 27, 2017. A, View downstream at middle part of study reach; B, view downstream at lower part of study reach; rod held at approximate high-water-mark level for the peak streamflow of October 15, 2017. Photographs by Julieta Gómez-Fragoso, U.S. Geological Survey.
Channel bed material was composed of bedrock, large boulders, cobbles, and some finer material; the amount of bank vegetation was characterized as small to medium relative to channel dimensions and magnitude of flooding (Arcement and Schneider, 1989). Assessed roughness values (Manning’s n-values) in the study reach ranged from 0.060 to 0.080 for peak-streamflow channel conditions, determined using the Cowan method.
Based on HWMs recovered near the streamgage (gage height of 9.59 ft, gage datum) and comparison with records at station 50067000 Río Sabana at Sabana, it was determined the indirect measurement characterized flooding that occurred October 15, 2017. Computed peak streamflow for the event was 9,480 ft3/s, with a rated uncertainty of ±25 percent or greater attributed to poor computational diagnostics (slope-area method assumptions) and the rated uncertainty of observed HWMs. The slope-area computation included all six surveyed cross sections.
Using the computed peak streamflow of October 15, 2017, to calibrate a step-backwater analysis (SBA) conducted in 2018, peak streamflow for Hurricane Maria was determined to be 16,200 ft3/s (gage height of 12.10 ft, gage datum, from HWM recorded by an auxiliary gage installed at the streamgage).
Northern Puerto Rico
Northern Puerto Rico is characterized by two distinctive geographic regions—the north coastal plain and the humid northern foothills (geographic regions 1 and 7, respectively, fig. 2)—both of which extend across the entire length of the island. The predominant physiographic feature characterizing the western two-thirds of these geographic regions is karst terrain, which extends inland more than 12 mi (Gómez-Gómez and others, 2014). Mean annual rainfall varies considerably across northern Puerto Rico, with higher annual totals in the northeast near El Yunque National Forest (fig. 4A, B).
Recorded 48-hour rainfall totals during Hurricane Maria generally ranged from 5.00 to 14.99 in. over the north coastal plain, with inland totals ranging from 15.00 to 29.99 in. over the humid northern foothills and the mountainous island interior, which is the source of several major river systems that produced severe flooding across much of northern Puerto Rico (fig. 5A). One of these rivers, the Río de La Plata (fig. 3), originates in the Guayama Muncipio in the southeastern part of the island (fig. 2) at an elevation of about 2,625 ft above Puerto Rico mean sea level. The river flows from south to north across the island and has a length of about 62 mi, making it the longest river in Puerto Rico (Puerto Rico Department of Natural and Environmental Resources, 2007). The USGS operates seven streamgages in the Río de La Plata watershed (index number 21, fig. 3) including station 50045010 Río de la Plata below La Plata damsite, where an indirect measurement of peak streamflow was made to characterize Hurricane Maria flooding below the Lago de la Plata Dam.
Station 50045010 Río de la Plata Below La Plata Damsite
The Río de la Plata below La Plata Damsite streamgage is situated in the northern part of the Río de La Plata watershed southwest of the capital city of San Juan (fig. 6B); the drainage area is 173 mi2, of which about 0.20 mi2 probably is noncontributing. The streamgage monitors outflow from the La Plata Damsite (fig. 2.10) and has been in operation since July 1989; the streamgage elevation is 39.83 ft, referenced to PRVD02. Heavy rainfall and flooding throughout the La Plata watershed September 19–20, 2017, and flow releases from the dam caused extensive flooding in the lower watershed. The streamgage below the dam was damaged during flooding that occurred September 20, 2017, and failed to record a peak gage height for the event (fig. 2.11); the last recorded gage height was 35.38 ft (gage datum) at 08:15 Atlantic Standard Time on September 20, 2017.
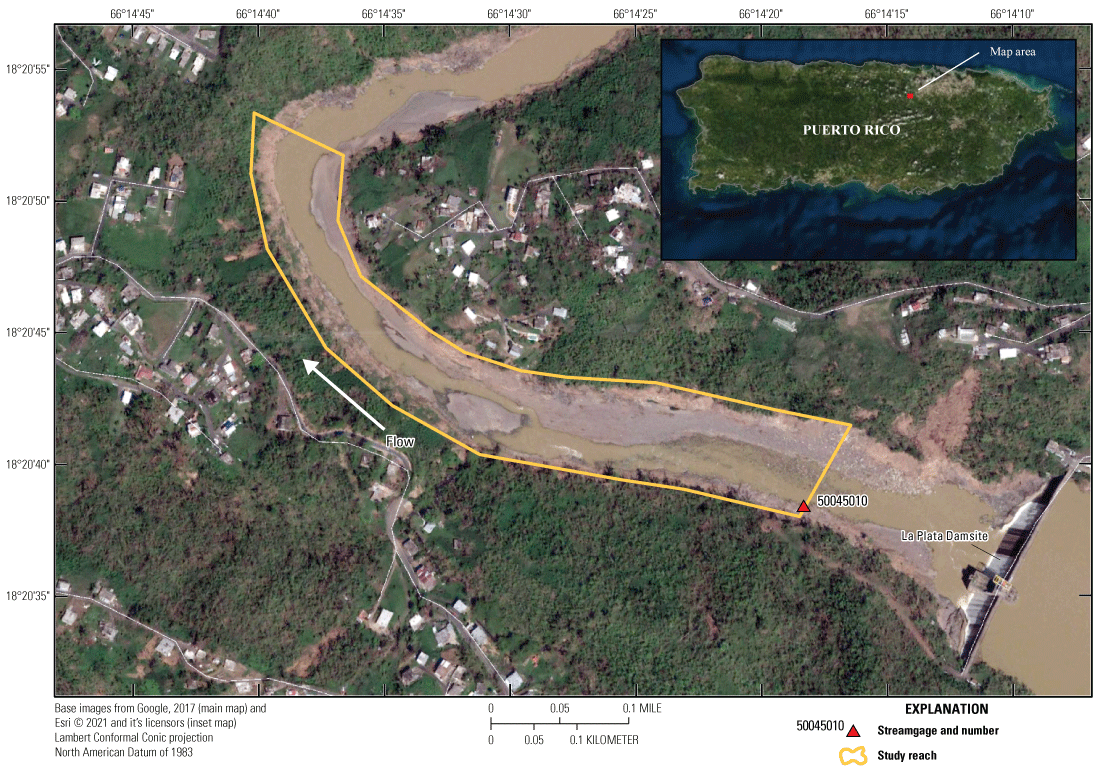
Location of study reach for slope-area measurement at station 50045010 Río de la Plata at La Plata Damsite.
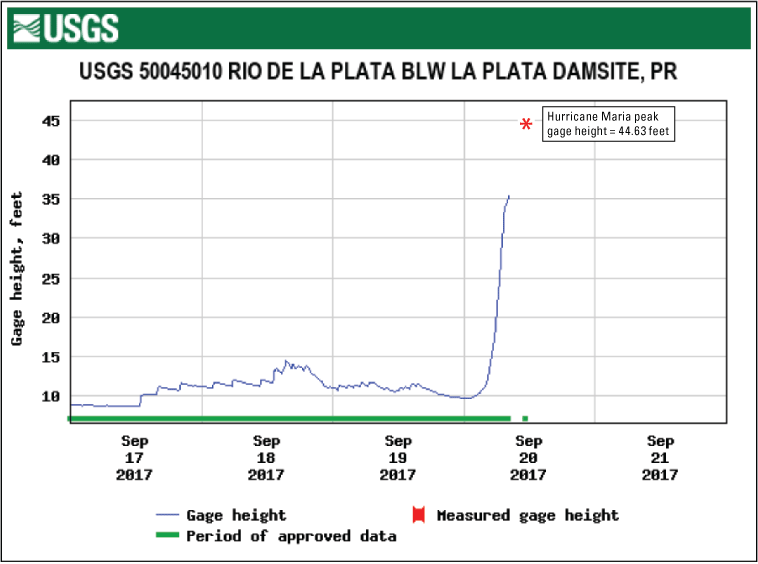
Gage-height record for station 50045010 Río de la Plata below La Plata Damsite during the period September 17–21, 2017.
USGS personnel visited the site October 21 and 25, 2017, conducted site reconnaissance, and flagged 37 HWMs in a 2,700-ft reach downstream from the streamgage (fig. 2.10). HWMs recovered near the streamgage by USGS the field crew indicated that peak gage height for the flood event was 44.63 ft (gage datum), 9.25 ft above the highest gage height previously recorded by the streamgage. Based on HWMs observed at the gage during USGS site visits and hydrographic comparison with station 50046000 Rio de La Plata at Highway 2 near Toa Alta, the Hurricane Maria peak streamflow (September 20, 2017) was determined to be the highest for the period from September 20 to October 25.
A USGS surveying team visited the site November 17–18, 2017, to survey flagged HWMs, select and survey channel cross sections, and collect other data needed for slope-area measurement. The team surveyed six cross sections in a reach (slightly shorter than that delineated by the HWMs) that extended 2,500 ft downstream from the gage. Figures 2.10, 2.12, and 2.13 show the measurement reach and channel conditions at the time field surveys were conducted.
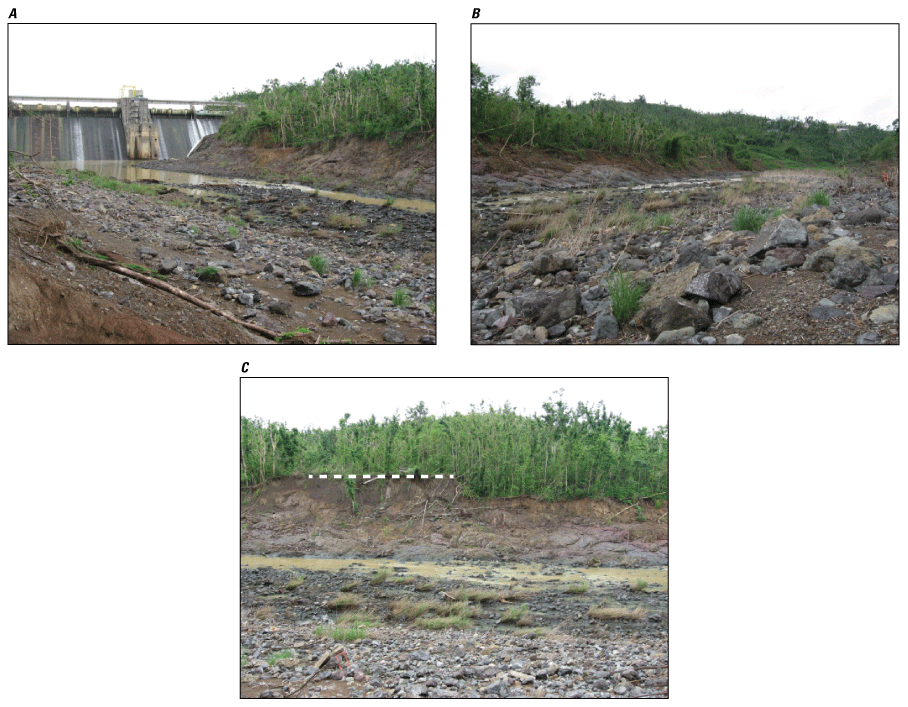
Conditions near upstream end of study reach for station 50045010 Río de la Plata below La Plata Damsite, November 18, 2017. A, View upstream near streamgage; B, view downstream near streamgage; C, view right to left at channel. White dashed line indicates approximate high-water mark level. Photographs by Mark Smith, U.S. Geological Survey.
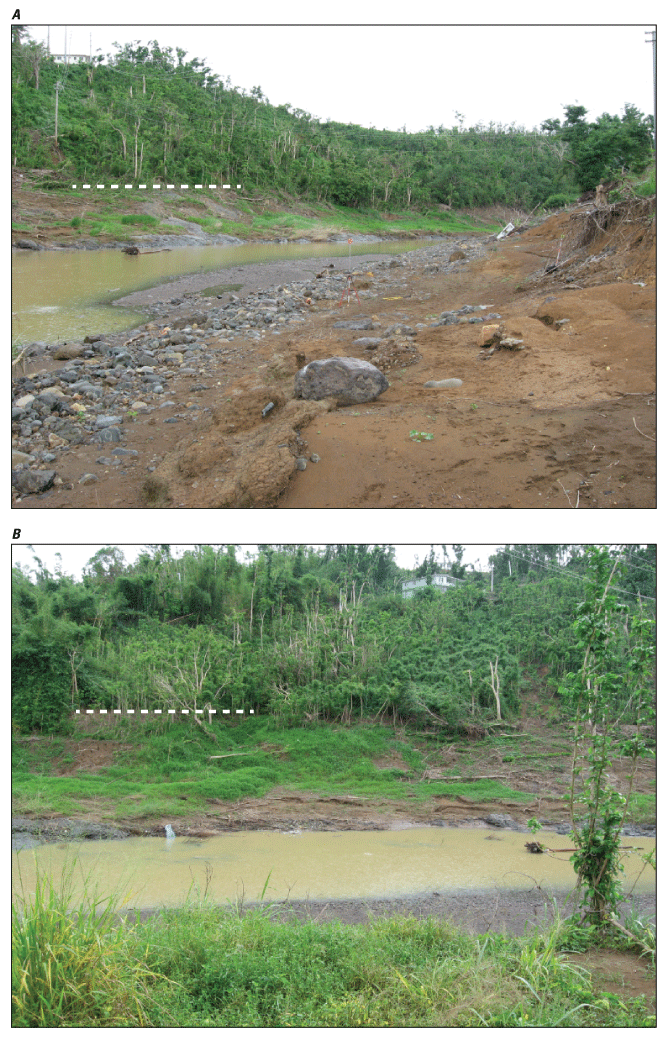
Conditions along middle part of study reach for station 50045010 Río de la Plata below La Plata Damsite, November 18, 2017. A, View downstream, B, view right to left at channel. White dashed lines indicate approximate high-water mark level. Photographs by Mark Smith, U.S. Geological Survey.
Channel bed material was composed of bedrock (in the upstream part of the reach), boulders, cobbles, and a mix of sand and gravel dispersed laterally and longitudinally; the steep left bank consisted of consolidated soil and large trees, whereas the right bank was a sheer rock wall. Undercutting and mass wasting on the left bank during the flood precluded reliable determination of HWM elevations, although some HWMs were preserved in the left overbank area in the vicinity of the streamgage. The amount of bank vegetation was characterized as negligible to small (minor) relative to channel dimensions and magnitude of flooding (Arcement and Schneider, 1989).
In the lower part of the reach, the left bank consisted of firm soil that was not prone to caving, being less steep and more stable than that of the upper part of the reach. HWMs were better preserved, including scouring of short, leafy vegetation that produced a cut line easily identifiable from a distance. Right-bank geometry was variable, consisting of bedrock, bars, and vertical earthen banks in the shoreward direction. Residential development, including homes, yards, and gardens, encroaches on the high right-bank floodplain of the river, and residents were able to direct field personnel to some very reliable HWMs. The amount of bank vegetation was characterized as small (minor) relative to channel dimensions and magnitude of flooding.
Assessed roughness values (Manning’s n-values) in the study reach ranged from 0.038 to 0.045 in the main channel and 0.060 in the overbank area, determined using the Cowan method. The furthest upstream and downstream cross sections ultimately were excluded from the final analysis because of poor computational diagnostics; final slope-area computations were based on four cross sections along a 1,449-ft reach. Computed peak streamflow for September 20, 2017, was 180,000 ft3/s (gage height of 44.63 ft, gage datum), with a rated uncertainty of ±20 percent attributed to uncertainty of observed HWMs (±0.20 to ±0.40 ft), interpretation of the water-surface profile and computational diagnostics (slope-area method assumptions). The magnitude of the Hurricane Maria peak streamflow ranks second only to that of September 10, 1996 (197,000 ft3/s) during the period of record for this site.
Western Puerto Rico
Several perennial streams flow to the west coast from the Cordillera Central (geographic region 9) and the humid northern foothills (geographic region 7) (fig. 2). Mean annual rainfall ranges from 70.00 to 89.99 in. in the foothills, with higher amounts observed in some areas of the western Cordillera (fig. 4A).
Hurricane Maria caused extensive flooding of streams on the western side of the island. Observed 48-hour rainfall totals for September 19–21, 2017, generally ranged from 5.00 to 14.99 in. (fig. 5A, B). USGS personnel conducted indirect measurements at two sites on the Río Culebrinas, which flows from the western foothills to the west coast of the island (fig. 6A). A target measurement site on the Río Grande de Añasco, which flows from the Cordillera Central to the west coast, was not suitable for indirect measurement and was analyzed in 2018 using step-backwater methods.
Station 50147800 Río Culebrinas at Highway 404 Near Moca
The Río Culebrinas at Highway 404 near Moca streamgage is situated in the middle Río Culebrinas watershed (fig. 6B) southeast of the Town of Moca (fig. 2), at an elevation of 37.1 ft, referenced to PRVD02; the contributing drainage area is 70.6 mi2. The site is about 6 mi from the west coast and is characteristic of streams that originate in the western Cordillera Central, then flow westward through the humid northern foothills geographic region. The streamgage was installed in July 1967 and operated continuously until the Hurricane Maria flooding of September 20, 2017, destroyed the Route PR–404 bridge on which the streamgage was installed (fig. 2.14A). (Route PR–404 is identified as “Highway 404” in the station name.) The last recorded gage height on September 20 was 33.18 ft at 12:00 p.m. Atlantic Standard Time (fig. 2.15). The streamgage was reinstalled August 30, 2018, following replacement of the Route PR–404 bridge.
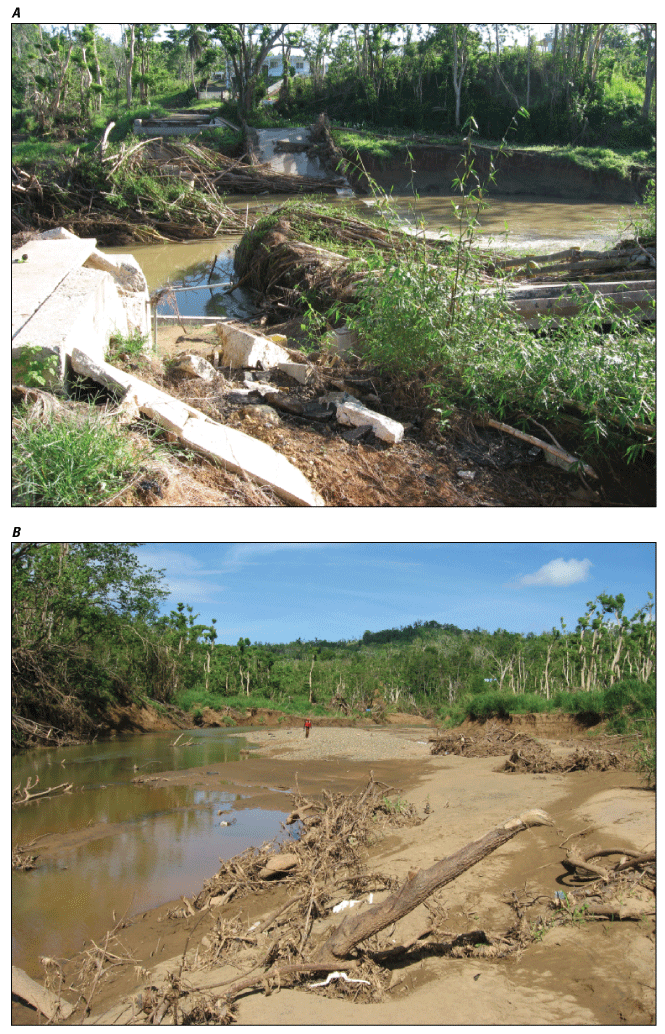
Conditions along study reach for station 50147800 Río Culebrinas at Highway 404 near Moca, November 14, 2017: A, View right to left of destroyed Highway 404 bridge where streamgage was located; B, view downstream from upstream end of study reach (600 feet downstream from streamgage). Photographs by Mark Smith, U.S. Geological Survey.
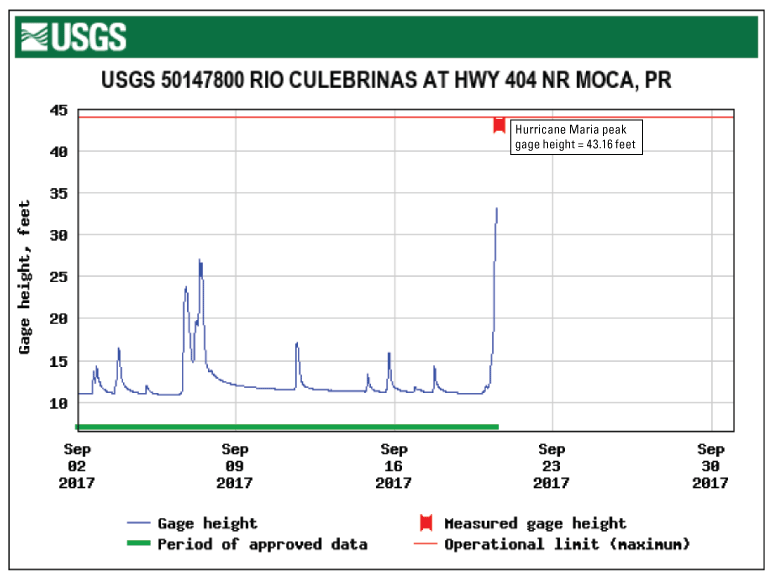
Gage-height record and event peaks for station 50147800 Río Culebrinas at Highway 404 near Moca during the period September 2–30, 2017.
USGS personnel visited the site October 23, 2017, conducted site reconnaissance, and flagged 22 HWMs (uncertainty ranging from ±0.20 to greater than ±0.40 ft) at and downstream from the streamgage; the slope-area study reach extends from about 600 to 1,600 ft downstream from the streamgage (fig. 2.16). HWMs recovered near the streamgage indicated that peak gage height for the flood event was 43.16 ft (gage datum), 9.98 ft higher than the last gage height recorded by the streamgage. Comparison of gage height and streamflow records with downstream station 50148890 Río Culebrinas at Margarita damsite near Aguada confirmed that the peak streamflow of September 20, 2017, was the highest for the period through October 23, the date USGS personnel flagged HWMs for the indirect measurement.
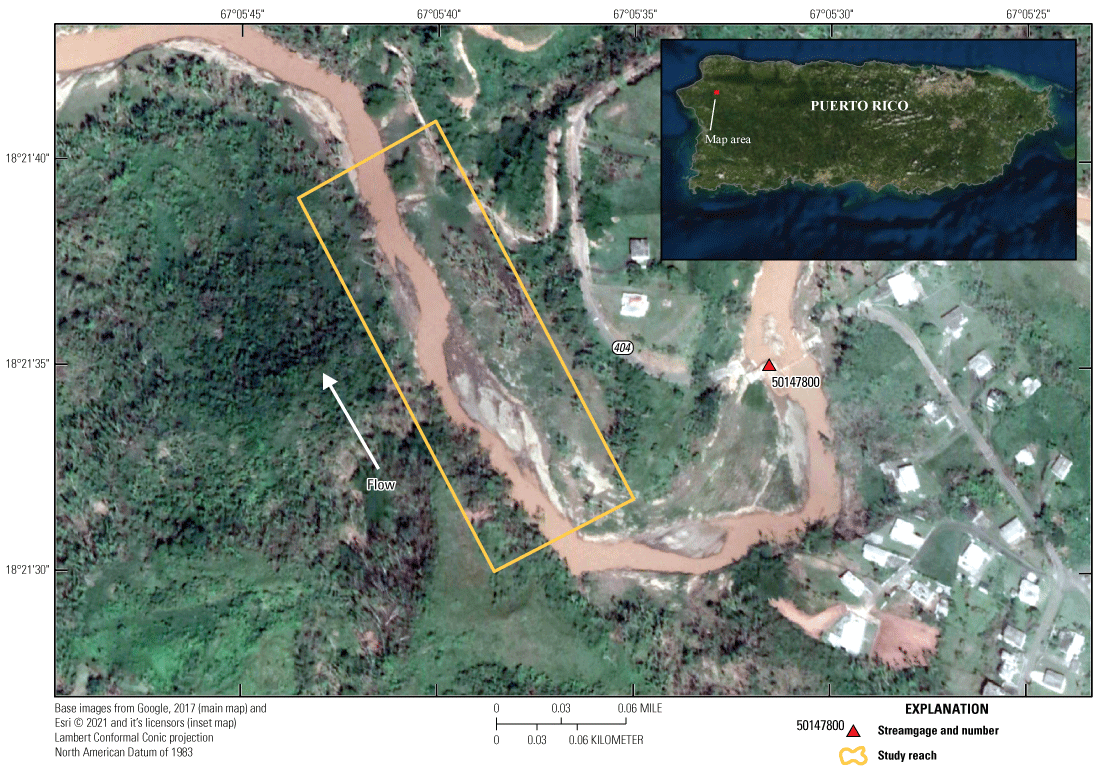
Location of study reach for slope-area measurement at station 50147800 Río Culebrinas at Highway 404 near Moca.
A USGS surveying team visited the site November 14–15, 2017, to survey flagged HWMs, select and survey channel cross sections, and collect additional data needed for a slope-area measurement. The team surveyed five cross sections along an 820-ft reach (slightly shorter than that delineated by the HWMs), starting 600 ft downstream from the streamgage. Figures 2.14, 2.16, and 2.17 show the measurement reach and channel conditions at the time field surveys were conducted.
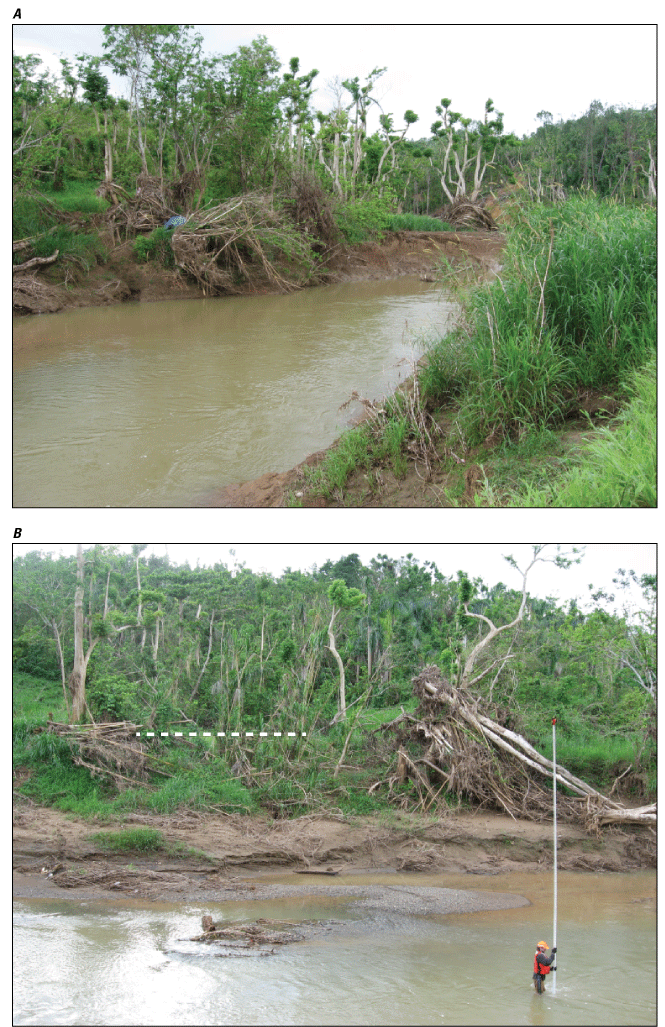
Conditions along study reach for station 50147800 Río Culebrinas at Highway 404 near Moca, November 14, 2017. A, View downstream at lower end of the study reach; B, view right to left at channel in lower part of the study reach. White dashed line indicates approximate high-water mark level. Photographs by Mark Smith, U.S. Geological Survey.
Channel bed material was composed of fine sand, silt, and clay, with some gravel. Main channel banks were steep to near vertical and were incised relative to the floodplain. The reach generally was heavily vegetated with trees, grasses, and vines on both banks, but vegetation density varied (from medium to heavy), especially along the wide, right-bank floodplain. In-channel obstructions and bank vegetation (namely tree trunks and debris snags) generally were characterized as minor, limited to the channel banks, and did not substantially influence main-channel roughness. The amount and height of vegetation in overbank areas was characterized as medium to large and judged to have a substantial effect on flow conditions (Arcement and Schneider, 1989).
Assessed roughness values (Manning’s n-values) ranged from 0.043 to 0.050 in the main channel and from 0.064 to 0.096 in the overbank areas, determined using the Cowan method. The furthest upstream cross section ultimately was excluded from the final analysis based on computational diagnostics; final computations were made using data from four cross sections along a 611-ft reach. Computed peak streamflow for September 20, 2017, was 54,100 ft3/s (gage height of 43.16 ft, gage datum), with a rated uncertainty of ±15 percent attributed to the uncertainty of observed HWMs (±0.20 to greater than ±0.40 ft), interpretation of the water-surface profile, and moderate non-uniformity of the study reach. Peak streamflow for Hurricane Maria ranks highest for the streamgage period of record (1967–2017).
Southern Puerto Rico
The geography of southern Puerto Rico is characterized by the south coastal plain (geographic region 5, fig. 2) and the semi-arid southern foothills (geographic region 6, fig. 2), both of which extend across the entire length of the island. Per Gómez-Gómez and others (2014, p. 4), “The most distinctive feature along the south coast of Puerto Rico is the marked contrast between the intense green foliage of cultivated crops grown on irrigated lands within the coastal plain and alluvial valleys and the semi-arid conditions and sparse vegetation growing within the foothills.” The semi-arid southern foothills region separates the coastal plain from the interior mountains. The southern part of the island generally receives much less rainfall than the rest of the island, with mean annual rainfall that generally ranges from 30.00 to 59.99 in. along the south coast and the foothills, and from 60.00 to 79.99 in. along the southern Cordillera (fig. 4A).
Hurricane Maria caused extensive flooding of streams on the southern side of the island, which was mostly on the southern side of the hurricane track. The 48-hour rainfall totals from Hurricane Maria generally ranged from 5.00 to 14.99 in., with heavier rainfall totals of 15.00–24.99 in. occurring in the mountainous upland areas of the Cordillera (fig. 5A). Numerous perennial streams flow from the interior mountains (geographic region 9, fig. 5A) and foothills (geographic region 6, fig. 5A) to the southern coastline, among them the Río Yauco near the Yauco Municipio and the Río Bucana near the Ponce Municipio (figs. 2 and 3). USGS personnel conducted indirect measurements at two sites in the southern part of the island (fig. 6A, B):
-
Station 50126150 Río Yauco above diversion Monserrate near Yauco
-
Station 50113800 Río Cerrillos above Lago Cerrillos near Ponce. (Details of this measurement are documented below.)
Target measurement sites on the Río Loco (west of Yauco) and the Río Jacaguas (east of Ponce) were not suitable for indirect measurement and were analyzed in 2018 using step-backwater methods.
Station 50113800 Río Cerrillos Above Lago Cerrillos Near Ponce
The Río Cerrillos above Lago Cerrillos streamgage is situated at an elevation of about 703.6 ft, referenced to PRVD02, in the mountainous upper Río Bucana watershed (fig. 6B), about 7 mi northeast of Ponce (fig. 2); the contributing drainage area is 11.9 mi2. The streamgage has been in operation since December 1988 and was operational during and after the passage of Hurricane Maria, except for a 3-hour period near the time of the peak streamflow.
USGS personnel visited the site on October 24, 2017, conducted site reconnaissance, and flagged 26 HWMs with uncertainties ranging from ±0.10 to greater than ±0.40 ft upstream and downstream from the streamgage. The slope-area study reach is about 600 ft in length, extending from 200 ft upstream to 400 ft downstream from the streamgage. Left bank HWMs documented near the streamgage indicated that peak gage height for the peak streamflow of September 20, 2017, was 15.55 ft, gage datum (fig. 2.18). Based on HWMs observed at the gage during USGS site visits and hydrographic comparison with stations 50112500 Río Inabón at Real Abajo and 50114900 Río Portugués near Tibes, the Hurricane Maria peak streamflow (September 20, 2017) was confirmed as the highest during the period from September 20 to October 24.
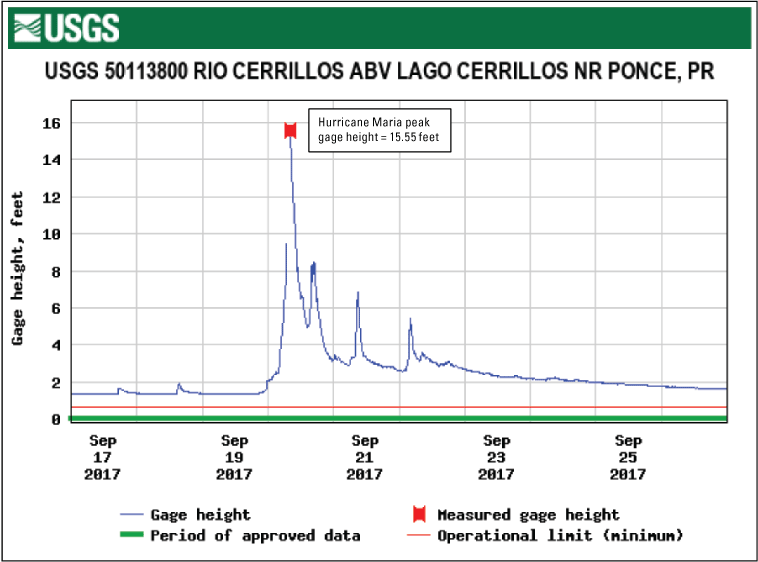
Gage-height record and event peaks for station 50113800 Río Cerrillos above Lago Cerrillos near Ponce during the period September 17-26, 2017.
A USGS surveying team visited the site November 16, 2017, to survey flagged HWMs, select and survey channel cross sections, and collect additional data needed for slope-area measurement. The team surveyed five cross sections along a 550-ft reach (slightly shorter than that delineated by the HWMs), that extended from 150 ft upstream to 400 ft downstream from the streamgage. Figures 2.19 and 2.20 show the measurement reach location and channel conditions at the time field surveys were conducted
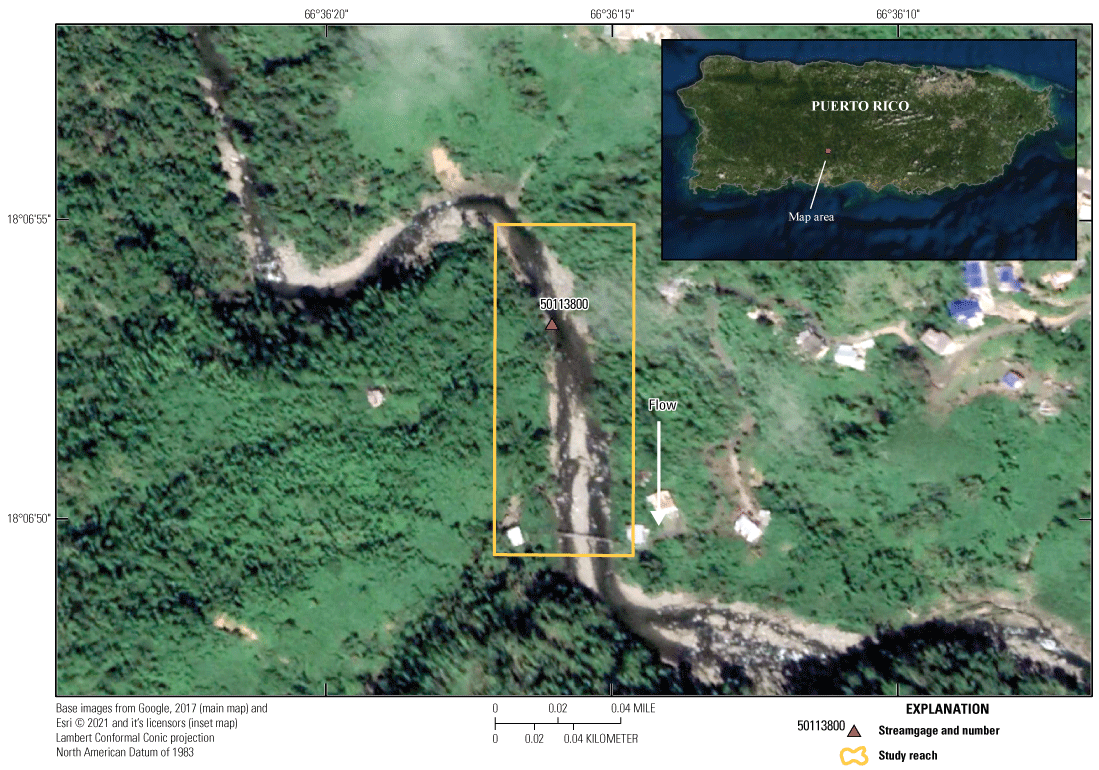
Location of study reach for slope-area measurement at station 50113800 Río Cerrillos above Lago Cerrillos near Ponce.
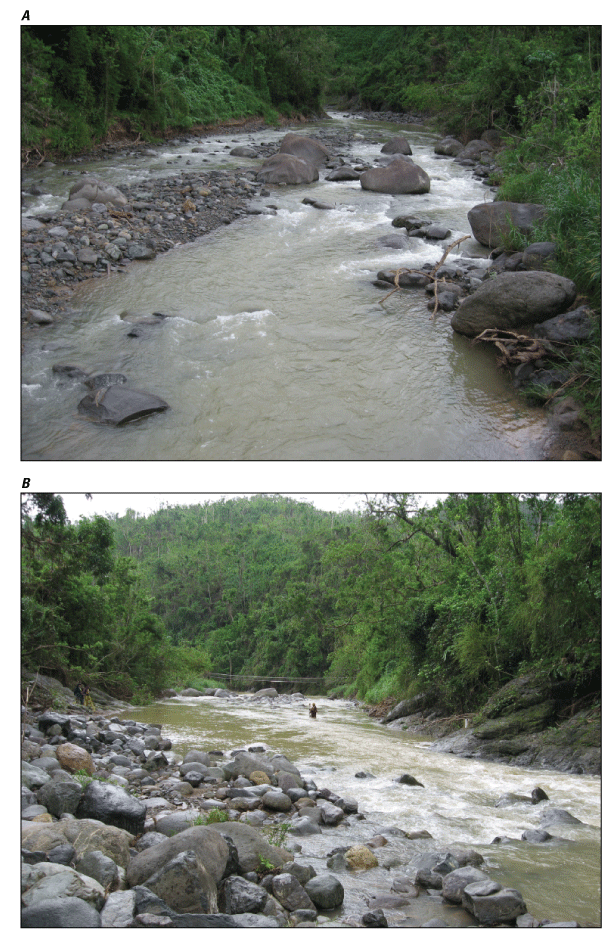
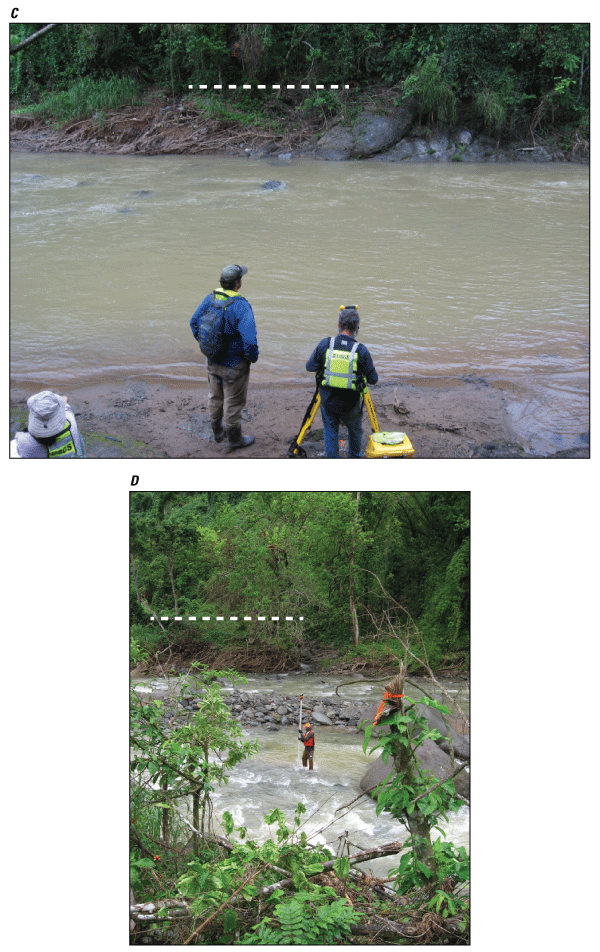
Conditions along study reach for station 50113800 Río Cerrillos above Lago Cerrillos near Ponce, November 16, 2017. A, View of study reach, looking upstream from footbridge at downstream end of reach; B, view of entire study reach, looking downstream from left bank (footbridge visible in the distance), C, view, left to right, at channel cross section in upper part of study reach, near the streamgage; D, view, left to right, at channel cross section in lower part of study reach. White dashed lines indicate approximate high-water mark level. Photographs by Mark Smith, U.S. Geological Survey.
Channel bed material was composed of large boulders, cobbles, and some gravel. The river is incised in a deep canyon; channel banks ranged from steep bedrock in the upper part of the reach to gradually sloping firm soil in the lower part of reach. Channel irregularities, variability, and obstructions (not related to bed-material composition) were characterized as negligible to minor and did not substantially influence main-channel roughness. The amount of vegetation along the banks was characterized as small to medium (Arcement and Schneider, 1989).
Assessed channel/bank roughness values (Manning’s n-values) ranged from 0.050 to 0.070. The furthest upstream cross section ultimately was removed from the final analysis based on computational diagnostics; final computations were made using data from four cross sections surveyed in a reach extending 400 ft downstream from the streamgage. Computed peak streamflow for September 20, 2017, was 16,800 ft3/s (gage height of 15.55 ft, gage datum), with a rated uncertainty of ±25 percent or greater attributed to variability and uncertainty of observed HWMs (±0.20 to greater than ±0.40 ft) and significant non-uniformity of the channel. The magnitude of the Hurricane Maria peak streamflow ranks highest for the streamgage period of record (water years 1990–2017).
Appendix 3. Development of Stage-Streamflow Relations at Selected Sites in Puerto Rico, 2018
-
50029000 Río Grande de Arecibo at Central Cambalache, PR—Low channel gradient and other site conditions were inconsistent with SBA modeling requirements. Instead, surveyed high-water marks (HWMs) were used in a two-dimensional model to compute the Hurricane Maria peak streamflow; a complete stage-streamflow rating was not developed. (See table 2 for details about the computed Hurricane Maria peak streamflow.)
-
50147800 Río Culebrinas at Highway 404 near Moca, PR—The length of the surveyed reach downstream from the bridge was insufficient for SBA model convergence. Instead, the Hurricane Maria indirect measurement was used in conjunction with historical high-streamflow information to develop a new stage-streamflow rating. (See table 2 for details about the computed Hurricane Maria peak streamflow.)
-
50025155 Río Saliente at Coabey, Puerto Rico (elevation 1,667.81 ft, referenced to PRVD02)
-
50044810 Río Guadiana near Guadiana (elevation 216.6 ft, referenced to PRVD02)
-
50067000 Río Sabana at Sabana (elevation 281.1 ft, referenced to PRVD02)
-
50144000 Río Grande de Añasco near San Sebastián (elevation 105.5 ft, referenced to PRVD02)
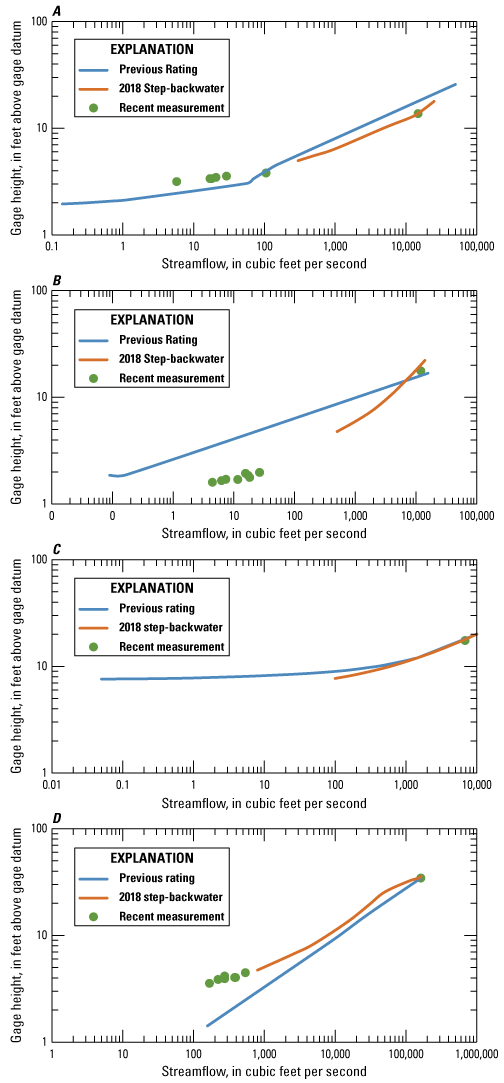
Stage-streamflow relation for stations for, A, 50025155 Río Saliente at Coabey, B, 50044810 Río Guadiana near Guadiana, C, 50067000 Río Sabana at Sabana, and D, 50144000 Río Grande de Añasco near San Sebastián, determined from 2018 step-backwater analyses, along with most recent streamflow measurements. Previous stage-streamflow relation is shown for comparison.
50025155 Río Saliente at Coabey, Puerto Rico
The Río Saliente at Coabey streamgage is situated in the rainy mountains of the west (geographic region 9, figs. 2 and 7A) and has provided stage-streamflow data since 1989. The drainage area at the streamgage is 8.86 square miles (mi2) and it is part of the Río Grande de Arecibo watershed (figs. 3 and 7B). The SBA for the streamgage was developed using seven cross sections surveyed in July 2018 along a generally straight reach extending 849 ft downstream from the gage (fig 3.2 and table 4).
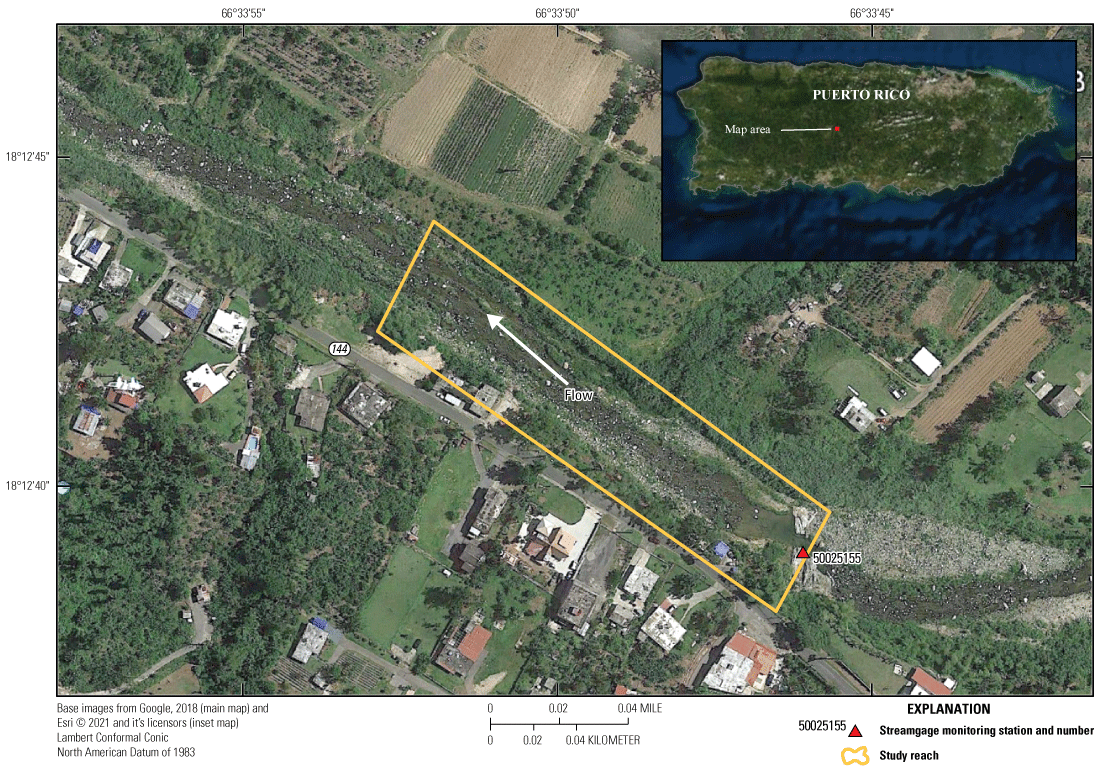
Location of study reach used for the step-backwater study at station 50025155 Río Saliente at Coabey.
The geometry of the cross sections generally is uniform throughout the reach, and bed material is composed of rock outcrops, cobbles, boulders, and tall pasture (fig. 3.3). The downstream boundary condition for step-backwater modeling (normal depth) was estimated using a slope of 0.0090 foot per foot (ft/ft), determined from thalweg elevations of the two surveyed cross sections furthest downstream and the distance between them. Manning’s n-values were determined using Cowan method (Cowan, 1956) and ranged from 0.040 to 0.065 in the main channel and from 0.040 to 0.055 in the overbank areas. The September 2017 indirect measurement—specifically, the flood of September 20, 2017, peak streamflow of 14,800 cubic feet per second (ft3/s)—was used to calibrate high streamflows in the step-backwater model (table 5). Comparison of the pre-Hurricane Maria rating curve and the 2018 SBA showed that scouring during Hurricane Maria flooding occurred mainly in the medium to high (200–20,000 ft3/s) range of streamflow (fig. 3.1A). Model results were judged to be reasonable, considering that USGS personnel observed eroded banks and minor mudslides while surveying cross sections near the gage on the right bank. Although streamflows less than 300 ft3/s were below the range of modeled streamflows (300–25,000 ft3/s), post-Hurricane Maria low-streamflow measurements indicate that the channel bed has aggraded since the Hurricane Maria flood event.
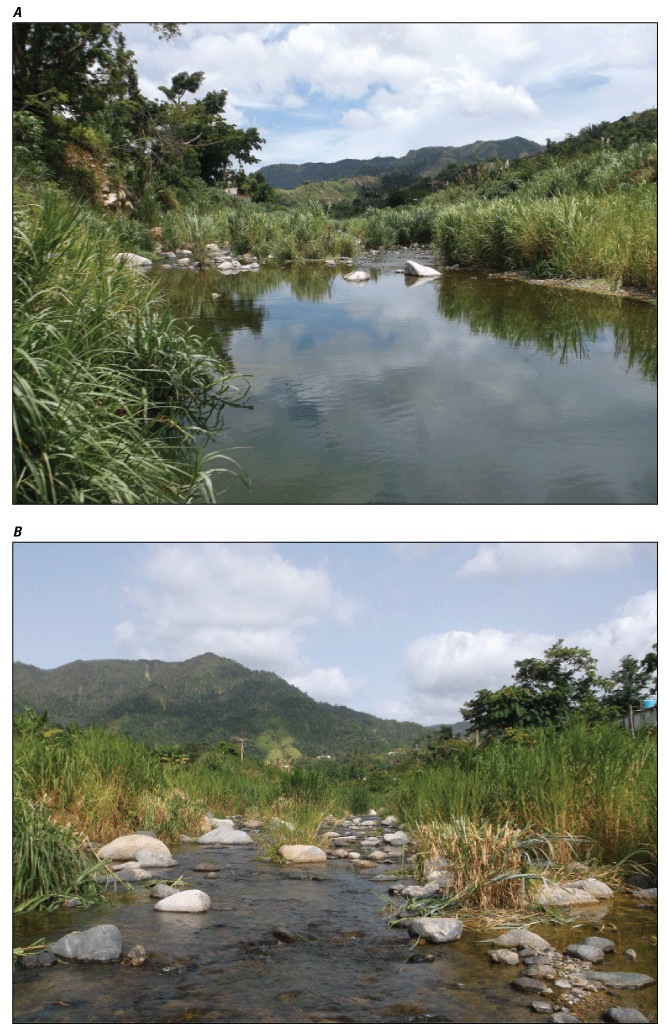
Study reach for station 50025155 Río Saliente at Coabey (July 2018). A, View downstream from the cross section furthest upstream; B, view upstream from the cross section furthest downstream. Photographs by Julieta Gómez-Fragoso, U.S. Geological Survey.
50044810 Río Guadiana Near Guadiana, Puerto Rico
The Río Guadiana near Guadiana streamgage is located 1.10 mi east of the town of Naranjito (fig. 2) in the humid northern foothills (geographic region 7; fig. 7A), and stage-streamflow data have been recorded at the site since 2001. The drainage area at the streamgage encompasses about 8.11 mi2, and it is part of Río de la Plata watershed (figs. 3 and 7B) A 10-cross-section model was used for the SBA at the streamgage. The study reach extends downstream from the streamgage about 308 ft and is generally straight, except for a minor bend to the right about 80 ft downstream from the streamgage (fig. 3.4).
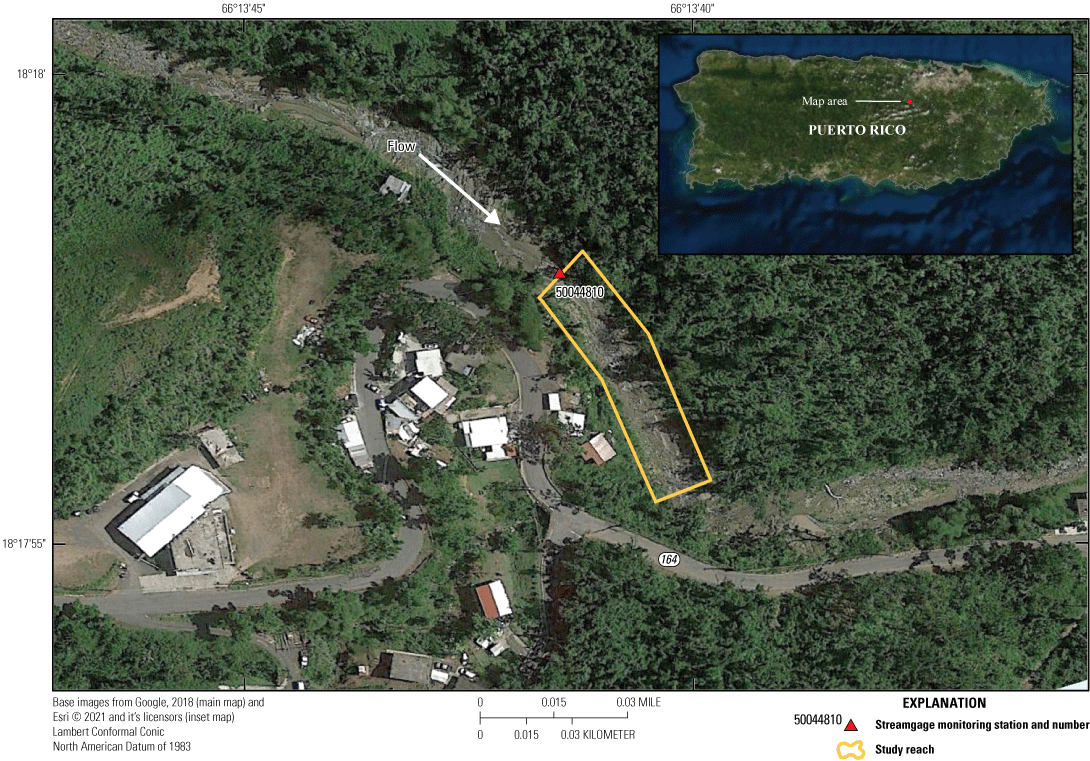
Location of study reach used for the step-backwater study at station 50044810 Río Guadiana near Guadiana.
The channel generally is uniform and trapezoidal in shape, with steep banks and no overbank streamflow. The streamgage cross section consists of shallow sand on bedrock and bedrock banks; however, the presence of boulders and cobbles in the main channel is noticeable in the downstream part of the study reach (fig. 3.5). The downstream boundary condition for the model (normal depth) was estimated using a slope of 0.0084 ft/ft, determined from thalweg elevations of the two surveyed cross sections furthest downstream and the distance between them. Vegetation in the channel consists of short grasses to a depth of about 5 ft. Heavier vegetation consisting of trees 10–30 ft tall is present on the overbank areas downstream from the streamgage. The streamgage cross section is confined by bedrock outcrops on both sides, each covered with vegetation. Field-assigned Manning’s n-values were determined using the Cowan method and later adjusted to obtain composite values ranging from 0.040 to 0.065.
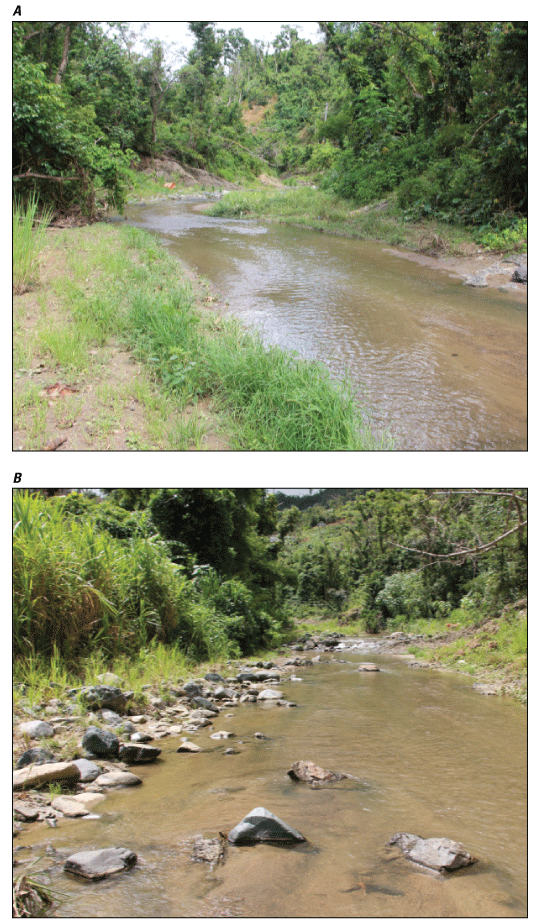
Study reach for station 50044810 Río Guadiana near Guadiana (May 2018). A, View downstream from the cross section furthest upstream; B, view upstream from the cross section furthest downstream. Photographs by Bruce Gungle, U.S. Geological Survey.
The stage-streamflow relation developed from the SBA ranges from 500 to 14,000 ft3/s, with an estimated uncertainty of ±15 to ±20 percent (based on model diagnostics and sensitivity analyses) over the range in modeled streamflows. The new stage-streamflow relation reflects significant changes from the previous rating curve (fig. 3.1B); noticeable channel scour is evident for low to medium streamflows (400–6,000 ft3/s). The step-backwater model generally is uncalibrated for the range of modeled streamflows, and additional direct or indirect measurements are needed to verify and (or) adjust the results (table 5). However, peak streamflow computed by indirect measurement for the flood of September 20, 2017 (12,000 ft3/s; uncertainty ±25 percent or greater), differed from the modeled streamflow of 9,700 ft3/s by about 24 percent, providing some corroboration of step-backwater model results in that range of streamflows. The operational stage-streamflow rating was developed with consideration for both computations.
50067000 Río Sabana at Sabana, Puerto Rico
The Río Sabana at Sabana streamgage is located about 3.3 mi south of Luquillo and is situated in the Sierra de Luquillo (geographic region 10, figs. 2 and 7A). The Río Sabana is part of the Río Herrera to Las Cabezas de San Juan watershed HUC (index number 17 in figs. 3 and 7B) and has a drainage area of 3.89 mi2. The streamgage was installed in 1979 and has been in operation for more than 30 years. The 2018 stage-streamflow rating curve was developed from hydraulic modeling using six cross sections surveyed in May 2018. The study reach bends to the left about 200 ft downstream from the streamgage, is relatively straight thereafter for about 330 ft, and then bends gradually to the right (fig. 3.6).
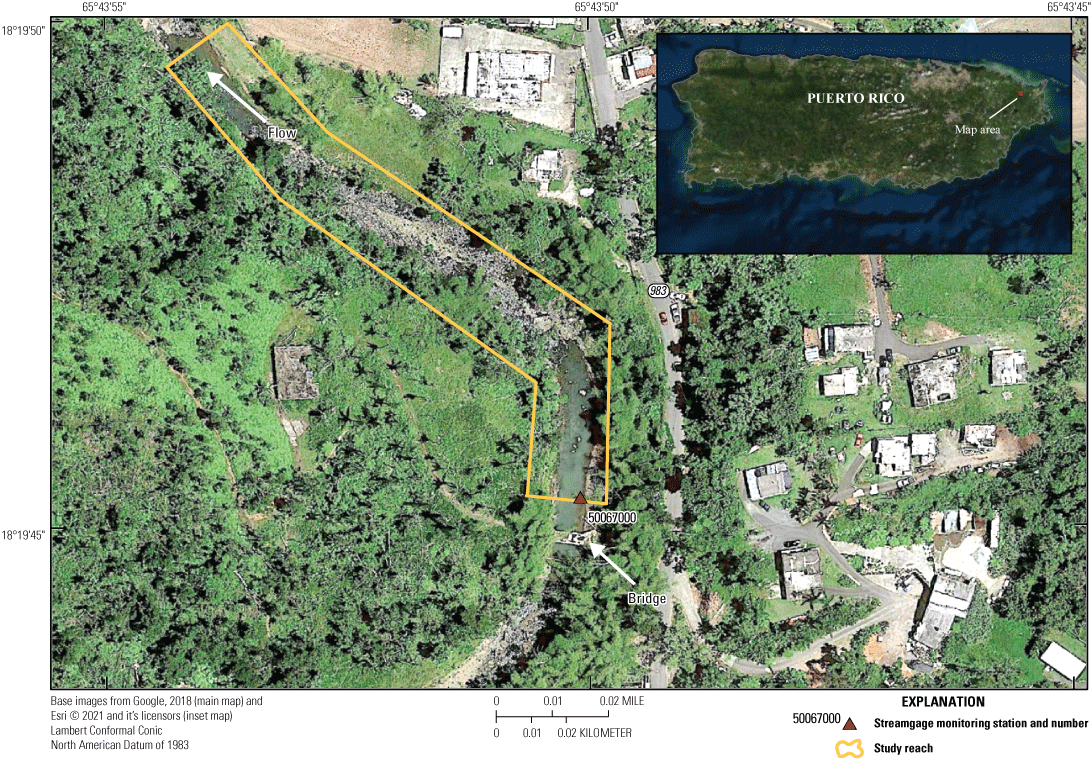
Location of study reach used for the step-backwater study at station 50067000 Río Sabana at Sabana.
Channel geometry is nonuniform (width ranging from 50 to 100 ft) throughout the reach, and bed material is primarily cobbles and sparse boulders (fig. 3.7). The downstream boundary condition for step-backwater modeling (normal depth) was estimated using a slope of 0.0095 ft/ft, estimated from a USGS quadrangle map that includes the study reach. Vegetation in the overbank areas consists of grass, brush, and trees, including a few dense stands of bamboo. Manning’s n-values were assigned by means of photographic comparison with documented roughness coefficients in Barnes (1967) and Arcement and Schneider (1989). Model calibration for high streamflows was based primarily on the indirect measurement for the peak streamflow of October 15, 2017 (6,250 ft3/s, gage height of 3.89 ft [gage datum], and rated uncertainty of ±15 percent). Manning’s n-values for the step-backwater model ranged from 0.054 to 0.072 in the main channel and from 0.090 to 0.206 in the overbank areas. Very high overbank roughness values reflect the model-calibration process and are significantly higher than values assigned during the site survey.
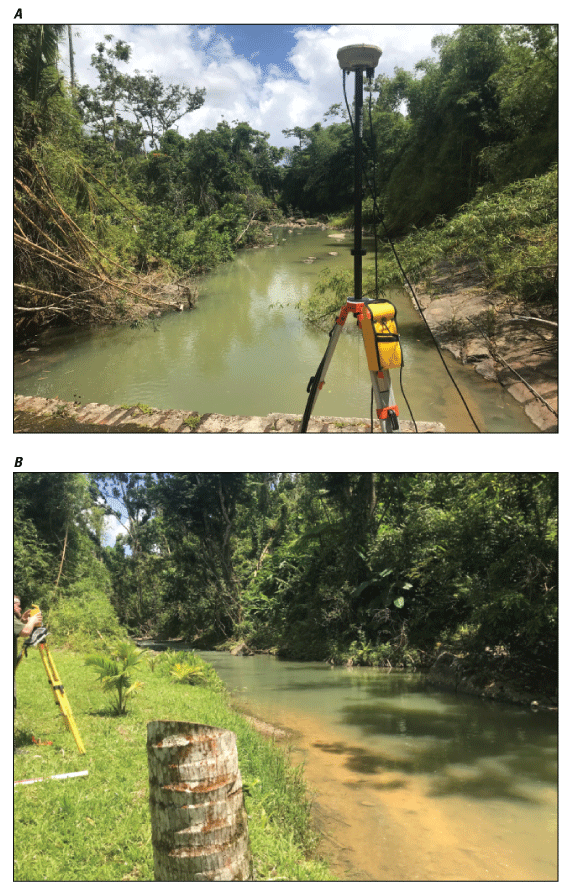
Study reach for station 50067000 Río Sabana at Sabana (May 2018). A, View downstream from the cross section furthest upstream; B, view upstream from the cross section furthest downstream. White dashed line indicates approximate high-water mark level. Photographs by Karl Winters, U.S. Geological Survey.
Prior to 2017, the streamgage was located at the bridge about 30 ft upstream from the new location; however, calibration of the new stage-streamflow relation with the 2017 indirect measurement (table 5) was determined to be valid. The step-backwater model is considered valid for streamflows greater than 2,000 ft3/s (fig 3.1C) and has an estimated uncertainty of ±15 percent for streamflows ranging from 2,000 to 10,000 ft3/s. Model uncertainty for streamflows below 2,000 ft3/s is based on (1) the inability to calibrate lower streamflows using reasonable roughness coefficients, and (2) the irregularity of channel cross sections in the study reach. Below 2,000 ft3/s, the quality of the stage-streamflow relation is based on the range and variability of direct streamflow measurements made since October 2017.
50144000 Río Grande de Añasco Near San Sebastián, Puerto Rico
The Río Grande de Añasco near San Sebastián streamgage is located at Route PR–108, about 4.4 mi northwest of the town of Las Marias (figs. 2 and 7A); the site lies in the humid northern foothills (geographic region 7, figs. 2 and 7A). The streamgage is in the Río Grande de Añasco watershed (figs. 3 and 7B) and has a drainage area of 134 mi2. The SBA was developed for a reach over 4,000 ft in length just downstream from the streamgage, which bends uniformly to the left through a full 180 degrees (fig. 3.8). The downstream boundary condition for step-backwater modeling (normal depth) was estimated using a slope of 0.0120 ft/ft, calculated from the thalweg of the two cross sections furthest downstream.
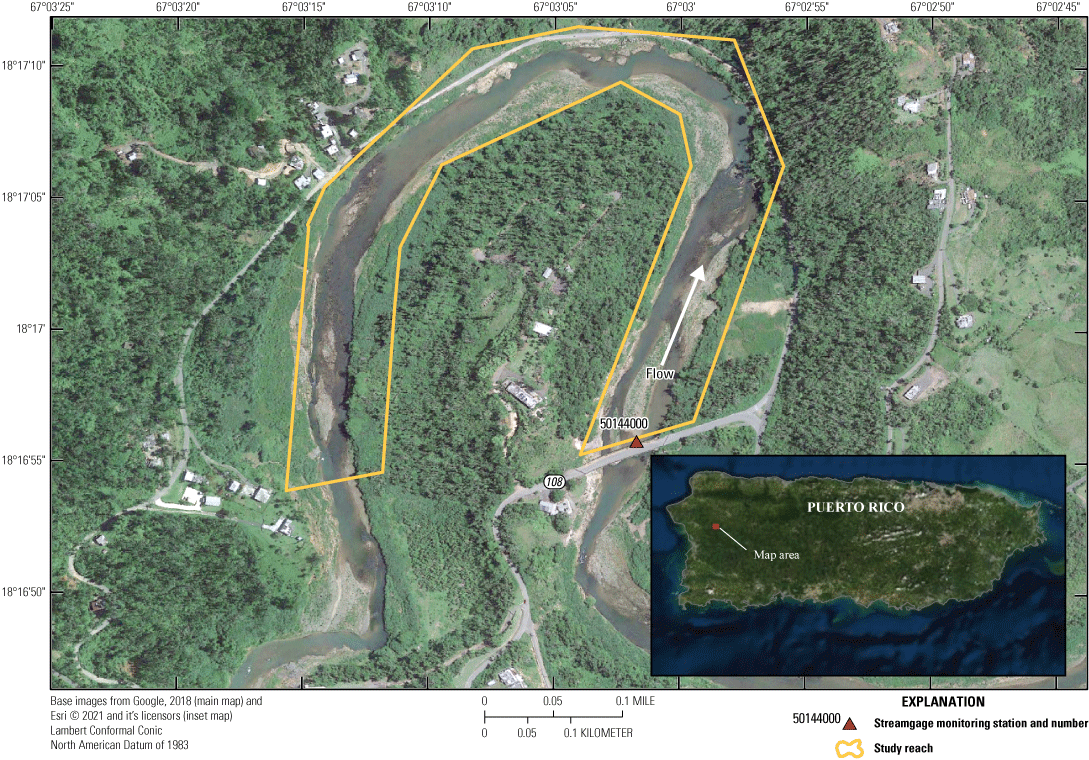
Location of study reach used for the step-backwater study at station 50144000 Río Grande de Añasco near San Sebastián.
Reach geometry was defined by at-site surveys in November 2017 and June 2018, along with some GIS-derived cross sections from lidar data. The lidar data were included to better characterize channel geometry and streamflow conditions through the bend. Except for the gage cross section, which has a rectangular shape, surveyed cross sections reflect an irregular channel geometry caused by the bend in the stream channel. The main channel consisted of a mix of rock outcrops, boulders, cobbles, and sand (fig. 3.9). A vegetated gravel bar was observed about 100 ft downstream from the gage. The entire study reach is densely vegetated, with very heavy vegetation in the left overbank area. Manning’s n-values were assigned using the Cowan method. Vertical variation in Manning’s n-values also was used in the step-backwater model to characterize the large range of stages needed for a complete stage-streamflow relation. Roughness coefficients ranged from 0.030 to 0.068 in the main channel, and from 0.034 to 0.100 in the overbank areas.
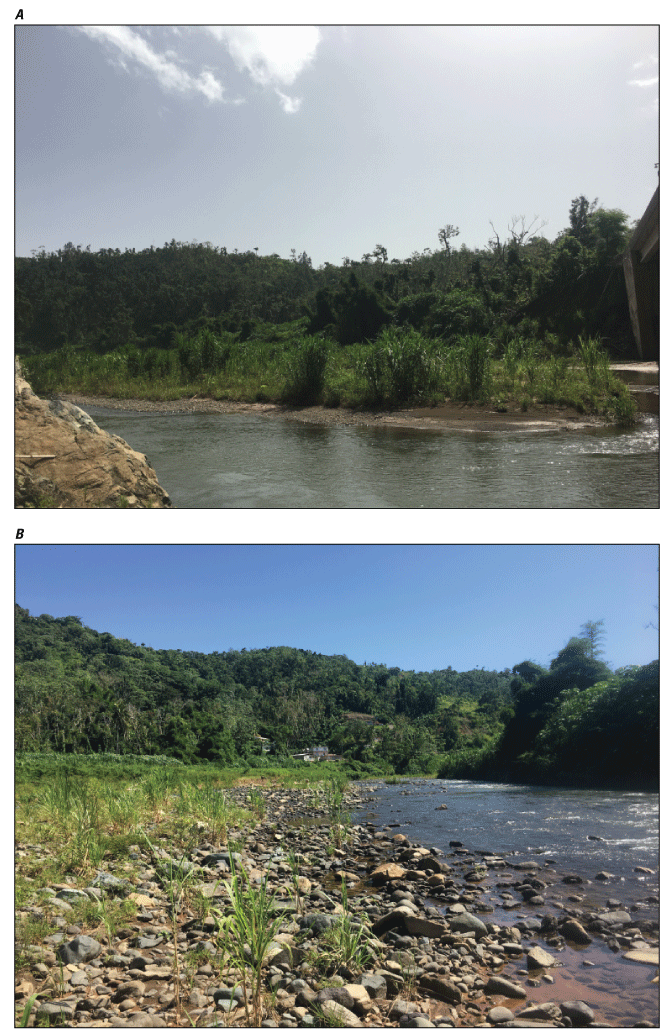
Study reach for station 50144000 Río Grande de Añasco near San Sebastián (June 2018). A, View downstream from the cross section furthest upstream; B, view upstream from the cross section furthest downstream. Photographs by Julieta Gómez-Fragoso, U.S. Geological Survey.
The streamgage stage sensor is installed on the downstream face of the Route PR–108 bridge (fig. 3.8). To account for the water-surface drawdown effects of the bridge at high streamflows, the bridge geometry and cross sections were incorporated in the model. Model analysis determined that bridge skew (estimated to be about 20 degrees) and the related drawdown through the bridge significantly affected the stage-streamflow relation for streamflows higher than 100,000 ft3/s.
Results from the step-backwater model showed significant changes when compared to the previous stage-streamflow relation. Modeling through the entire range of stage-streamflow indicated that Hurricane Maria flooding caused channel aggradation, which has been confirmed for lower streamflows by measurements made between 2017 and 2019 (fig. 3.1D). No calibration data were available to completely verify the stage-streamflow relation for medium to high streamflows (800–164,000 ft3/s); however, streamflows ranging from 800 to 5,000 ft3/s aligned well with direct measurements made at lower streamflows. This site was targeted for indirect measurement of the Hurricane Maria peak streamflow of September 20, 2017 (fig. 6A, B), but post-Hurricane Maria channel conditions were not suitable for an indirect measurement. Instead, an indirect measurement made for Hurricane Georges flooding (September 22, 1998, peak streamflow of 162,000 ft3/s) was considered in developing the post-Hurricane Maria step-backwater model. Based on the model, the peak streamflow for Hurricane Maria was estimated to be 185,000 ft3/s.
Appendix 4. 50093000 Río Marín Near Patillas (Case Study)—Continuous Slope Area Method to Determine Stage-Streamflow Relations
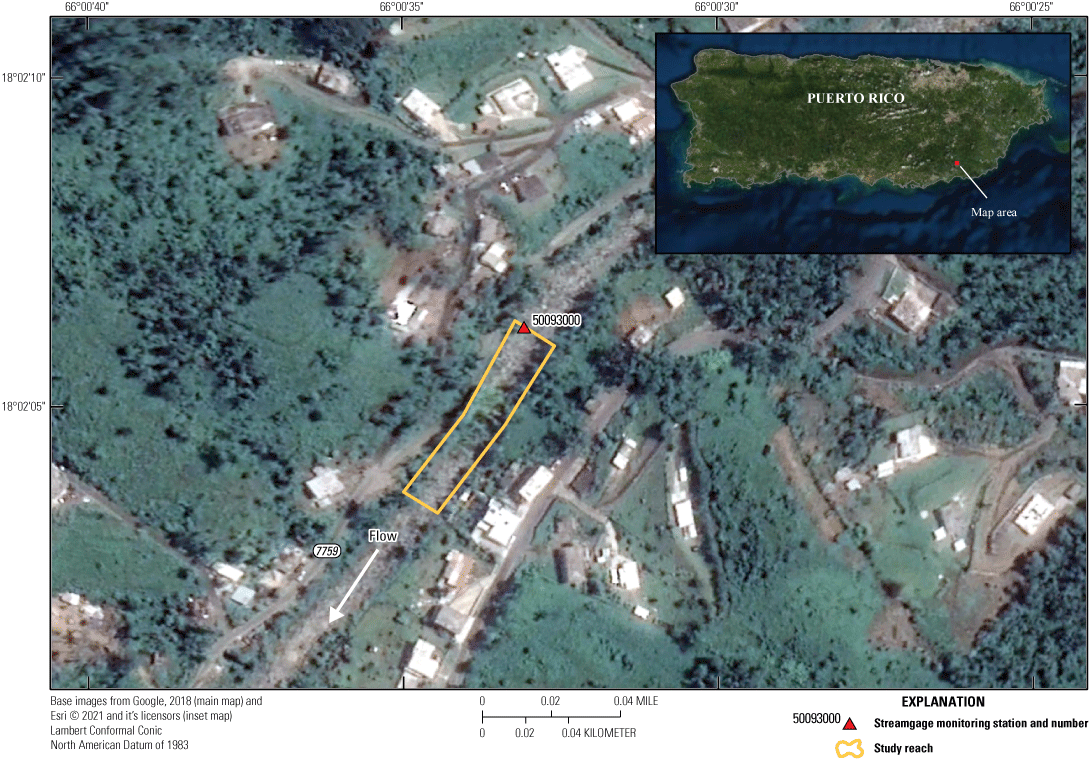
Location map of study reach at which continuous slope area sensors were installed near station 50093000 Río Marín near Patillas.
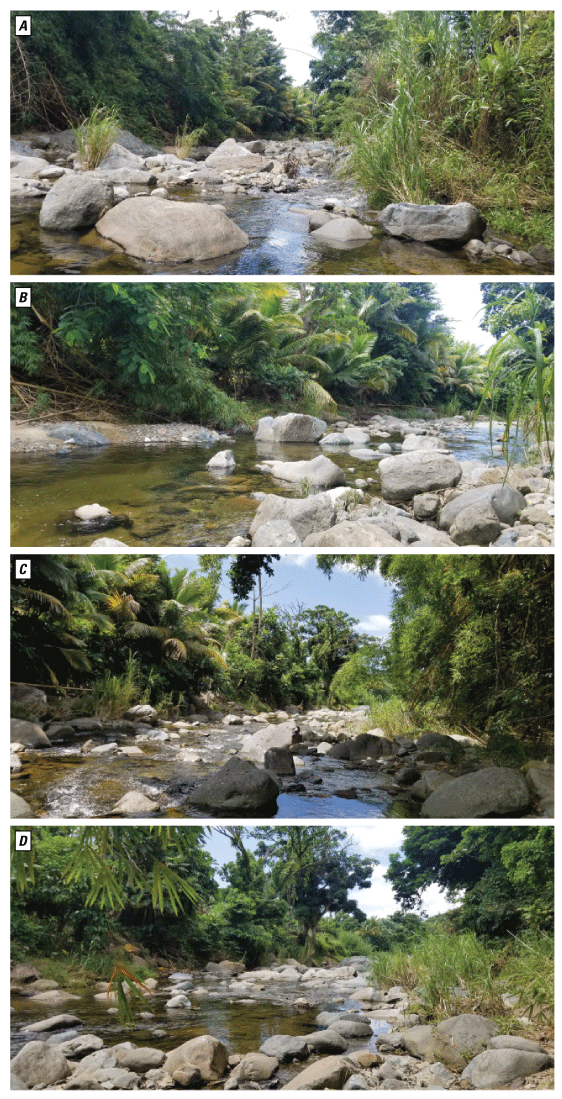
Views of study reach at continuous slope area (CSA) locations. A, CSA1, looking downstream; B, CSA2, looking downstream to the left bank; C, CSA3, looking downstream; and, D, CSA4, looking downstream at station 50093000 Río Marín near Patillas. Date of photographs is May 22, 2018. Photographs by Manuel Rosario, U.S. Geological Survey.

Pressure transducers installed at A, CSA1, B, CSA2, C, CSA3, and D, CSA4 at station 50093000 Río Marín near Patillas. Date of photographs is October 21, 2020. Photographs by Manuel Rosario, U.S. Geological Survey.
Table 4.1.
Continuous slope-area (CSA) measurements for the 2018 water year, station 50093000 Río Marín near Patillas.[mm/dd/yyyy, month, day, year; hhmm, hours, minutes. Time shown in 24-hour format. Water-surface elevations adjusted to the gage datum. ft, foot; ft3/s, cubic foot per second]
-
Independent HWMs to verify recorded stage at PTs downstream from the streamgage were not found. For the streamflow event of June 23, 2018, the only HWM that was found had an uncertainty of ±0.40 ft; therefore, collection of additional HWMs would help confirm stage values recorded by the PT at CSA1.
-
Plotted variability (scatter) of measurements between elevations of 10.30 ft and 10.62 ft above gage datum showed increasing uncertainty of computed peak streamflows in this range.
-
PTs were installed only on one side of the channel, which precluded the characterization of cross-channel variability of water-surface levels.
-
It was unclear whether drawdown conditions existed that may have affected stage data because of the location of PTs within the main channel. Further assessment will be made in the future to determine if it necessary to relocate PTs.
-
For several streamflow events, the variability of computed sub-reach streamflows (CSA pairs) exceeded 25 percent.
-
Channel geometry is not uniform throughout the reach, violating one of the assumptions needed for use of the slope-area method.
-
Uncertainties exist regarding the lower limit of streamflow threshold, meaning that additional streamflow events need to be evaluated to assess the hydraulic connectivity among cross sections in the study reach.
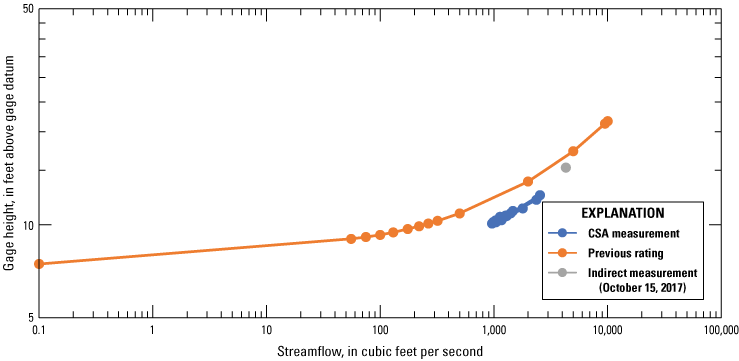
Continuous slope area (CSA) measurements for the 2018 water year, station 50093000 Río Marín near Patillas.
Appendix 5. Station Information, Peak Gage Height and Streamflow, Period of Record Rank, Number of Peak Streamflows, and Estimated Annual Exceedance Probability for Selected U.S. Geological Survey Streamgages in Puerto Rico, September 20–22, 2017
Appendix 6. Station Information, Period of Record, Number of Peak Streamflows, Historical Rank 1 Peak Streamflow and Date, and Operational Status of Site During Hurricane Maria for 181 Unregulated Sites in Puerto Rico
Conversion Factors
U.S. customary units to International System of Units
Temperature in degrees Celsius (°C) may be converted to degrees Fahrenheit (°F) as follows: °F = (1.8 × °C) + 32.
Datum
Vertical coordinate information is referenced to the Puerto Rico Vertical Datum of 2002 (PRVD02), to Puerto Rico mean sea level (the official vertical datum in Puerto Rico prior to the establishment of PRVD02), or to the gage datum, which refers to a designated vertical datum specific to each U.S. Geological Survey hydrologic monitoring station.
Horizontal coordinate information is referenced to North American Datum of 1983 (NAD 83), adjustment of 2011.
Elevation, as used in this report, refers to the distance above the vertical datum.
Supplemental Information
1Byrne (2019) documented storm-tide data and coastal and riverine high-water marks associated with Hurricane Maria.
2Ryan and others (2021) documented estimates of the magnitude and frequency of floods in Puerto Rico, including annual peak streamflows through water year 2017.
3Several flood events occurred in October and November 2017, some of which exceeded the Hurricane Maria peak streamflows of September 20–22, 2017. Determination of those peak streamflows was needed to develop new stage-streamflow relations at affected USGS streamgage sites.
4Some sites have mixed periods of unregulated and regulated peak streamflows; the number of peak streamflows used for analysis reflects regulation conditions consistent with those in effect when Hurricane Maria passed over Puerto Rico.
5Stations 50011200 and 50126150 have periods of record with more than 20 annual-peak streamflows, but peak streamflows for 1996 and 1998 were not published.
6Periods of record for sites used in the analysis vary in length and in water-year start and end dates. Analysis was based on the entire period of record for each site, as documented in table 8.
7Stations 50011200 and 50126150 have no published peak streamflows for 1996 or 1998; station 50148890 has no published peak streamflow for 1996. The rank 3 peak streamflow (1996) for station 50038320 was not associated with Hurricane Hortense and was not counted as a rank 3 occurrence in figure 10. The rank 2 peak streamflow (1998) for station 50059050 was not associated with Hurricane Georges and was not counted as a rank 2 occurrence in figure 10. The rank 2 peak streamflow (2017) for station 50114900 was not associated with Hurricane Maria and was not counted as a rank 2 occurrence in figure 10.
Abbreviations
AEP
annual exceedance probability
CORS
Continuously Operating Reference Stations
CSA
continuous slope-area
GIS
geographic information system
GNSS
Global Navigation Satellite System
GPS
Global Positioning System
HEC–RAS
Hydrologic Engineering Center’s River Analysis System
HWM
high-water mark
HUC
hydrologic unit code
iRIC
International River Interface Cooperative
lidar
light detection and ranging
NOAA
National Oceanic and Atmospheric Administration
NWISWeb
National Water Information System web interface
NWS
National Weather Service
PK
Parker-Kalon
POR
period of record
PT
pressure transducer
RTN
real-time network
RTK
real-time kinematic
SAC
Slope-Area Computation Program
SACGUI
Slope-Area Computation Program Graphical User Interface
SBA
step-backwater analysis
SToRM
System for Transport and River Modeling
USGS
U.S. Geological Survey
For more information about this publication, contact
Director, Caribbean-Florida Water Science Center
U.S. Geological Survey
4446 Pet Lane, Suite 108
Lutz, FL 33559
For additional information, visit
https://www.usgs.gov/centers/car-fl-water
Publishing support provided by
Lafayette Publishing Service Center
Suggested Citation
Gómez-Fragoso, J., Smith, M., and Santiago, M., 2022, U.S. Geological Survey response to Hurricane Maria flooding in Puerto Rico and characterization of peak streamflows observed September 20–22, 2017 (ver. 1.1, July 2022): U.S. Geological Survey Scientific Investigations Report 2022–5040, 105 p., 6 app., 1 pl., https://doi.org/10.3133/sir20225040.
ISSN: 2328-0328 (online)
Study Area
| Publication type | Report |
|---|---|
| Publication Subtype | USGS Numbered Series |
| Title | U.S. Geological Survey response to Hurricane Maria flooding in Puerto Rico and characterization of peak streamflows observed September 20–22, 2017 |
| Series title | Scientific Investigations Report |
| Series number | 2022-5040 |
| DOI | 10.3133/sir20225040 |
| Edition | Version 1.0: June 29, 2022; Version 1.1: July 13, 2022 |
| Year Published | 2022 |
| Language | English |
| Publisher | U.S. Geological Survey |
| Publisher location | Reston, VA |
| Contributing office(s) | Caribbean-Florida Water Science Center |
| Description | Report: ix, 105 p.; 6 Appendixes; 1 Plate: 33.08 × 18.40 inches; Data Release; Dataset |
| Country | United States |
| State | Puerto Rico |
| Online Only (Y/N) | Y |
| Additional Online Files (Y/N) | Y |
| Google Analytic Metrics | Metrics page |