

Potential Effects of Out-of-Basin Groundwater Transfers on Spring Discharge, Base Flow, and Groundwater Storage Pertaining to the Rush Springs Aquifer In and Near the Caddo Nation of Oklahoma Tribal Jurisdictional Area, Western Oklahoma
Links
- Document: Report (12.9 MB pdf) , HTML , XML
- Dataset: USGS National Water Information System database —USGS water data for the Nation
- Data Release: USGS data release —MODFLOW-NWT model used to simulate the potential effects of out-of-basin transfers for the Rush Springs aquifer in the Caddo Nation of Oklahoma Tribal jurisdictional area, western Oklahoma
- Download citation as: RIS | Dublin Core
Acknowledgments
The authors thank the leaders and members of the Caddo Nation of Oklahoma for making this report possible, including Polly Edwards for her assistance with data logistics and defining report objectives.
The authors appreciate the contributions of many U.S. Geological Survey staff who helped with the successful completion of this project, including assistance on developing model simulations and detailed technical reviews of this report and the associated model archive data release.
Abstract
The U.S. Geological Survey (USGS), in cooperation with the Caddo Nation of Oklahoma and Bureau of Indian Affairs, assessed four groundwater-withdrawal scenarios and their potential effects on the Rush Springs aquifer in and near the Caddo Nation of Oklahoma Tribal jurisdictional area in western Oklahoma. Increases in industrial and public water supply needs have led to increased development of water resources within the Rush Springs aquifer. As new areas within the aquifer are developed, increased water withdrawals may result in decreases in available groundwater resources and conflicts among water users.
For this study, a previously published numerical groundwater-flow model of the Rush Springs aquifer was modified to simulate the potential effects of four groundwater withdrawal scenarios. For the previously published calibrated model, groundwater flow was simulated from 1979 through 2015. In this study, groundwater flow simulations were extended through 2035. The period from 2016 through 2035 is referred to as the “20-year projection.” Four groundwater withdrawal scenarios starting in 2007 and continuing through 2035 were evaluated. Scenario 1 simulated no groundwater withdrawals; scenario 2 simulated no withdrawals allocated for out-of-basin water-use transfers; scenario 3 simulated withdrawals based on reported withdrawals during the 2007–15 simulation period and compounded annual increases in groundwater use during the subsequent 20-year projection; and scenario 4 simulated maximum permitted withdrawals for allocation to out-of-basin water-use transfers. Out-of-basin water transfers were classified as withdrawals that are not returned back to the aquifer.
At the springs of interest, changes in water-level altitudes in response to different groundwater withdrawal scenarios were simulated by comparing the results from different model cells. Between 2007 and 2015, scenarios 2–4 yielded similar simulated water-level altitudes in the model cells containing springs of interest, with water-level altitudes decreasing to below the land surface altitude at 13 of the total 25 springs of interest, whereas under scenario 1 there were only two model cells containing springs of interest where the simulated water-level altitudes of a spring decreased to below land surface altitude. For the 20-year projection, water-level altitudes at springs simulated in model cells in scenarios 2–4 decreased to below land surface altitude for 13 of the total 25 model cells containing springs of interest, whereas under scenario 1 there were only two model cells containing springs of interest where the simulated water-level altitudes of a spring decreased to below land surface altitude.
The potential effects of groundwater withdrawals were evaluated by comparing changes in groundwater storage between the four scenarios. The 2007–15 groundwater withdrawal scenarios were used to simulate the potential effects of groundwater withdrawal rates on groundwater storage of the Rush Springs aquifer. The simulated groundwater storage change in the Rush Springs aquifer ranged from an increase of 2.8 percent for scenario 1 to an increase of 1.0 percent for scenario 4. Projected 20-year groundwater withdrawal scenarios were used to simulate the potential effects of selected groundwater withdrawal rates on groundwater storage of the Rush Springs aquifer. Simulated groundwater storage changes ranged from a decrease of 0.5 percent for scenario 1 to a decrease of 0.7 percent for scenario 4.
Introduction
The Rush Springs aquifer in western Oklahoma is an important source of water for municipal, industrial, and agricultural water supply. Most of the communities overlying the aquifer rely either solely or partly on groundwater from this aquifer. Increases in industrial and public water supply needs have led to increased development of water resources within the aquifer. As new areas are developed within the surficial exposure of the rocks that contain Rush Springs aquifer, the Caddo Nation of Oklahoma wants to determine if increased water withdrawals may result in decreases in available water resources, which could lead to conflicts between water users. The Caddo Nation of Oklahoma is concerned that permitted water transfers, which began in 2007, and industrial withdrawals (Oklahoma Water Resources Board [OWRB], 2017) may cause groundwater-level altitudes to decline and thus affect water availability. Permitted water transfers and industrial withdrawals are collectively referred to as “out-of-basin water transfers” and are used to withdraw groundwater from wells completed in the Rush Springs aquifer in and near the Caddo Nation of Oklahoma Tribal jurisdictional area to areas not underlain by the Rush Springs aquifer (fig. 1). The source of water for these well withdrawals is at least partially groundwater in storage but may also be captured spring discharge or base flow. The continuation of these withdrawals may result in continued removal of groundwater from storage, declining groundwater levels, and a decrease in spring discharge and base flow in the study area. Numerous springs emanate from the Rush Springs aquifer in central and eastern Caddo County (Mashburn and Smith, 2014). These springs are important to the Caddo Nation of Oklahoma and provide a source of habitat to the local wildlife in the area. Understanding and quantifying the potential effects of these out-of-basin transfers on the Rush Springs aquifer in Caddo County would provide valuable information regarding the sustainability of the springs and help water managers in their efforts to ensure water availability for current (2021) and future water users. To better understand the potential effects that these out-of-basin transfers have on spring discharge, base flow, and groundwater storage, and to help the Caddo Nation of Oklahoma determine if the aquifer will continue to be a viable source of water to its tribal members and other local residents in the future, the U.S. Geological Survey (USGS), in cooperation with the Caddo Nation of Oklahoma and Bureau of Indian Affairs, assessed four groundwater-withdrawal scenarios and their potential effects on the Rush Springs aquifer.
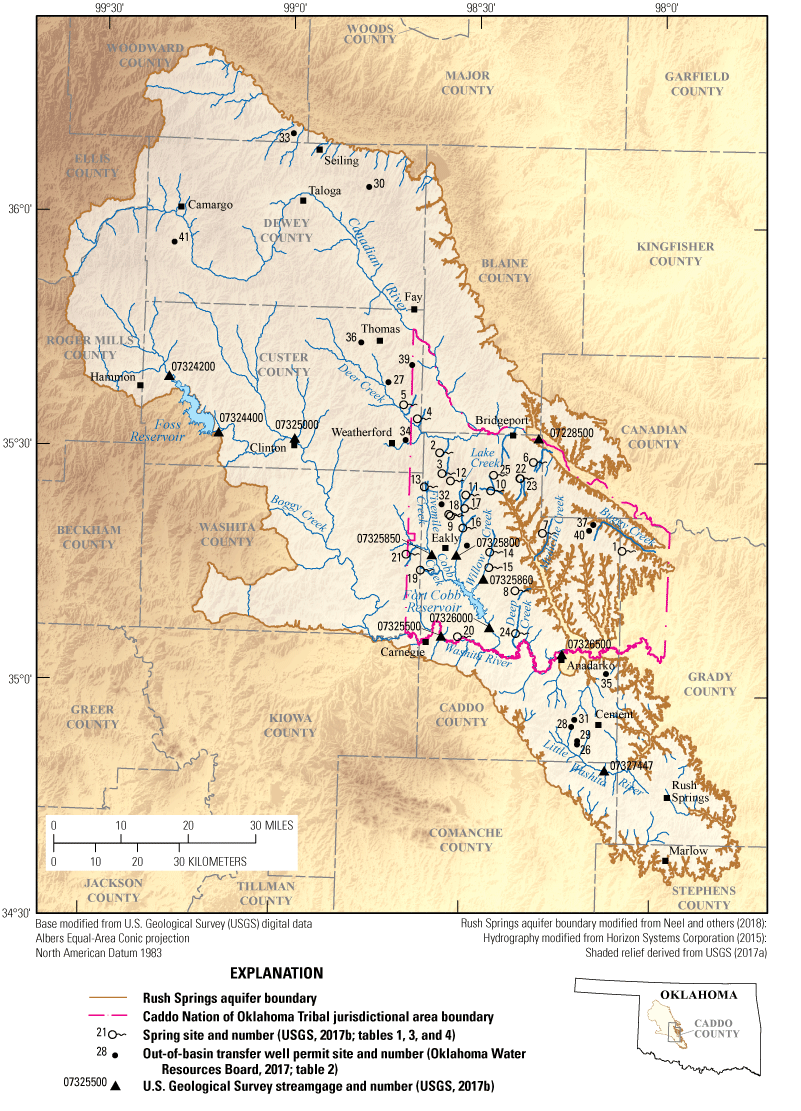
The Rush Springs aquifer study area, western Oklahoma.
Purpose and Scope
The purpose of this report is to describe the potential effects of out-of-basin water transfers from wells completed in the Rush Springs aquifer on (1) spring discharge and base flow in nearby springs and streams and (2) groundwater storage. In order to evaluate the potential effects on groundwater storage, spring discharge, and base flow, a previously published numerical groundwater-flow model (Ellis 2018a) was modified to simulate the potential effects of four groundwater-withdrawal scenarios for a 20-year projection from 2016 through 2035. Scenario 1 simulates no groundwater withdrawals; scenario 2 simulates no withdrawals allocated for out-of-basin water-use transfers; scenario 3 simulates withdrawals from 2016 through 2035 based on reported withdrawals during the 2007–15 simulation period and gradually increasing groundwater use each year during the projection period; and scenario 4 simulates maximum permitted withdrawals from the aquifer for out-of-basin transfers during the projection period. The geographic extent covered by this report is that of the Rush Springs aquifer, with an emphasis on the Caddo Nation of Oklahoma Tribal jurisdictional area. Information was obtained from the OWRB on the maximum permitted withdrawals from wells for allocation to out-of-basin water-use transfers. This report provides an assessment of the susceptibility of groundwater resources, spring discharge, and base flow originating from the Rush Springs aquifer to out-of-basin water-use transfers of groundwater withdrawals, focusing on the Caddo Nation of Oklahoma Tribal jurisdictional area.
Description of the Study Area
This section is modified from Ellis (2018b) and Ellis and others (2020). The Rush Springs aquifer underlies about 4,970 square miles in Blaine, Caddo, Canadian, Comanche, Custer, Dewey, Ellis, Grady, Kiowa, Major, Roger Mills, Stephens, Washita, and Woodward Counties (fig. 1). Groundwater withdrawals and groundwater discharges to streams sustained by the Rush Springs aquifer are an important source of water for municipal use and irrigation in the study area. Groundwater discharges provide the base flows of streams in the study area, including the streams that are the primary source of inflows to Fort Cobb Reservoir (Cobb Creek, Lake Creek and Willow Creek) (fig. 1). Groundwater discharges from the Rush Springs aquifer also contribute base flow to the Washita River, a major river in Oklahoma that flows across the study area downstream from Fort Cobb Reservoir. The physiography of the study area is characterized by gently rolling hills dissected by deep drainage channels and surface-water features. Gypsum beds in the western part of the study area create erosion-resistant caprocks that form steep-sided ledges in areas near alluvial valleys (Becker and Runkle, 1998).
Hydrogeology and Hydrology of the Study Area
This section describes the hydrogeology and hydrology pertaining to the Rush Springs aquifer and is modified from Ellis (2018b) and Ellis and others (2020). The Permian-age Dog Creek Shale of the El Reno Group underlies the Permian-age Marlow Formation of the Whitehorse Group and functions as a confining unit to the Rush Springs aquifer. In the study area, the Rush Springs aquifer is contained in the Permian-age Marlow and Rush Springs Formations of the Whitehorse Group and in Quaternary-age alluvium and terrace deposits (fig. 2) (McLachlan, 1967; Fay and Hart, 1978). In and near the Canadian and Washita Rivers and their tributaries where the intervening rock layers have been removed by erosion processes over time, the top of the Rush Springs Formation is in direct contact with Quaternary-age alluvium and terrace deposits (Tanaka and Davis, 1963).
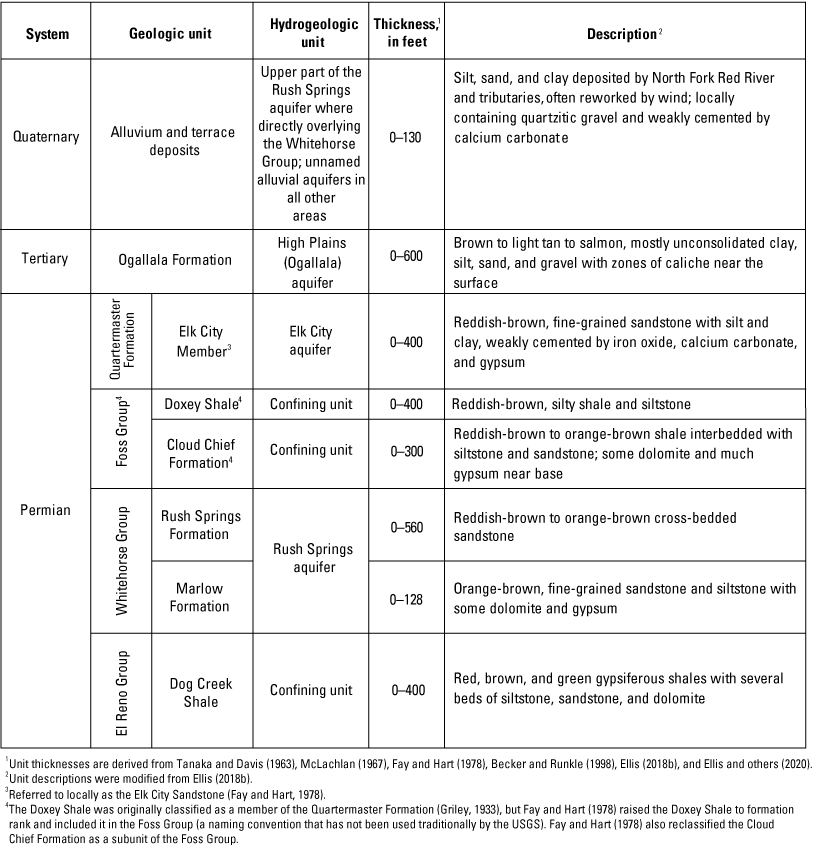
Surficial geologic and hydrogeologic units of the Rush Springs aquifer study area, western Oklahoma.
Outside the stream channels, intervening bedrock units separate the Rush Springs Formation from the alluvium and terrace deposits in most areas, including (oldest to youngest) the Permian-age Cloud Chief Formation and Doxey Shale, both of the Foss Group (Fay and Hart, 1978) and the Permian-age Elk City Member of the Quartermaster Formation (Fay and Hart, 1978). The Doxey Shale was originally classified as a member of the Quartermaster Formation (Griley, 1933), but Fay and Hart (1978) raised the Doxey Shale to formation rank and included it in the Foss Group. Fay and Hart (1978) also reclassified the Cloud Chief Formation as a subunit of the Foss Group.
Springs along the southeastern boundary of the Rush Springs aquifer are one of the primary conduits for groundwater outflows from the aquifer (Tanaka and Davis, 1963). Much of the southeastern boundary of the Rush Springs aquifer is often parallel to potentiometric-surface contours determined by Neel and others (2018), indicating that groundwater flows from the aquifer to springs along the boundary. Springs emanate from the Rush Springs aquifer along deeply incised drainage channels (Mashburn and Smith, 2014). A total of 25 discharging springs were documented during 2011 (fig. 1, table 1); however, below-mean precipitation during 2011 and several prior years precluded the detection of additional springs that likely flow during normal or wet conditions. Because the 25 springs shown in figure 1 were flowing during the drought conditions of 2011, these springs are likely perennial. These 25 springs were estimated to discharge less than 1 cubic foot per second (ft3/s) during the dry conditions described in Mashburn and Smith (2014) and might flow at an appreciably greater rate during normal or wet conditions.
Table 1.
Summary of the springs of interest emanating from the Rush Springs aquifer in and near the Caddo Nation of Oklahoma Tribal jurisdictional area, western Oklahoma.[NAVD 88, North American Vertical Datum of 1988; ID, identifier used in report figures and text, USGS, U.S. Geological Survey]
| Spring ID (fig. 1) |
USGS station number |
USGS station name |
Latitude (decimal degrees) | Longitude (decimal degrees) |
|---|---|---|---|---|
| 1 | 351829098043801 | 10N-08W-29 CCB 1 | 35.308 | −98.077 |
| 2 | 353032098340501 | 12N-13W-15 CCD 1 | 35.509 | −98.568 |
| 3 | 352753098333801 | 12N-13W-34 DCC 1 | 35.465 | −98.560 |
| 4 | 353448098374701 | 13N-13W-30 BBA 1 | 35.580 | −98.630 |
| 5 | 353634098400201 | 13N-14W-11 CCC 1 | 35.609 | −98.667 |
| 6 | 352936098190501 | 12N-11W-24 CDC 1 | 35.493 | −98.318 |
| 7 | 352033098172201 | 10N-10W-18 ADD 1 | 35.342 | −98.289 |
| 8 | 351306098213101 | 09N-11W-34 BBB 1 | 35.218 | −98.359 |
| 9 | 352229098320501 | 10N-13W-01 BBC 1 | 35.375 | −98.535 |
| 10 | 352549098254701 | 11N-12W-13 BCB 1 | 35.430 | −98.430 |
| 11 | 352512098294401 | 11N-12W-20 BAB 1 | 35.420 | −98.496 |
| 12 | 352658098321401 | 11N-13W-11 AAA 1 | 35.449 | −98.537 |
| 13 | 352607098362301 | 11N-13W-07 DDD 1 | 35.435 | −98.606 |
| 14 | 351758098254201 | 10N-12W-36 BCC 1 | 35.299 | −98.428 |
| 15 | 351559098254601 | 09N-12W-12 CBC 1 | 35.266 | −98.429 |
| 16 | 352058098300401 | 10N-12W-07 DDD 1 | 35.349 | −98.501 |
| 17 | 352328098295201 | 11N-12W-32 BBA 1 | 35.391 | −98.498 |
| 18 | 352240098322201 | 11N-13W-35 DDC 1 | 35.378 | −98.539 |
| 19 | 351526098363901 | 09N-13W-18 ACA 1 | 35.257 | −98.611 |
| 20 | 350701098302801 | 07N-12W-06 BAB 1 | 35.117 | −98.508 |
| 21 | 351725098390001 | 09N-14W-02 BAA 1 | 35.290 | −98.650 |
| 22 | 352729098210601 | 11N-11W-03 BDD 1 | 35.458 | −98.352 |
| 23 | 352730098211101 | 11N-11W-03 BDC 1 | 35.458 | −98.353 |
| 24 | 350737098211601 | 08N-11W-34 BCB 1 | 35.127 | −98.354 |
| 25 | 352750098252301 | 11N-12W-01 BAB 1 | 35.464 | −98.423 |
Although discharge data are generally unavailable for springs in the study area, previous investigations suggest that a substantial component of aquifer outflow likely occurs along the entire eastern and southeastern boundary of the Rush Springs aquifer, or effectively half of the aquifer boundary is expected to provide a substantial contribution to aquifer outflows (Tanaka and Davis, 1963). Becker (1998) used a numerical groundwater model to estimate that discharge originating from the Rush Springs aquifer to springs and small streams accounted for approximately 82 percent of aquifer outflows. However, the model in Becker (1998) covered a smaller areal extent compared to the model in Ellis (2018b) and did not differentiate discharge to springs from discharge to small streams. Based on the conceptual model from Ellis (2018b), the balance of inflows (recharge and lateral groundwater flow) and other outflows (stream seepage, evapotranspiration, and groundwater use) would account for a mean annual discharge to springs estimated at 155,507 acre-feet per year, or about 27 percent of aquifer outflows in the conceptual water budget. A complete description of the hydrogeology of the Rush Springs aquifer can be found in Ellis (2018b) and Mashburn and Smith (2014).
Potential Effects of Out-of-Basin Groundwater Withdrawals
Description of Numerical Groundwater-Flow Model
This section is modified from Ellis (2018b). A previously published MODFLOW-NWT numerical groundwater-flow model of the Rush Springs aquifer (Ellis, 2018b) was used to simulate groundwater flow and analyze projected changes in groundwater use and to simulate possible changes in groundwater levels, base flows, and spring discharges from the Rush Springs aquifer.
The model consists of three layers, each composed of 1,362 rows and 1,083 columns containing 500- by 500-foot (ft) cells. Per Banta (2014), a cell is the smallest subdivision of a finite-difference grid in the MODFLOW model of an aquifer. The Rush Springs aquifer groundwater model in Ellis (2018a) was used to simulate groundwater flow during a 37-year period from 1979 to 2015 by using 444 monthly transient stress periods with one time step each, plus an initial steady-state stress period that represents mean annual inflow and outflow. Updates to the Ellis (2018a) model described in this report include an additional 20 annual transient stress periods with 12 time steps each that represent a 20-year projection, for a total of 465 stress periods for the entire simulation period. The monthly transient stress periods were used to capture seasonally variable processes such as recharge, evapotranspiration, and groundwater use. The initial 365-day steady-state stress period represented mean annual inflows and outflows from the Rush Springs aquifer to establish initial conditions for the study period (Ellis, 2018a). More details about the model boundaries and packages are discussed in the report by Ellis (2018b). Historical observations of water-table altitude and base-flow were used by Ellis (2018b) to calibrate the groundwater model. The historical water-table altitudes from July 1979 through September 2015 that were used by Ellis (2018b) were obtained from the U.S. Geological Survey National Water Information System (USGS, 2017b). The MODFLOW modeling results described in this study are published in a companion data release (Labriola and others, 2022).
The following MODFLOW input files for the model were modified and updated accordingly:
-
Discretization Package—Added new annual stress periods for the 20-year projection scenarios.
-
Evapotranspiration and Recharge Packages—The average evapotranspiration during 1979–2015 was used for all years within the 20-year projection. The average recharge during 1979–2015 was used for all years within the 20-year projection.
-
Head Observation Package—Added parameter information for the spring locations during 2007–15 and the 20-year projection scenarios.
-
Well Package—Adjusted the withdrawal rates. This file is unique for each simulation scenario. The average simulated withdrawals used as input in the Well Package are summarized in table 2.
Table 2.
Withdrawal rates used to simulate various groundwater withdrawal scenarios in the Rush Springs aquifer during 2007–15 and during 20-year projections from 2016 through 2035.[ID, identifier used in report figures and text; acre-ft/yr, acre foot per year; OWRB, Oklahoma Water Resources Board]
| Well ID (fig. 1) |
Simulation period |
Reported withdrawals during the 2007–15 simulation period and 20-year projections of groundwater withdrawals (scenario 3)1 2 |
Maximum permitted withdrawals allocated for out-of-basin water-use transfers (scenario 4)1 |
|---|---|---|---|
| Average simulated withdrawals (acre-ft/yr)3 | |||
| 26 | 2007–15 | 0 | 960 |
| 2016–35 | 0.33 | 142 | |
| 27 | 2007–15 | 151 | 323 |
| 2016–35 | 13 | 142 | |
| 28 | 2007–15 | 16 | 94 |
| 2016–35 | 1.2 | 61 | |
| 29 | 2007–15 | 0 | 186 |
| 2016–35 | 0.3 | 142 | |
| 30 | 2007–15 | 0 | 0 |
| 2016–35 | 0.2 | 61 | |
| 31 | 2007–15 | 0 | 23 |
| 2016–35 | 0.2 | 61 | |
| 32 | 2007–15 | 0 | 23 |
| 2016–35 | 13 | 61 | |
| 33 | 2007–15 | 0 | 0 |
| 2016–35 | 1 | 61 | |
| 34 | 2007–15 | 0 | 406 |
| 2016–35 | 0 | 142 | |
| 35 | 2007–15 | 0.01 | 371 |
| 2016–35 | 0.7 | 142 | |
| 36 | 2007–15 | 0 | 17 |
| 2016–35 | 13 | 61 | |
| 37 | 2007–15 | 0 | 17 |
| 2016–35 | 8 | 61 | |
| 38 | 2007–15 | 0 | 17 |
| 2016–35 | 1 | 61 | |
| 39 | 2007–15 | 0 | 180 |
| 2016–35 | 13 | 81 | |
| 40 | 2007–15 | 403 | 1,027 |
| 2016–35 | 3 | 85 | |
| 41 | 2007–15 | 0 | 13 |
| 2016–35 | 2.2 | 61 | |
Scenarios 3 and 4 include compounded annual increases in groundwater withdrawals during the 20-year projection that sum to a 6.25-percent increase in withdrawals by 2035 compared to 2015 (Labriola and others, 2022) based on a projected cumulative 38-percent increase in groundwater withdrawals during 2010–60 (OWRB, 2012).
Groundwater withdrawal data were obtained from OWRB (2017).
Description and Results of Simulated Scenarios
To simulate the potential effects of groundwater withdrawals on the Rush Springs aquifer, the previously published model of the Rush Springs aquifer (Ellis, 2018a) was adjusted to simulate different groundwater withdrawal scenarios. For the previously published calibrated model, groundwater flow was simulated from 1979 through 2015. In this study, groundwater flow was simulated through 2035. Four groundwater withdrawal scenarios starting in 2007 and continuing through 2035 were evaluated. The period from 2016 through 2035 is referred to as the “20-year projection.” Scenario 1 simulated no groundwater withdrawals; the scenario 2 simulated no withdrawals allocated for out-of-basin water-use transfers; the scenario 3 simulated withdrawals based on reported withdrawals during the 2007–15 simulation period and compounded annual increases in groundwater use during the subsequent 20-year projection; and scenario 4 simulated maximum permitted withdrawals for allocation to out-of-basin water-use transfers. Out-of-basin water-use transfers were classified as withdrawals that are not returned back to the aquifer. Scenarios 3 and 4 were based on compounded annual increases in groundwater withdrawals during 2016–35 that sum to a 6.25-percent increase by 2035 compared to 2015 (Labriola and others, 2022). The compounded annual increases in groundwater withdrawals are derived from a projected cumulative 38-percent increase in groundwater withdrawals during 2010–60 for western Oklahoma (OWRB, 2012). The model stresses (projected recharge and evapotranspiration) for the 20-year projections were configured as the mean values in each month from the calibrated model (Ellis, 2018a). The model stresses were applied at the same rate for each year, and the scenarios assumed that the climate conditions through 2035 for the 20-year projections were similar to the climate conditions during the 1979–2015 simulation period from 2016 through 2035.
Drawdowns
Scenario 1 was used to simulate the potential effects of not withdrawing groundwater from the aquifer during 2007–15 and then projecting no withdrawals for 20 years from 2016 through 2035. This scenario is meant to represent pre-groundwater-development conditions. Simulated water-level altitudes for scenario 1 and drawdowns for scenarios 2–4, from the centroid of the model cell, are summarized in tables 3 and 4.
Table 3.
Simulated water-level altitudes for scenario 1 and drawdowns for scenarios 2–4 at the end of 2015 determined by using the model cells containing springs of interest emanating from the Rush Springs aquifer in and near the Caddo Nation of Oklahoma Tribal jurisdictional area, western Oklahoma.[ID, identifier used in report figures and text; NAVD 88, North American Vertical Datum of 1988]
Table 4.
Simulated water-level altitudes in scenario 1 and drawdowns in scenarios 2–4, at the end of the 20-year projection (2035) determined by using model cells containing springs of interest emanating from the Rush Springs aquifer in and near the Caddo Nation of Oklahoma Tribal jurisdictional area, western Oklahoma.[ID, identifier used in report figures and text; NAVD 88, North American Vertical Datum of 1988]
Scenario 2 was used to simulate the potential effects of no groundwater withdrawals from the wells listed in table 2. In this scenario, the Well Package in the previously published model was modified to simulate a lack of withdrawals at any of the wells dedicated exclusively to out-of-basin transfers. Simulated water-level altitudes associated with scenario 2 ranged from 9 ft above to 9 ft below the water-level altitudes simulated in scenario 1 representing no-groundwater-withdrawals (table 3). A reduction in spring discharge associated with groundwater withdrawal is indicated in 5 of the 25 model cells containing springs of interest, with the largest drawdown simulated at spring 5 (table 3). Figure 3 shows the spatial distribution of simulated drawdowns for the model domain at the end of 2015 for scenario 2. The range of simulated drawdowns for the model domain for the springs and well model cells was 0.1–6.5 ft. The largest drawdowns of 6.5 ft were simulated in Custer County near well 36.
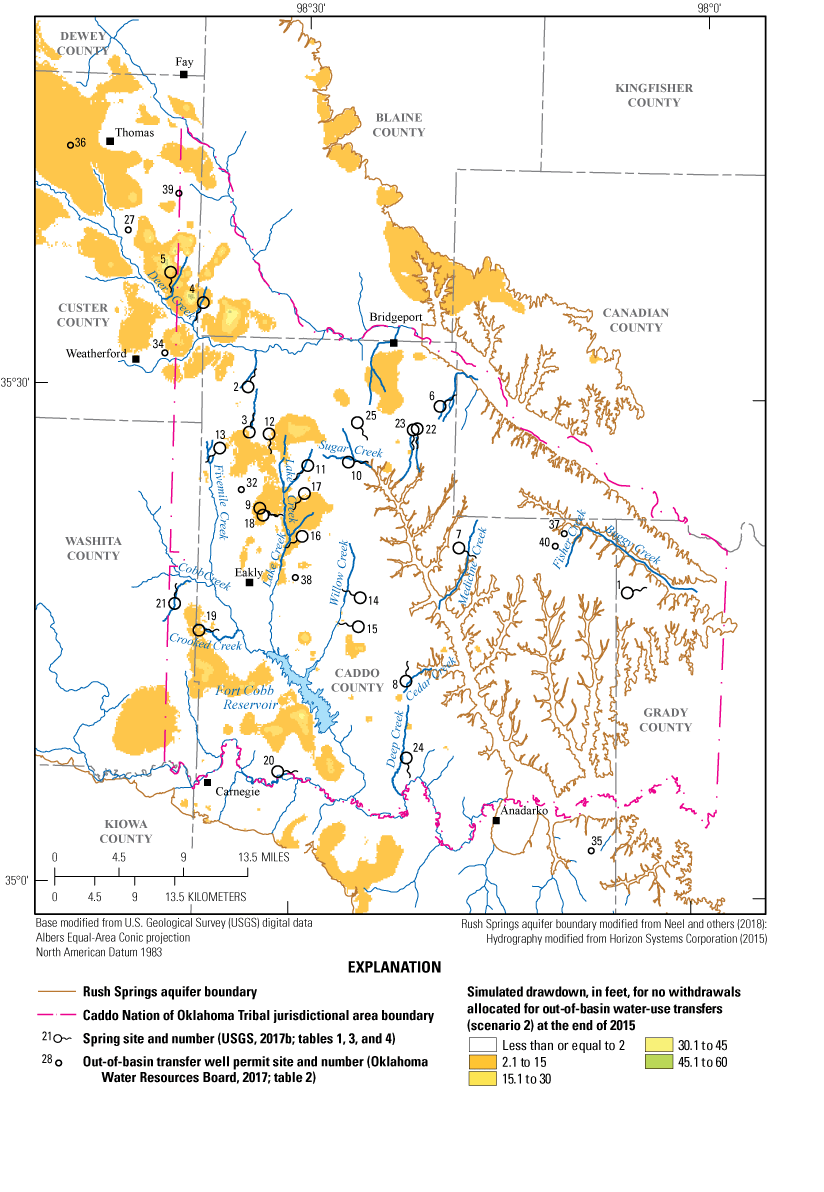
Spatial distribution of simulated drawdowns at the end of 2015 for scenario 2 (no withdrawals allocated for out-of-basin water-use transfers) for the Rush Springs aquifer study area, western Oklahoma.
Simulated water levels associated with the 20-year projection for scenario 2 ranged from 1 ft above and 11 ft below the water-level altitudes simulated in scenario 1 (table 4). A reduction in spring discharge associated with groundwater withdrawal is indicated in 16 of the 25 model cells containing springs of interest, with the largest drawdown simulated at spring 5. Figure 4 shows the spatial distribution of simulated drawdowns for the part of the model domain within the Caddo Nation of Oklahoma Tribal jurisdictional area at the end of 2035 for scenario 2. The range of simulated drawdowns for the model domain for the springs and well model cells was 0.1–7.2 ft. The largest drawdown of about 7 ft was simulated in Custer County by Deer Creek near well 34 (fig. 4).
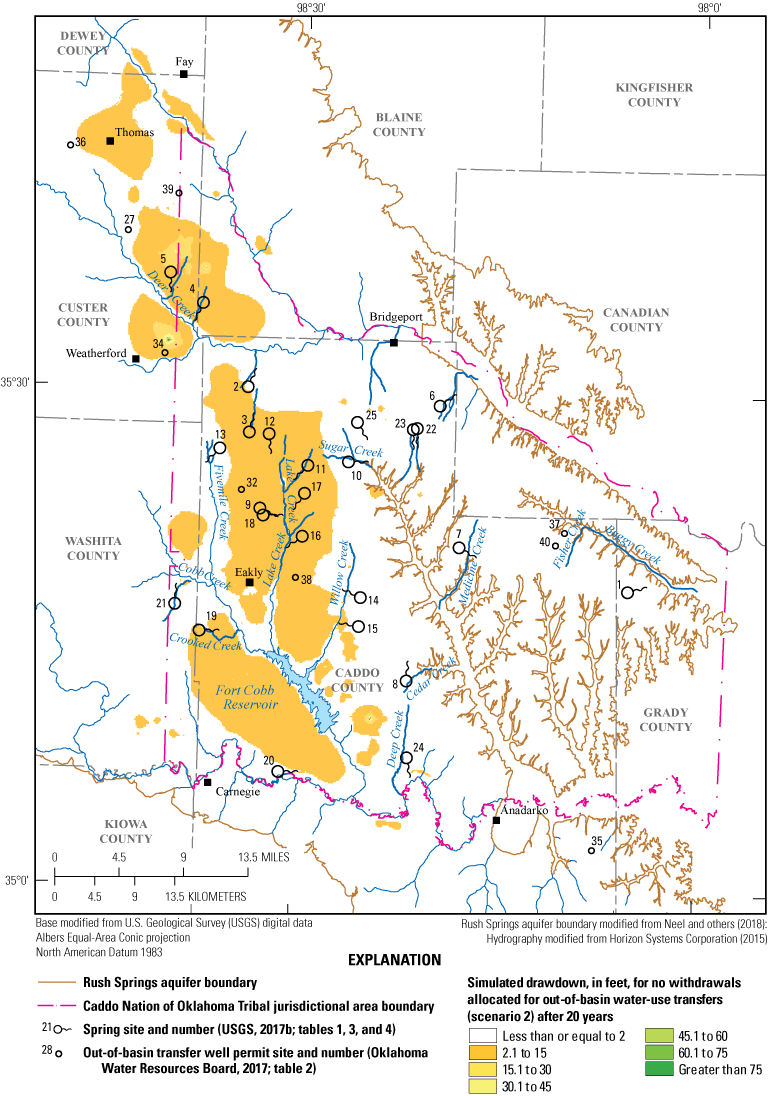
Spatial distribution of simulated drawdowns after 20 years for scenario 2 (no withdrawals allocated for out-of-basin water-use transfers) for the Rush Springs aquifer study area, western Oklahoma.
Scenario 3 was used to simulate reported groundwater withdrawals during 2007–15 based on values derived from the calibrated model (Ellis, 2018a) and withdrawals for the 20-year projection based on compounded annual increases in groundwater use. Simulated drawdowns for scenario 3 during 2007–15 ranged from 9 ft above scenario 1 to 9 ft below the water-level altitudes simulated in scenario 1 (table 3). A reduction in spring discharge associated with groundwater withdrawal is indicated in 5 of the 25 model cells containing springs of interest, with the largest drawdown simulated at spring 5. These results are similar to those for scenario 2 for the 2007–15 simulation. The range of simulated drawdowns for the model domain for the springs and well model cells was 0.1–46 ft, and the largest drawdown of 46 ft was simulated in Caddo County in proximity to Fisher Creek at out-of-basin transfer well 40 (figure 5).
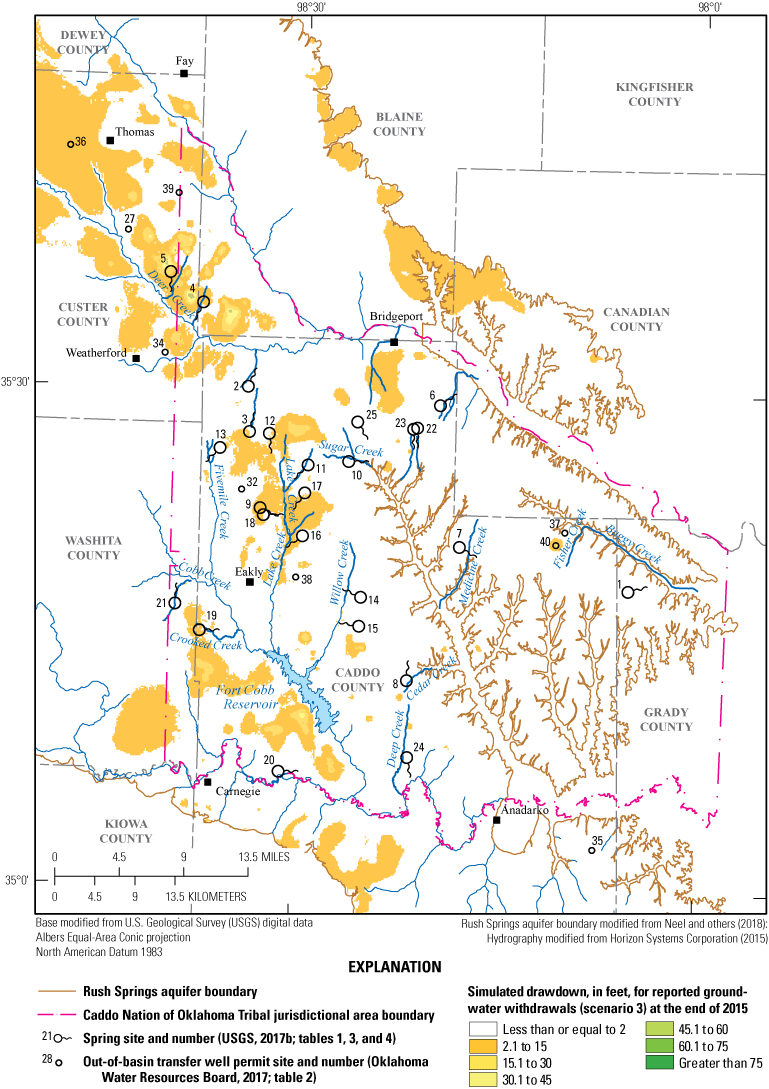
Spatial distribution of simulated drawdowns at the end of 2015 for scenario 3 (reported groundwater withdrawals) for the Rush Springs aquifer study area, western Oklahoma.
Simulated drawdowns associated with 20-year projections for scenario 3 ranged from 1 ft above to 11 ft below the water-level altitudes simulated in scenario 1 (table 4). A reduction in spring discharge associated with groundwater withdrawal is indicated in 17 of the 25 model cells containing springs of interest, with the largest drawdown simulated at spring 5, in proximity to out-of-basin transfer wells 27 and 34. These results are similar to those for scenario 2 for the 20-year projection simulation. The range of simulated drawdowns for the model domain for the springs and well model cells was 0.1–56 ft, and the largest drawdown of 56 ft was simulated in Custer County at out-of-basin transfer well 39 (fig. 6).
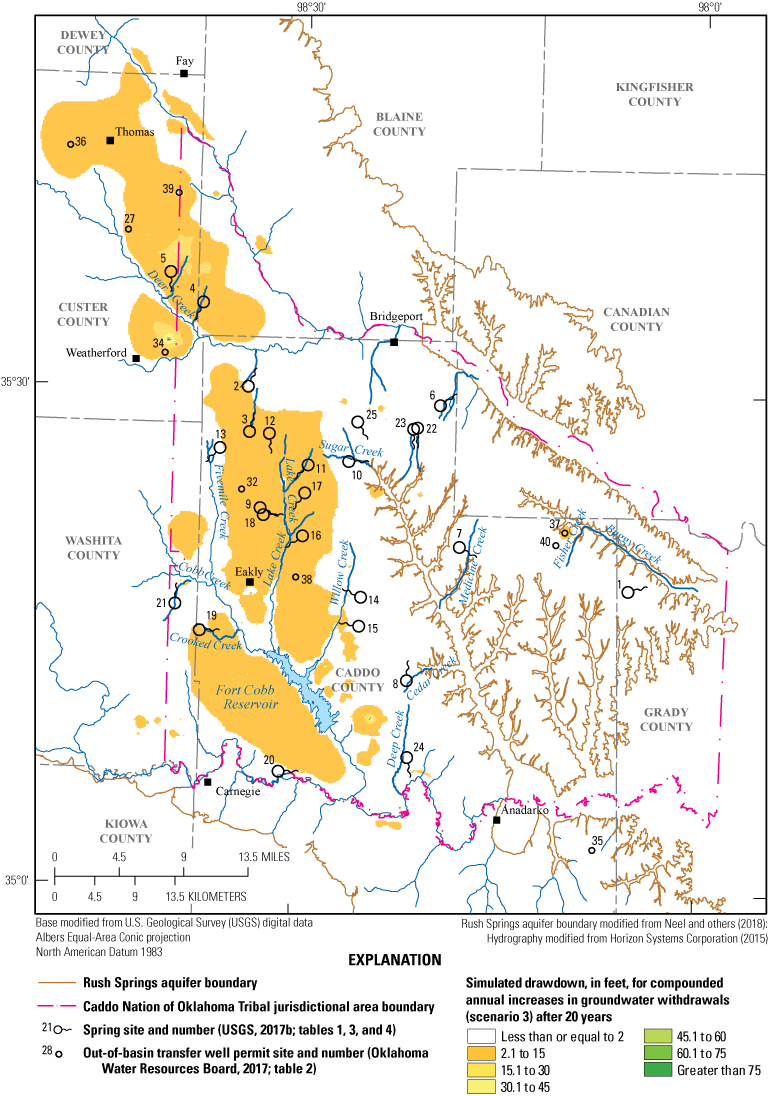
Spatial distribution of simulated drawdowns after 20 years for scenario 3 (compounded annual increases in groundwater use) for the Rush Springs aquifer study area, western Oklahoma.
Scenario 4 was used to simulate the potential effects of maximum permitted withdrawals allocated for out-of-basin water-use transfers. Simulated drawdowns associated with scenario 4 during 2007–15 ranged from 9 ft above to 9 ft below the water-level altitudes simulated in scenario 1 (table 3). A reduction in spring discharge associated with groundwater withdrawal is indicated in 5 of the 25 model cells containing springs of interest, with the largest drawdown simulated at spring 5, likely the result of their proximity to the out-of-basin transfer wells. These results are similar to those for scenario 3 for the 2007–15 simulation. Figure 7 shows the spatial distribution of simulated drawdowns for the model domain. The range of simulated drawdowns for the model domain for the springs and well model cells was 0.1–100 ft, and the largest drawdown of about 100 ft was simulated in Caddo County in proximity to Fisher Creek at out-of-basin transfer well 40 (fig. 7).
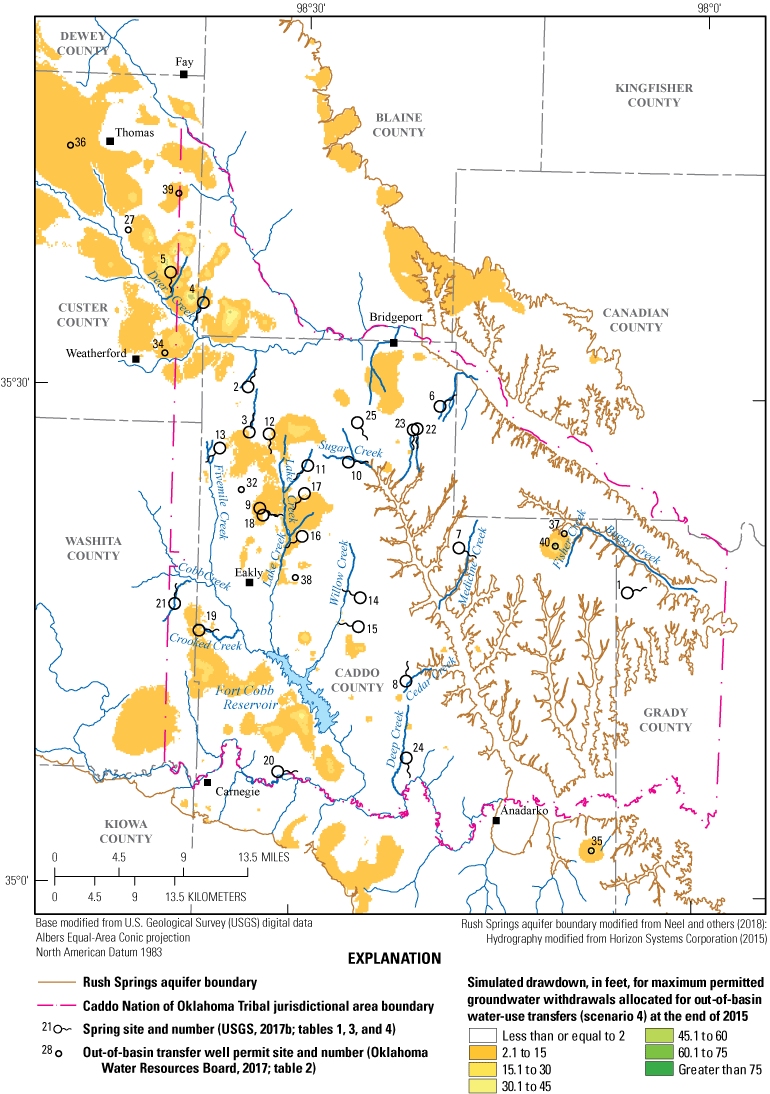
Spatial distribution of simulated drawdowns at the end of 2015 for scenario 4 (maximum permitted withdrawals allocated for out-of-basin water-use transfers) for the Rush Springs aquifer study area, western Oklahoma.
Simulated drawdowns associated with scenario 4 based on a 20-year projection ranged from 1 ft above to 11 ft below the water-level altitudes simulated in scenario 1 (table 4). A reduction in spring discharge associated with groundwater withdrawal is indicated in 17 of the 25 model cells containing springs of interest, with the largest drawdown simulated at spring 5, close to out-of-basin transfer well 34. The range of simulated drawdowns for the model domain for the springs and well model cells was 0.1–200 ft, and the largest drawdown of 200 ft was simulated in Custer County near out-of-basin transfer well 39 (fig. 8). These results are similar to those for scenario 3 for the 20-year projection simulation.
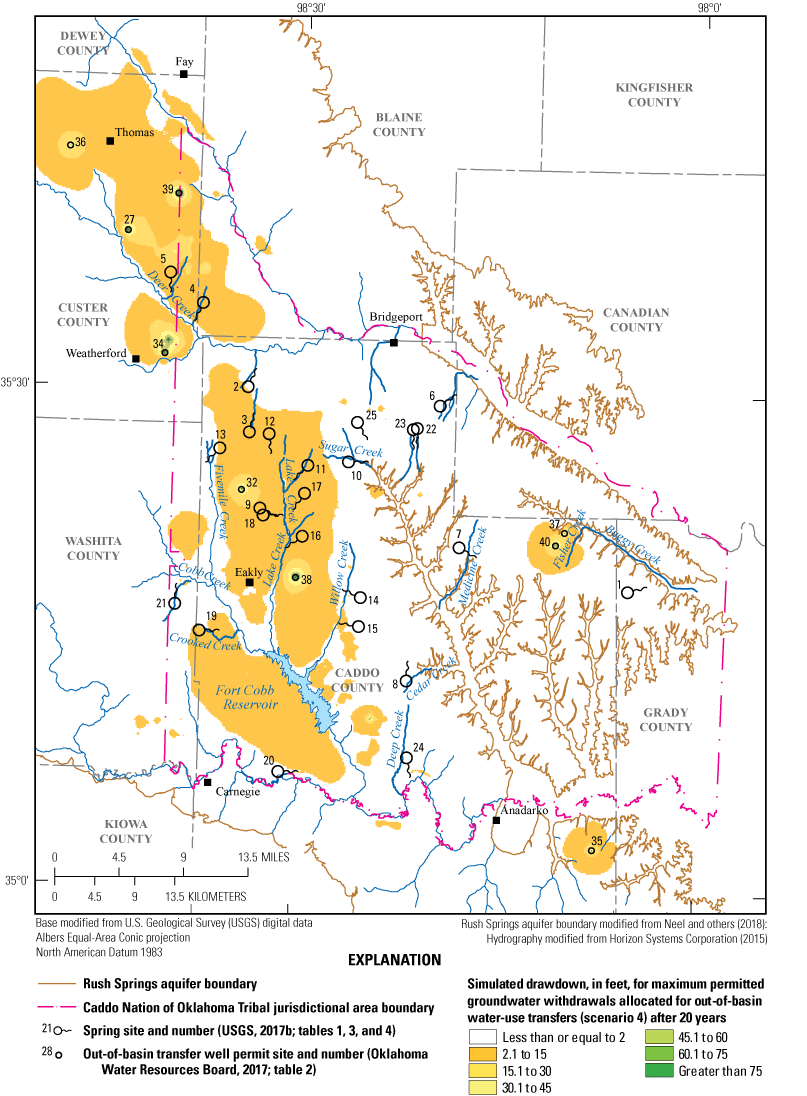
Spatial distribution of simulated drawdowns after 20 years for scenario 4 (maximum permitted withdrawals allocated for out-of-basin water-use transfers) for the Rush Springs aquifer study area, western Oklahoma.
Base-Flow Simulations
As explained in the “Description of the Study Area” section, groundwater discharges from the Rush Springs aquifer provide the base flow to streams in the study area, including Cobb Creek, Lake Creek, Willow Creek, and the Washita River. Simulated base flows during 2007–15 are depicted in figure 9. Base flows were calculated from the discharge from the Streamflow-Routing (SFR) Package at the stream reach where the gages are located. The simulated values for base flow at the four streamgages for scenarios 2–4 were similar (and appear almost overlain on the figure), but all decreased compared to those for scenario 1 (fig. 9). The largest decreases in base flow in scenarios 2–4 compared to scenario 1 were observed at USGS streamgage 07325800 Cobb Creek near Eakly, Oklahoma (hereinafter referred to as the “Cobb Creek streamgage”), USGS streamgage 07325850 Lake Creek near Eakly, Okla. (hereinafter referred to as the “Lake Creek streamgage”), and USGS streamgage 07325860 Willow Creek near Albert, Okla. (hereinafter referred to as the “Willow Creek streamgage”), where the base flow decreased by 36, 57, and 70 percent, respectively. Compared to the base flow simulated in scenario 1, base flows decreased in scenarios 2–4 by 3.9 percent at USGS streamgage 07325500 Washita River at Carnegie, Okla. (hereinafter referred to as the “Carnegie streamgage”); base flows decreased in scenarios 2–4 by 5.7 percent at USGS streamgage 07326500 Washita River at Anadarko Okla. (hereinafter referred to as the “Anadarko streamgage). The nearest out-of-basin transfer is about 2 miles from the Cobb Creek streamgage, about 6 miles from the Lake Creek and Willow Creek streamgages, 10 miles from the Anadarko streamgage, and 14 miles from the Carnegie streamgage. The variation in simulated base flows for scenarios 2–4 might be the result of the distance between these streamgages and the out-of-basin transfer wells.
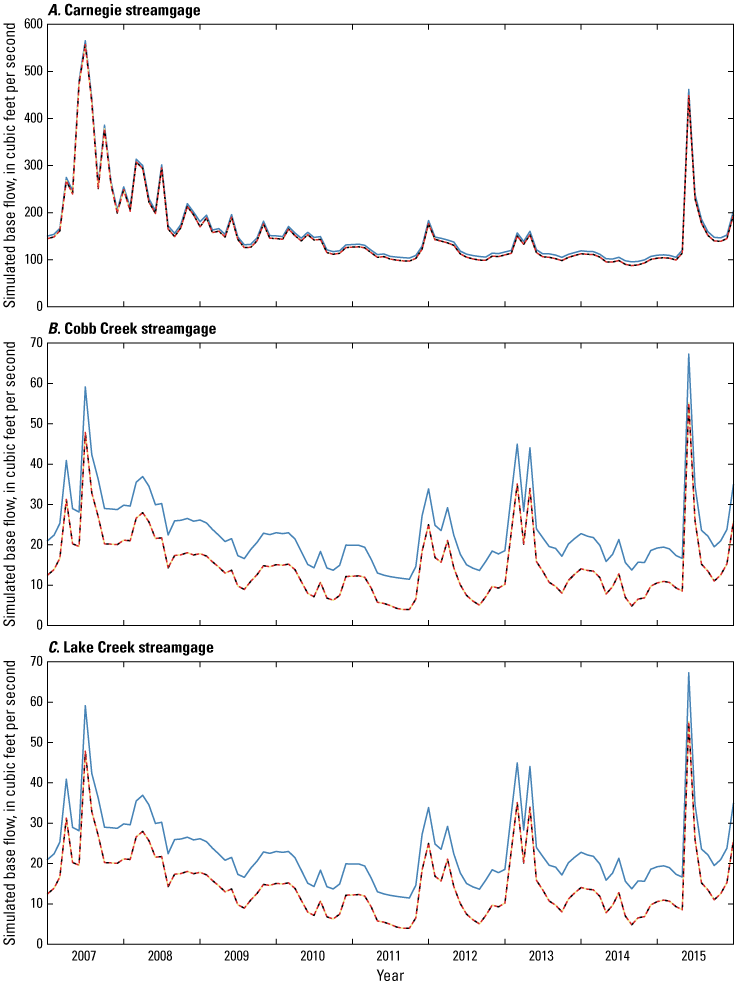
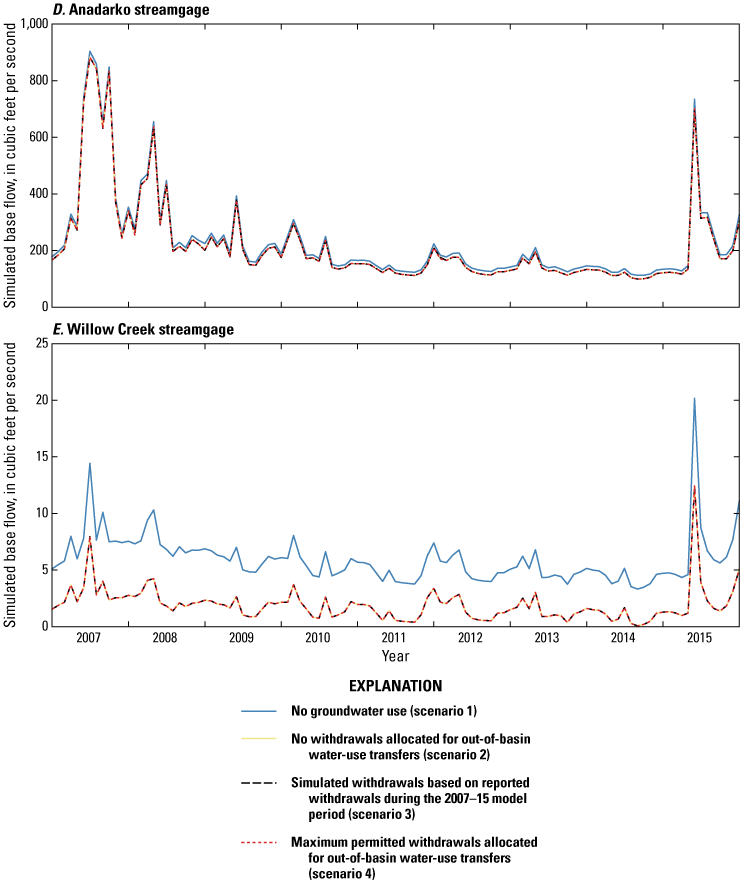
Simulated annual mean base flows during 2007–15 based on four groundwater use scenarios at U.S. Geological Survey (USGS) streamgages for the numerical groundwater-flow model of the Rush Springs aquifer, western Oklahoma: A, USGS streamgage 07325500 Washita River at Carnegie, Oklahoma (Carnegie streamgage); B, USGS streamgage 07325800 Cobb Creek near Eakly, Okla. (Cobb Creek streamgage); C, USGS streamgage 07325850 Lake Creek near Eakly, Okla. (Lake Creek streamgage); D, USGS streamgage 07327447 Washita River at Anadarko Okla. (Anadarko streamgage); and E, 07325860 Willow Creek near Albert, Okla. (Willow Creek streamgage).
Simulated base flows for 20-year projections of groundwater withdrawals from 2016 to 2035 are depicted in figure 10. The simulated values for base flow at the four streamgages for scenarios 2–4 were similar (and appear almost overlain in the figure) but were all consistently smaller than the base-flow values for scenario 1. The largest differences in scenarios 2–4 compared to scenario 1 were observed at the at the Cobb Creek, Lake Creek, and Willow Creek streamgages. Compared to scenario 1, base flows at the Cobb Creek, Lake Creek, and Willow streamgages decreased by 35, 60, and 68 percent respectively, under scenarios 2–4. Compared to the base flows simulated in scenario 1, base flows simulated under scenarios 2–4 decreased by 4.0 and 6.6 percent at Carnegie and Anadarko streamgages, respectively. The base-flow values in all scenarios were similar at the Carnegie and Anadarko streamgages, where the base flows were relatively large (approximately 150 ft3/s) and the effects of different groundwater use scenarios were muted, whereas the base flows at the Cobb Creek, Lake Creek and Willow Creek streamgages were only about 2–30 ft3/s; when the base flows are relatively small, the percentage decreases in streamflow under the different groundwater use scenarios were amplified. Also, there were less out-of-basin transfer groundwater-withdrawal wells in proximity to the Carnegie and Anadarko stations, which would result in less variation between the four scenarios.
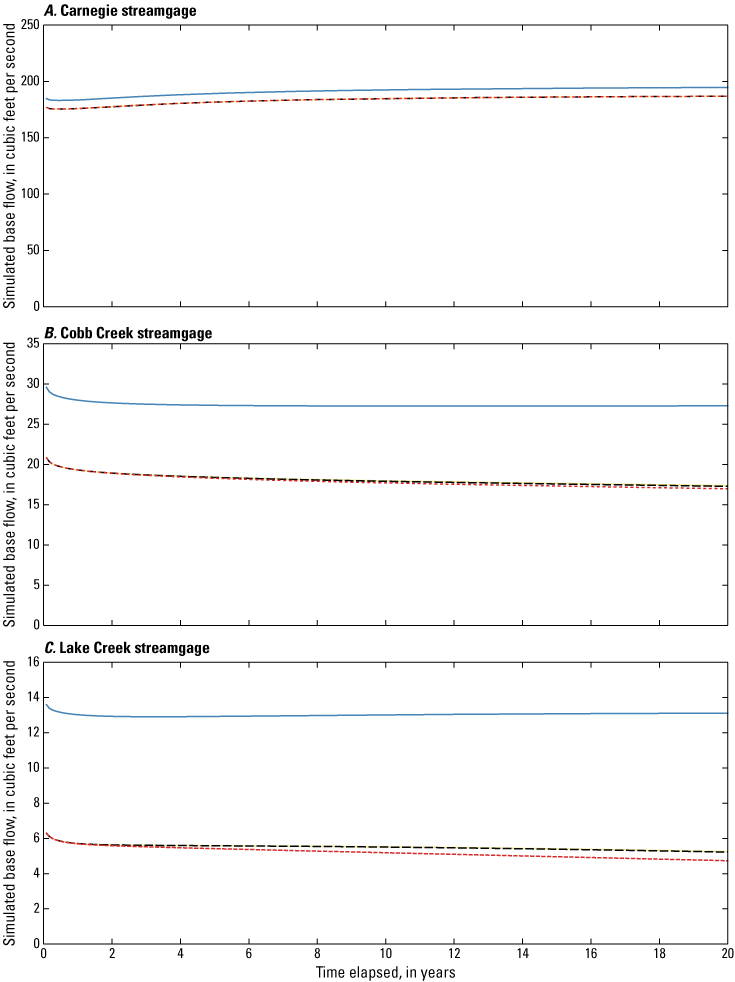
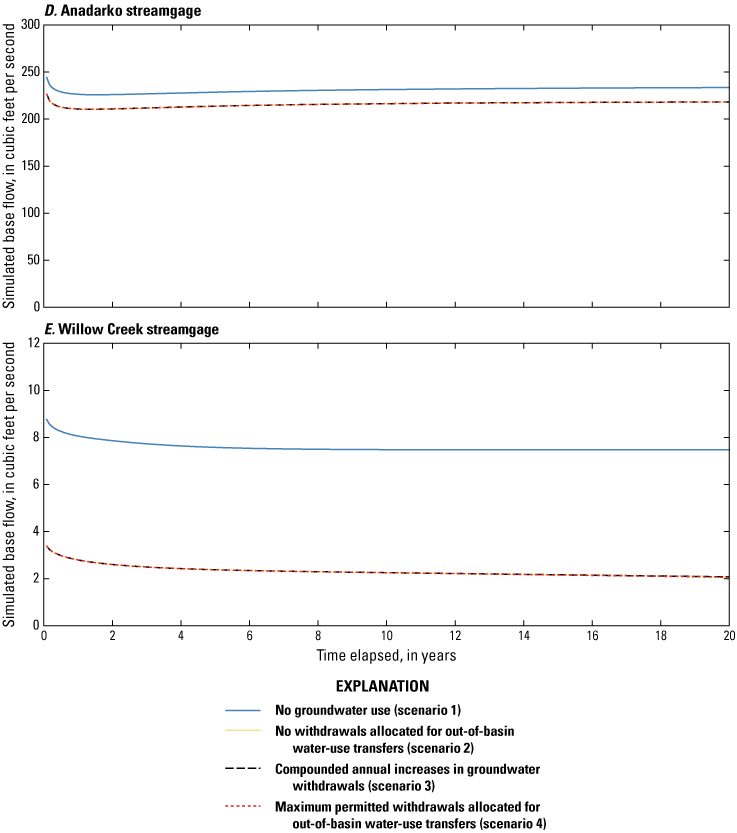
Simulated annual mean base flow through 20 years based on four groundwater use scenarios at U.S. Geological Survey (USGS) streamgages for the numerical groundwater-flow model of the Rush Springs aquifer, western Oklahoma: A, USGS streamgage 07325500 Washita River at Carnegie, Oklahoma (Carnegie streamgage); B, USGS streamgage 07325800 Cobb Creek near Eakly, Okla. (Cobb Creek streamgage); C, USGS streamgage 07325850 Lake Creek near Eakly, Okla. (Lake Creek streamgage); D, USGS streamgage 07327447 Washita River at Anadarko Okla. (Anadarko streamgage); and E, USGS streamgage 07325860 Willow Creek near Albert, Okla. (Willow Creek streamgage)
The simulated groundwater-level altitudes at the springs of interest during 2007–15 are depicted in figure 11. Between 2007 and 2015, scenarios 2–4 yielded similar simulated water-level altitudes in the model cells containing springs of interest, with water-level altitudes decreasing to below the land surface altitude at 13 of the total 25 springs of interest. Under scenario 1, higher water-level altitudes were simulated compared to the other scenarios (except at springs 1 and 7), and water-level altitudes only decreased to below the land surface altitude in two model cells containing springs of interest. The largest average changes in groundwater-level altitudes between scenario 1 and scenarios 2–4 were found in the model cells containing springs 5, 15, and 18; these differences are likely the result of their proximity to the out-of-basin transfer wells.
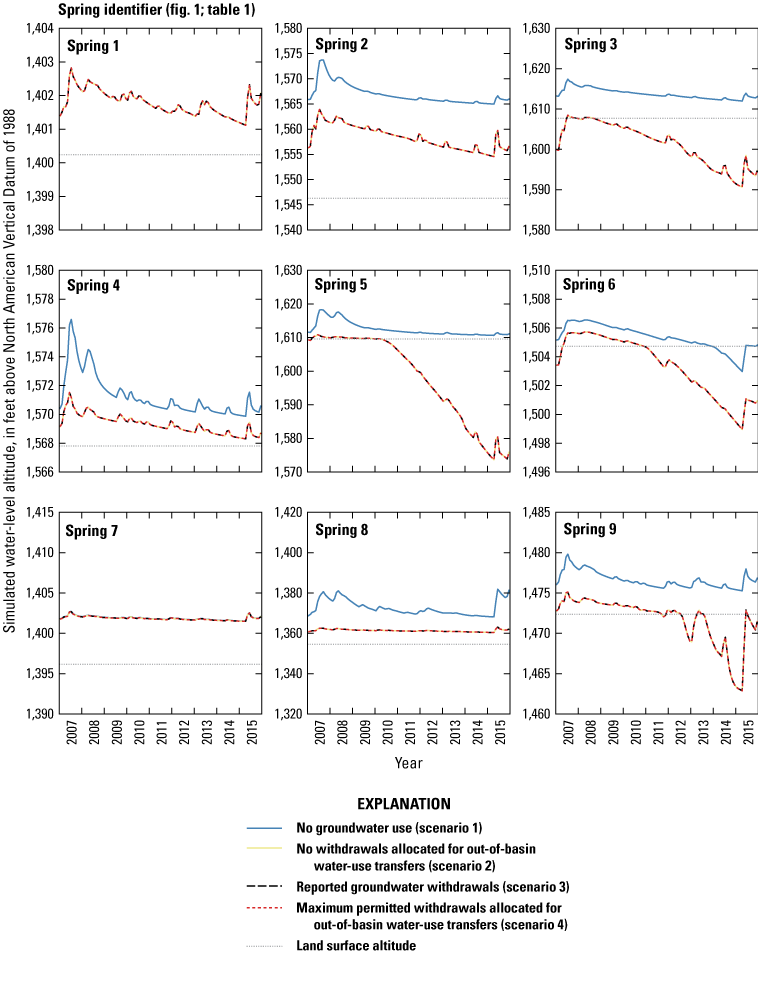
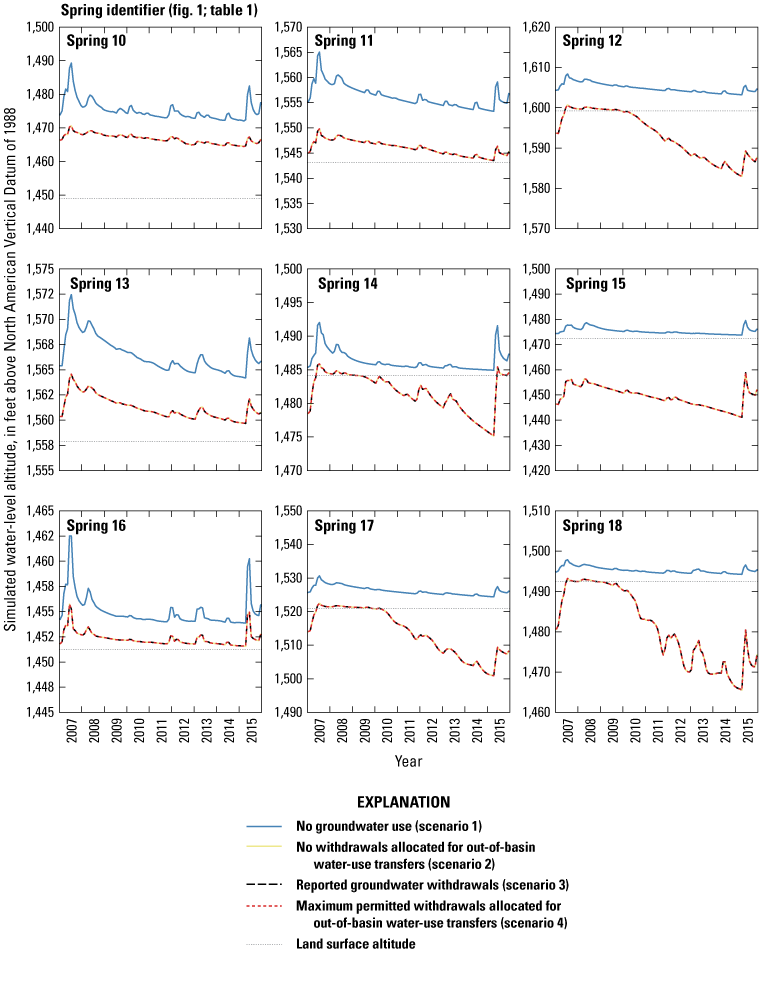
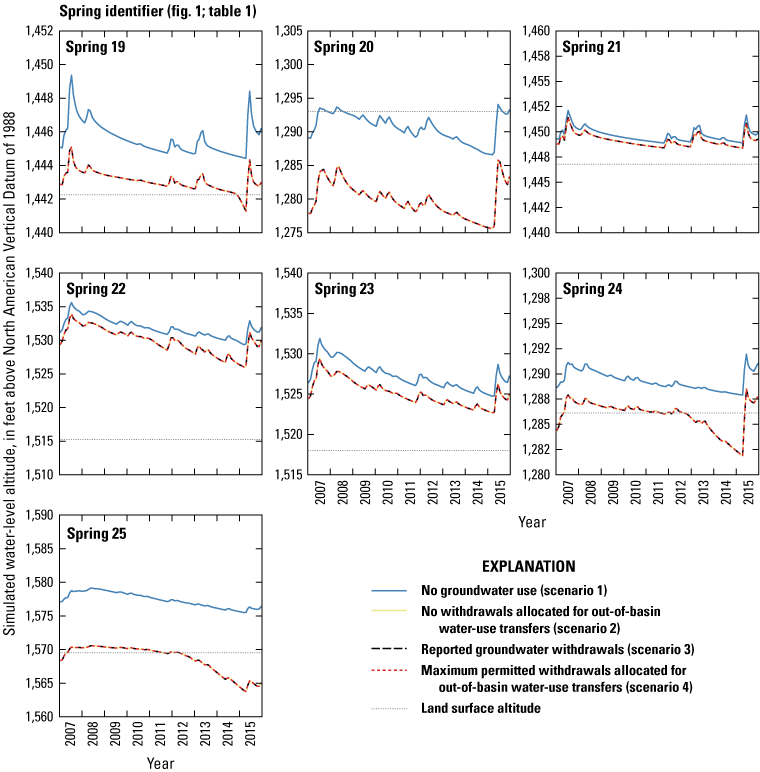
Simulated spring water-level altitudes from 2007 to 2015 based on four groundwater use scenarios at 25 springs of interest sourced by the Rush Springs aquifer, western Oklahoma. The number in each graph corresponds to the spring identifier shown in table 1 and figures 1, 3–8.
The simulated water-level altitudes at the springs of interest from the 20-year projection are depicted in figure 12. The largest changes in water-level altitudes were found at springs 5, 14, 15, and 18; the large differences in water-level altitudes at these springs are likely because they are near the out-of-basin transfer wells. For the 20-year projection, scenarios 2–4 yielded similar results for the water-level altitudes at the various springs; results from scenarios 2–4 differed from those of scenario 1 (except at springs 1 and 7). Water-level altitudes at springs simulated in model cells in scenarios 2–4 decreased to below land surface altitude at 13 of the total 25 model cells containing springs of interest, whereas under scenario 1, water-level altitudes at springs decreased to below land surface altitude at two model cells containing springs of interest (fig. 12).

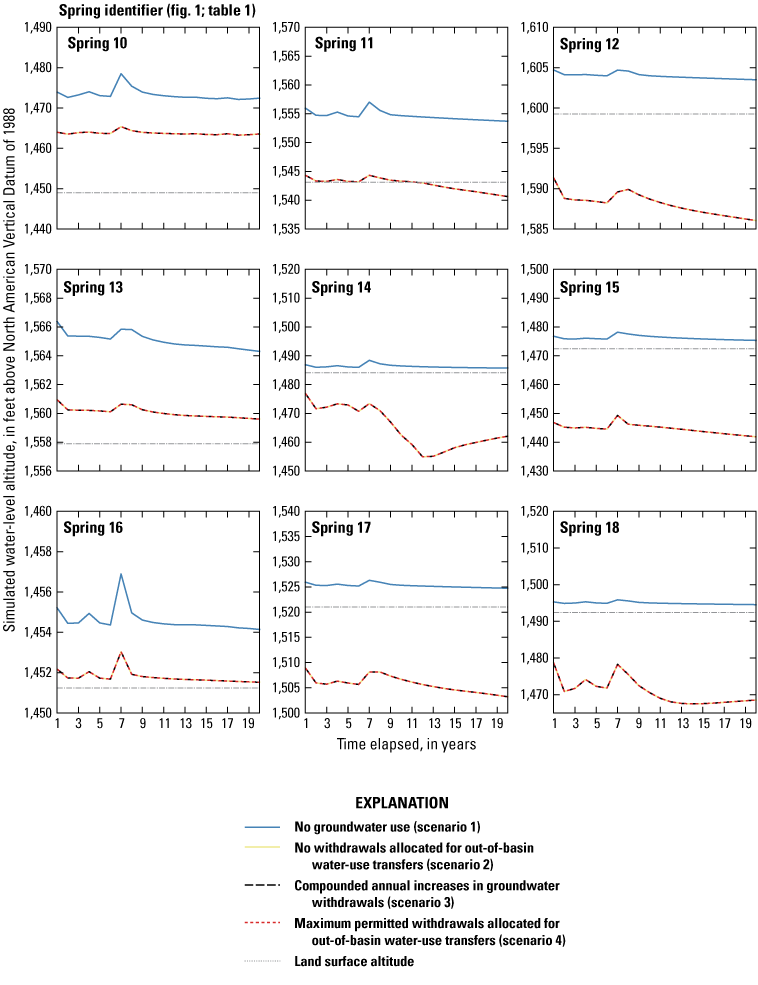

Simulated spring water-level altitude through 20 years based on four groundwater use scenarios at 25 springs of interest sourced by the Rush Springs aquifer, western Oklahoma. The number in each graph corresponds to the map identifier shown in table 1 and figures 1, 3–8.
Groundwater Storage
Groundwater storage was simulated for the Rush Springs aquifer for the 2007–15 scenarios. The storage calculation is the specific yield multiplied by the saturated thickness in each active model cell. Like in 2007, groundwater storage at the end of 2015 is highest in scenario 1 and lowest in scenario 4 (Table 5). Compared to the amount of groundwater in storage in the Rush Springs aquifer at beginning of each scenario in 2007, simulated groundwater storage at the end of the 2015 period increased by 2.8 percent for the scenario 1, increased by 0.7 percent for scenarios 2 and 3, and increased by 1.0 percent for scenario 4 (table 5; fig. 13).
Table 5.
Changes in groundwater storage between 2007 and 2015 based on four groundwater-use scenarios for the Rush Springs aquifer, western Oklahoma.[Rush Springs aquifer underlies an area of about 4,970 square miles]
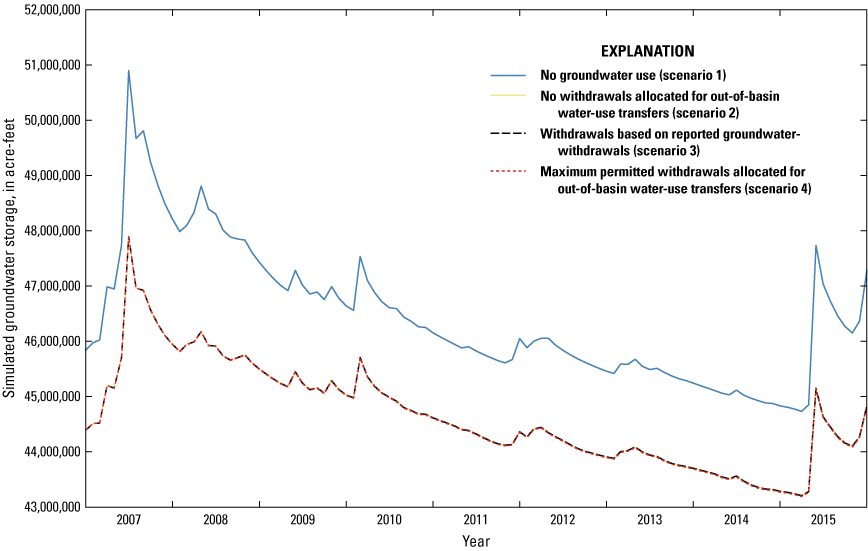
Simulated groundwater storage during 2007–15 based on four groundwater-use scenarios for the Rush Springs aquifer in western Oklahoma.
Groundwater storage was then simulated for the Rush Springs aquifer for the 20-year projections that continue from the end of the 2007–15 scenarios. At the end of the projected 20-year groundwater use scenarios in 2035, the model simulation indicated that groundwater storage in the Rush Springs aquifer decreased by 0.5 percent for scenario 1, 0.6 percent for scenarios 2 and 3, and by 0.7 percent for scenario 4 (table 6; fig. 14) when compared to the beginning of the 20-year time projection.
Table 6.
Changes in groundwater storage between 2016 and 2035 based on 20-year projections of four groundwater-use scenarios for the Rush Springs aquifer, western Oklahoma.[Rush Springs aquifer underlies an area of about 4,970 square miles. OWRB, Oklahoma Water Resources Board]
Compounded annual increases in groundwater withdrawals during 2016–35 that sum to a 6.25-percent increase by 2035 compared to 2015 (Labriola and others, 2022) based on a projected cumulative 38-percent increase in withdrawals during 2010–60 for western Oklahoma (OWRB, 2012).
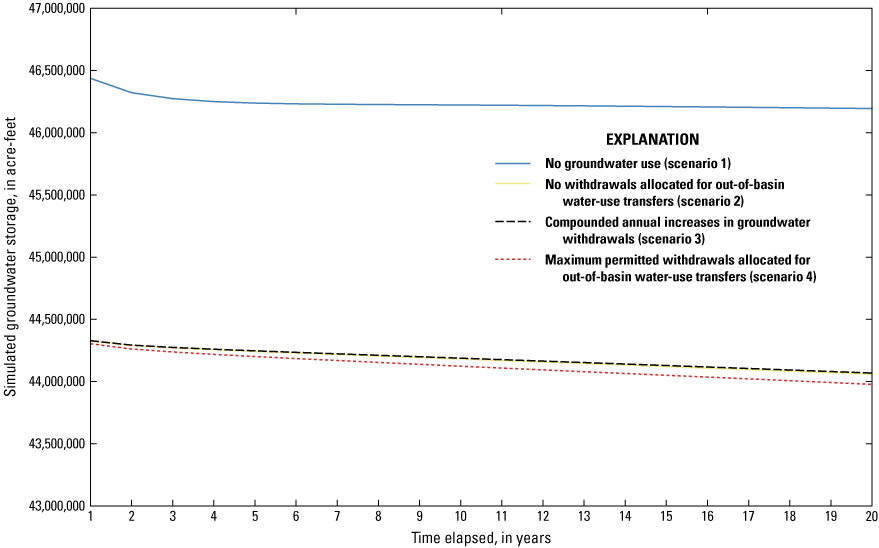
Simulated groundwater storage based on 20-year projections of four groundwater-use scenarios for the Rush Springs aquifer in western Oklahoma.
Model Limitations
This section is modified from Ellis (2018b). The Rush Springs aquifer groundwater model is a simplification of a complex groundwater-flow system and, therefore, incorporates necessary limitations and assumptions. The model contains a model cell size that may represent localized features, but the model is best used to support groundwater management decisions at a regional to subregional scale. The calibrated simulation period included hydrologic and climatic variability but results from the groundwater model may not be representative of past hydrologic conditions and future climatic variability. To characterize the out-of-basin water transfers, the location of groundwater wells and groundwater-withdrawal data for each well were provided from the OWRB. These wells were simulated in the previously constructed groundwater model (Ellis 2018a); however, the permitted locations of the withdrawals that are simulated may not accurately represent the exact locations of each well and the total number of wells is not known. Uncertainty in specific yield values used in calculating groundwater storage changes over time, and the volumes of groundwater in storage have uncertainty associated with them. In this study, however, differences between the scenarios would be the same.
The pattern of base flows simulated in the calibrated model was similar to that of estimated base flows at the nine streamgages used in calibration, but mean simulated base flows were slightly lower than estimated mean flows (Ellis 2018b). The following outlines the performance of the estimated mean flows compared to the simulated base flows from Ellis (2018b) that were used in this report:
-
The Washita River (Carnegie and Anadarko) streamgages used herein had a root mean square error less than or equal to 9.0 percent of the range in estimated base flow, and the mean base flow was slightly unpredicted.
-
The Cobb Creek and Lake Creek streamgages had a root mean square error less than or equal to 17.1 percent of the range in estimated base flow, and the mean base flow was slightly overpredicted.
-
The Willow Creek streamgage had a root mean square error less than or equal to 26.1 percent of the range in estimated base flow, and the mean base flow was slightly overpredicted.
A detailed sensitivity and identifiability analysis was performed for the original calibrated model (Ellis 2018a, b), which was the basis of the first 445 stress periods for the model described in this report. The sensitivity analysis showed the observation groups were most sensitive to recharge and hydraulic conductivity changes. The parameter identifiability analysis is used for highly parameterized models to quantify parameter correlation and the amount of information gained from the calibration dataset. The results of the identifiability analysis indicate that (1) the recharge and storage parameters were well informed and (2) some degree of correlation is present among many of the calibration parameters. The recharge and storage parameters are important controls on groundwater flow in the aquifer; therefore, a large identifiability for these parameters provides greater certainty in the modeled scenario results. For a complete description of the sensitivity and identifiability analysis, refer to Ellis (2018b, p. 82–84, and figs. 47–48). Additional limitations associated with the model stem from the amount and accuracy of available data, including public records of withdrawal data and maximum pumping estimates.
Summary
The U.S. Geological Survey (USGS), in cooperation with the Caddo Nation of Oklahoma and the Bureau of Indian Affairs, evaluated different scenarios of groundwater-use withdrawals between 2007 and 2015 and different scenarios of projected groundwater withdrawals between 2016 and 2035 in the Rush Springs aquifer to determine the range of the potential effects on local water resources within the Caddo Nation of Oklahoma. Increases in industrial and public water supply needs have led to increased development of water resources within the Rush Springs aquifer. As new areas within the aquifer are developed, increased groundwater withdrawals may result in decreases in available water resources and conflicts among water users. The Caddo Nation is concerned about permitted water transfers from the Rush Springs aquifer in Caddo County to areas outside of this aquifer. This report provides an assessment of the susceptibility of groundwater resources, spring discharge and base flow originating from the Rush Springs aquifer to out-of-basin withdrawals.
The study area is composed of about 4,970 square miles of Rush Springs aquifer bedrock deposits located in 14 counties in Oklahoma. The study area includes the alluvium and terrace deposits of the Canadian and Washita Rivers, as well as alluvium along the Little Washita River, Deer Creek, and smaller tributaries of the Washita River that overlie the bedrock. The Rush Springs aquifer is an important source of water for municipal use and irrigation in the study area.
The model consists of 3 layers, each composed of 1,362 rows and 1,083 columns containing 500- by 500-foot (ft) cells. A previously published numerical groundwater-flow model of the Rush Springs aquifer was modified to simulate the potential effects of four groundwater withdrawal scenarios. For the previously published calibrated model, groundwater flow was simulated from 1979 through 2015. In this study, groundwater flow was simulated through 2035. The period from 2016 through 2035 is referred to as the “20-year projection.” The Rush Springs aquifer groundwater model simulated groundwater flow during a 37-year period from 1979 to 2015 by using 444 monthly transient stress periods, each having one time step, plus an initial steady-state stress period that represents mean annual inflow and outflow. This model included an additional 20 annual transient stress periods with 12 time steps each that represent a 20-year projection, for a total of 465 stress periods for the entire simulation period.
Four groundwater withdrawal scenarios starting in 2007 and continuing through 2035 were evaluated. Scenario 1 simulated no groundwater withdrawals; scenario 2 simulated no withdrawals allocated for out-of-basin water-use transfers; scenario 3 simulated withdrawals based on reported withdrawals during the 2007–15 simulation period and compounded annual increases in groundwater use during the subsequent 20-year projections; and scenario 4 simulated the maximum permitted withdrawals allocated for out-of-basin water-use transfers. Out-of-basin water-use transfers were classified as withdrawals that are not returned back to the aquifer. Scenarios 3 and 4 were based on compounded annual increases in groundwater withdrawals during 2016–35 that sum to a 6.25-percent increase by 2035 compared to 2015. The annual increases are derived from a projected cumulative 38-percent increase in groundwater withdrawals during 2010–60 for western Oklahoma.
Drawdowns in groundwater-level altitudes during 2007–15 were simulated for scenarios 2–4. At the end of 2015, the simulated drawdowns within the model cells containing springs and reduction in spring discharge associated with groundwater withdrawal ranged from 0 to 9 ft for 5 of the 25 model cells containing springs of interest, with a rise in water levels at 20 springs. Drawdowns at the end of the 20-year groundwater withdrawal scenarios were simulated for scenarios 2–4. Among these scenarios, the simulated drawdowns ranged from 0 to 11 ft in the model cells containing springs of interest and occurred at 16 of the 25 springs, with no change in 1 of the springs, and a rise in water-level altitudes at 8 springs.
Simulated base flows in Washita River, Cobb Creek, Lake Creek, and Willow Creek in Caddo County were evaluated for scenarios 1–4 between 2007 and 2015. The largest decreases in base flow in scenarios 2–4 compared to scenario 1 were observed at USGS streamgage 07325800 Cobb Creek near Eakly, Oklahoma (hereinafter referred to as the “Cobb Creek streamgage”), USGS streamgage 07325850 Lake Creek near Eakly, Okla. (hereinafter referred to as the “Lake Creek streamgage”), and USGS streamgage 07325860 Willow Creek near Albert, Okla. (hereinafter referred to as the “Willow Creek streamgage”), where the base flow decreased by 36, 57, and 70 percent, respectively. Compared to the base flows simulated in scenario 1, base flows decreased in scenarios 2–4 by 3.9 percent at USGS streamgage 07325500 Washita River at Carnegie, Okla. (hereinafter referred to as the “Carnegie streamgage”); base flows decreased in scenarios 2–4 by 5.7 percent at USGS streamgage 07326500 Washita River at Anadarko Okla. (hereinafter referred to as the “Anadarko streamgage).
Simulated base flows in Washita River, Cobb Creek, and Lake Creek in Caddo County were also evaluated for four scenarios based on 20-year projections of groundwater withdrawals from 2016 to 2035. The simulated values for base flow at the four streamgages for scenarios 2–4 were similar, but all were consistently less than the base-flow values for scenario 1. The largest differences in scenarios 2–4 compared to scenario 1 were simulated at the Cobb Creek, Lake Creek, and Willow Creek streamgages, where the base flows decreased by 35, 60, and 68 percent, respectively. Compared to the base flows in scenario 1, base flows simulated under scenarios 2–4 decreased by 4.0 and 6.6 percent at the Carnegie and Anadarko streamgages, respectively.
At the springs of interest, changes in water-level altitudes in response to different groundwater withdrawal scenarios were simulated by comparing the results from different model cells. Between 2007 and 2015, scenarios 2–4 yielded similar simulated water-level altitudes in the model cells containing springs of interest, with water-level altitudes decreasing to below the land surface altitude at 13 of the total 25 springs of interest. Under scenario 1, higher water-level altitudes were simulated compared to the other scenarios and only decreased to below land surface altitude in two of the model cells containing springs of interest. For the 20-year projection from 2016 to 2035, scenarios 2–4 yielded results similar to those from 2007 to 2015 for the water-level altitudes at the various springs; results from scenarios 2–4 differed from the scenario 1 results. For the 20-year projection, springs simulated in model cells in scenarios 2–4 decreased to below the land surface altitude at 13 of the total 25 model cells containing springs of interest, whereas under scenario 1, there were two model cells containing springs of interest where the simulated water-level altitude of a spring decreased below land surface altitude.
The potential effects of groundwater withdrawals were evaluated by comparing changes in groundwater storage between the four scenarios. The 2007–15 groundwater withdrawal scenarios were used to simulate the potential effects of groundwater withdrawal rates on groundwater storage of the Rush Springs aquifer. Simulated groundwater storage change in the Rush Springs aquifer ranged from an increase of 2.8 percent for scenario 1 to an increase of 1.0 percent for scenario 4. Projected 20-year groundwater withdrawal scenarios were used to simulate the potential effects of selected groundwater withdrawal rates on groundwater storage of the Rush Springs aquifer. Simulated groundwater storage changes ranged from a decrease of 0.5 percent for scenario 1 to a decrease of 0.7 percent for scenario 4.
References Cited
Banta, E.R., 2014, Two graphical user interfaces for managing and analyzing MODFLOW groundwater-model scenarios: U.S. Geological Survey Techniques and Methods, book 6, chap. A50, 38 p., accessed August 28, 2020, at https://doi.org/10.3133/tm6A50.
Becker, M.F., 1998, Steady-state simulation of ground-water flow in the Rush Springs aquifer, western Oklahoma: U.S. Geological Survey Water-Resources Investigations Report 98–4082, 88 p., accessed February 10, 2020, at https://doi.org/10.3133/wri984082.
Becker, M.F., and Runkle, D.L., 1998, Hydrogeology, water quality, and geochemistry of the Rush Springs aquifer, western Oklahoma: U.S. Geological Survey Water-Resources Investigations Report 98–4081, 37 p., accessed February 10, 2020, at https://doi.org/10.3133/wri984081.
Ellis, J.H., 2018a, MODFLOW model used in simulation of groundwater flow and analysis of projected water use for the Rush Springs aquifer, western Oklahoma: U.S. Geological Survey data release, accessed September 1, 2020 at https://doi.org/10.5066/F7Q52NXK.
Ellis, J.H., 2018b, Simulation of groundwater flow and analysis of projected water use for the Rush Springs aquifer, western Oklahoma: U.S. Geological Survey Scientific Investigations Report 2018–5136, 156 p., accessed February 10, 2020, at https://doi.org/10.3133/sir20185136.
Ellis, J.H., Ryter, D.W., Fuhrig, L.T., Spears, K.W., Mashburn, S.L., and Rogers, I.M.J., 2020, Hydrogeology, numerical simulation of groundwater flow, and effects of future water use and drought for reach 1 of the Washita River alluvial aquifer, Roger Mills and Custer Counties, western Oklahoma, 1980–2015: U.S. Geological Survey Scientific Investigations Report 2020–5118, 81 p., accessed January 23, 2022, at https://doi.org/10.3133/sir20205118.
Fay, R.O., and Hart, D.L., 1978, Geology and mineral resources (exclusive of petroleum) of Custer County, Oklahoma: Oklahoma Geological Survey Bulletin 114, 88 p., accessed October 11, 2021, at http://www.ogs.ou.edu/pubsscanned/BULLETINS/Bulletin114wm.pdf.
Labriola, L.G., Russell, C.A., Ellis, J.H., 2022, MODFLOW-NWT model used to simulate the potential effects of out-of-basin transfers for the Rush Springs aquifer in the Caddo Nation of Oklahoma Tribal jurisdictional area, western Oklahoma: U.S. Geological Survey data release, https://doi.org/10.5066/P92DYE98.
Mashburn, S.L., and Smith, S.J., 2014, Evaluation of groundwater and surface-water interactions in the Caddo Nation Tribal Jurisdictional Area, Caddo County, Oklahoma, 2010–13: U.S. Geological Survey Scientific Investigations Report 2014–5082, 54 p., accessed November 24, 2020, at https://doi.org/10.3133/sir20145082.
McLachlan, M., 1967, Oklahoma, chap. E of Paleotectonic investigations of the Permian system in the United States: U.S. Geological Survey Professional Paper 515–E, 271 p., accessed September 29, 2021, at https://doi.org/10.3133/pp515.
Neel, C.R., Wagner, D.L., Correll, J.S., Sanford, J.E., Hernandez, R.J., Spears, K.W., and Waltman, P.B., 2018, Hydrologic investigations report of the Rush Springs aquifer in west-central Oklahoma: Oklahoma Water Resources Board, 73 p., accessed March 14, 2021, at https://www.owrb.ok.gov/reports/studies/RushSprings2015.pdf.
Oklahoma Water Resources Board [OWRB], 2012, Oklahoma comprehensive water plan: West-Central Watershed Planning Region Report, 91 p., accessed February 10, 2020, at https://www.owrb.ok.gov/supply/ocwp/pdf_ocwp/WaterPlanUpdate/regionalreports/OCWP_WestCentral_Region_Report.pdf.
Oklahoma Water Resources Board [OWRB], 2017, Data and maps—Groundwater: Oklahoma Water Resources Board web page, accessed March 14, 2021, at https://www.owrb.ok.gov/maps/pmg/owrbdata_GW.html.
U.S. Geological Survey [USGS], 2017a, National elevation dataset: USGS online database, accessed January 16, 2017, at https://ned.usgs.gov/index.html.
U.S. Geological Survey [USGS], 2017b, USGS water data for the Nation: USGS National Water Information System online database, accessed August 27, 2019, at https://doi.org/10.5066/F7P55KJN.
Conversion Factors
U.S. customary units to International System of Units
Datum
Vertical coordinate information is referenced to the North American Vertical Datum of 1988 (NAVD 88).
Horizontal coordinate information is referenced to the North American Datum of 1983 (NAD 83).
Altitude, as used in this report, refers to distance above the vertical datum.
For more information about this publication, contact
Director, Oklahoma-Texas Water Science Center
U.S. Geological Survey
1505 Ferguson Lane
Austin, TX 78754-4501
For additional information, visit
https://www.usgs.gov/centers/ot-water
Publishing support provided by
Lafayette Publishing Service Center
Suggested Citation
Labriola, L.G., Russell, C.A., and Ellis, J.H., 2022, Potential effects of out-of-basin groundwater transfers on spring discharge, base flow, and groundwater storage pertaining to the Rush Springs aquifer in and near the Caddo Nation of Oklahoma Tribal jurisdictional area, western Oklahoma: U.S. Geological Survey Scientific Investigations Report 2022–5044, 32 p., https://doi.org/10.3133/sir20225044.
ISSN: 2328-0328 (online)
Study Area
| Publication type | Report |
|---|---|
| Publication Subtype | USGS Numbered Series |
| Title | Potential effects of out-of-basin groundwater transfers on spring discharge, base flow, and groundwater storage pertaining to the Rush Springs aquifer in and near the Caddo Nation of Oklahoma Tribal jurisdictional area, western Oklahoma |
| Series title | Scientific Investigations Report |
| Series number | 2022-5044 |
| DOI | 10.3133/sir20225044 |
| Year Published | 2022 |
| Language | English |
| Publisher | U.S. Geological Survey |
| Publisher location | Reston, VA |
| Contributing office(s) | Oklahoma-Texas Water Science Center |
| Description | Report: vii, 32 p.; Data Release; Dataset |
| Country | United States |
| State | Oklahoma |
| Other Geospatial | Rush Springs Aquifer |
| Online Only (Y/N) | Y |
| Google Analytic Metrics | Metrics page |