

Comparison of the Results of Enzyme-Linked Immunosorbent Assay (ELISA) to Mass-Spectrometry Based Analytical Methods for Six Unregulated Contaminants in Source Water and Finished Drinking-Water Samples
Links
- Document: Report (3.89 MB pdf) , HTML , XML
- Data Release: USGS data release —Concentrations and laboratory quality-assurance data for six unregulated contaminants measured in source and finished drinking-water samples collected from public water systems throughout Minnesota by using ELISA and MS-based analytical methods
- Download citation as: RIS | Dublin Core
Acknowledgments
Funding for this study was provided by a grant from the Minnesota Environment and Natural Resources Trust Fund to the Minnesota Department of Health and the U.S. Geological Survey’s Cooperative Matching Funds.
Abstract
Regulatory entities, such as the Minnesota Department of Health, monitor public water systems for conformance with Federal and State monitoring requirements and water-quality standards. Although some contaminants have Federal and (or) State regulations and guidance values, many contaminants, such as pesticides and pharmaceuticals, are unregulated in that only non-enforceable health-based guidance values have been assigned to them. Furthermore, because these contaminants are not regulated, commonly only limited resources are available to public water systems or regulatory entities to monitor them in drinking water. Focused screening efforts on contaminants that are frequently detected in the environment can provide information to help monitoring entities prioritize their sampling efforts.
Here we assess the use of enzyme-linked immunosorbent assay (ELISA) method, a rapid, inexpensive screening method, as an alternative to more expensive methods to analyze source and finished drinking-water samples collected from public water systems throughout Minnesota for three commonly detected pesticides (atrazine, imidacloprid, and pyrethroids) and three commonly detected pharmaceuticals (caffeine, carbamazepine, and sulfamethoxazole). The ELISA results were compared to results provided by more advanced mass-spectrometry analytical methods at the U.S. Geological Survey National Water Quality Laboratory (NWQL) and SGS AXYS Analytical Services Ltd. (AXYS).
Overall, these datasets are highly censored (>80 percent) and contain multiple reporting limits within and between laboratories. To discern agreement between paired contaminant group results (target contaminant plus immunologically similar contaminants) by ELISA and the advanced analytical methods at NWQL and AXYS, presence-absence agreement analysis was coupled with false negative and false positive analysis. Analysis of presence-absence agreement shows that ELISA has generally good agreement (77.9 to 100 percent) with both NWQL and AXYS for all unregulated contaminant groups. Imidicloprid, pyrethroids, and caffeine contaminant groups have relatively low false positivity rates (16, 6, and 5 percent, respectively) when analyzed by ELISA, which indicates the ELISA method, for these contaminant groups, could be experiencing low-level interference attributed to the detection of immunologically similar contaminants. Similarly, sulfamethoxazole has a low false positivity rate (0.8 percent), which indicates ELISA is likely not overestimating results for this contaminant group. Analyses for carbamazepine and sulfamethoxazole by ELISA resulted in low false negativity rates (1.6 and 0.8 percent, respectively), which indicates the ELISA method is likely not underestimating the results for this contaminant group. Conversely, the atrazine contaminant group has a high false negativity rate (84 percent), which indicates the method has a strong negative bias and that ELISA underestimates results for this contaminant. These qualitative results indicate that the ELISA method could potentially serve as a reliable and cost-effective screening method to help drinking water monitoring entities prioritize sampling efforts for analyzing carbamazepine and sulfamethoxazole in source and finished drinking-water samples collected from public water systems. At the same time, although ELISA did not prove to be a good screening method for atrazine, evaluation of ELISA results indicated that its use for screening imidacloprid, pyrethroids, and caffeine could be beneficial for water testing.
Introduction
Given the frequent occurrence of unregulated contaminants (for example, pharmaceuticals, pesticides, personal care products, and so on) in aquatic environments (Noguera-Oviedo and Aga, 2016; Ebele and others, 2017; Glassmeyer and others, 2017; Wilkinson and others, 2017), and in groundwater and surface water in Minnesota (Erickson and others, 2014; Elliott and others, 2018; Elliott and others, 2017; Lee and others, 2011), it is plausible that these contaminants pose a threat to the quality of drinking water in the State. Furthermore, because these contaminants are unregulated, resources available for monitoring them in drinking water is commonly limited. Rapid, inexpensive screening methods may offer monitoring entities an alternative for assessing the presence of unregulated contaminants in drinking water to fill this gap in knowledge.
More than 75 percent of Minnesotans get their drinking water from a public water system (Minnesota Department of Health, 2020b). The Minnesota Department of Health (MDH) monitors all public water systems in the State (approximately 7,000) for conformance with Federal monitoring requirements and water-quality standards. Currently, the U.S. Environmental Protection Agency (EPA) has primary drinking-water standards and requirements for 88 compounds or chemicals, including disinfectants, disinfection byproducts, metals, microorganisms, radionuclides, and various organic compounds or chemicals (U.S. Environmental Protection Agency, 2020). In addition to the EPA primary drinking-water requirements, EPA and (or) MDH non-enforceable health-based guidance values have been established for another approximately 150 contaminants (Minnesota Department of Health, 2020a). Existing regulations and guidance values represent only a small fraction of the roughly 86,000 chemicals that are currently in use in the United States (U.S. Environmental Protection Agency, 2021). Although it is not feasible to expect drinking-water facilities or monitoring entities to test for every chemical that may be present, focusing screening efforts on particular chemicals that are more frequently used and (or) detected in the environment can provide information in prioritizing sites for more extensive monitoring.
Enzyme-linked immunosorbent assay (ELISA) methods are a rapid, inexpensive way to screen environmental samples. Briefly, ELISA relies on binding of antigens in the environmental sample to chemical-specific antibodies. The unbound antibodies are removed, and an enzyme substrate added. If antigen-antibody binding occurs, the enzyme substrate produces a color change in proportion to the amount of binding. Although ELISA data are semi-quantitative, they have been used successfully in environmental studies as a screening tool and often produce data comparable to those obtained by liquid chromatography or high-performance liquid chromatography methods (Trost and others, 2013; Bradley and others., 2014; Krall and others, 2018). ELISA test kits are commercially available for various current-use chemicals such as pesticides and pharmaceuticals.
To evaluate the use of ELISA as a screening method for monitoring contaminant presence in drinking water, the U.S. Geological Survey (USGS), in cooperation with the Minnesota Environmental and Natural Resources Trust Fund and the MDH, collected both source and finished drinking-water samples from 67 public water systems throughout Minnesota (fig. 1). Samples were analyzed at accredited laboratories for a large suite of pesticides and pharmaceuticals. Samples were also analyzed by ELISA for a subset of the contaminants: three pesticides (atrazine, imidacloprid, and pyrethroids) and (or) three pharmaceuticals (caffeine, carbamazepine, and sulfamethoxazole). These contaminants were chosen on the basis of expected sources from surrounding land use (for example, agriculture or urban), current knowledge of their frequent occurrence in the environment, and based on results from previous monitoring studies by MDH, Minnesota Department of Agriculture, Minnesota Pollution Control Agency, and USGS (Minnesota Department of Agriculture, 2016a; Minnesota Department of Agriculture, 2019; Erickson and others, 2014; Elliott and others, 2018).
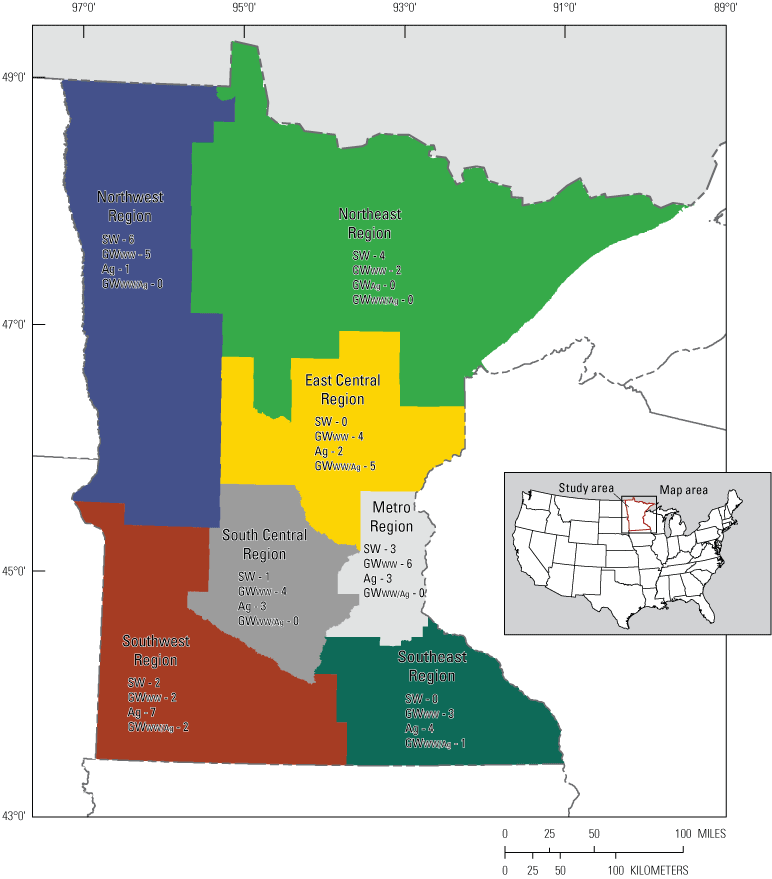
General locations of sampled Minnesota public water systems, 2019. [SW, surface water sourced public water system; GWWW, groundwater sourced public water system influenced by wastewater; GWAg, groundwater sourced public water system influenced by agricultural activities; GWWW/Ag, groundwater sourced public water system influenced by a mixed wastewater and agricultural activities]
Purpose and Scope
The purpose of this report is to present results of the analysis to discern agreement between ELISA and other analytical methods at two accredited laboratories on the prevalence of six unregulated contaminants (atrazine, imidacloprid, pyrethroids, caffeine, carbamazepine, and sulfamethoxazole) in source and finished drinking-water samples collected from public water systems throughout Minnesota. The laboratories used were the USGS National Water Quality Laboratory (NWQL) and SGS AXYS Analytical Services, Ltd (AXYS). The analysis objectives were threefold: (1) to document and describe the ELISA, NWQL, and AXYS results, (2) to statistically compare ELISA concentrations to the NWQL and AXYS concentrations, and (3) to describe implications of the results.
Study Area
The data used in this assessment of analytical methods are the results of analyses of samples collected from 67 public water systems throughout Minnesota. To retain anonymity of the sampled facilities, the number and source water type for the public water systems sampled are shown only within geographic regions in figure 1. The public water systems were categorized on the basis of the source of their water, whether surface water or groundwater. Groundwater sources were further categorized by expected sources of contamination -- whether influenced by wastewater, agricultural activities, or a combination of those influences. The source waters for the 67 public water systems sampled consisted of 16 surface-water (SW) sources, 22 groundwater sources influenced by wastewater (GWWW), 21 groundwater sources influenced by agricultural activities (GWAg), and 8 groundwater sources influenced by both wastewater and agricultural activities (GWWW/Ag).
Study Methods
Water samples were collected and handled using methods specified in the USGS National Field Manual for the Collection of Water-Quality Data (USGS, 2006), and analyzed both by the ELISA method at the USGS Upper Midwest Water Science Center (UMID) and by advanced liquid mass-spectrometry based methods at the two accredited laboratories. Quality-assurance and quality-control practices were followed at both field and laboratory analytical phases of sample processing.
Collection of Water Samples
Source water and finished drinking-water samples were collected by MDH staff at public water systems between August and November 2019. Samples were collected once from groundwater sourced public water systems (GWWW, GWAg, and GWWW/Ag) and twice from surface-water-sourced facilities (SW). Source water samples were grab samples collected from raw water taps inside water treatment plants or well houses or from surface-water intakes. Finished water samples were grab samples collected from sampling taps inside the water treatment plant or well house. Prior to sample collection, the water lines were flushed for about 15 minutes and physical or field measurable properties (water temperature, dissolved oxygen concentration, pH, and specific conductance) were monitored and recorded with a YSI ProDSS water-quality meter (YSI Inc., Yellow Springs, Ohio) every three minutes until five consecutive sets of field properties indicated stabilization of those properties. Samples for ELISA analyses were collected in two 40 milliliter (mL) amber vials to about the half-full mark, immediately put on ice, and stored at MDH at 4 degrees Celsius until frozen within 5 days at UMID in Mounds View, Minnesota. For pesticide and pharmaceutical analyses at the NWQL, the water was passed through a 0.7 micrometer (µm) syringe-tip filter, from which 10 mL samples were dispensed into an amber glass vial. For pharmaceutical analyses at AXYS, two samples of approximately 450 mL each were collected. Field (blank and sequential replicate) quality-control (QC) samples were collected and analyzed in the same manner as environmental samples. Samples were stored at MDH at 4 degrees Celsius for up to 5 days prior to shipment to the appropriate analyzing laboratories. Samples for analyses at the NWQL were delivered to UMID for preparation and shipment overnight on wet ice. Samples for analyses at AXYS were shipped to the laboratory on wet ice by MDH personnel.
Laboratory Analyses
Concentrations of three target pesticides (atrazine, ATZ; imidacloprid, IMD; and pyrethroids, PYR) plus several immunologically similar contaminants; and three target pharmaceuticals (caffeine, CAF; carbamazepine, CBZ; and sulfamethoxazole, SMX) plus several immunologically similar contaminants were determined. Target contaminants and immunologically similar contaminants (as defined by ELISA specifications) are referenced by the subscript “TOT” following the target contaminant acronym (for example, ATZTOT, CBZTOT) and are referred to as contaminant groups. Note that ATZTOT and all contaminant group “TOT” results may represent a different set of compounds across analysis methods. Target contaminants are referenced by the number 1 following the acronym (for example, ATZ1, CBZ1). Immunologically similar contaminants are referenced by a number greater than 1 following the acronym (for example, ATZ2, CBZ2). This referencing scheme does not apply to pyrethroids because pyrethroids are a family of contaminants, so there is no single target contaminant. A description of each referenced contaminant is provided in table 1. Samples collected from SW (66 samples) and GWWW/Ag (16 samples) public water systems were analyzed for all six contaminants. Samples collected from GWAg (40 samples) public water systems were analyzed for the three pesticides, and samples collected from GWWW (40 samples) public water systems were analyzed for the three pharmaceuticals. A total of 162 water-quality samples were analyzed by three different laboratory entities. Analytical results are available in a USGS data release (Krall and Elliott, 2022).
Table 1.
Unregulated contaminants analyzed in source water and finished drinking-water samples collected from public water systems throughout Minnesota, 2019, and associated laboratory reporting limits and human health-based advisory levels in nanograms per liter.[—Left][CASRN, Chemical Abstracts Services Registry Number; NWIS, National Water Information System; ELISA, enzyme- linked immunosorbent assay analytical method; Min, minimum; Max, maximum; NWQL, U.S. Geological Survey National Water Quality Laboratory; AXYS, SGS AXYS Services Ltd.; ATZ, atrazine; --, no data available; HRL, Minnesota Department of Health health risk limit; MCL, U.S. Environmental Protection Agency enforcable maximum contaminant level; HBV, Minnesota Department of Health health risk limit; HBSL, U.S. Geological Survey cancer health-based screening level; IMD, imidacloprid; PYR, pyrethroids; HHBP, U.S. Environmental Protection Agency carcinogenic or chronic noncancer human health benchmark for pesticide; CAF, caffeine; CBZ, carbamazepine; SMX, sulfamethoxazole; RAA, Minnesota Department of Health risk assessment advice]
Table 1.
Unregulated contaminants analyzed in source water and finished drinking-water samples collected from public water systems throughout Minnesota, 2019, and associated laboratory reporting limits and human health-based advisory levels in nanograms per liter.[—Right][CASRN, Chemical Abstracts Services Registry Number; NWIS, National Water Information System; ELISA, enzyme- linked immunosorbent assay analytical method; Min, minimum; Max, maximum; NWQL, U.S. Geological Survey National Water Quality Laboratory; AXYS, SGS AXYS Services Ltd.; ATZ, atrazine; --, no data available; HRL, Minnesota Department of Health health risk limit; MCL, U.S. Environmental Protection Agency enforcable maximum contaminant level; HBV, Minnesota Department of Health health risk limit; HBSL, U.S. Geological Survey cancer health-based screening level; IMD, imidacloprid; PYR, pyrethroids; HHBP, U.S. Environmental Protection Agency carcinogenic or chronic noncancer human health benchmark for pesticide; CAF, caffeine; CBZ, carbamazepine; SMX, sulfamethoxazole; RAA, Minnesota Department of Health risk assessment advice]
Enzyme-Linked Immunosorbent Assay (ELISA) Methods
Concentrations of six target contaminants plus their immunologically similar contaminants (ATZTOT, IMDTOT, PYRTOT, CAFTOT, CBZTOT, and SMXTOT) in 162 samples from 67 public water systems were determined at UMID using commercially available ELISA kits (Eurofins-Abraxis Inc., Warminister, Pennsylvania). The contaminants analyzed in each sample differed depending on the source water used at a public water-supply system. A total of 122 source and finished drinking-water samples collected from 45 public water systems (SW, GWWW/Ag, and GWAg) were analyzed for three pesticide contaminant groups (ATZTOT, IMDTOT, and PYRTOT). A total of 122 source and finished drinking-water samples collected from 48 public water systems (SW, GWWW/Ag, and GWWW) were analyzed for three pharmaceutical contaminant groups (CAFTOT, CBZTOT and SMXTOT).
The ELISA analytical procedure is described in detail elsewhere (Eurofins-Abraxis Inc., 2019a, 2019b, 2019c, 2019d, 2019e, 2019f). Briefly, all environmental and quality-control (QC) samples were analyzed in duplicate and hereafter are referred to as analysis pairs. Several types of QC samples were provided by the manufacturer, including five to six calibration standards and up to two control samples of a known concentration. Other QC samples included laboratory reagent blanks, laboratory fortified blanks, and laboratory fortified sample matrix samples. First, the environmental and QC samples were dispensed into separate wells on the microplate. Antibody solution was then added to each well, mixed, and allowed to incubate either at ambient temperature or between 2 and 8 °C for between 30 and 90 minutes, depending on the contaminant being analyzed. After incubation, the contents in the wells were discarded and washed with a 1:5 wash buffer solution. Following the wash, the contents in the wells were discarded, a color solution was added to each well, and the microplate was incubated at ambient temperature or between 2 and 8 °C for 20 to 30 minutes, depending on the contaminant being analyzed. Lastly, stop solution was added to each well and within 15 minutes the plate was placed into a Bio Tek Microplate Reader (Bio Tek Instruments Inc., Winooski, Vermont) to read the absorbance of each well’s contents at 450 nanometers. The reporting limits for each contaminant range from 50 to 2,000 nanograms per liter (ng/L) for pesticides, and from 25 to 175 ng/L for pharmaceuticals (table 1).
A four-parameter logistic curve was produced for calibration of each batch assay analysis in Gen5 Microplate Software for Windows (Bio Tek Instruments, Winooski, Vermont). The calibration curve was validated by evaluating the percent coefficient of variation (CV) between absorbance values for each calibration standard pair. To accept the assay calibration, the CV must be less than or equal to 10 percent for each calibration standard pair. However, one calibration standard analysis pair can have less than or equal to 15 percent CV, providing the assay curve correlation coefficient (R2) is greater than or equal to 0.98. If the calibration fails the percent CV limits of absorbance and R2 less than 0.98, then the assay analysis is invalid. The percent CV for control and environmental analysis pairs is acceptable at less than 20 percent. When the percent CV exceeds this limit, the individual control or environmental sample analysis is invalid. Acceptable relative percent recovery limits for spiked samples range from 70 to 130 percent of the expected concentration. If recoveries are outside of this range, the results may be matrix biased. The relative percent difference (RPD) of laboratory fortified sample matrix samples should be less than 30 percent, and if RPD exceeds this limit then the precision of the plate analysis may be matrix biased.
Direct Aqueous Injection with Liquid Chromatography and Tandem Mass Spectrometry (LC-MS/MS) Pesticide Analysis at the U.S. Geological Survey National Water Quality Laboratory (NWQL)
A total of 122 source and finished drinking-water samples were collected from 45 SW, GWAg, and GWWW/Ag public water systems and analyzed at the NWQL for 225 pesticides by LC-MS/MS, using methods described in Sandstrom and others (2016). Briefly, a 100-microliter (µL) sample was directly injected into the LC-MS/MS without any sample preparation. Samples were analyzed in electrospray ionization positive and negative mode using two multiple- reaction monitoring conditions. The target contaminant atrazine (ATZ1) and five immunologically similar contaminants (ametryn [ATZ2], 2-chloro04-isopropylamino-6-amino-s-triazine [ATZ3], 2-hydrixy-4-isopropylamino-6-ehtylamino-s-triazine [ATZ4], propazine [ATZ5], and simazine [ATZ6]), along with the target contaminant imidacloprid (IMD1), and pyrethroids (cis-permethrin [PYR1] and bifenthrin [PYR2]), were included in the analysis. Reporting limits for each contaminant ranged from 3.2 to 250 ng/L (table1).
Direct Aqueous Injection with High Performance Liquid Chromatography and Tandem Mass Spectrometry (HPLC/MS/MS) Pharmaceutical Analysis at the U.S. Geological Survey National Water Quality Laboratory (NWQL)
A total of 122 source and finished drinking-water samples collected from 46 SW, GWWW, and GWWW/Ag public water systems were analyzed at the NWQL for 110 pharmaceuticals by HPLC/MS/MS, using methods described in Furlong and others (2014). Briefly, 100 µL of sample was directly injected into a HPLC/MS/MS. Samples were analyzed using an electrospray ionization source in the positive ion mode. The target contaminant caffeine (CAF1) and two immunologically similar compounds (1,7-dimethylxanthine [CAF2] and theophylline [CAF3]), the target contaminant carbamazepine (CBZ1) and one immunologically similar contaminant (amitriptyline [CBZ2]), and the target contaminant sulfamethoxazole (SMX1) and two immunologically similar contaminants (sulfamethizole [SMX2] and sulfadimethoxine [SMX3]), were included in analysis. Reporting limits for each contaminant ranged from 11 to 200 ng/L (table 1).
Direct Aqueous Injection with Liquid Chromatography and Tandem Mass Spectrometry (LC-MS/MS) Pharmaceutical Analysis at the SGS AXYS Analytical Services Ltd. (AXYS)
A total of 122 source and finished drinking-water samples collected from 46 SW, GWWW, and GWWW/Ag public water systems were analyzed at AXYS in British Columbia, Canada by LC-MS/MS (SGS AXYS Analytical Services Ltd., 2019). Briefly, samples were filtered and cleaned using solid-phase extraction. Extracts were then analyzed using LC-MS/MS run in multiple reaction monitoring mode. The target contaminant CAF1 and one immunologically similar contaminant (CAF2), the target contaminant CBZ1, and the target contaminant SMX1 and four immunologically similar contaminants (SMX2, SMX3, sulfamerazine [SMX4], and sulfamethazine [SMX5]), were included in analysis. Reporting limits for each contaminant ranged from 0.275 to 291 ng/L (table 1).
Field and Laboratory Quality Assurance/Quality Control
Field and laboratory QC samples were used to validate and interpret the environmental sample data. Field QC samples are used to assess the quality of the sampling process, including the collection, processing, preservation, transportation, and handling of the samples. Laboratory QC samples are used to assess the quality of the analytical procedure. Each laboratory analyzed blanks, reagent spikes, matrix spikes, and surrogates along with each batch of environmental samples. A detailed summary of the QC data for each of the three laboratory entities is available in Krall and Elliott (2022).
Eight field blanks and eight sequential replicates were collected. Field blank sample results were below the detection limit, with one exception. IMDTOT was detected by ELISA in one source and one finished water field blank sample. Many sequential field replicate sample results by each of the three laboratories were reported as below the detection limit, so RPD could not be assessed. For those that could be assessed, the RPD ranged from 2 to 30 percent for ATZ1, ATZ3, and ATZ4 (analyzed by NWQL) and was 51 percent for SMX5 (analyzed by AXYS).
Each laboratory analyzed blanks, reagent spikes, matrix spikes, and surrogates with each batch of environmental samples. CAF1 was detected in two laboratory blanks by AXYS, and SMXtot was detected in one laboratory blank by ELISA at UMID. Reagent and laboratory matrix spike sample recoveries ranged from 50 to 274 percent and from 16 to 211 percent, respectively. Reagent and matrix spike percent recoveries outside acceptable limits (greater than or equal to 70 and less than or equal to 130 percent) indicate the recoveries could be matrix biased.
Data Processing
The datasets from each laboratory were processed individually prior to making comparisons among them. Data generated by the three analytical laboratories are left censored, meaning that the true values of the censored values are unknown and lie between zero and the reporting limit. Each laboratory had different reporting limits for each contaminant, and some had multiple reporting limits for each contaminant (table 1). Appendixes 1 and 2 provide further discussion on the methods of both censoring contaminant groups and assessing false negative and false positive ELISA observations.
Immunologically Similar Contaminants
The ELISA method responds to immunologically similar (cross-reactive) contaminants, which provides an advantage of detecting target contaminants and associated degradates or metabolites (Eurofins-Abraxis Inc., 2019a, 2019b, 2019c, 2019d, 2019e, 2019f), and may provide an indication of the presence of contaminant mixtures. Therefore, the ELISA results were expected to be higher compared to the target contaminant results from NWQL and AXYS. The summation of the concentrations of target contaminants and immunologically similar contaminants reported by NWQL and AXYS were compared with ELISA results (table 1), and as previously mentioned, are referred to as contaminant groups. Not all immunologically similar contaminants with the potential to cross-react during the ELISA method analyses were analyzed by the other laboratories. The contaminants that make up each contaminant group are described in detail below.
Pesticides
The NWQL ATZTOT results are the summation of ATZ1 and five immunologically similar contaminant (ATZ2, ATZ3, ATZ4, ATZ5, and ATZ6; table 1) concentrations. Both ATZ3 and ATZ4 are metabolites and environmental degradation products of ATZ1, whereas ATZ2, ATZ5, and ATZ6 are herbicides belonging to the triazine class. The ELISA analytical method for ATZTOT also indicates the potential of cross-reactivity with terbuthylazine, an herbicide belonging to the triazine class, but this contaminant was not analyzed by the NWQL. The exclusion of terbuthylazine is considered trivial for this study because of its circumscribed use in industrial recirculating cooling water applications and ornamental fountains within the US (U.S. Environmental Protection Agency, 2010) and because it has a low cross-reactivity rate (0.33 percent) (Eurofins-Abraxis Inc., 2019a).
The NWQL IMDTOT results used in this analysis represent only IMD1 because none of the immunologically similar contaminants indicated by the ELISA method were analyzed. The only immunologically similar contaminant that could be of importance is clothianidin because it has a high potential cross-reactivity rate (121 percent) with ELISA and has been detected in both surface water and groundwater in Minnesota (Eurofins-Abraxis, 209d; Minnesota Department of Agriculture, 2020). Exclusion of the other immunologically similar contaminants from the comparison methods is expected to be trivial because of low cross-reactivity rates (less than 5 percent) or discontinued use in the State (Eurofins-Abraxis, 2019d, Minnesota Department of Agriculture, 2016b and 2020). The NWQL PYRTOT results are the summation of cis-permethrin (PYR1) and bifenthrin (PYR2) concentrations. Both PYR1 and PYR2 are insecticides belonging to the pyrethroid family. The ELISA analysis method for PYRTOT does not indicate the potential for cross-reactivity of any other contaminants outside the pyrethroid family (Eurofins-Abraxis Inc., 2019e), and no other contaminants within the pyrethroid family were analyzed at the NWQL.
Pharmaceuticals
The NWQL CAFTOT results are the summation of CAF1, CAF2, and CAF3 (table 1) concentrations. CAF2 is a metabolite and environmental degradation product of CAF1. CAF3 is a bronchodilator used to treat breathing disorders in human and veterinary medical practices (Jilani and others, 2021). The ELISA analytical method for CAFTOT indicates the potential of three other immunologically similar contaminants to exhibit cross-reactivity during analysis that were not analyzed by NWQL so were not included in the summation of CAFTOT. The exclusion of the latter three potentially cross-reactive contaminants is considered trivial because the cross-reactivity rate for each contaminant is <3 percent (Eurofins Abraxis Inc., 2019b).
The AXYS CAFTOT results are the summation of CAF1 and CAF2 (table 1) concentrations. The exclusion of CAF3 could be notable because it has been detected in Minnesota surface water (Minnesota Pollution Control Agency, 2017). Not including the other three potentially cross-reactive contaminants is considered trivial because the cross-reactivity rate for each contaminant is <3 percent (Eurofins Abraxis Inc., 2019b) and the presence of these contaminants in surface water and groundwater is unknown.
The NWQL CBZTOT results are the summation of CBZ1 and CBZ2 whereas the AXYS CBZTOT results represent CBZ1 only. The ELISA method indicates potential cross reactivity of six other immunologically similar contaminants that were not analyzed by NWQL. Only two of the immunologically similar contaminants are of potential importance (10,11-dihydro carbamazepine and 10,11-epoxy carbamazepine) because they have been detected in surface waters in Minnesota and worldwide (Miao and Metcalfe, 2003; Bahlmann and others, 2009; Writer and others, 2013) and have high cross-reactivity rates (97 and 78 percent, respectively).
The NWQL SMXTOT results are the summation of SMX1–SMX3, whereas the AXYS SMXTOT results are the summation of SMX1–SMX4. One sample was unquantifiable, resulting in one fewer sample result for SMX1, SMX2, and SMX4. The ELISA method indicates potential cross reactivity of 12 other immunologically similar contaminants (Eurofins-Abraxis, Inc., 2019f), none of which were analyzed by NWQL. The exclusion of 4 of the 12 immunologically similar contaminants is potentially important because these contaminants have been detected in Minnesota surface water (Minnesota Pollution Control Agency, 2017). The importance of excluding the other eight immunologically similar contaminants is unknown because their presence in the environment is unknown at the time of this report.
Analytical Method Comparisons
To evaluate the use of ELISA as a screening method for monitoring drinking water, we analyzed paired presence-absence agreement and concentration differences between ELISA and both the mass-spectrometry based analytical methods, as appropriate. The paired results have different reporting limits, and prior to comparison, each result of a pair was re-censored to the highest reporting limit of the two results. More detail is provided in appendix 1. Furthermore, because the data are highly censored (greater than 80 percent), the results of statistical analyses to discern agreement between paired concentrations by the Paired Prentice-Wilcoxon (PPW) test are tenuous. The PPW test and results are described in more detail in appendix 3.
The presence-absence test is a qualitative and presumptive test used to determine the presence of a contaminant in a sample rather than its concentration. The qualitative results (present or absent) for each result in a pair are then compared for agreement. For the presence-absence test, the contaminant was present in a sample if it was detected above the highest reporting limit; contrarily, the contaminant was determined absent in a sample if the contaminant was not detected above the highest reporting limit. If the contaminant was either present or absent in both results, the pair agreed. The result pair did not agree if the contaminant was present in one sample and absent from the other.
Results of Analyses
Sample data plus laboratory and field QC results for the three pesticides and three pharmaceuticals of interest determined by ELISA and NWQL methods, and for the three pharmaceuticals of interest determined by the AXYS method are available in Krall and Elliott (2022). As the results indicate, there were few detections of the contaminants. This made comparisons between detected concentrations seemingly insignificant. Appendix 4 provides detail on concentration differences between contaminant detections.
Pesticides and Pharmaceuticals Determined by Enzyme-Linked Immunosorbent Assay (ELISA)
Overall, there were few detections by ELISA for all six unregulated contaminants (0.8 to 18 percent; table 2). ATZTOT, IMDTOT, and PYRTOT were detected by ELISA in 4.1 (5 of 122 samples), 18 (22 of 122 samples), and 5.7 percent (7 of 122 samples) of samples, respectively (table 2; fig. 2A). CAFTOT, CBZTOT, and SMXTOT were detected by ELISA in 5.7 (7 of 122 samples), 0.8 (1 of 122 samples), and 1.6 percent (2 of 122 samples) of samples, respectively (table 2; fig. 2A).
Table 2.
Summary of pesticide and pharmaceutical detections analyzed in source and finish drinking-water samples collected from public water systems throughout Minnesota, 2019.[—Left][See table 1 for definitions of immunologically similar contaminants. ELISA, enzyme-linked immunosorbent assay analytical method; CO, censored observation; UO, uncensored observation; n, number of ovservations; %, percent; NWQL, U.S. Geological Survey National Water Quality Laboratory; AXYS, SGS AXYS Services Ltd.; --, no data]
Table 2.
Summary of pesticide and pharmaceutical detections analyzed in source and finish drinking-water samples collected from public water systems throughout Minnesota, 2019.[—Right][ELISA, enzyme-linked immunosorbent assay analytical method; NWQL, U.S. Geological Survey National Water Quality Laboratory; AXYS, SGS AXYS Services Ltd.; n, number of ovservations; %, percent; --, no data]
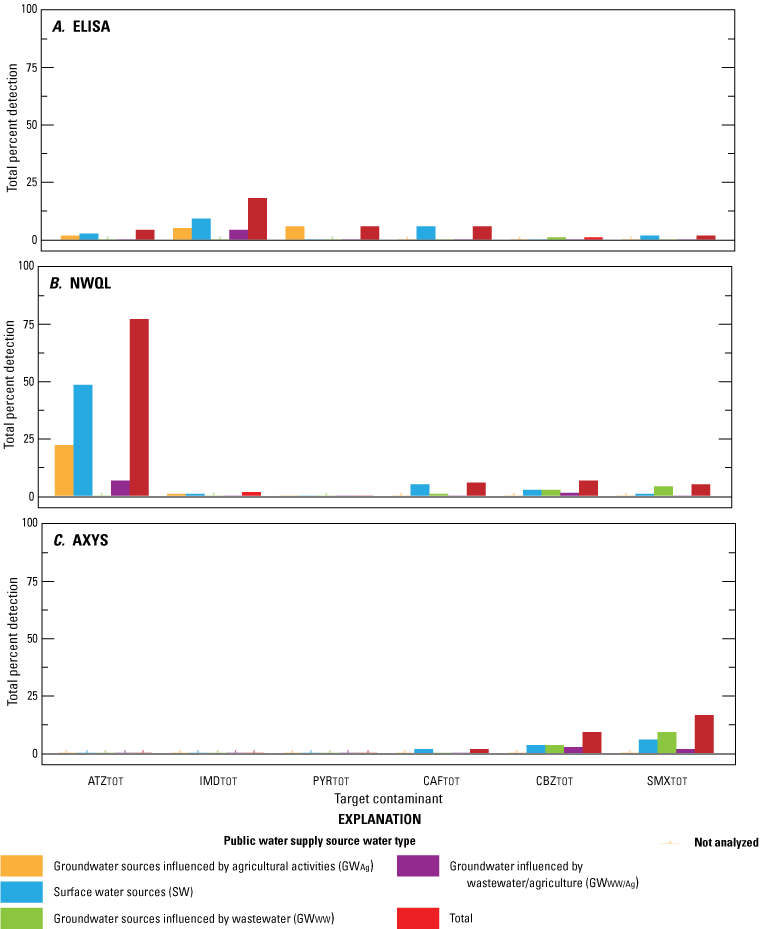
Percent of sample detections for six unregulated contaminant groups (atrazine group [ATZTOT], imidacloprid group [IMDTOT], pyrethroids group [PYRTOT], caffeine group [CAFTOT], carbamazepine group [CBZTOT], and sulfamethoxazole group [SMXTOT]) in source and finished drinking-water samples collected from public water systems throughout Minnesota, 2019. Samples were analyzed by A, enzyme-linked immunosorbent assay (ELISA) and by more advanced mass-spectrometry based analytical methods at: B, U.S. Geological Survey National Water Quality Laboratory (NWQL), and C, SGS AXYS Analytical Services Ltd. (AXYS).
Pesticides and Pharmaceuticals Determined by the National Water Quality Laboratory (NWQL)
Overall, ATZTOT was detected in 77 percent (94 of 122 samples) of samples analyzed by the NWQL method (table 2; fig. 2B). A total of 71.3 percent (87 of 122 samples) of samples had ATZ1 detections, while 65.5 percent (80 of 122 samples) of samples had detections of at least one immunologically similar contaminant. The ATZ1 immunologically similar contaminants most frequently detected by the NWQL method were ATZ3 and ATZ4, with detections at 46.7 (57 of 122) and 33.6 percent (41 of 122 samples), respectively. ATZ2, ATZ5, and ATZ6 were detected in ≤7 percent (≤8 of 122 samples) of samples. Generally, ATZ3 and ATZ4 made up a significant portion of the summed ATZTOT concentrations detected by the NWQL method, and ATZ4>ATZ3>ATZ1. IMD TOT was detected in 1.6 percent (2 of 122 samples) of samples by the NWQL method, and PYR TOT was not detected in any of the samples (fig. 2b).
Neither CAF2 nor CAF3 were detected in any of the samples by the NWQL method. CAF1 was detected in 5.7 percent (7 of 122 samples; table 2) of samples, thus CAFTOT reflects CAF1 concentrations (table 2; fig. 2b). CBZ2 was not detected in any of the samples analyzed by the NWQL method. CBZ1 was detected in 6.6 percent (8 of 122 samples) of samples, thus CBZTOT reflects CBZ1 concentrations. Overall, 4.9 percent (6 of 122 samples) of samples had SMXTOT detections by the NWQL method (table 2; fig. 2B). The target contaminant, SMX1, was detected in 3.3 percent (4 of 122 samples) of samples, while SMX3 was detected in <2 percent (2 of 122 samples) (table 2). SMX2 was not detected in any of the samples by the NWQL method (table 2).
Pharmaceuticals Determined by the SGS AXYS Analytical Services Ltd. (AXYS)
CAF2 was not detected in any of the samples by the AXYS method. However, CAF1 was detected in 1.6 percent (2 of 122 samples) of samples, thus CAFTOT reflects CAF1 concentrations (table 2; fig. 2C). Overall, 9 percent (11 of 122 samples) of samples analyzed by the AXYS method had CBZTOT detections, whereas 16.4 percent (20 of 122 samples) had SMXTOT detections (table 2; fig. 2C). SMX1 was detected in 10.7 percent (13 of 122) of samples. A total of 9 percent (11 of 122 samples) of samples had SMX1 was detected in ions but no immunologically similar contaminant detections.
Presence-Absence Agreement Among Analytical Methods
Figures 3 and 4 illustrate the differences in reporting limits for ELISA and the two comparison methods of analysis, where generally, reporting limits were ELISA>NWQL>AXYS. The higher reporting limits of the ELISA method between paired results (table 1), caused a decrease in the number of contaminant detections by NWQL and AXYS after re-censoring of the data (table 2).
The presence-absence agreement test between ELISA and the two comparison methods (NWQL and AXYS) ranged from 77.9 to 100 percent for all six contaminants (table 3). This indicates a generally good agreement between results of ELISA and those of the other two methods for detecting the presence of IMDTOT, PYRTOT, CAFTOT, CBZTOT, and SMXTOT but not for detecting the presence of ATZTOT, which will be discussed later in this report.
Table 3.
Paired result ties and presence-absence agreement between enzyme-linked immunosorbent assay (ELISA) and more advanced analytical methods by the U.S. Geological Survey National Water Quality Laboratory (NWQL) and SGS AXYS Analytical Services Ltd. (AXYS).[ELISA, enzyme-linked immunosorbent assay analytical method; NWQL, National Water Quality Laboratory; AXYS, SGS AXYS Servies Ltd.; ATZTOT, atrazine plus immunologically similar contaminants; IMDTOT, imidacloprid plus immunologically similar contaminants; PYRTOT, pyrethroids plus immunologically similar contaminants; CAFTOT, caffeine plus immunologically similar contaminants; CBZTOT, carbamazepine plus immunologically similar contaminants; SMXTOT, sulfamethoxazole plus immunologically similar contaminants]
Of the 162 total samples collected from the 67 public water systems, up to five contaminant groups were detected in a single sample across all three methods (Krall and Elliott, 2022; fig. 5). Generally, the greatest number of contaminant group detections across all three methods were in the source water samples. However, differences between detections in source water and finished drinking-water samples were statistically insignificant because of the few detections within each dataset. No contaminant groups were detected in 29 percent (47 of 162) of all samples, across all methods (fig. 5A). Samples collected from GWWW public water systems had the highest percentage (72.5 or 29 of 40) of samples with no contaminant group detections (fig. 5A). In contrast, samples collected from SW, GWAg, and GWWW/Ag public water systems had 7.6 (5 of 66), 22.5 (9 of 40), and 25 percent (4 of 16) of samples with no contaminant group detections. Two contaminant groups were detected in 21.6 (35 of 162) percent of all samples, across all methods. Samples with two contaminant groups detected were most commonly collected from GWWW/Ag public water systems (37.5 percent or 6 of 16 samples; fig. 5A). Less than 4 percent (1 to 6 of 162) of samples had more than two contaminant groups detected across all methods. Samples in which more than two contaminant groups were detected were most commonly collected from SW public water systems (fig. 5A).
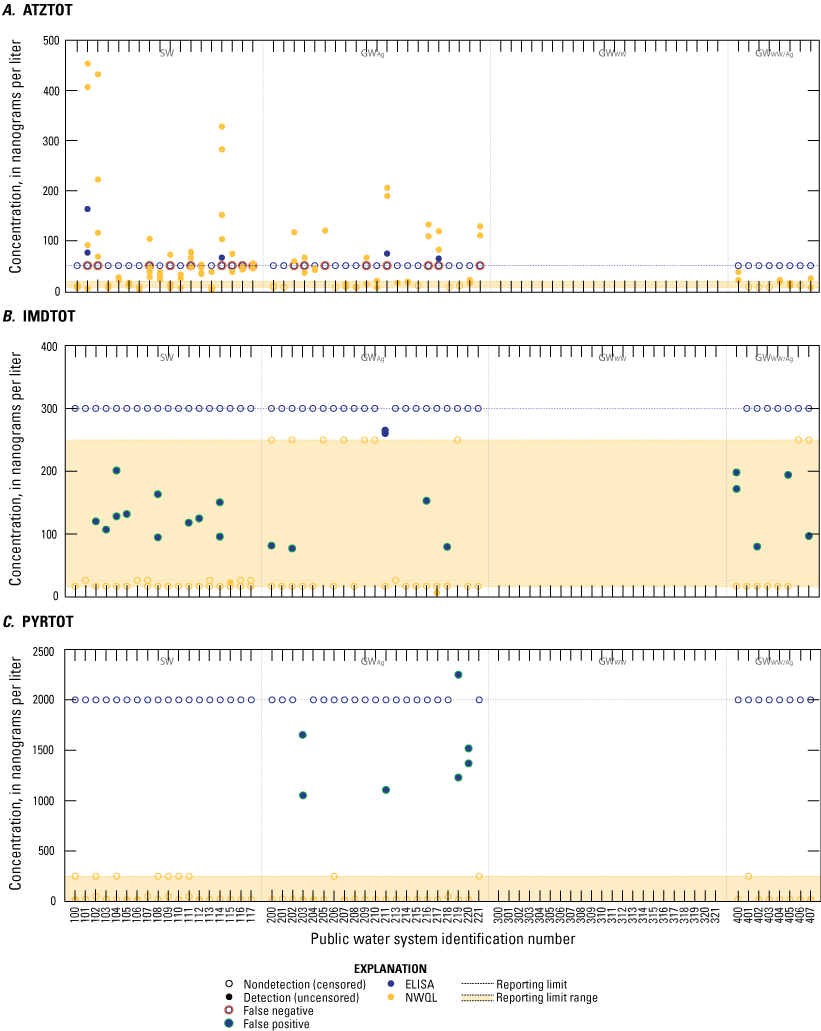
Concentrations of three unregulated pesticide contaminant groups: A, atrazine group (ATZTOT), B, imidacloprid group (IMDTOT), and C, pyrethroids group (PYRTOT) in source and finished drinking-water samples collected from public water systems throughout Minnesota, 2019. Samples were analyzed by enzyme-linked immunosorbent assay (ELISA) and by more advanced mass-spectrometry based analytical methods at the U.S. Geological Survey National Water Quality Laboratory (NWQL).
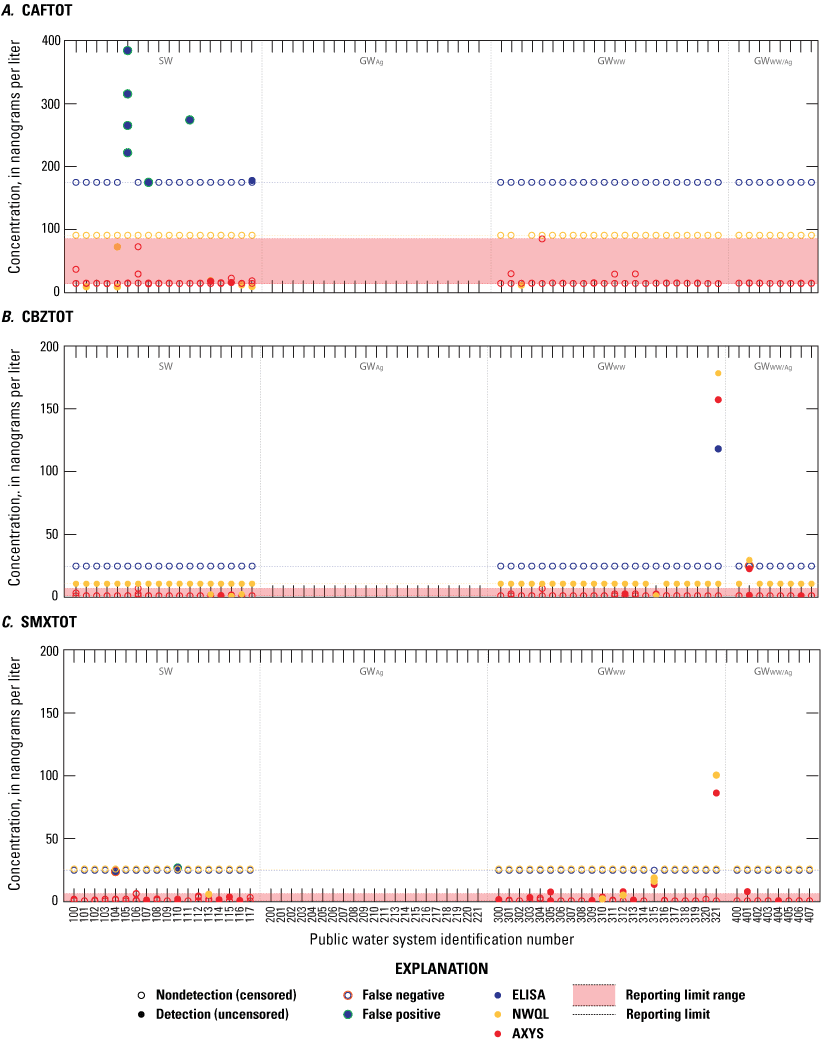
Concentrations of three unregulated pharmaceutical contaminant groups: A, caffeine group (CAFTOT), B, carbamazepine group (CBZTOT), and C, sulfamethoxazole group (SMXTOT) in source and finished drinking-water samples collected from public water systems throughout Minnesota, 2019. Samples were analyzed by enzyme-linked immunosorbent assay (ELISA) and more advanced mass-spectrometry based analytical methods at the U.S. Geological Survey National Water Quality Laboratory (NWQL) and SGS AXYS Analytical Services Ltd. (AXYS).
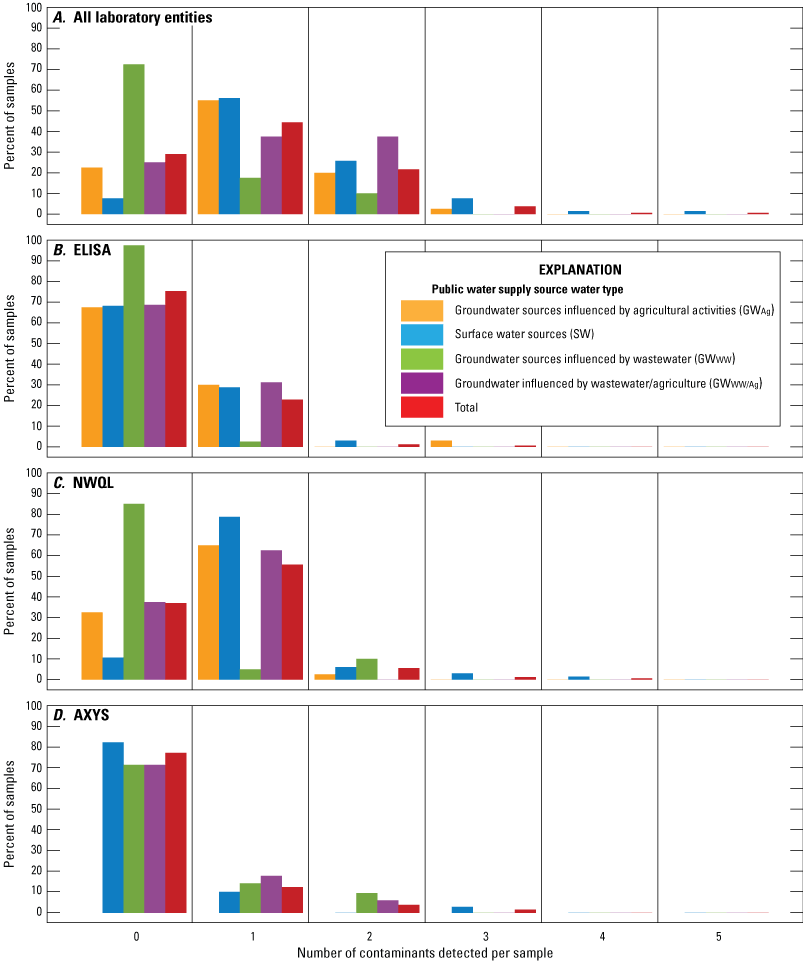
Percent of samples with zero to five contaminant group (atrazine group [ATZTOT], imidacloprid group [IMDTOT], pyrethroids group [PYRTOT], caffeine group [CAFTOT], carbamazepine group [CBZTOT], and sulfamethoxazole group [SMXTOT]) detections in a single source or finished drinking-water sample by public water system collected from public water systems throughout Minnesota, 2019, and by public water system source water type (surface water sourced [SW], groundwater sourced influenced by agricultural activities [GWAg], groundwater sourced influenced by wastewater [GWWW], groundwater sourced influenced by both wastewater and agricultural activities [GWWW/Ag]). Percent of samples with contaminant group detections are presented by A, all laboratory entities, B, enzyme-linked immunosorbent assay (ELISA), C, the U.S. Geological Survey National Water Quality Laboratory (NWQL), and D, SGS AXYS Analytical Services Ltd. (AXYS).
Implications of Using ELISA as a Screening Tool
Our ELISA ATZTOT analyses resulted in a high false negativity rate, which has also been documented in other studies (Graziano and others, 2006; Adams and others, 2004; Lydy and others, 1996). Generally, ELISA negatively biased results are assumed to be caused by matrix interference or mishandling of the test. Although some matrix samples had low recovery rates (<70 percent), most were within an ideal range (70 to 130 percent), indicating that matrix interference did not explain the high false negativity rate. One hypothesis for the negative bias is greater observed bias at higher concentrations. The consistent negative bias (underestimate) of ATZTOT results poses a monitoring risk if ELISA is used as a screening tool for drinking-water samples.
The false positivity rates of ELISA for analyses of IMDTOT, PYRTOT, and CAFTOT (16, 6, and 5 percent, respectively) can be attributed to the sensitivity of ELISA to cross-react with immunologically similar contaminants. This is of importance because although not all target contaminants are detected in Minnesota surface water and groundwater, immunologically similar contaminants (that is, degradates) have been detected (Minnesota Department of Agriculture, 2020). Some data on the occurrence of immunologically similar contaminants are available, but not all laboratories may include those contaminants in analyses. Thus, the ELISA results may not be false positives, but simply reflect the presence of immunologically similar contaminants. Overall, these results indicate that using ELISA for detecting the presence of IMDTOT, PYRTOT, and CAFTOT would be more overprotective than underprotective, which is considered beneficial for protecting human health.
Our analysis shows that results from ELISA generally are in good agreement (77.9 to 100 percent) with the results of advanced analytical methods for six unregulated contaminant groups: ATZTOT, IMDTOT, PYRTOT, CAFTOT, CBZTOT, and SMXTOT. Specifically, the false positivity and false negativity rates for ELISA CBZTOT and SMXTOT are low, indicating that ELISA is not substantially underestimating or overestimating the presence of these two contaminant groups. The presence-absence agreement analysis, combined with analysis of false positive and false negative rates, indicates ELISA could provide a suitable screening method for analyzing CBZTOT and SMXTOT in source and finished drinking-water samples collected from public water systems. However, the results also indicate that the use of ELISA as a screening tool for ATZTOT may not be a suitable method, and the use of ELISA for IMDTOT, PYRTOT, and CAFTOT should be further evaluated.
Summary
We assessed the use of the enzyme-linked immunosorbent assay (ELISA), a rapid, inexpensive screening method for contaminants in water, as an alternative to more expensive and advanced mass-spectrometry analytical methods conducted at two laboratories, the U.S. Geological Survey National Water Quality Laboratory (NWQL) and SGS AXYS Analytical Services Ltd. (AXYS). Samples of source water and finished drinking-water collected from 67 public water systems throughout Minnesota were analyzed for three commonly detected pesticides (atrazine, imidacloprid, and pyrethroids) and three commonly detected pharmaceuticals (caffeine, carbamazepine, and sulfamethoxazole).
The ELISA method detects the target contaminant and immunologically similar contaminants, thereby providing an indication of contaminant mixtures. Other studies have reported positive bias in the results of ELISA compared to results of other analytical methods because of the potential for ELISA to respond to immunologically similar contaminants. Therefore, this study referred to the summation of the target contaminant and immunologically similar contaminants as contaminant groups. The potential cross-reactivity between the ELISA target contaminant and immunologically similar contaminants could not be fully assessed for all contaminants during this analysis because the number of immunologically similar contaminants varied by comparison method.
Overall, these datasets are highly censored (>80 percent) and contain multiple reporting limits within and between laboratories. The highly censored data caused tenuous statistical results when comparing paired concentrations between ELISA and the comparison methods (used at NWQL and AXYS). Thus, qualitative analysis of the data was deemed more appropriate. Generally, ELISA had higher reporting limits than the methods used by both the NWQL and AXYS, except for the analysis for SMXTOT at NWQL. To discern agreement between paired results between ELISA and the comparison methods, the results of the presence-absence agreement analysis was coupled with false negative and false positive result analysis.
Both CBZTOT and SMXTOT ELISA have very low false negative rates (1.6 and 0.8 percent, respectively) for samples with detections below the reporting limit (25 and 26 ng/L, respectively). These very low false negative results indicate that CBZTOT and SMXTOT ELISA methods are not underestimating results. Conversely, SMXTOT has a very low false positivity rate (0.8 percent) which indicates the SMXTOT ELISA method is not overestimating results.
Although there is 78 percent agreement between ATZTOT ELISA and NWQL paired results, the false negativity rate of 84 percent indicates strong negative bias. This strong negative bias indicates that the ELISA method is underestimating ATZTOT, which is not an ideal result for monitoring drinking water.
The false positivity rates for IMDTOT, PYRTOT, and CAFTOT (16, 6, and 5 percent) are higher than CBZTOT and SMXTOT but are still relatively low. These results indicate the ELISA method could be overestimating the results in this contaminant group. This positive bias could be attributed to the detection of other immunologically similar contaminants that have the potential to cross-react during ELISA analysis and are known to be present in Minnesota surface water and groundwater but were not analyzed by the comparison laboratories.
These qualitative results indicate the ELISA method could potentially provide an alternative screening method for the presence of CBZTOT and SMXTOT in source and finished drinking-water samples collected from public water systems but did not prove to be a good alternative for ATZTOT. Efforts could be expanded to continue to study the use of ELISA as a reliable and cost-effective screening method to help drinking water monitoring entities prioritize sampling efforts for screening source and finished drinking-water samples for IMDTOT, PYRTOT, and CAFTOT.
References Cited
Adams, C., Jiang, H., McGuire, M., Graziano, N., Roberson, A., and Frey, M., 2004, Accuracy and interference for Enzyme-linked Immunoassay tests for atrazine: American Water Works Association, v. 96, n. 12, p. 126–136. [Also available at https://www.jstor.org/stable/41311948.]
Bahlmann, A., Weller, M.G., Panne, U., and Schneider, R.J., 2009, Monitoring carbamazepine in surface and wastewaters by an immunoassay based on a monoclonal antibody: Analytical and Bioanalytical Chemistry, v. 395, no. 6, p. 1809–1820. [Also available at https://doi.org/10.1007/s00216-009-2958-7.]
Bradley, P.M., Barber, L.B., Duris, J.W., Foreman, W.T., Furlong, E.T., Hubbard, L.E., Hutchinson, K.J., Keefe, S.H., and Koplin, D.W., 2014, Riverbank filtration potential of pharmaceuticals in a wastewater-impacted stream: Environmental Pollution, v. 193, p. 173–180. [Also available at https://doi.org/10.1016/j.envpol.2014.06.028.]
Ebele, A.J., Abou-Elwafa Abdallah, M., and Harrad, S., 2017, Pharmaceuticals and personal care products (PPCPs) in the freshwater aquatic environment: Emerging Contaminants, v. 3, no. 1, p. 1–16. [Also available at https://doi.org/10.1016/j.emcon.2016.12.004.]
Elliott, S.M., Brigham, M.E., Lee, K., Banda, J.A., Choy, S.J., Gefell, D.J., Minarik, T.A., Moore, J.N., and Jorgenson, Z.G., 2017, Contaminants of emerging concern in tributaries to the Laurentian Great Lakes—I. Patterns of occurrence: PLoS One, v. 23, no. 9, p. 1–21. [Also available at https://doi.org/10.1371/journal.pone.0182868.]
Elliott, S.M., Erickson, M.L., Krall, A.L., and Adams, B.A., 2018, Concentrations of pharmaceuticals and other micropollutants in groundwater downgradient from large on-site wastewater discharge: PLoS One, v. 13, no. 11, p. e0206004. [Also available at https://doi.org/10.1371/journal.pone.0206004.]
Erickson, M.L., Langer, S.K., Roth, J.L., and Kroening, S.E., 2014, Contaminants of emerging concern in ambient groundwater in urbanized areas of Minnesota, 2009–12 (ver. 1.2, September 2014): U.S. Geological Survey Scientific Investigations Report 2014–5096, 38 p., with appendix. [Also available at https://doi.org/10.3133/sir20145096.]
Eurofins-Abraxis, Inc., 2019a, Atrazine ELISA user guide: Eurofins-Abraxis, Inc. [Also available at https://abraxis.eurofins-technologies.com/home/products/rapid-test-kits/pesticides-herbicides/pesticide-elisa-plate-kits/atrazine-elisa-96-test/.]
Eurofins-Abraxis, Inc., 2019b, Imidacloprid ELISA user guide: Eurofins-Abraxis, Inc. [Also available at https://abraxis.eurofins-technologies.com/home/products/rapid-test-kits/pesticides-herbicides/pesticide-elisa-plate-kits/imidaclopridclothianidin-elisa-96-test/.]
Eurofins-Abraxis, Inc., 2019c, Caffeine ELISA user guide: Eurofins-Abraxis, Inc. [Also available at https://abraxis.eurofins-technologies.com/home/products/rapid-test-kits/markers-for-bioactivity/markers-for-bioactivity-elisa-plate-kits/caffeine-elisa-96-test/.]
Eurofins-Abraxis, Inc., 2019d, Carbamazepine ELISA user guide: Eurofins-Abraxis, Inc. [Also available at https://abraxis.eurofins-technologies.com/home/products/rapid-test-kits/markers-for-bioactivity/markers-for-bioactivity-elisa-plate-kits/carbamazepine-elisa-96-test/.]
Eurofins-Abraxis, Inc., 2019e, Pyrethroids ELISA user guide: Eurofins-Abraxis, Inc. [Also available at https://abraxis.eurofins-technologies.com/home/products/rapid-test-kits/pesticides-herbicides/pesticide-elisa-plate-kits/pyrethroids-elisa-96-test/.]
Eurofins-Abraxis, Inc., 2019f, Sulfamethoxazole ELISA user guide: Eurofins-Abraxis, Inc. [Also available at https://abraxis.eurofins-technologies.com/home/products/rapid-test-kits/veterinary-residues-additives/veterinary-residues-additives-elisa-kits/sulfamethoxazole-smx-elisa-96-test/.]
Furlong, E.T., Noriega, M.C., Kanagy, C.J., Kanagy, L.K., Coffey, L.J., and Burkhardt, M.R., 2014, Determination of human-use pharmaceuticals in filtered water by direct aqueous injection–high-performance liquid chromatography/tandem mass spectrometry: U.S. Geological Survey Techniques and Methods, book 5, chap. B10, 49 p. [Also available at https://doi.org/10.3133/tm5B10.]
Glassmeyer, S.T., Furlong, E.T., Koplin, D.W., Batt, A.L., Benson, R., Boone, J.S., Conerly, O., Donohue, M.J., King, D.N., Kostich, M.S., Mash, H.E., Pfaller, S.L., Schenck, K.M., Simmons, J.E., Varughese, E.A., Vesper, S.J., Villegas, E.N., and Wilson, V.S., 2017, Nationwide reconnaissance of contaminants of emerging concern in source and treated drinking water of the United States: Science of the Total Environment, v. 581–582, p. 909–922. [Also available at https://doi.org/10.1016/j.scitotenv.2016.12.004.]
Graziano, N., McGuire, M., Adams, C., Roberson, A., Jiang, H., and Blute, N., 2006, Using the ELISA method to track atrazine occurrence in a national monitoring program: American Water Works Association, v. 98, n. 10, p. 111-123 [Also available at https://www.jstor.org/stable/41312283.]
Jilani, T.N., Preuss, C.V., and Sharma, S., 2021, StatsPearls: Treasure Island, Fla., StatPearls Publishing. [Also available at https://www.ncbi.nlm.nih.gov/books/NBK519024/.]
Krall, A.L., Elliott, S.M., Erickson, M.E., and Adams, B.A., 2018, Detecting sulfamethoxazole and carbamazepine in groundwater—Is ELISA a reliable screening tool?: Environmental Pollution, v. 234, p. 420–428. [Also available at https://doi.org/10.1016/j.envpol.2017.11.065.]
Krall, A.L., and Elliott, S.M., 2022, Concentrations and laboratory quality-assurance data for six unregulated contaminants measured in source and finished drinking-water samples collected from public water systems throughout Minnesota by using ELISA and MS-based analytical methods: U.S. Geological Survey data release, https://doi.org/10.5066/P9MLY0GM.
Lee, K.E., Langer, S.K., Barber, L.B., Writer, J.H., Ferrey, M.L., Schoenfuss, H.L., Furlong, E.T., and William, T., Foreman, Gray, J.L., ReVello, R.C., Martinovic, D., Woodruff, O.P., Keefe, S.H., Brown, G.K., Taylor, H.E., Ferrer, I., and Thurman, E.M., 2011, Endocrine active chemicals, pharmaceuticals, and other chemicals of concern in surface water, wastewater-treatment plant effluent, and bed sediment, and biological characteristics in selected streams, Minnesota—design, methods, and data, 2009: U.S. Geological Survey Data Series 575, 54 p., with appendixes [Also available at https://pubs.usgs.gov/ds/575.]
Lydy, M.J., Carter, D.S., and Crawford, C.G., 1996, Comparison of gas chromatography/mass spectrometry and immunoassay techniques on concentrations of atrazine in storm runoff: Archives of Environmental Contamination and Toxicology, v. 31, no. 3, p. 378–385. [Also available at https://doi.org/10.1007/BF00212676.]
Miao, X., and Metcalfe, C.D., 2003, Determination of carbamazepine and its metabolites in aqueous samples using liquid chromatography—Electrospray tandem mass spectrometry: Analytical Chemistry, v. 75, no. 15, p. 3731–3738. [Also available at https://doi.org/10.1021/ac030082k.]
Minnesota Department of Agriculture, 2016a, 2015 reconnaissance study of pesticide compound in community public water supply wells: Minnesota Department of Agriculture, accessed December 15, 2020, at https://www.mda.state.mn.us/sites/default/files/inline-files/2015PesticideReconReport_0.pdf.
Minnesota Department of Agriculture, 2016b, Review of neonicotinoid use, registration, and insect pollinator impacts in Minnesota: Minnesota Department of Agriculture, accessed August 3, 2021, at https://www.mda.state.mn.us/sites/default/files/inline-files/neonicreviewrpt2016.pdf.
Minnesota Department of Agriculture, 2019, 2019 Water quality monitoring report: Minnesota Department of Agriculture, accessed December 15, 2020, at https://wrl.mnpals.net/islandora/object/WRLrepository%3A3656/datastream/PDF/view.
Minnesota Department of Agriculture, 2020, 2020 Water quality monitoring report: Minnesota Department of Agriculture, accessed December 15, 2020, at https://wrl.mnpals.net/islandora/object/WRLrepository%3A3746/datastream/PDF/view.
Minnesota Department of Health, 2020a, Comparison of State water guidance and Federal drinking water standards: Minnesota Department of Agriculture, accessed August 12, 2020, at https://www.health.state.mn.us/communities/environment/risk/guidance/waterguidance.html.
Minnesota Department of Health, 2020b, Public drinking water program: Minnesota Department of Health, accessed August 12, 2020, at https://www.health.state.mn.us/communities/environment/water/factsheet/dwprog.html.
Minnesota Pollution Control Agency, 2017, Pharmaceuticals and chemicals of concern in rivers—Occurrence and biological effects: Minnesota Department of Agriculture, accessed July 20, 2021, at https://www.pca.state.mn.us/sites/default/files/tdr-g1-20.pdf.
Noguera-Oviedo, K., and Aga, D.S., 2016, Lessons learned from more than two decades of research on emerging contaminants in the environment: Journal of Hazardous Materials, v. 316, p. 242–251. [Also available at https://doi.org/10.1016/j.jhazmat.2016.04.058.]
Sandstrom, M.W., Kanagy, L.K., Anderson, C.A., and Kanagy, C.J., 2016, Determination of pesticides and pesticide degradates in filtered water by direct aqueous-injection liquid chromatography-tandem mass spectrometry: U.S. Geological Survey Techniques and Methods, book 5, chap. B11, 54 p. [Also available at https://doi.org/10.3133/tm5B11.]
Trost, J.J., Kiesling, R.L., Erickson, M.L., Rose, P.J., and Elliott, S.M., 2013, Land-cover effects on the fate and transport of surface-applied antibiotics and 17-beta-estradiol on a sandy outwash plain, Anoka County, Minnesota, 2008–09: U.S. Geological Survey Scientific Investigations Report 2013–5202, 51 p. [Also available at https://doi.org/10.3133/sir20135202.]
U.S. Environmental Protection Agency, 2010, Terbuthylazine summary document—Registration review: U.S. Environmental Protection Agency, accessed August 3, 2021, at https://www.regulations.gov/document/EPA-HQ-OPP-2010-0453-0002.
U.S. Environmental Protection Agency, 2020, National primary drinking water regulations: U.S. Environmental Protection Agency, accessed August 12, 2020, at https://www.epa.gov/ground-water-and-drinking-water/national-primary-drinking-water-regulations.
U.S. Environmental Protection Agency, 2021, Toxic Substance Control Act (TSCA) chemical substance Inventory: U.S. Environmental Protection Agency, accessed May 26, 2021, at https://www.epa.gov/tsca-inventory.
Wilkinson, J., Hooda, P.S., Barker, J., Barton, S., and Swinden, J., 2017, Occurrence, fate and transformation of emerging contaminants in water—An overarching review of the field: Environmental Pollution, v. 231, p. 954–970. [Also available at https://doi.org/10.1016/j.envpol.2017.08.032.]
Writer, J.H., Ferrer, I., Barberm, L.B., and Thurman, E.M., 2013, Widespread occurrence of neuro-active pharmaceuticals and metabolites in 24 Minnesota rivers and wastewaters: Science of the Total Environment, v. 461–462, p. 519–527. [Also available at https://doi.org/10.1016/j.scitotenv.2013.04.099.]
Appendix 1. Censoring Analytical Result Data
Contaminant Group Result Censoring
The ELISA method has the potential to detect the target contaminant and immunologically similar (cross-reactive) contaminants (Eurofins-Abraxis Inc., 2019a, 2019b, 2019c, 2019d, 2019e, 2019f). For this reason, the data in this study represent contaminant groups, or contaminant mixtures (the sum of the target contaminant and immunologically similar contaminants indicated by ELISA (Eurofins-Abraxis Inc., 2019a, 2019b, 2019c, 2019d, 2019e, 2019f) if analyzed and detected by the respective laboratory). In the case where a result was both a sum of the target contaminant and immunologically similar contaminants, and censored, the final result value used in analysis is the reporting limit of the target contaminant, except for PYRTOT. PYRTOT was censored to the higher reporting limit between PYR1 and PYR2, which most often was the reporting limit of PYR2 (table 1). A summary of censored and uncensored results for each contaminant group, target contaminant, and immunologically similar contaminants is provided in table 2.
Paired Result Re-censoring
Contaminant group results by ELISA were paired with results by the two comparison methods (NWQL and AXYS). These result pairs have different reporting limits, and for comparison, each result of a paired result was re-censored to the highest reporting limit of the two results. Generally, reporting limits were ELISA>NWQL>AXYS (table 1). The data were re-censored prior to analytical method comparisons under two scenarios: 1) if both results in a result pair were censored at different reporting limits, then the lower censored value was re-censored to the higher censored value where the result pair remains a tie; or 2) if one result in a result pair was censored at a higher limit than its uncensored result, then the uncensored result was re-censored to the censored result where the result pair then becomes a tie. No re-censoring occurred if: (1) both results in a result pair were uncensored (and therefore, untied) or (2) the censored result was less than the uncensored result (mixed and untied). Results of re-censoring are provided in table 3.
References Cited
Eurofins-Abraxis, Inc., 2019a, Atrazine ELISA user guide: Eurofins-Abraxis, Inc. [Also available at https://abraxis.eurofins-technologies.com/home/products/rapid-test-kits/pesticides-herbicides/pesticide-elisa-plate-kits/atrazine-elisa-96-test/.]
Eurofins-Abraxis, Inc., 2019b, Imidacloprid ELISA user guide: Eurofins-Abraxis, Inc. [Also available at https://abraxis.eurofins-technologies.com/home/products/rapid-test-kits/pesticides-herbicides/pesticide-elisa-plate-kits/imidaclopridclothianidin-elisa-96-test/.]
Eurofins-Abraxis, Inc., 2019c, Caffeine ELISA user guide: Eurofins-Abraxis, Inc. [Also available at https://abraxis.eurofins-technologies.com/home/products/rapid-test-kits/markers-for-bioactivity/markers-for-bioactivity-elisa-plate-kits/caffeine-elisa-96-test/.]
Eurofins-Abraxis, Inc., 2019d, Carbamazepine ELISA user guide: Eurofins-Abraxis, Inc. [Also available at https://abraxis.eurofins-technologies.com/home/products/rapid-test-kits/markers-for-bioactivity/markers-for-bioactivity-elisa-plate-kits/carbamazepine-elisa-96-test/.]
Eurofins-Abraxis, Inc., 2019e, Pyrethroids ELISA user guide: Eurofins-Abraxis, Inc. [Also available at https://abraxis.eurofins-technologies.com/home/products/rapid-test-kits/pesticides-herbicides/pesticide-elisa-plate-kits/pyrethroids-elisa-96-test/.]
Eurofins-Abraxis, Inc., 2019f, Sulfamethoxazole ELISA user guide: Eurofins-Abraxis, Inc. [Also available at https://abraxis.eurofins-technologies.com/home/products/rapid-test-kits/veterinary-residues-additives/veterinary-residues-additives-elisa-kits/sulfamethoxazole-smx-elisa-96-test/.]
Appendix 2. False Negative and False Positive Analysis
Determination of False Negative and False Positive Results
In the analysis of false negative and false positive ELISA results, the contaminant group results provided by the NWQL were considered accurate and, therefore, the ELISA results were compared to the NWQL group contaminant results. False negative results indicate the absence of a contaminant when it is present, whereas false positive results indicate the presence of a contaminant when it is either absent or present at a concentration below the detection limit. If the contaminant was not detected by ELISA but was detected by NWQL and above the higher reporting limit between ELISA and NWQL, then the ELISA result was determined to be a false negative. If the contaminant was detected by ELISA and above the NWQL reporting limit but was not detected by NWQL, then the ELISA result was determined to be a false positive.
Occurrence of False Negatives and False Positives
The ELISA analytical method produced 2 (of 122) and 1 (of 122) false negative results for CBZTOT and SMXTOT, respectively (table 2 and fig. 4). No false negatives were produced for IMDTOT, PYRTOT, and CAFTOT (table 2 and figs. 3 and 4). A total of 27 (of 122) false negatives were produced for ELISA ATZTOT (table 2; fig. 3A). CBZTOT and SMZTOT false negative results could be explained by the summation of the target contaminant and immunologically similar contaminants from NWQL causing a positive bias in the contaminant group concentrations when actual cross-reactivity is relatively low, whereas ATZTOT false negative results could be explained by an undetected interference during ELISA analysis, or by systematic bias at higher ATZTOT concentrations.
A total of 7 (of 122), 6 (of 122), and 1 (of 122) false positive results were produced for PYRTOT, CAFTOT, and SMXTOT, respectively, with ELISA methods (table 2; figs. 3 and 4). No false positive results were produced for ATZTOT and CBZTOT (table 2; figs. 3A and 4B). A total of 20 (of 122) false positive results were produced for IMDTOT (table 2; fig. 3B), which were detections below the reporting limit (300 ng/L) but above the detection limit (75 ng/L). False positive results could be explained by the potential of ELISA to detect immunologically similar contaminants that are not included in the NWQL contaminant group concentration (figs. 3 and 4).
Appendix 3. Paired Prentice-Wilcoxon Test
Paired Prentice-Wilcoxon Test Methods
ELISA ATZTOT, IMDTOT, and PYRTOT were compared to NWQL results, while ELISA CAFTOT, CBZTOT, and SMXTOT were compared to both NWQL and AXYS results. Paired results were compared using the Paired Prentice-Wilcoxon (PPW) test (O’Brien and Fleming, 1987), a nonparametric score test that compares paired results between two groups. The PPW test is well-suited for analysis of multiply censored data and is built to handle ties (both results in a paired result being censored) between results pairs (Helsel, 2012). Helsel indicates PPW test results can be tenuous when datasets are greater than 80 percent censored and have less than or equal to 2 uncensored result pairs. The PPW tests were computed in RStudio version 4.0.2 (R Studio Team, 2020) using the ppw.test function in the smwrQW package version 0.7.14 (Lorenz, 2017). Scores are computed for each result as a measure of position of the result in the datasets. The numeric differences between scores for the ELISA results and scores for the other laboratory results were computed to determine whether the sum of the differences for the entire dataset was significantly different from zero at the 95-percent confidence level. The computed PPW test provides a Z-score to describe the distribution of the data. The scores for ELISA results were less than scores for the other two laboratory results, if Z less and zero 0, equal if Z equals 0, and greater if Z greater than 0. Because the PPW test is not built to handle different reporting limits between results in a paired result (Helsel, 2012), result pairs are re-censored to the highest reporting limit of the two results (as described in app. 1) prior to computing the PPW test, as recommended by O’Brien and Fleming (1987) and Helsel (2012).
Paired Prentice-Wilcoxon Test Results
Differences between result pairs were evaluated to discern agreement between concentrations determined by the different methods. Result pairs for IMDTOT could not be compared between ELISA and NWQL methods because of the lack of variance between the two datasets, as a result of re-censoring (described in app. 1), which changed all NWQL results to censored results. Paired results were significantly different for all possible comparisons (p less than 0.05), except for CBZTOT and SMXTOT between ELISA and both comparison methods (table 3.1). Although ELISA CBZTOT and SMXTOT concentrations deviated slightly from the comparison methods, the differences were not significantly different (p greater than 0.05, table 3.1). Plots of numeric differences between ELISA and NWQL and ELISA and AXYS paired results are depicted in figures 3.1 through 3.3. These plots suggest many of the method comparisons have outliers, but this could be explained by the high percent of censored results and little spread in the data.
Table 3.1.
Paired Prentice-Wilcoxon test results for paired results for enzyme-linked immunosorbent assay (ELISA) and more advanced analytical methods for both the U.S. Geological Survey National Water Quality Laboratory (NWQL) and SGS AXYS Analytical Services Ltd. (AXYS).[Z, z-score statistic; ELISA, enzyme-linked immunosorbent assay analytical method; NWQL, National Water Quality Laboratory; ATZTOT, atrazine plus immunologically similar contaminants; IMDTOT, imidacloprid plus immunologically similar contaminants; NA, not available; PYRTOT, pyrethroids plus immunologically similar contaminants; AXYS, SGS AXYS Servies Ltd.; CAFTOT, caffeine plus immunologically similar contaminants; CBZTOT, carbamazepine plus immunologically similar contaminants; SMXTOT, sulfamethoxazole plus immunologically similar contaminants]
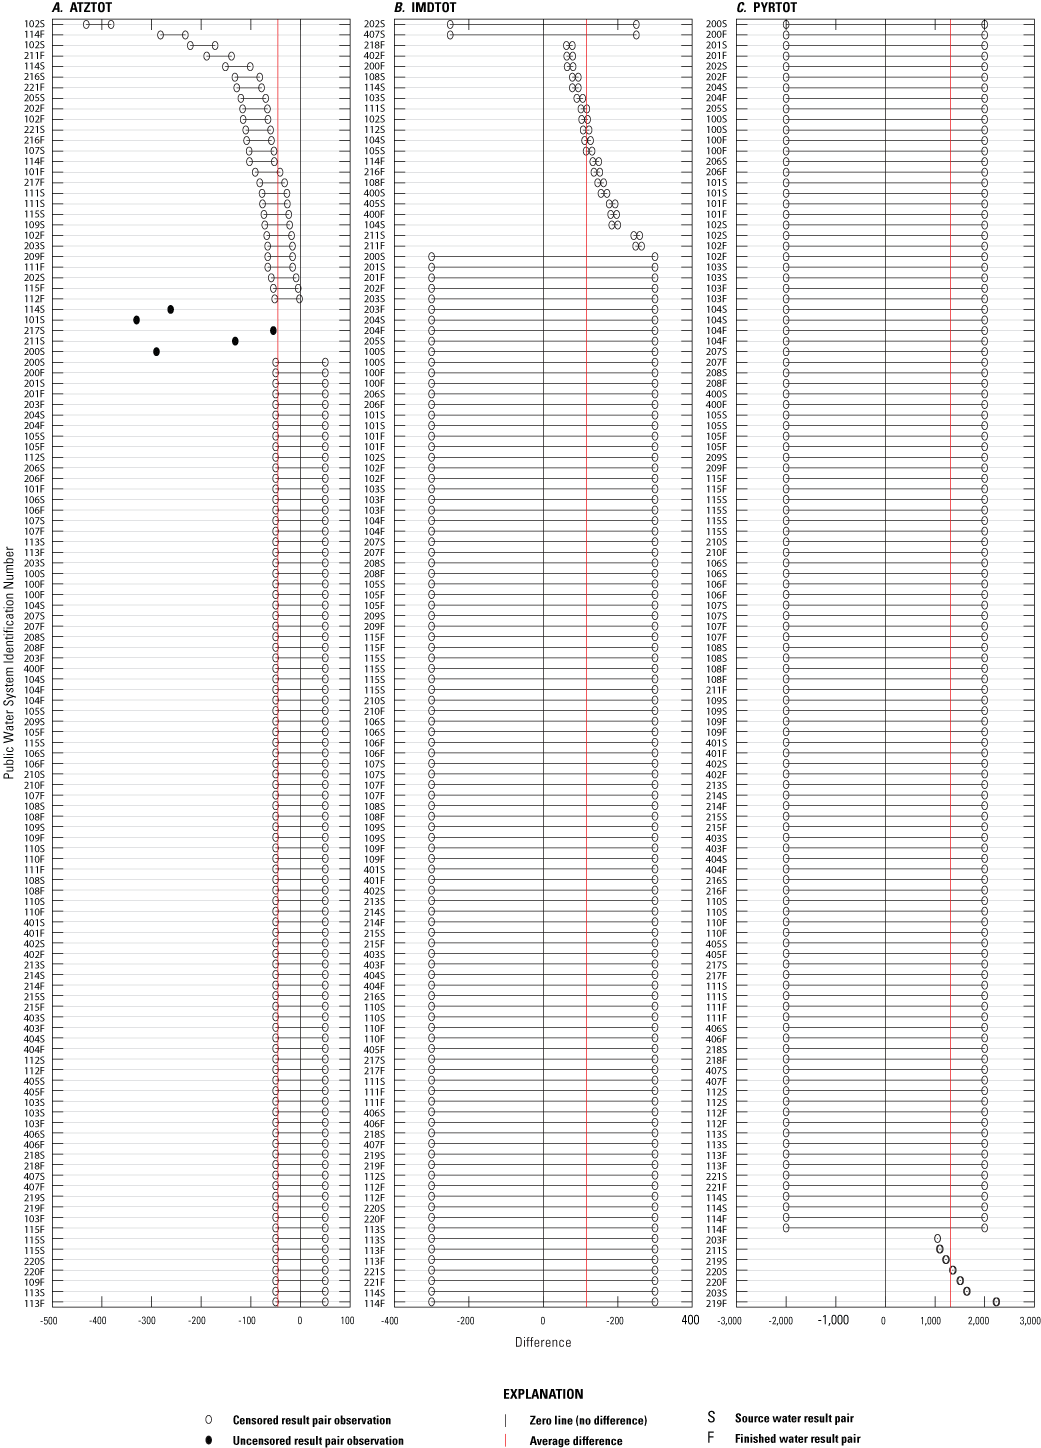
Plots of numeric differences between paired results from the enzyme-linked immunosorbent assay method (ELISA) and the U.S. Geological Survey National Water Quality Laboratory (NWQL) for three pesticide groups: A, atrazine (ATZTOT), B, imidacloprid (IMDTOT), and C, pyrethroids (PYRTOT).
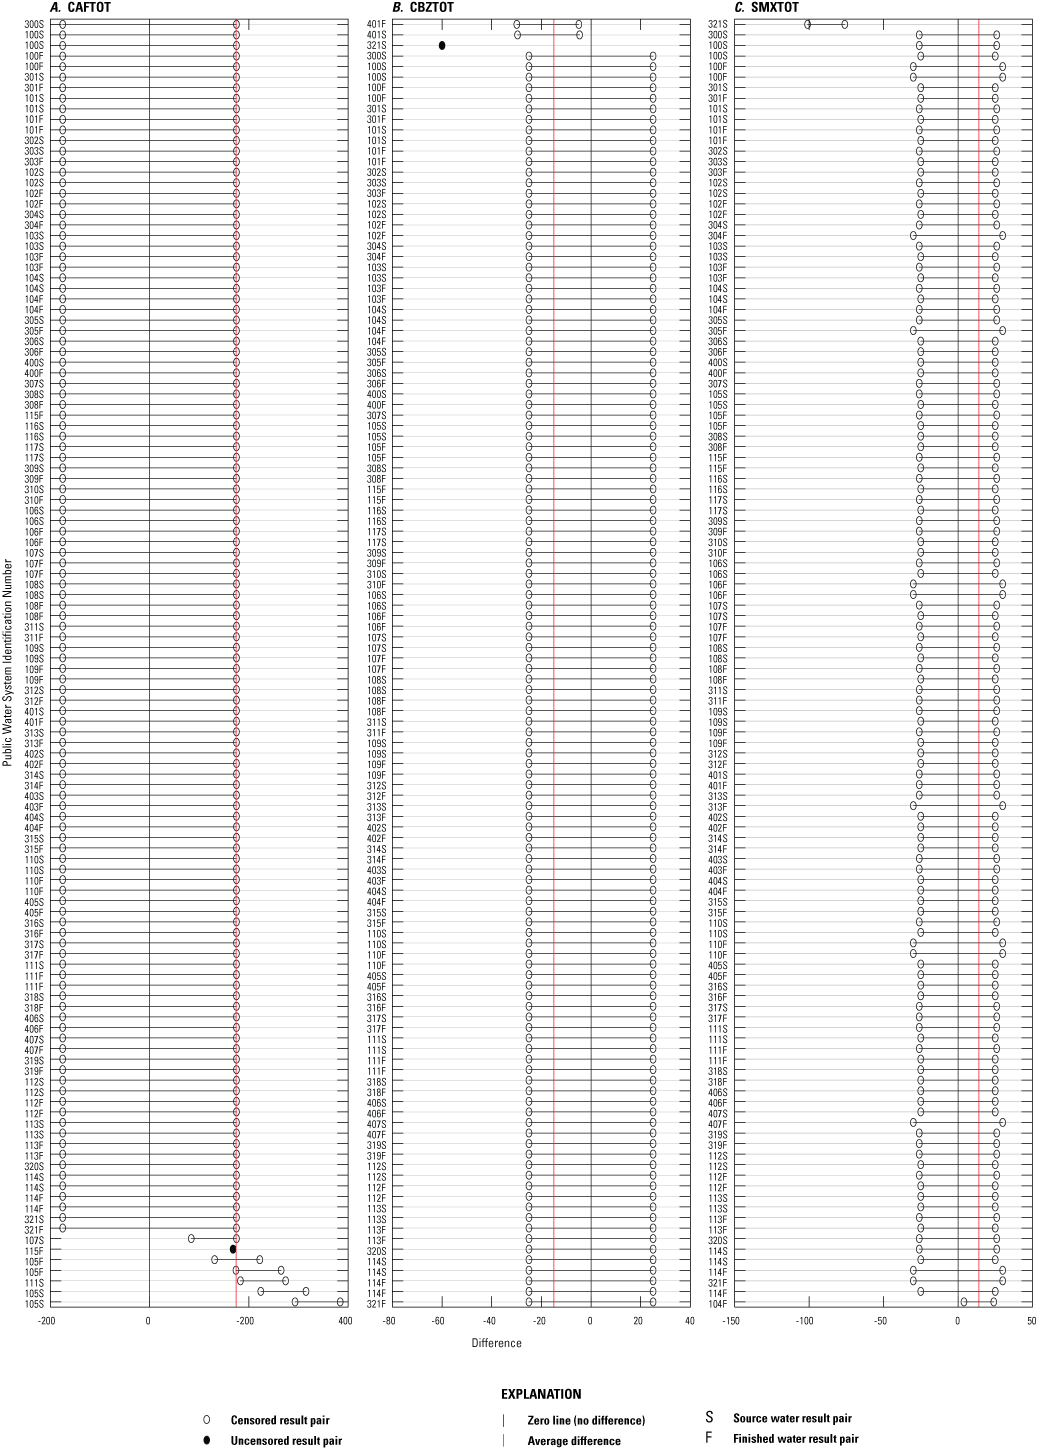
Plots of numeric differences between paired results from the enzyme-linked immunosorbent assay method (ELISA) and the U.S. Geological Survey National Water Quality Laboratory (NWQL) for three pharmaceutical groups: A, caffeine (CAFTOT), B, carbamazepine (CBZTOT), and C, sulfamethoxazole (SMXTOT).
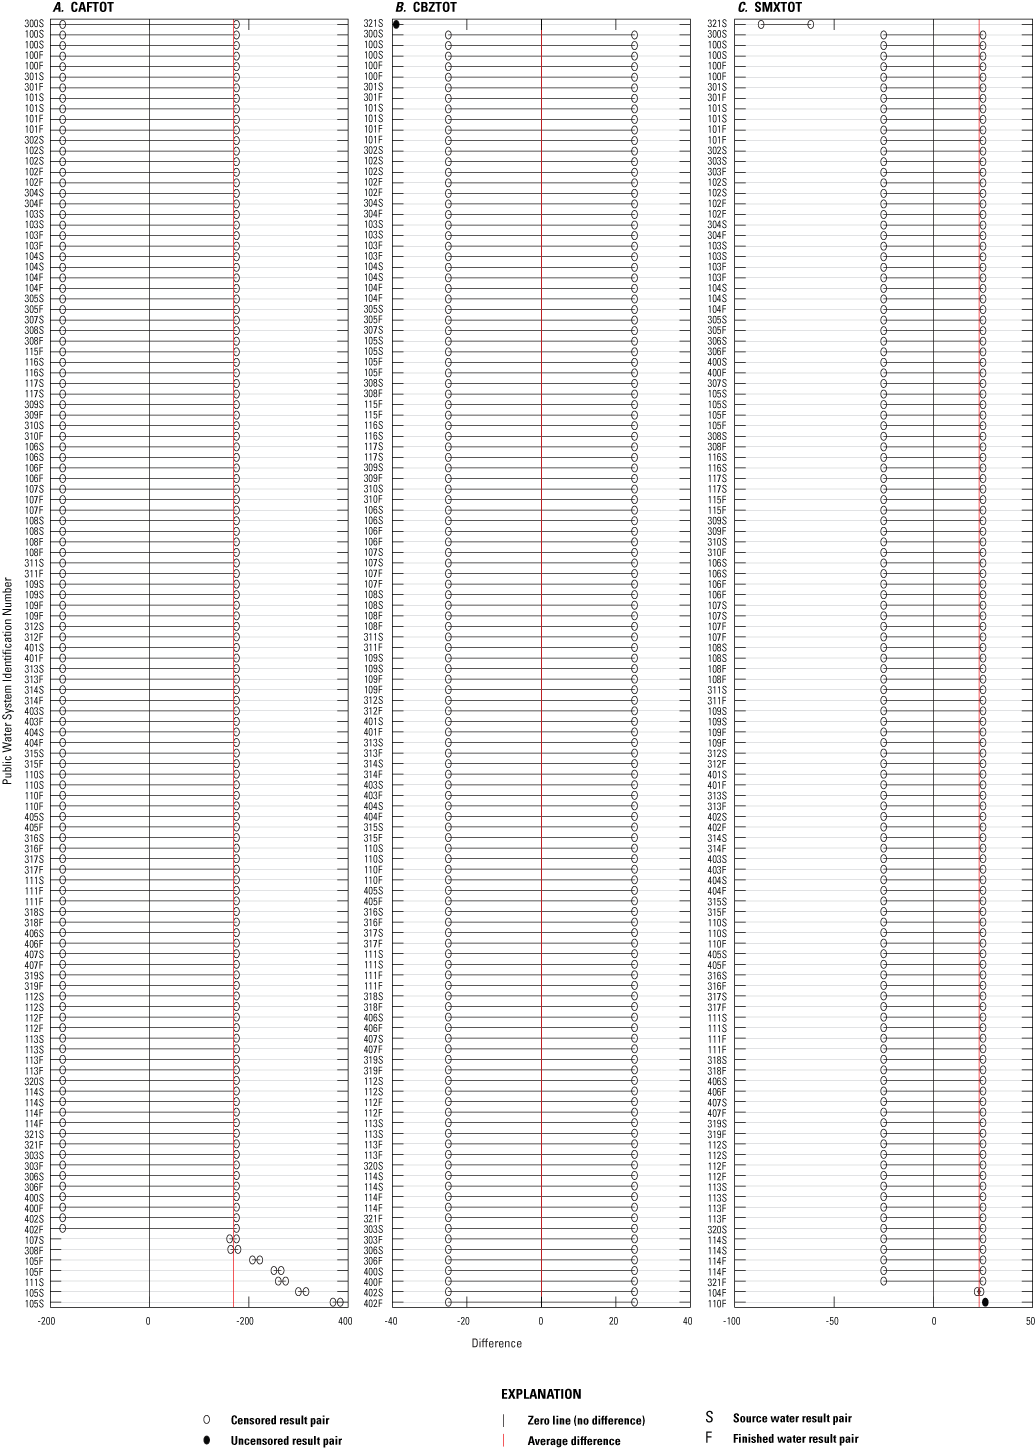
Plots of numeric differences between paired results from the enzyme-linked immunosorbent assay method (ELISA) and the SGS AXYS Analytical Services Ltd. (AXYS) for three pharmaceutical groups: A, caffeine (CAFTOT), B, carbamazepine (CBZTOT), and C, sulfamethoxazole (SMXTOT).
References Cited
Lorenz, D.L., 2017, smwrQW—Tools for censored data analysis (ver. 0.7.14): GitHub, accessed September 1, 2020, at https://rdrr.io/github/USGSR/smwrQW/f/inst/doc/ComparingPairedData.pdf.
O’Brien, P.C., and Fleming, T.R., 1987, A paired prentice‐Wilcoxon test for censored paired data: Biometrics, v. 43, no. 1, p. 169–180. [Also available at https://doi.org/10.2307/2531957.]
RStudio Team, 2020, RStudio: Integrated Development Environment for R (ver. 4.0.2): Boston, Mass., RStudio Team, accessed December 2020 at http://www/rstudio.com/.
Appendix 4. Comparison of Sample Concentration Ranking Among Analytical Methods
Supplemental Information
Concentrations of chemical constituents in water are given in nanograms per liter (ng/L).
Samples sizes are given in milliliters (mL) or microliters (μL).
Filter sizes are given in micrometers (μm).
Abbreviations
ATZTOT
atrazine and immunologically similar contaminants
ATZ1
atrazine
ATZ2
ametryn
ATZ3
2-Chloro-4-isopropylamino-6-amino-s-triazine
ATZ4
2-Hydroxy-4-isopropylamino-6-ethylamino-s-triazine
ATZ5
propazine
ATZ6
simazine
AXYS
SGS AXYS Analytical Services Ltd.
CAFTOT
caffeine and immunologically similar contaminants
CAF1
caffeine
CAF2
1,7-Dimethylxanthine
CAF3
theophylline
CBZTOT
carbamazepine and immunologically similar contaminants
CBZ1
carbamazepine
CBZ2
amitriptyline
CV
coefficient of variation
ELISA
enzyme-linked immunosorbent assay
EPA
U.S. Environmental Protection Agency
GWAg
groundwater influenced by agriculture
GWWW
groundwater influenced by wastewater
GWWW/Ag
groundwater influence by both wastewater and agriculture
HPLC/MS/MS
direct aqueous injection with high performance liquid chromatography and tandem mass spectrometry
IMDTOT
imidacloprid and immunologically similar contaminants
IMD1
imidacloprid
LC-MS/MS
direct aqueous injection with liquid chromatography and tandem mass spectrometry
MDH
Minnesota Department of Health
NWQL
National Water Quality Laboratory
PPW
Paired Prentice-Wilcoxon test
PYRTOT
pyrethroids and immunologically similar contaminants
PYR1
cis-Permethrin
PYR2
bifenthrin
QC
quality control
R2
correlation coefficient
RPD
relative percent difference
SMXTOT
sulfamethoxazole and immunologically similar contaminants
SMX1
sulfamethoxazole
SMX2
sulfamethizole
SMX3
sulfadimethoxine
SMX4
sulfamerazine
SMX5
sulfamethazine
SW
surface water
USGS
U.S. Geological Survey
For more information, contact:
Director, USGS Upper Midwest Water Science Center
2280 Woodale Drive
Mounds View, MN 55112
763–783–3100
For additional information, visit: https://www.usgs.gov/centers/umid-water
Suggested Citation
Krall, A.L., Elliott, S.M., de Lambert, J.R., and Robertson, S.W., 2022, Comparison of the results of enzyme-linked immunosorbent assay (ELISA) to mass-spectrometry based analytical methods for six unregulated contaminants in source water and finished drinking-water samples: U.S. Geological Survey Scientific Investigations Report 2022–5066, 29 p., https://doi.org/10.3133/sir20225066.
ISSN: 2328-0328 (online)
Study Area
| Publication type | Report |
|---|---|
| Publication Subtype | USGS Numbered Series |
| Title | Comparison of the results of enzyme-linked immunosorbent assay (ELISA) to mass-spectrometry based analytical methods for six unregulated contaminants in source water and finished drinking-water samples |
| Series title | Scientific Investigations Report |
| Series number | 2022-5066 |
| DOI | 10.3133/sir20225066 |
| Year Published | 2022 |
| Language | English |
| Publisher | U.S. Geological Survey |
| Publisher location | Reston, VA |
| Contributing office(s) | Minnesota Water Science Center, Upper Midwest Water Science Center |
| Description | Report: viii, 29 p.; Data Release |
| Country | United States |
| State | Minnesota |
| Online Only (Y/N) | Y |
| Google Analytic Metrics | Metrics page |