

Evaluation of Sample Preservation Methods for Analysis of Selected Volatile Organic Compounds in Groundwater at the Idaho National Laboratory, Idaho
Prepared in cooperation with the U.S. Department of Energy
Links
- Document: Report (2.8 MB pdf) , HTML , XML
- Figure: Figure 1.1 (250 KB pdf)
- Download citation as: RIS | Dublin Core
Abstract
During 2020, water samples were collected from 25 wells completed in the eastern Snake River Plain aquifer and from 1 well completed in perched groundwater above the aquifer at the Idaho National Laboratory to determine the effect of different sample-preservation methods on the laboratory determinations of concentrations of volatile organic compounds. Paired-sample sets were collected at each well. One sample in each set was preserved with hydrochloric acid, and one sample without. Both samples were chilled after collection and during shipping to the laboratory for analysis. The samples were analyzed for 61 volatile organic compounds at the U.S. Geological Survey National Water Quality Laboratory in cooperation with the U.S. Department of Energy. A comparison of the reproducibility of the analyses of co-located unpreserved and preserved samples by a relative percent difference method determined that all sample pairs were statistically equivalent. Using a normalized absolute difference method, 81 percent of the analyses were found to be statistically equivalent. This study confirms that the results of analyses of historical collected samples, which were preserved by chilling only, are statistically comparable to the analyses of samples being currently collected and preserved by both hydrochloric acid and chilling, and thus are valid for use in future geochemical evaluations.
Introduction
The Idaho National Laboratory (INL), encompassing about 890 square miles (mi2) of the eastern Snake River Plain (ESRP) in southeastern Idaho, is operated by the U.S. Department of Energy (DOE) (fig. 1). INL facilities are used in the development of peacetime atomic-energy applications, nuclear safety research, defense programs, and advanced energy concepts. The disposal of liquid and solid waste at the laboratory has resulted in the presence of several waste constituents in water in the ESRP aquifer underlying the INL. The U.S. Geological Survey (USGS) INL Project Office, in cooperation with the DOE, provides an independent assessment of the occurrence, migration, and fate of waste constituents in water in the ESRP aquifer.
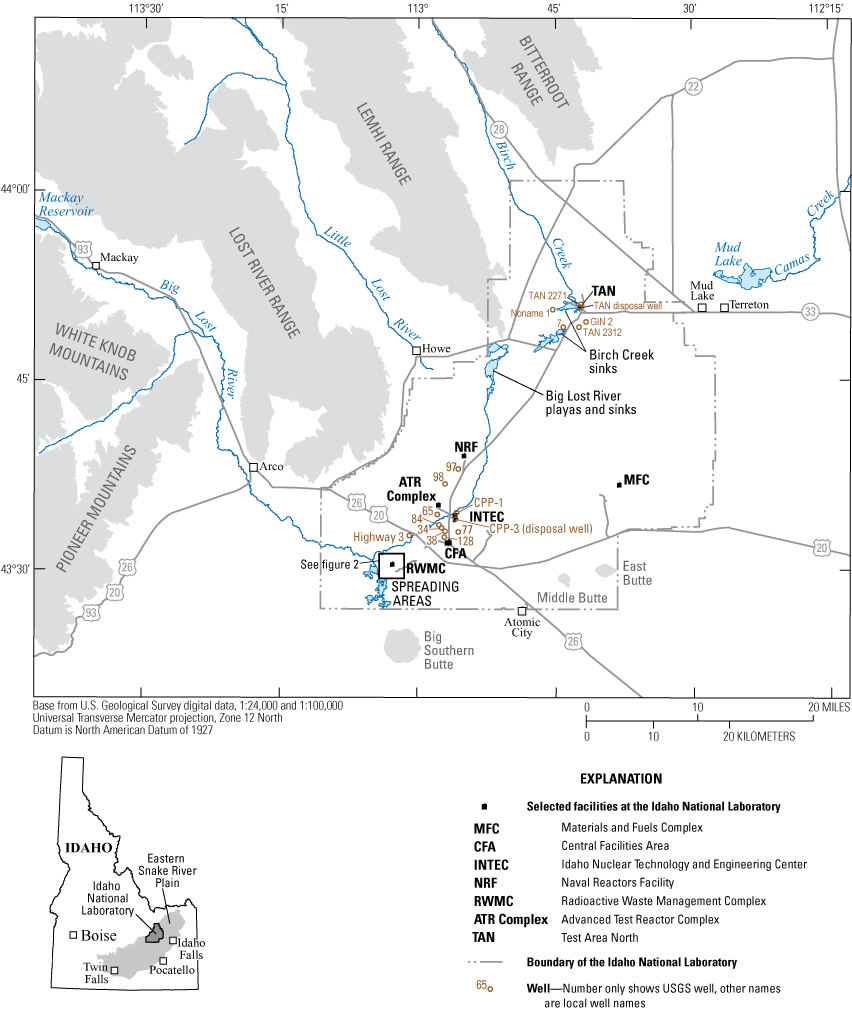
Location of the Idaho National Laboratory (INL), selected facilities at the INL, and locations of wells sampled for this study in 2020.
For more than 70 years, the USGS has worked in cooperation with DOE to help determine: (1) the quality and quantity of water for human consumption, (2) the suitability of the water for supporting construction and cooling of facilities, (3) location and migration of contaminants from the ESRP aquifer and in perched groundwater above the aquifer, (4) sources of recharge to the aquifer, (5) requirements of a monitoring network to detect contaminants migrating beyond the INL boundaries, and (6) processes controlling the migration of contaminants and naturally occurring constituents in the aquifer (Ackerman and others, 2010).
Wastewater containing volatile organic compounds (VOCs) was directly injected into the aquifer through disposal wells at Test Area North (TAN) and at the Idaho Nuclear Technology and Engineering Center (INTEC) (fig. 1). Wastewater containing VOCs was discharged into infiltration ponds at the Advanced Test Reactor (ATR) Complex, and an estimated 88,400 gallons of organic waste were buried before 1970 at the Radioactive Waste Management Complex (RWMC; fig. 2) (Mann and Knobel, 1987; Maimer and Bartholomay, 2016; Bartholomay and others, 2020). Background concentrations of VOCs in the ESRP aquifer at the INL are generally less than 2 micrograms per liter (µg/L) (Orr and others, 1991).
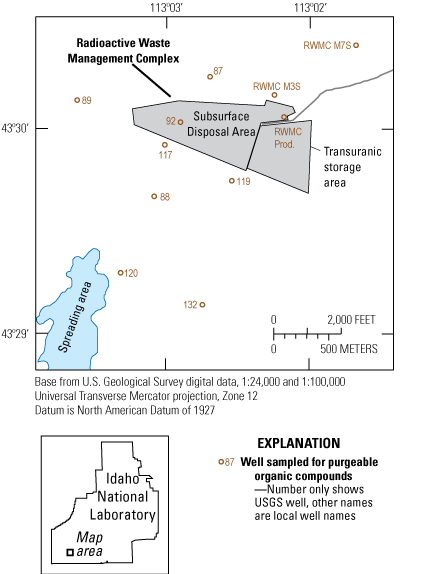
Location of wells near the Radioactive Waste Management Complex at the Idaho National Laboratory sampled for analyses of volatile organic compounds for this study in 2020.
The INL Project Office collects water samples for VOC analyses as part of the ongoing USGS assessment of water quality in the ESRP aquifer. Sixty-one VOCs are routinely analyzed in samples collected from existing wells at and near the Test Area North, ATR Complex, INTEC and RWMC and from new wells drilled at the INL. In the late 1980s and early 1990s, the VOC analytical method used at the USGS National Water Quality Laboratory (NWQL) required raw, unfiltered water, chilled for shipment to the laboratory for analysis. In the mid-to-late 1990s, the laboratory suggested acidifying groundwater samples in the field with hydrochloric acid (HCl) for sample preservation (app. 1; Connor and others, 1998). At that time, however, the NWQL continued to accept raw, unfiltered samples from the field and analyzed them as received without adjusting the pH of the sample upon arrival at the laboratory.
To be consistent with historical (pre-mid-1990s) sample collection methods, the INL Project has continued to send only raw (unacidified), unfiltered, and chilled samples to the laboratory for VOC analysis, but are now considering adding acid to the samples in the field to meet this requirement of the laboratory.
Purpose and Scope
This report describes a quality-assurance (QA) study in which the individual water samples of a paired set of samples collected in 2020 from 26 wells at INL were processed and handled differently. One of the samples in each set was chilled upon collection and during shipment to the laboratory for analysis of VOCs; this sample will be referred to in this report as “unpreserved.” The other sample in each set was acidified with HCl and then chilled upon collection; this sample will be referred to here as “preserved.” Results of the analyses were then compared in statistical tests to evaluate reproducibility between VOC concentrations in the unpreserved and preserved samples in each sample set. The data described in this study can be found in the USGS National Water Information System (U.S. Geological Survey, 2016).
Geohydrologic Setting
The INL is located on the west-central part of the eastern Snake River Plain, a northeast-trending structural basin about 200 miles (mi) long and 50–70 mi wide. The ESRP aquifer is one of the most productive aquifers in the United States (U.S. Geological Survey, 1985, p. 193). Groundwater generally moves from northeast to southwest and discharges to springs along the Snake River downstream from Twin Falls, Idaho, about 100 mi southwest of the INL. Groundwater moves horizontally through basalt interflow zones and vertically through joints and interfingering edges of basalt flows. Infiltration of surface water, pumping from wells completed in the aquifer, geohydrologic conditions, and seasonal fluxes of recharge and discharge locally affect the movement of groundwater (Garabedian, 1986). The aquifer is recharged primarily by infiltration of applied irrigation water, infiltration of streamflow, groundwater inflow from adjoining mountain drainage basins, and infiltration of precipitation (Ackerman and others, 2006). At the INL, depth to water in wells completed in the ESRP aquifer ranges from about 225 feet (ft) below land surface in the northern part of the INL to more than 900 ft below land surface in the southeastern part of the INL (Bartholomay and others, 2020, p. 20).
Previous Investigations
In the mid-1990s, the USGS conducted a study to investigate a suggested change to the protocol for collection and field processing of water samples for laboratory analyses of VOCs. The standard protocol at that time was to simply chill the raw samples for shipment to the laboratory. The suggested change was to add HCl to the samples as a preservative upon collection and then chilling them. A comparison of the results of analyses of paired sets of samples processed by the different field techniques indicated that the addition of HCl along with chilling of the samples did not have a statistically significant effect on the concentration of VOCs determined by the laboratory in samples from multiple sources, including groundwater, surface water, stormwater runoff, and sewage effluent. On the basis of those findings, the standard protocol for field processing of samples for VOC analyses was updated to include the addition of HCl along with chilling (app. 1; Connor and others, 1998).
In addition to the type of study mentioned above, the USGS INL Project Office has a history of performing investigations to assure the validity and accuracy of water-quality data collected at the INL. Investigations to determine variability and bias in laboratory analytical results (concentrations) of individual constituents were summarized by Wegner (1989), Williams (1996, 1997), and Rattray (2012, 2014). Additional QA studies that focus on sample collection and field processing techniques by USGS INL Project Office personnel include:
-
• An evaluation of field sampling and preservation methods for strontium-90 analyses (Cecil and others, 1989);
-
• A comparison of pump types used for collecting samples for analysis of VOCs (Knobel and Mann, 1993);
-
• An analysis of tritium and strontium-90 concentrations in water samples from wells after purging different borehole volumes (Bartholomay, 1993);
-
• An analysis of the effects of multiple preservation types on laboratory determined nutrient concentrations (Bartholomay and Williams, 1996);
-
• An analysis of two analytical methods to determine gross alpha- and beta-particle activity in water samples (Bartholomay and others, 1999);
-
• An evaluation of well-purging effects on laboratory analytical results (Knobel, 2006);
-
• An evaluation of 2009–11, 2012–15, and 2016–18 QA data for routine sampling of groundwater at INL (Davis and others, 2013; Bartholomay and others, 2017; Bartholomay and others, 2020); and
-
• An evaluation of the 2006–08, 2009–13, and 2014–18 multilevel monitoring system QA data (Bartholomay and Twining, 2010; Bartholomay and others, 2015; Twining and others, 2021).
Study Methods
This study evaluated the field-preservation of water samples, a targeted-variable associated with data generation (Mueller and others, 2015). For the purposes of this report, sequentially collected samples are defined as paired-samples. The unpreserved sample was collected first, followed by collection of the preserved sample, as a sequential replicate sample pair.
The study was designed to address variability associated with hydrologic and chemical conditions and factors including the following: (1) the samples were collected over a wide geographic range at the INL; (2) they were collected from multiple depths within the ESRP aquifer as well as from a perched groundwater zone; and (3) they were collected in different seasons and under different hydrologic conditions. Overall, the subset of wells sampled and the samples collected from them in this current study are a representative cross-section of the groundwater conditions and locations that have been historically sampled by the INL Project Office for VOC concentrations during a period when the sample processing did not include preservation by the addition of HCl.
Sample Collection and Processing
To evaluate the effect of different sample preservation methods on the reproducibility of laboratory-determined VOC concentrations, 37 paired-samples were collected from 25 wells completed in the ESRP aquifer, and 1 well completed in a perched groundwater zone above the aquifer (figs. 1, 2). Discrete samples were pumped from wells equipped with permanently installed submersible pumps through in-line stainless-steel sampling pipes attached to the well head or spigots. The samples were collected according to procedures described in the USGS National Field Manual (with the exception of adding HCl as a preservative for VOC analyses) (U.S. Geological Survey, 2018; Connor and others, 1998, and further described in the INLPO field methods and quality-assurance plan (Bartholomay and others, 2014).
Both unpreserved and preserved samples for the analysis of VOCs were collected in clean 40-mL borosilicate amber vials (VOC vials). The historical and current VOC sample collection and processing method for the INL Project Office is to fill the vials from the bottom up and fill to overflowing, capping immediately without any headspace, and chilling (historically collected unpreserved samples). The preserved sample was processed in the mobile field laboratory by adding, dropwise from a Teflon squeeze bottle, a concentrated solution of (1:1) HCl supplied by the NWQL. In-house testing at the INLPO prior to the field sampling determined that approximately five drops of HCl were necessary to achieve a sample pH of 2. Both unpreserved and preserved samples were kept at 4 °C±2 °C by chilling immediately after collection, and during shipment to the NWQL. Samples are shipped by overnight-delivery mail in a sealed ice chest and are typically sent to the laboratory within five days of collection (Maimer and Bartholomay, 2016).
Laboratory Analyses
The current NWQL method for the analyses of VOCs is summarized in Rose and others (2016) and in references within. Samples are analyzed for ambient purgeable compounds to determine the suite of VOCs present (table 1). The NWQL verifies minimum detection limits or minimum reporting limits (MRL) for a rotating subset of analytes on a yearly basis, if applicable (Foreman and others, 2021). The VOCs for which samples are analyzed by NWQL, the MRL for each compound, and maximum contaminant levels (MCLs) recommended by the U.S. Environmental Protection Agency (2020) are listed in table 1.
Table 1.
Maximum contaminant levels and minimum reporting levels of selected volatile organic compounds in water.[Analyses performed by the U.S. Geological Survey National Water Quality Laboratory using an analytical method equivalent to U.S. Environmental Protection Agency method 524.2 (Rose and others, 2016). Abbreviations: MCL, maximum contaminant level; MRL, minimum reporting level. MCLs were established pursuant to the recommendations of the U.S. Environmental Protection Agency (2020) for community water systems and are included for comparison purposes only. MRLs are from the Laboratory Information Management System (LIMS) used by the National Water Quality Laboratory, U.S. Geological Survey. Units are in micrograms per liter (µg/L). Symbols: --, MCL has not been established or proposed; *, total trihalomethanes-which include bromoform, dibromochloromethane, chloroform, and dibromomethane in community water systems serving 10,000 or more persons cannot exceed 80 µg/L (U.S. Environmental Protection Agency, 2020)].
Evaluation of Variability in Volatile Organic Compound Concentrations in Paired-Samples
Results of the analyses of the water samples from selected wells at INL are presented in table 2. Eleven VOCs were detected in concentrations greater than the MRL of 0.1 or 0.2 μg/L in sample(s) from at least one well included in this study. Concentrations of most of the VOCs detected in the samples were below the MRLs, although concentrations greater than the MRL were detected in well USGS 92, completed in perched groundwater, and in wells at multiple depths within the eastern Snake River Plain aquifer (table 2). Detections above the MRL were in samples from 8 of the 11 wells at and near the RWMC, in samples from 2 of the 5 wells at and near the TAN area, and in samples from 1 well near the ATR Complex. Concentrations of tetrachloromethane (carbon tetrachloride) above the MCL were detected in samples from two wells at or near the RWMC: the RWMC production well and USGS 92. The concentration of trichloroethene was above the MCL in samples collected from USGS 92 and GIN-2.
Unpreserved samples showed no consistent bias for higher or lower concentrations than did preserved samples for VOCs at concentrations greater than their respective MRLs. For example, in all four unpreserved samples from well GIN-2 in which the concentrations of VOCs exceeded their respective MRLs, those concentrations were higher than the concentrations in the preserved paired-sample from that well. In samples from well M3S at RWMC, however, the concentrations of five VOCs that exceeded MRLs were lower in the unpreserved samples than in the preserved samples of each same sample-pair. Detections of VOCs in both preserved and unpreserved samples collected in this study are consistent, with respect to well locations and analytical results, with those in previous studies (Bartholomay and others, 2020; Bartholomay and others, 2017; and Maimer and Bartholomay, 2016).
Table 2.
Concentrations of selected volatile organic constituents in water samples collected from multiple levels in selected wells, Idaho National Laboratory, Idaho, 2020.[Data for this study can be found on the USGS National Water Information System at http://dx.doi.org/10.5066/F7P55KJN. Well name is the local well identifier used in this study, see figs. 1, 2 for locations. Site Identifier is the unique well ID. Well Depth is the total depth of each well (ft). Constituent is the volatile organic compound (VOC) analyzed. Date refers to date sample collected on calendar month (mm), day (dd), and calendar year (yyyy). Time refers to sample collection time in military time. Analytical results in micrograms per liter. Samples were analyzed at the U.S. Geological Survey National Water Quality Laboratory in Lakewood, Colorado, for 61 volatile organic compounds; see table 1 for compounds. Compounds not listed may have been present, but at concentrations below their reporting levels. Abbreviations: RPD, relative percent difference; NAD, normalized absolute difference; NA, not applicable; RL, reporting level; <, less than; standard deviation not available for cis -1,2-Dichloroethene; Chloroethane, trans-1,2-Dichloroethene, and 1,2-Dichloropropane]
The variability in concentrations of VOCs from the analyses of paired-samples (unpreserved and preserved) were estimated by calculating the relative percent difference (RPD) between those concentrations. Uncertainties in analytical results are not provided, however, for the current NWQL laboratory methods for analyzing VOCs. Therefore, as an alternative measure of variability between concentrations of VOCs in the paired-samples, the normalized absolute difference (NAD) in the concentrations was calculated using pooled standard deviation data for nearly all the VOCs measured for this study (Rose and others, 2016). Finally, to evaluate the difference between VOC concentrations in unpreserved and preserved sample pairs, a rank-sum test was performed for individual VOCs with greater than six paired-sample detections above their respective MRLs. Bias in the paired-samples was not directly measured but inferred from a qualitative review of quality-control (QC) samples collected in 2020, including field and source-solution blanks collected as part of the INLPO routine water-quality assurance program. The paired-samples stability of VOC concentrations is evaluated using RPD and (or) NAD (table 2), respectively.
A simple linear regression model of the predictor variable, or unpreserved sample, and the response variable, or preserved sample, shows that the data are highly correlated with an R2 of 0.9992 (fig. 3). This simple comparison of VOC concentrations in the paired-samples confirms that they are highly correlated and show a strong positive linear relation.
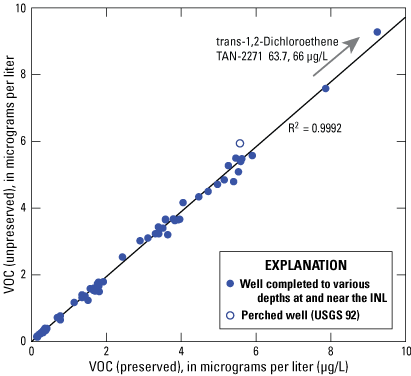
Simple linear regression of volatile organic compound concentrations in paired (unpreserved and preserved) samples from wells at the Idaho National Laboratory (INL), for concentrations greater than their respective minimum reporting levels.
Relative Percent Difference
The relative percent difference (RPD) is a direct measurement of the variability between two independent sets of data without considering analytical uncertainty. In this study, the datasets consisted of the concentrations of VOCs in a) unpreserved and b) preserved samples, respectively, of a co-located sample-pair. Only those sample-pairs in which VOCs were detected in both the unpreserved and the preserved samples from a well at concentrations above the MRL for each analyte were considered for evaluation (n = 100). In one paired-sample set, that from well USGS 120, the concentration of 1,1,1-trichloroethane exceeded the MRL in the unpreserved sample but was less than the MRL in the preserved sample; thus, the data for this sample set were not included in the evaluation. A typical data-quality criterion, applied to this set of paired-sample data, is that equivalence is demonstrated when the RPD is equal to or less than 20 percent (Taylor, 1987).
RPD is calculated using formula (1);
whereRPD
is the relative percent difference,
ABS
is the absolute value,
x1
is the concentration of a VOC for the unpreserved water sample, and
x2
is the concentration of a VOC for the preserved water sample.
Sample pairs with VOC concentrations greater than the MRL and with a calculated RPD of less than 20 percent were considered statistically equivalent. Of the samples in which VOC concentrations exceeded their respective MRL, the RPDs for all paired-samples evaluated (n = 100) were less than 20 percent and thus are considered statistically equivalent (table 2).
Normalized Absolute Difference
A second approach to test for variability, the normalized absolute difference (NAD), was applied to the concentrations of VOCs in the paired-samples that were detected above the MRL to determine if these values are statistically equivalent with the incorporation of analytical precision. When analytical uncertainties, or standard deviations, are not provided for the analytical method used by the laboratory, estimations of the standard deviations for individual analytes can be used for statistical comparison (Bartholomay and Williams, 1996). The standard deviations used to estimate the variability in concentrations of VOCs in groundwater are summarized in Rose and others (2016). The standard deviations for VOC concentrations were determined for different matrices including blank source-water, surface water, and groundwater. The standard deviations for the VOC suite were determined from seven groundwater replicates, spiked at two concentrations, and preserved with HCl in the laboratory (table 14 in Rose and others, 2016). The standard deviation applied for each constituent detected at a concentration above the MRL (0.5 or 5 micrograms per liter) was chosen based on the value closest to the paired-sample concentrations being compared.
NAD is calculated using formula (2);
wherex
is the concentration of a VOC in the unpreserved water sample,
y
is the concentration of a VOC in the preserved water sample,
sx
is the standard deviation for the concentration value closest to measured concentration, and
sy
is the standard deviation for the concentration value closest to measured concentration.
The paired-samples for each analyte detected at a concentration above the MRL were considered statistically equivalent at the 95-percent confidence level, or 2 standard deviations from the mean, if the NAD ≤ 1.96 (Volk, 1969). Given that this statistical test utilized estimated standard deviations (Rose and others, 2016), and the data are not normally distributed, the NAD equal or less than equal to 1.96 was used as a guide to test for equivalence (Rattray, 2012; Rattray, 2014). Based on this approach, 81 percent of the sample-pairs with VOC concentrations above the MRL are considered statistically equivalent using this statistical test for variability. The sample-pairs that were not considered statistically equivalent with the NAD method guidelines were those pairs that had the highest RPD (table 2). No bias was detected in the NAD results with respect to site locations, specific VOC constituents, or sample depth. While this approach to evaluate variability did not show the same level of statistical equivalence as the RPD approach, the NAD is used as a guide, given that the standard deviations are pooled and not specific to this suite of data. These results are consistent with those in the previous study by the USGS Office of Water Quality that evaluated the statistical equivalence of VOC concentrations and preservation technique on a wide range of sample types and VOC analytes (app. 1).
Rank-Sum Test
To evaluate the equivalence between unpreserved and preserved samples in terms of concentrations of individual VOC’s, the Mann-Whitney Wilcoxon rank-sum test was applied to analytical results from this study when concentration values above the MRL for an individual VOC were detected in more than six paired-samples (Helsel and others, 2020). Thus, the VOCs selected for further analysis included: 1,1,1-Trichloroethane, Tetrachloroethene, Tetrachloromethane, Trichloroethene, and Trichloromethane. The rank-sum test is a nonparametric test that evaluates the difference between two groups of data, the median difference between concentrations in VOCs in unpreserved and preserved samples. The null hypothesis (Ho) is that the median of the difference of the concentrations are equal to zero, or that the number of negative differences is approximately the same as the positive differences between the concentrations in unpreserved and preserved paired-samples at a specified level of significance. The alternative hypothesis (HA) is that x > y, where x represents the unpreserved sample results and y represents the preserved sample results. This test, applied to the subset of data for individual VOCs, was applied with an α of 0.90. The null hypothesis was rejected if the p-value was ≤ 0.1 (Helsel and others, 2020).
Mann-Whitney Wilcoxon Rank-Sum is calculated using formula (3);
wherex
is the concentration of a VOC in the unpreserved water sample,
y
is the concentration of a VOC in the preserved water sample, and
Di
xi - yi
Results from the Mann-Whitney rank-sum (Wilcoxon) statistical test reveal that the medians of unpreserved and preserved VOC concentrations are not statistically different (table 3) even though the concentrations in the unpreserved samples were slightly higher than those in the preserved samples for all individual VOCs evaluated. The medians of the differences between the unpreserved and preserved VOC concentrations were less than 0.26 µg/L for the subset of individual VOCs evaluated. These results give further confidence that there is no statistical difference in the concentrations of individual VOCs detected in laboratory analyses regardless of the sample preservation method used at time of sample collection. This subset of data accounts for 92 percent of all VOC concentrations above the MRL measured for this study.
Bias
As a general practice, the potential for the introduction of environmental bias during groundwater sampling at the INL is periodically evaluated on the basis of analyses of quality-control (QC) samples collected during the collection of environmental samples. These QC samples include equipment, field, and source-solution blank samples, as appropriate. During all routine water-quality sampling at the INL in 2020, QC samples were collected to validate field-sample collection practices and protocols. Although in 2020 the QC samples were not collected and analyzed specifically for VOCs, an analysis of QC samples collected during previous periods of sampling specifically for VOCs from 1996 through 2018 (Rattray, 2012, 2014; Davis and others, 2013; Bartholomay and others, 2017, 2020) did not show any potential bias, field-equipment, or source-solution blank contribution that would indicate any bias introduced by field-collection techniques, sample preservation, or sample handling. This study did not evaluate the effects of the collection and preservation of “spiked” QC samples on the results of the analyses of those samples for VOCs. A “spiked” sample is prepared in a laboratory with a known concentration of an analyte to evaluate any potential sample preparation and analysis method bias at the laboratory. There is no consistent positive or negative bias to VOC concentration data determined for this suite of paired-samples from either preservation method.
Summary
During 2020, water samples were collected from 25 wells completed in the eastern Snake River Plain aquifer and 1 well completed in perched groundwater above the aquifer at the Idaho National Laboratory as part of the U.S. Geological Survey’s quality-assurance program to determine the effect of different sample preservation methods on the laboratory-determined concentrations of volatile organic compounds (VOCs). One of two samples (a paired-sample set) collected sequentially at each well was preserved with hydrochloric acid; the other sample was not acidified. Both samples were chilled after collection and during shipment to the USGS National Water Quality Laboratory, where they were analyzed for 61 VOCs.
Statistical analyses of the analytical results – the concentrations of VOCs in the samples, support a conclusion that the field-sample collection and preservation method did not result in measurable, or statistically significant, variability in the concentration of VOCs in the paired-samples. The percentage of paired-samples with acceptable reproducibility was 100 percent for all detectable VOCs at concentrations above the Minimum Reporting Level (MRL), as evidenced by the Relative Percent Difference (RPD) statistical comparison. When estimated uncertainty is included in the evaluation, approximately 81 percent of the samples are statistically equivalent when the Normalized Absolute Difference (NAD) is used as a statistical guide. Comparing the concentrations of individual VOCs greater than the MRL in at least six sets of paired-samples using the Mann-Whitney rank-sum statistical test showed no statistical difference between the paired-samples.
Comparability between past, current, and future analytical results supports a robust and defensible VOC-monitoring network at the INL. The findings of this study provide evidence that any slight variability in laboratory-determined concentrations of chemical constituents that may result from differences in the sample preservation method will not compromise comparisons of historical and current VOC data or with long-term geochemical evaluations.
Acknowledgments
The authors would like to thank U.S. Geological Survey colleagues Neil Maimer, Samuel Helmuth, and Jayson Blom for leading the field-collection of samples to evaluate volatile organic compound sample preservation methods.
References Cited
Ackerman, D.J., Rattray, G.W., Rousseau, J.P., Davis, L.C., and Orr, B.R., 2006, A conceptual model of ground-water flow in the eastern Snake River Plain aquifer at the Idaho National Laboratory and vicinity with implications for contaminant transport: U.S. Geological Survey Scientific Investigations Report 2006–5122 (DOE/ID-22198), 62 p., accessed August 1, 2021, at https://doi.org/10.3133/sir20065122.
Ackerman, D.J., Rousseau, J.P., Rattray, G.W., and Fisher, J.C., 2010, Steady-state and transient models of groundwater flow and advective transport, eastern Snake River Plain aquifer, Idaho National Laboratory and vicinity, Idaho: U.S. Geological Survey Scientific Investigations Report 2010–5123 (DOE/ID-22209), 220 p., accessed August 18, 2021, at https://doi.org/10.3133/sir20105123.
Bartholomay, R.C., 1993, Concentrations of tritium and strontium-90 in water from selected wells at the Idaho National Engineering Laboratory after purging one, two, and three borehole volumes: U.S. Geological Survey Water-Resources Investigations Report 93–4201 (DOE/ID-22111), 21 p., accessed August 1, 2021, at https://doi.org/10.3133/wri934201.
Bartholomay, R.C., Hill, G.H., and Randolph, R.B., 1999, Statistical comparison of gross alpha- and gross beta-particle activity in water analyzed using two different laboratory methods, in 41st Rocky Mountain Conference on Analytical Chemistry, Rocky Mountain Conference on Magnetic Resonance: v. 41, no. 1., p. 132, accessed August 18, 2021, at https://digitalcommons.du.edu/cgi/viewcontent.cgi?article=1016&context=rockychem.
Bartholomay, R.C., Maimer, N.V., and Wehnke, A.J., 2014, Field methods and quality-assurance plan for water-quality activities and water-level measurements, U.S. Geological Survey, Idaho National Laboratory, Idaho: U.S. Geological Survey Open-File Report 2014–1146 (DOE/ID-22230), 66 p., accessed September 15, 2021, at https://doi.org/10.3133/ofr20141146.
Bartholomay, R.C., Hopkins, C.B., and Maimer, N.V., 2015, Chemical constituents in groundwater from multiple zones in the eastern Snake River Plain aquifer, Idaho National Laboratory, Idaho, 2009–13: U.S. Geological Survey Scientific Investigations Report 2015–5002 (DOE/ID-22232), 110 p., accessed August 1, 2021, at https://doi.org/10.3133/sir20155002).
Bartholomay, R.C., Maimer, N.V., Rattray, G.W., and Fisher, J.C., 2017, An update of hydrologic conditions and distribution of selected constituents in water, eastern Snake River Plain aquifer and perched groundwater zones, Idaho National Laboratory Idaho, emphasis 2012–15: U.S. Geological Survey Scientific Investigations Report 2017–5021 (DOE/ID-22242), 87 p., accessed August 1, 2021, at https://doi.org/10.3133/sir20175021.
Bartholomay, R.C., Maimer, N.V., Rattray, G.W., and Fisher, J.C., 2020, An update of hydrologic conditions and distribution of selected constituents in water, eastern Snake River Plain aquifer and perched groundwater zones, Idaho National Laboratory Idaho, emphasis 2016–18: U.S. Geological Survey Scientific Investigations Report 2019–5149 (DOE/ID-22251), 82 p., accessed August 1, 2021, at https://doi.org/10.3133/sir20195149.
Bartholomay, R.C., and Twining, B.V., 2010, Chemical constituents in groundwater from multiple zones in the eastern Snake River Plain aquifer at the Idaho National Laboratory, Idaho: U.S. Geological Survey Scientific Investigations Report 2010–5116 (DOE/ID 22211), 81 p., accessed August 11, 2021, at https://doi.org/10.3133/sir20105116.
Bartholomay, R.C., and Williams, L.M., 1996, Evaluation of preservation methods for selected nutrients in ground water at the Idaho National Engineering Laboratory, Idaho: U.S. Geological Survey Water-Resources Investigations Report 96–4260 (DOE/ID-22131), 16 p., accessed August 1, 2021, at https://doi.org/10.3133/wri964260).
Cecil, L.D., Knobel, L.L., Wegner, S.J., and Moore, L.L., 1989, Evaluation of field sampling and preservation methods for strontium-90 in ground water at the Idaho National Engineering Laboratory: U.S. Geological Survey Water-Resources Investigations Report 89–4146 (DOE/ID-22083), 24 p., accessed September 15, 2021, at https://doi.org/10.3133/wri894146).
Connor, B.F, Rose, D.L., Noriega, M.C., Murtagh, L.K., Abney, S.R., 1998, Methods of Analysis by the U.S. Geological Survey National Water Quality Laboratory—Determination of 86 Volatile Organic Compounds in Water by Gas Chromatography/Mass Spectrometry, Including Detections Less Than Reporting Limits. U.S. Geological Survey Open-File Report 97–829, accessed August 1, 2021, at https://doi.org/10.3133/ofr97829.
Davis, L.C., Bartholomay, R.C., and Rattray, G.W., 2013, An update of hydrologic conditions and distribution of selected constituents in water, eastern Snake River Plain aquifer and perched groundwater zones, Idaho National Laboratory, Idaho, emphasis 2009–11: U.S. Geological Survey Scientific Investigations Report 2013–5214 (DOE/ID-22226), 90 p., accessed August 1, 2021, at https://doi.org/10.3133/sir20135214.
Foreman, W.T., Williams, T.L., Furlong, E.T., Hemmerle, D.M., Stetson, S.J., Jha, V.K, Noriega, M.C., Decess, J.A., Reed-Parker, C., and Sandstrom, M.W., 2021, Comparison of detection limits estimated using single- and multi-concentration spike-based and blank-based procedures: Talanta, v. 228, June 1, 2021, https://doi.org/10.1016/j.talanta.2021.122139.
Helsel, D.R., Hirsch, R.M., Ryberg, K.R., Archfield, S.A., and Gilroy, E.J., 2020, Statistical methods in water resources: U.S. Geological Survey Techniques and Methods, book 4, chap. A3, 458 p., https://doi.org/10.3133/tm4a3, accessed September 15, 2021, at https://doi.org/10.3133/tm4A3. [Supersedes U.S. Geological Survey Techniques of Water-Resources Investigations, book 4, chap. A3, version 1.1.]
Knobel, L.L., 2006, Evaluation of well-purging effects on water-quality results for samples collected from the eastern Snake River Plain aquifer underlying the Idaho National Laboratory, Idaho: U.S. Geological Survey Scientific Investigations Report 2006–5232 (DOE/ID-22200), 52 p., accessed September 15, 2021, at https://doi.org/10.3133/sir20065232.)
Knobel, L.L., and Mann, L.J., 1993, Sampling for purgeable organic compounds using positive-displacement piston and centrifugal submersible pumps—A comparative study: Ground Water Monitoring Review, v. 13, Issue 2, p. 142–148, accessed August 11, 2021, at https://doi.org/10.1111/j.1745-6592.1993.tb00446.x.
Maimer, N.V., and Bartholomay, R.C., 2016, Purgeable organic compounds at or near the Idaho Nuclear Technology and Engineering Center, Idaho National Laboratory, Idaho, 2015: U.S. Geological Survey Open-File Report 2016–1083 (DOE/ID 22238), 17 p., accessed September 15, 2021, at https://dx.doi.org/10.3133/ofr20161083.
Mueller, D.K., Schertz, T.L., Martin, J.D., and Sandstrom, M.W., 2015, Design, analysis, and interpretation of field quality-control data for water-sampling projects: U.S. Geological Survey Techniques and Methods, book 4, chap. C4, 54 p., accessed August 1, 2021, at https://dx.doi.org/10.3133/tm4C4.
Orr, B.R., Cecil, L.D., and Knobel, L.L., 1991, Background concentrations of selected radionuclides, organic compounds, and chemical constituents in ground water in the vicinity of the Idaho National Engineering Laboratory: U.S. Geological Survey Water-Resources Investigations Report 91–4015 (DOE/ID-22094), 52 p., accessed September 15, 2021, at https://doi.org/10.3133/wri914015.
Rattray, G.W., 2012, Evaluation of quality-control data collected by the U.S. Geological Survey for routine water-quality activities at the Idaho National Laboratory, Idaho, 1996–2001: U.S. Geological Survey Scientific Investigations Report 2012–5270, (DOE/ID-22222), 74 p., accessed August 11, 2021, at https://doi.org/10.3133/sir20125270.
Rattray, G.W., 2014, Evaluation of quality-control data collected by the U.S. Geological Survey for routine water-quality activities at the Idaho National Laboratory and vicinity, southeastern Idaho, 2002–08: USGS Scientific Investigations Report 2014–5027 (DOE/ID-22228), 66 p., accessed September 15, 2021, at https://doi.org/10.3133/sir20145027.
Rose, D.L., Sandstrom, M.W., and Murtagh, L.K., 2016, Determination of heat purgeable and ambient purgeable volatile organic compounds in water by gas chromatography / mass spectrometry: U.S. Geological Survey Techniques and Methods, book 5, chap. B12, 61 p., accessed August 11, 2021, at https://dx.doi.org/10.3133/tm5B12.
Twining, B.V., Bartholomay, R.C., Fisher, J.C., and Anderson, C., 2021, Multilevel groundwater monitoring of hydraulic head, water temperature, and chemical constituents in the eastern Snake River Plain aquifer, Idaho National Laboratory, Idaho, 2014–18: U.S. Geological Survey Scientific Investigations Report 2021–5002, 82 p., accessed September 15, 2021, at https://doi.org/10.3133/sir20215002.
U.S. Geological Survey, 2018, General introduction for the “National Field Manual for the Collection of Water Quality Data” (ver. 1.1, June 2018): U.S. Geological Survey Techniques and Methods, book 9, chap. A0, 4 p., https://doi.org/10.3133/tm9A0. [Supersedes USGS Techniques and Methods, book 9, chap. A0, version 1.0.]
Wegner, S.J., 1989, Selected quality assurance data for water samples collected by the U.S. Geological Survey, Idaho National Engineering Laboratory Idaho, 1980 to 1988: U.S. Geological Survey Water-Resources Investigations Report 89–4168 (DOE/ID-22085), 91 p., accessed August 1, 2021, at https://doi.org/10.3133/wri894168.)
Williams, L.M., 1996, Evaluation of quality assurance/quality control data collected by the U.S. Geological Survey for water-quality activities at the Idaho National Engineering Laboratory, Idaho, 1989 through 1993: U.S. Geological Survey Water-Resources Investigations Report 96–4148 (DOE/ID-22129), 116 p., accessed September 15, 2021, at https://doi.org/10.3133/wri964148.)
Williams, L.M., 1997, Evaluation of quality assurance/quality control data collected by the U.S. Geological Survey for water-quality activities at the Idaho National Engineering Laboratory, Idaho, 1994 through 1995: U.S. Geological Survey Water-Resources Investigations Report 97–4058 (DOE/ID-22136), 87 p., accessed August 11, 2021, at https://doi.org/10.3133/wri974058.)
Appendix 1. U.S. Geological Survey Water Quality Memorandum, January 30, 1996
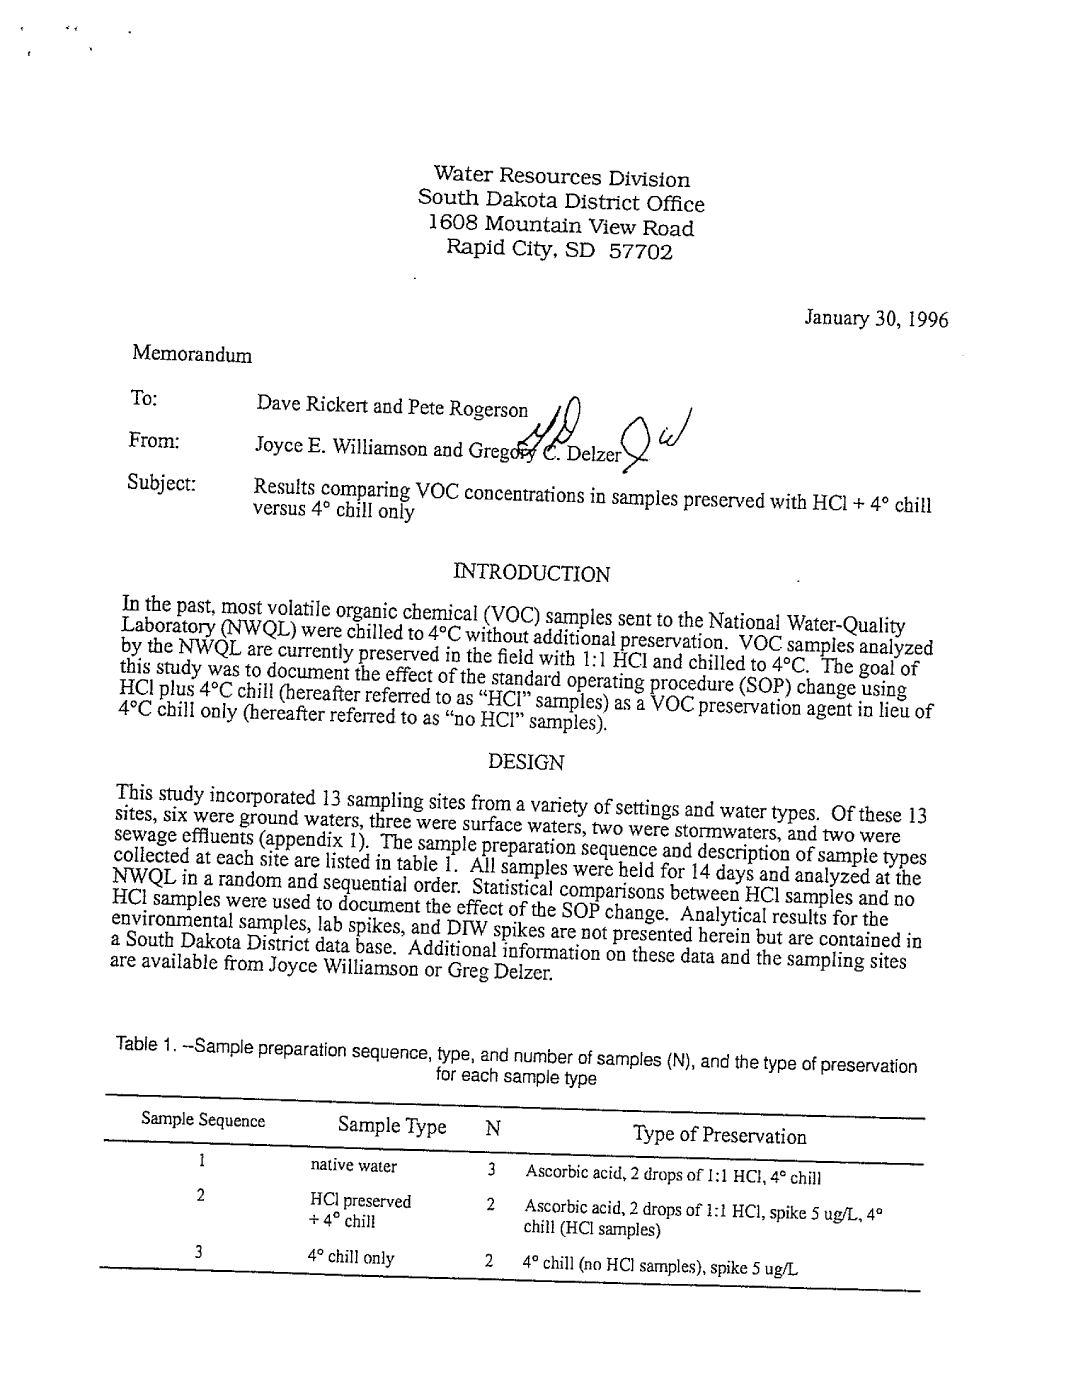
This figure is a digital copy of a January 30, 1996, U.S. Geological Survey internally circulated memorandum. The memorandum can be accessed at https://doi.org/10.3133/sir20225076.
Conversion Factors
U.S International System of Units to U.S. customary units
Temperature in degrees Celsius (°C) may be converted to degrees Fahrenheit (°F) as follows: °F = (1.8 × °C) + 32.
Datums
Vertical coordinate information is referenced to the National Geodetic Vertical Datum of 1929 (NGVD 27).
Horizontal coordinate information referenced to the National Geodetic Vertical Datum of 1929 (NGVD 29). Supplemental Information
Concentrations of chemical constituents in water are given in micrograms per liter (µg/L).
Publishing support provided by the U.S. Geological Survey
Science Publishing Network, Tacoma Publishing Service Center
For more information concerning the research in this report, contact the
Director, Idaho Water Science Center
U.S. Geological Survey
230 Collins Rd
Boise, Idaho 83702-4520
https://www.usgs.gov/centers/id-water
Manuscript approved on April 3, 2022
Publishing support provided by the U.S. Geological Survey
Science Publishing Network, Tacoma Publishing Service Center
Edited by Jeffery L. Suwak
Layout and design by Luis Menoyo
Cover design by Teresa A. Lewis
Suggested Citation
Treinen, K.C., and Bartholomay, R.C., 2022, Evaluation of sample preservation methods for analysis of selected volatile organic compounds in groundwater at the Idaho National Laboratory, Idaho: U.S. Geological Survey Scientific Investigations Report 2022–5076 (DOE/ID-22257), 17 p., https://doi.org/10.3133/sir20225076.
ISSN: 2328-0328 (online)
Study Area
| Publication type | Report |
|---|---|
| Publication Subtype | USGS Numbered Series |
| Title | Evaluation of sample preservation methods for analysis of selected volatile organic compounds in groundwater at the Idaho National Laboratory, Idaho |
| Series title | Scientific Investigations Report |
| Series number | 2022-5076 |
| DOI | 10.3133/sir20225076 |
| Year Published | 2022 |
| Language | English |
| Publisher | U.S. Geological Survey |
| Publisher location | Reston, VA |
| Contributing office(s) | Idaho Water Science Center |
| Description | Report: v, 17 p.; 1 Figure |
| Country | United States |
| State | Idaho |
| Other Geospatial | Idaho National Laboratory |
| Online Only (Y/N) | Y |
| Google Analytic Metrics | Metrics page |