

Using Microbial Source Tracking To Identify Fecal Contamination Sources in South Oyster Bay on Long Island, New York
Links
- Document: Report (2.28 MB pdf) , HTML , XML
- Related Work: Scientific Investigations Report 2021–5033 - Overview and Methodology for a Study To Identify Fecal Contamination Sources Using Microbial Source Tracking in Seven Embayments on Long Island, New York
- Dataset: USGS National Water Information System database - USGS water data for the nation
- Download citation as: RIS | Dublin Core
Acknowledgments
The authors wish to thank members of the Bureau of Shellfisheries at the New York State Department of Environmental Conservation Division of Marine Resources for their field efforts and the Suffolk County Department of Health Public and Environmental Health Laboratory for coordinating with field crews and sample analysis.
Executive Summary
The U.S. Geological Survey worked collaboratively with the New York State Department of Environmental Conservation (NYSDEC) to assess the potential sources of fecal contamination entering seven estuarine embayments across Long Island, New York, from June 2018 to July 2019. Water samples are routinely collected by the NYSDEC in Long Island embayments and analyzed for fecal coliform bacteria, an indicator of fecal contamination, to determine the closure of shellfish beds for harvest and consumption. Concentrations of fecal coliform signify the potential for pathogenic (disease-causing) bacteria to be present. The study summary, introduction, approach, and methods were originally presented in Tagliaferri and others (2021a, b), and are summarized in this report.
Indicator bacteria alone cannot determine the biological or geographical sources of contamination. Microbial source tracking (MST) is a method used to determine these sources of contamination. Microbial source tracking laboratory techniques can ascertain whether genetic material obtained from Bacteroides or Helicobacter bacteria in water or sediment is consistent with humans, canines (dogs), ruminants (deer, sheep), or waterfowl (aquatic birds). Bacteroides and Helicobacter are genera of bacteria found in the gut of most warm-blooded animals. These techniques can also quantify the concentration of genetic markers found.
Information such as the location, weather and season, surrounding land use, and additional water-quality data for the location where the sample was collected to help determine the geographical source and conveyance of land-based water to the embayment. The presence of genetic material and fecal coliform in samples collected at the same time is important to show that the fecal coliform is likely from the host source detected. It is possible for waters with waste infiltration to have genetic material present but no fecal indicators, such as disinfected water from a sewage treatment plant or from groundwater that has passed through a sandy aquifer.
Water samples were collected in the summer and winter seasons. In each of the two seasons, one sample was collected in dry weather, and one, after substantial rainfall. Groundwater and sediment samples were also collected during the study. Surface-water source sites sampled for South Oyster Bay include Cedar Creek near Bay Place, Massapequa Lake East Culvert, and Unqua Lake Culvert.
Human, canine, and waterfowl fecal contributions to South Oyster Bay were frequently detected across the landscape. Among the potential sources of fecal contaminated water contributing to South Oyster Bay—groundwater, lake and wetland drainage, stormwater (municipal separate storm sewer systems), and marinas (boats)—stormwater is the most likely contributor of fecal coliform to South Oyster Bay based on the source sites studied. At receptor sites (the bay itself), 15 of 16 samples collected had concentrations below 49 most probable number per 100 milliliters (MPN/100 mL), the 90-percentile concentration determined by the NYSDEC as part of the National Shellfish Sanitation Program closure criteria (U.S. Food and Drug Administration, 2019). Despite these results, certain areas of South Oyster Bay are seasonally uncertified between 9 and 12 months out of the year.
The highest frequency of fecal coliform detections in source site samples was under wet summer conditions, as evidenced by the high fecal coliform concentrations at the Cedar Creek near Bay Place and Unqua Lake Culvert sites (greater than [>] 16,000 MPN/100 mL each). The source sites tested during this study, which were adjacent to parks and high-density residential housing, had a higher frequency of canine marker detections than human and were associated with high fecal coliform concentrations in the summer with no fecal coliform detections in the winter. The lack of human markers in receptor samples throughout the bay indicates minimal human influence from boats and marinas on fecal coliform loads into South Oyster Bay. Additionally, the absence of fecal coliform and human MST markers in the groundwater sampled at Zachs Bay indicate that sewage lines were operating as expected and did not influence fecal coliform loads to the bay. The sediment sample from Zachs Bay was negative for all MST markers, indicating that sediment is unlikely to contribute fecal coliform from the tested host organisms during resuspension events caused by tidal shifts or boat wakes.
A classification scheme was developed that considered conditions such as high fecal coliform concentrations (particularly during dry weather samples) and contributions from human and canine waste based on detection of MST markers. The sites were assessed to assist stakeholders and resource managers in prioritizing which source sites consistently contribute fecal coliform bacteria to South Oyster Bay throughout the year. The Cedar Creek near Bay Place and Unqua Lake Culvert sites were classified as locations most likely to contribute fecal contamination to South Oyster Bay.
Introduction
To better understand fecal contamination sources in coastal embayments on Long Island, New York, microbial source tracking (MST) and fecal coliform bacteria (FC) data were collected by the U.S. Geological Survey (USGS) in cooperation with the New York State Department of Environmental Conservation (NYSDEC) from seven embayments from June 2018 to July 2019 (U.S. Geological Survey, 2020a). The objective of this research is to identify the different pathogen sources, both the host organism (such as human, mammals, or birds) and geographic origin (such as urban and storm runoff and submarine groundwater discharge), to embayments with fecal contamination. The embayments selected represent a mix of sewered and unsewered areas, differing levels of impervious land cover, varying population density, and a variety of land-use types to transfer what is learned to other areas beyond the seven embayments studied. In total, 353 samples were collected in the 7 embayments on Long Island. These were primarily surface-water samples but also include 17 groundwater, 11 sediment, 2 sewage influent, and 8 fecal samples.
The presence of fecal contamination in South Oyster Bay and resulting hazards posed to marine resources and human health are of increasing concern. Recreational uses of the bay, including shellfishing and public bathing, are frequently restricted due to high counts of FC, which are used as indicators for when pathogens may be present. Pathogen loads can be influenced by watershed land-use, proximity to point sources such as municipal separate storm sewer systems, as well as tidal exchange and circulation transporting pathogens from outside the study area (Gao and others, 2015), sediment resuspension (O’Mullan and others, 2019), and human recreation (including boating). Sewage treatment plants, such as the Cedar Creek and Jones Beach sewage treatment plants, can also act as point sources (through effluent discharge) for pathogens when standard operations and procedures for disinfection are compromised. Nonpoint sources may include shallow groundwater discharge because, although the area is sewered, the low-lying topography requires the widespread use of submersible pumps, which aid in the movement of wastewater through underground piping and to the wastewater treatment plant. These pumps have the potential to leak, malfunction, or fail, thereby polluting the groundwater. Through routine FC monitoring, the NYSDEC has identified fecal contamination as a concern in South Oyster Bay. MST techniques are necessary to determine the dominant source (human, canine, ruminant, and waterfowl) and geographic origin of FC, using land use, topography, and hydrology to establish a framework. The success of future pathogen-control measures may be measured by the decline in FC concentrations.
Site Description
South Oyster Bay is a natural and shallow embayment on the southern shore of Long Island. The bay is contained by Jones Beach Island to the south and Great South Bay to the east. The hamlets of East Massapequa, Massapequa, and Seaford and the village of Massapequa Park to the north of the embayment are primarily high-density residential land-use areas with artificially channelized marinas and bulkhead shorelines. The northern shoreline is almost entirely sewered and is served by the Cedar Creek sewage treatment plant (fig. 1).
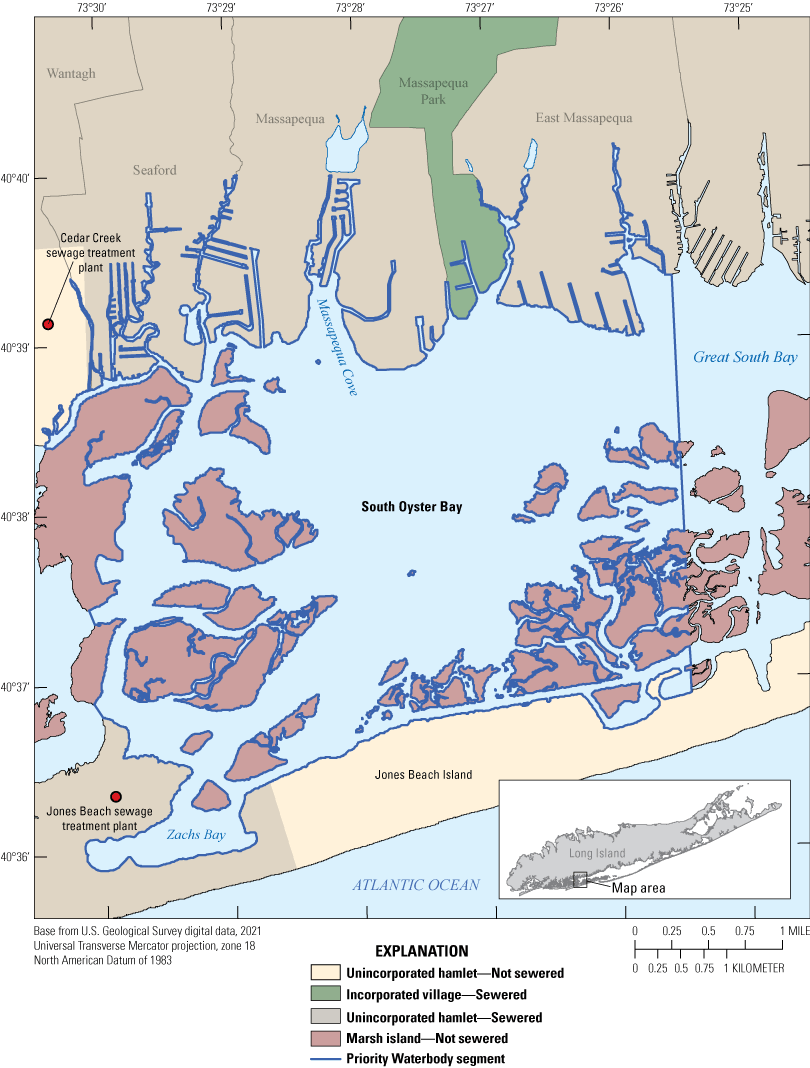
Map showing the extent of the priority waterbody in South Oyster Bay on Long Island, New York, as designated by the New York State Department of Environmental Conservation (2020); the sewered area surrounding South Oyster Bay are indicated. All areas are sewered except the marsh islands and the area labeled Jones Beach Island.
Effluent from the Cedar Creek sewage treatment plant is discharged from an outfall extending into the Atlantic Ocean. The bay itself has numerous tidal marshes. The leeward side of Jones Beach Island is primarily wetlands and marshes; areas around Zachs Bay on Jones Beach Island are mostly sewered and are served by the Jones Beach sewage treatment plant. Potential contributions of contaminated water to the bay include stormwater runoff, groundwater inputs, and drainage of coastal lakes and wetlands. Illicit boat discharges and effluent from the Cedar Creek and Jones Beach sewage treatment plants are also possible contributors of fecal contamination to the bay. The sites where surface-water samples were collected within South Oyster Bay (fig. 2; table 1.1) are as follows:
-
The sampling site at Cedar Creek near Bay Place is adjacent to the Cedar Creek sewage treatment plant on the western edge of South Oyster Bay in the hamlet of Seaford. This area consists of artificially channelized marinas and high-density residential development.
-
The Massapequa Lake East Culvert site in Massapequa flows under Merrick Road and drains water from Massapequa Lake into a narrow, channelized canal. The canal flows into Massapequa Cove, a waterbody that freely exchanges water with South Oyster Bay. This sampling site captures potential FC contamination from Massapequa Lake, which is on the southern edge of Massapequa Preserve. The preserve is used for walking, biking, fishing, and nonmotorized watersports and houses a plethora of wildlife and waterfowl year-round. Private residences surrounding Massapequa Lake are positioned approximately 200 feet or more from the waterfront.
-
The Unqua Lake Culvert site flows under Merrick Road in Massapequa Park and drains Unqua Lake into a narrow, partially channelized canal. Water flows past a large sports field complex and high-density residential housing with private boat docks before the discharge point to South Oyster Bay. The culvert is approximately 1 mile upstream from the discharge point to South Oyster Bay. Unqua Lake is used recreationally for walking, biking, and fishing. Dogs are not allowed in the park to the east of the lake.
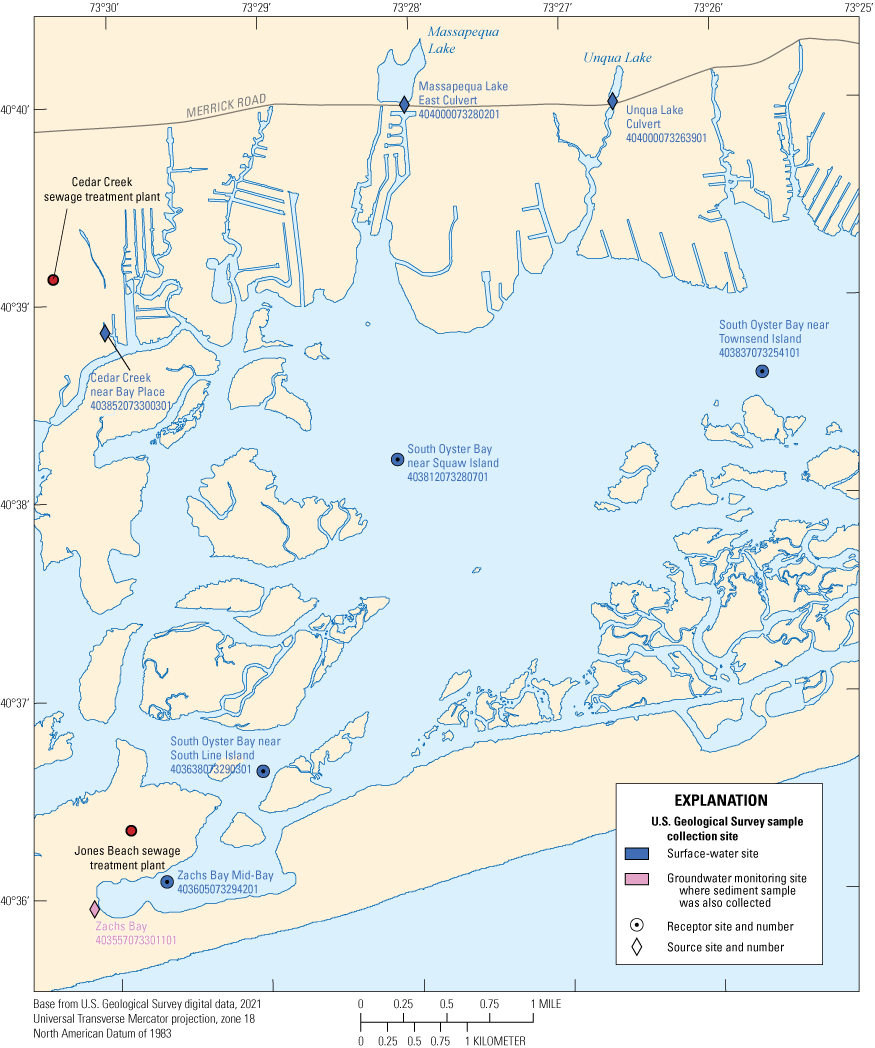
Map showing locations where surface-water (blue), and groundwater plus sediment (pink) were collected by the U.S. Geological Survey for microbial source tracking in South Oyster Bay on Long Island, New York. Data are from U.S. Geological Survey (2020a).
Approach and Methods
Sampling Methods
Sampling methods used for this study are detailed in Tagliaferri and others (2021a). Surface-water samples in South Oyster Bay were collected in June 2018 to March 2019 and groundwater and sediment samples were collected in June 2019. At Zachs Bay, MST markers were not analyzed in the groundwater sample, and fecal coliform was not analyzed in the sediment sample because of laboratory time and resource constraints. All water-quality and sediment data collected in the field and those analyzed in laboratories as part of this study are available from the U.S. Geological Survey National Water Information System (NWIS) database (U.S. Geological Survey, 2020a).
Based on the methodology used for this study, wet conditions were defined as more than 0.25 inch of precipitation in 24 hours or 0.50 inch in 48 hours, and dry conditions were defined as less than 0.25 inch of precipitation in 72 hours. Rainfall totaled 0.81 inch on August 8, 2018, and 0.13 inch on August 9, 2018, designating samples collected in South Oyster Bay on August 9, 2018, as summer wet samples (more than 0.25 inch within 24 hours). Winter wet samples were also collected in South Oyster Bay on March 5, 2019, with 0.61 inch of precipitation falling on March 4, 2019. Rainfall values were obtained from the Republic Airport weather station (KFRG; Weather Underground, 2020).
From June 2018 to March 2019, seven surface-water sites were sampled within South Oyster Bay, yielding 28 water samples (plus three replicates), and one additional site (Zachs Bay) was sampled in June 2019 where one groundwater and one sediment sample were collected concurrently (fig. 2). Of the surface-water sites, three were considered “source” sites (waters flowing directly into South Oyster Bay from the land through culverts and groundwater discharge) and four were considered “receptor” sites (the bay itself). Excluding replicates, 14 surface-water samples were collected under wet conditions, and 14 were collected under dry conditions; 14 surface-water samples were collected in the summer, and 14, in the winter.
Laboratory Methods
Laboratory methods used for this study are detailed in Fisher and others (2020). Water samples were analyzed for FC at the Suffolk County Department of Health Services Public Environmental Health Laboratory (PEHL) and the NYSDEC Marine Laboratory. Additional information was either observed or compiled to facilitate interpretation of data. Precipitation measurements from the Republic Airport weather station in Farmingdale, identified as KFRG (Weather Underground, 2020), were used to determine dry and wet weather conditions. Quality assurance for measurements at KFRG are unavailable. Relative tide stage as noted by USGS field personnel and verified based on tidal predictions available (National Oceanic and Atmospheric Administration, undated) was documented along with the sample information in NWIS (U.S. Geological Survey, 2020a). Land-cover and sewer district geographic information system (GIS) coverages (Nassau County, 2015; Suffolk County, 2020; U.S. Geological Survey, 2020b) were used for data interpretation. These data support the MST results to increase confidence in the geographical source of the water and likely transport mechanisms of fecal contamination to South Oyster Bay.
Results
Results of MST and FC were assessed based on concentrations, presence or absence, and relative abundance of host markers with respect to surface-water source and receptor sites. Differences in MST markers and FC concentrations were also compared seasonally and conditionally (that is, wet or dry), with dry weather discharges with high FC concentrations from municipal separate storm sewer system source sites being of particular concern.
Microbial Source Tracking
Throughout South Oyster Bay, the human-associated Bacteroides (HF183) marker was the most frequently detected MST marker with 14 detections across the South Oyster Bay landscape, followed by the canine-associated Bacteroides (BacCan) marker with eight detections and the waterfowl-associated Helicobacter (GFD) marker with five detections. All winter receptor samples were positive for HF183, indicating a seasonal flux of human markers into the bay from within the receptor and not from the surrounding landscape (for example, lakes and culverts). Concentrations of HF183 in the bay were not influenced by weather-related events, evidenced by the similar frequency of positive detections between wet and dry conditions (43 percent and 57 percent, respectively; table 1). All GFD and BacCan detections were at source sites, except for the GFD detection at South Oyster Bay near Squaw Island, suggesting that concentrated waterfowl and canine fecal contamination occurs at inland (or island) sources and either degrades before entering the bay or is diluted within the receptor. GFD detections were only in the winter, which is consistent with the reported presence of migratory winter birds in the area. BacCan detections were generally more frequent in the winter than in summer.
Table 1.
Summary of microbial source tracking results in surface-water samples for sites sampled in South Oyster Bay on Long Island, New York.[Ratios are number of samples with detections greater than reporting limit per total number of samples and do not include replicate samples. Reporting limits vary due to analytical processes and matrix interferences. HF183, human-associated Bacteroides marker; Rum2Bac, ruminant-associated Bacteroides marker; GFD, waterfowl-associated Helicobacter marker; BacCan, canine-associated Bacteroides marker]
Host Specific Markers
Reporting limits for the three MST markers detected (HF183, BacCan, and GFD) in South Oyster Bay varied slightly due to analytical processes, such as required dilutions because of matrix interferences. Understanding occurrence of the predominant MST markers in South Oyster Bay can be used to help prioritize locations for additional investigation and infrastructure improvement. It can also provide a baseline for host contributions when prioritizing sites of concern for assessing FC and after total maximum daily load implementation.
HF183
The human marker (HF183) was the most frequently detected MST marker in South Oyster Bay (50 percent positive detections). The human marker was detected at least twice in all surface water source and receptor sites, except for the Massapequa Lake East Culvert source site that did not have any positive HF183 detections. Concentrations of HF183 detected above the reporting limit in samples collected at receptor sites ranged between 250 copies/100 mL at the South Oyster Bay near Townsend Island site to 4,300 copies/100 mL at the South Oyster Bay near South Line Island site (fig. 3). Because samples collected within the bay (receptor sites) with detections of HF183 were not associated with high FC concentrations, it is unlikely that illicit boat discharges or marinas were a source. The highest frequency of HF183 was in samples collected at the South Oyster Bay near Townsend Island and Unqua Lake Culvert sites, with positive detections in dry winter, wet winter, and dry summer conditions at each site. HF183 was not detected in the sediment sample collected at the Zachs Bay site.
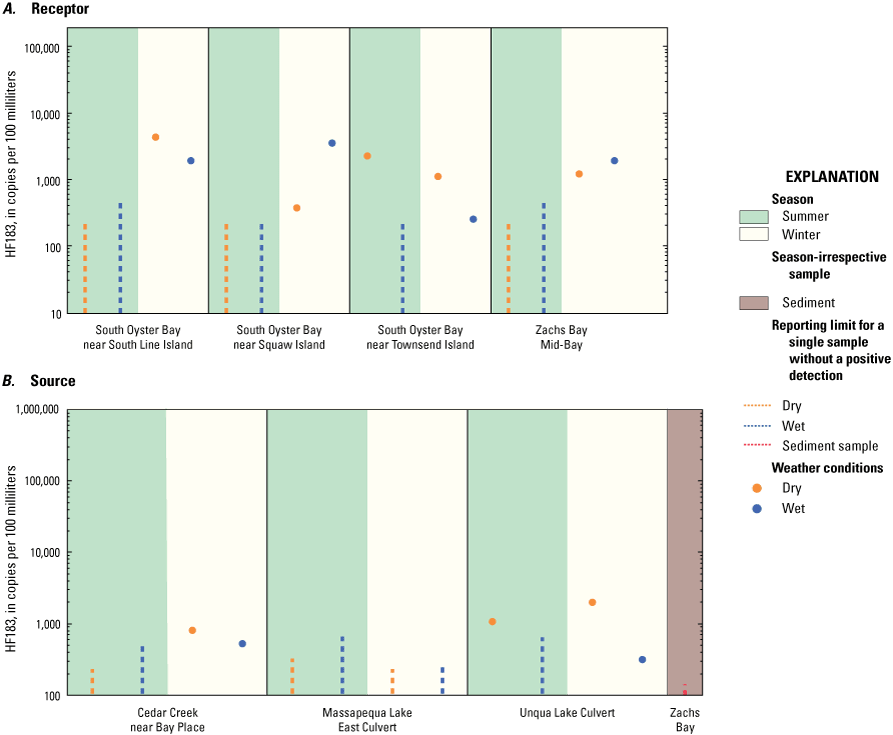
Graphs showing concentrations of the human-associated Bacteroides (HF183) marker, in copies per 100 milliliters for water samples and copies per gram dry weight for sediment samples, from A, receptor and B, source sites under various surface-water sample conditions at South Oyster Bay on Long Island, New York. Dashed lines indicate reporting limit for a single sample without a detection. Scales for marker concentrations are fixed to allow for easy comparison with other embayment study areas on Long Island.
BacCan
The canine marker was detected in 8 of 28 total water samples (excluding replicates) and at source sites only (fig. 4). Samples with positive BacCan concentrations were generally split between season and sampling condition, with two more positive detections in winter samples than in summer samples and in wet samples than in dry samples (table 1). The two highest concentrations of BacCan (28,000 copies/100 mL each) were in the samples collected at the Massapequa Lake East Culvert site during wet winter conditions and at the Unqua Lake Culvert site during dry winter conditions (table 1.2; U.S. Geological Survey, 2020a). BacCan was not detected in the sediment sample collected at the Zachs Bay site.
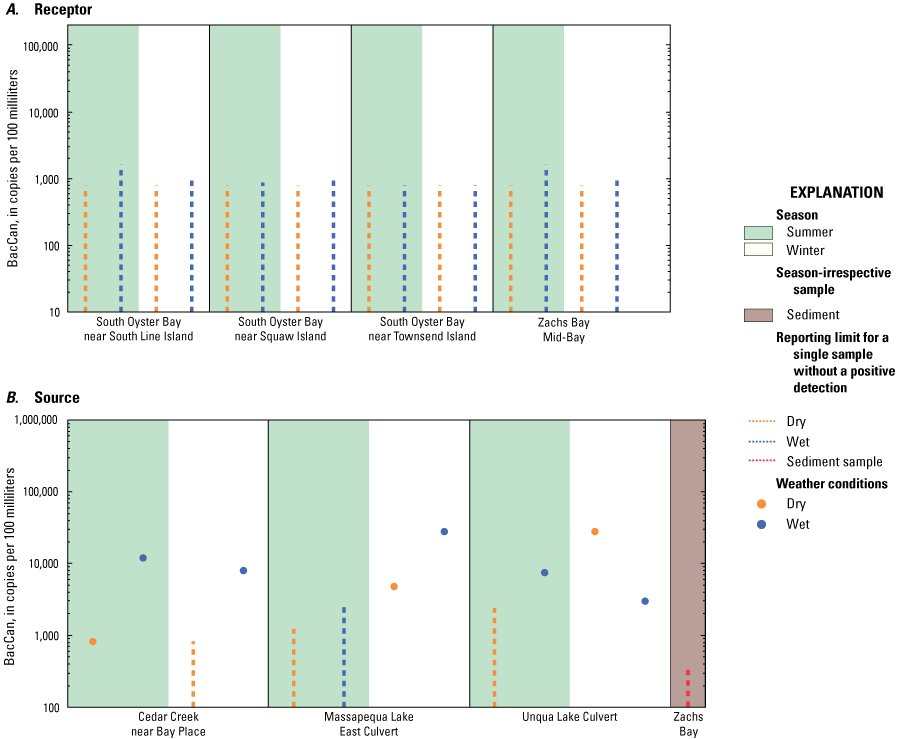
Graphs showing concentrations of the canine-associated Bacteroides (BacCan) marker, in copies per 100 milliliters for water samples and copies per gram dry weight for sediment samples, from A, receptor and B, source sites under various surface-water sample conditions at South Oyster Bay on Long Island, New York. Dashed lines indicate reporting limit for a single sample without a detection. Scales for marker concentrations are fixed to allow for easy comparison with other embayment study areas on Long Island.
GFD
The waterfowl marker was detected at least once in samples collected at each surface-water source site and only once in a receptor site (table 1). The highest concentration of GFD (24,000 copies/100 mL) was in the surface-water sample collected at the Unqua Lake Culvert site during dry winter conditions and was concurrent with waterfowl sightings (fig. 5). All GFD detections were in samples collected during the winter season and were associated with FC concentrations below the reporting limit, indicating that birds are not a persistent source of FC to South Oyster Bay. GFD was not detected in the sediment sample collected at the Zachs Bay site.
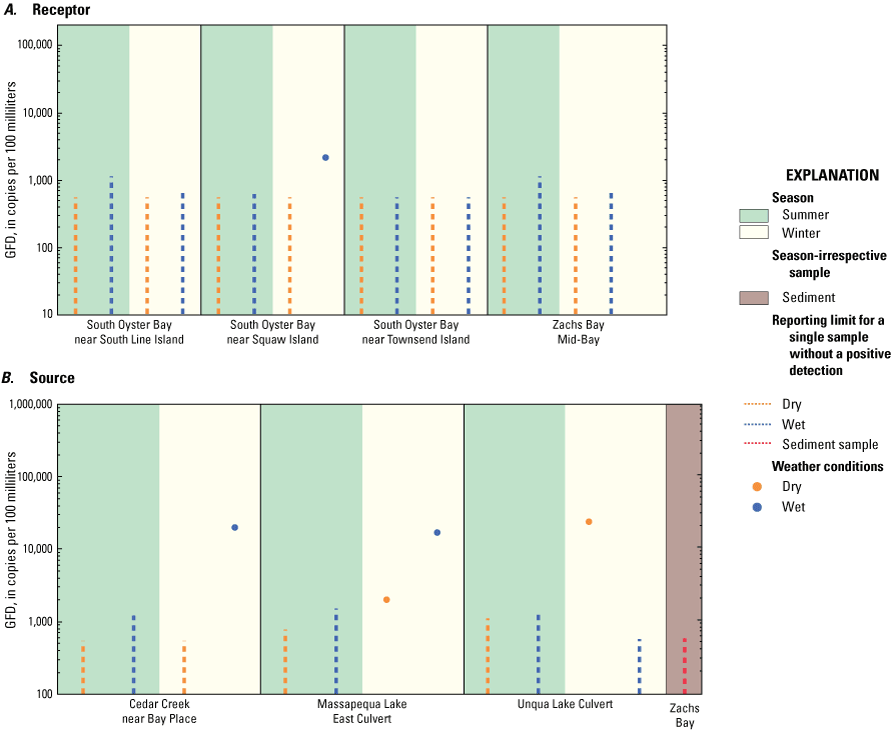
Graphs showing concentrations of the waterfowl-associated Helicobacter (GFD) marker, in copies per 100 milliliters for water samples and copies per gram dry weight for sediment samples, from A, receptor and B, source sites under various surface-water sample conditions at South Oyster Bay, New York. Dashed lines indicate reporting limit for a single sample without a positive detection. Scales for marker concentrations are fixed to allow for easy comparison with other embayment study areas on Long Island.
Fecal Coliform Bacteria
Concentrations in samples from surface water source sites ranged from below the reporting limit in 58 percent of samples to greater than [>] 16,000 MPN/100 mL in two summer samples, one from the Cedar Creek near Bay Place site and the other from the Unqua Lake Culvert site (both collected under wet weather conditions). Concentrations for samples collected at the receptor sites ranged from at or below the reporting limit in 69 percent of samples to 93 MPN/100 mL in one sample collected in wet weather conditions at the South Oyster Bay near Squaw Island site (table 1.2; U.S. Geological Survey, 2020a). During this study, only one receptor sample, that was collected in wet summer conditions at South Oyster Bay near Squaw Island, had a concentration above 49 MPN/100 mL, the 90-percentile concentration determined by the NYSDEC as part of the National Shellfish Sanitation Program (NSSP) closure criteria (U.S. Food and Drug Administration, 2019).
The dry winter sample collected at the Unqua Lake Culvert site was positive for HF183, BacCan, and GFD markers and was associated with an FC concentration below the reporting limit. In contrast, the dry summer sample had fewer marker detections but considerably higher FC concentration, indicating the potential degradation of the MST markers during the summer season or fecal contamination from an untested source organism. Even though dogs are not allowed in the park to the east of Unqua Lake, positive canine markers were detected in three of four samples taken at the culvert, indicating the presence of canines likely from the residential community to the west.
The relation between FC and marker detection is not straightforward. Fecal coliform and specific host-associated markers may decay at different rates and be present in different abundances. Host-associated markers were shown to decay more rapidly than FC in Drozd and others (2013) and Rogers and others (2011). In general, high FC concentrations occurred during the wet, summer season.
Nonpoint Sources of Fecal Coliform Bacteria
Major nonpoint contributors of freshwater to South Oyster Bay include groundwater seepage and direct stormwater runoff not conveyed by the municipal separate storm sewer systems. Groundwater was collected from a single site in South Oyster Bay at Zachs Bay. Fecal indicator bacteria were not detected in the groundwater sample and there are no MST data available for this sample.
Another nonpoint source that can contribute to fecal contamination in water samples is sediment during resuspension (O’Mullan and others, 2019). To better understand these contributions, a sediment sample was collected near the groundwater sample while the groundwater sample was collected at the Zachs Bay site. MST markers were not detected in this sample, and FC data are not available (table 1.2; U.S. Geological Survey, 2020a).
Classification of Source Sites
The source sites (waters flowing directly into the bay) were assessed to better understand geographical sources and transport mechanisms to surface-water receptor sites and the relation between FC and MST marker presence and abundance (table 2). Source sites were assigned a numeric classification as described in Tagliaferri and others (2021a, b), to aid in conceptualizing the degree of contamination potential (table 3). Classifications are based on a sliding scale, with class 1 sites being the most contaminated and class 5 sites being the least contaminated.
Table 2.
Geographical sources of water for sample locations in South Oyster Bay on Long Island, New York, and the potential for these sites to have contributed to the fecal coliform concentrations observed in the samples.[FC, fecal coliform bacteria; MST, microbial source tracking; X, potential contributor, —, not a likely contributor based on current data]
Table 3.
Sample results for fecal coliform and microbial source tracking markers, by source site type, in South Oyster Bay on Long Island, New York.[Proposed classification considers concentrations of fecal coliform above 49 most probable number per 100 milliliters (MPN/100 mL), dry weather discharges, and influences of human sewage and canine waste. HF183, human-associated Bacteroides marker; BacCan, canine-associated Bacteroides marker; <, less than]
Cedar Creek near Bay Place—Class 1
Cedar Creek flows continuously but is only suspected of contributing high FC concentrations during the summer season when samples exceeded the 49 MPN/100 mL NSSP criterion for shellfish closure. Most notably, the wet summer sample had one of the highest concentrations of FC in all South Oyster Bay (>16,000 MPN/100 mL) and was positive for canine markers, also at a high concentration. Canine markers were the most frequently detected marker at this site, with three positive detections. The high frequency and concentration of the canine marker at this site is likely reflective of domestic dog ownership in the residences lining the creek and the use of an upland park for dog walking. Human markers were detected only in winter samples and were at concentrations close to the reporting limit, indicating no illicit boat discharge or sewage line failures. Stormwater influence on FC concentrations is implicated because there was a substantial increase in FC during the summer wet weather event.
Unqua Lake Culvert—Class 1
The Unqua Lake Culvert site was a source of FC in the summer season in both wet and dry conditions. Human, canine, and waterfowl markers were all detected; with human and canine markers being the most frequently detected. The wet summer sample had a fecal coliform concentration above the upper reporting limit (>16,000 MPN/100 mL) and was associated with a high concentration of canine markers. The dry summer sample also had elevated FC and was associated with a positive human marker detection. The only waterfowl detection at this site was in a sample collected concurrently with bird sightings, but a low FC concentration was observed. Higher FC concentrations in the summer samples may reflect heavier use of the park for recreational activities. Stormwater influence on FC concentrations is implicated because there was a substantial increase observed in FC during the summer wet weather event.
Massapequa Lake East Culvert—Class 5
Fecal coliform concentrations in three of four samples were below the reporting limit, and the sample with a detection (230 MPN/100 mL), was collected in wet summer conditions. Canine and waterfowl markers were detected in the winter samples, with the wet winter sample containing a canine marker concentration of 28,000 copies/100 mL, one of the highest concentrations in all the South Oyster Bay study area. Despite multiple MST marker detections in the winter months, the greatest FC contamination potential was observed during wet weather in the summer.
Sediment—Class 5
No human, waterfowl, or canine markers were detected in the sediment sample collected at Zachs Bay, indicating minimal to no fecal contamination from these host organisms to South Oyster Bay from this location. Fecal coliform concentrations were not available; however, recent research (O’Mullan and others, 2019; Hassard and others, 2016) indicated that resuspension of sediment along natural shorelines can cause a spike in fecal indicator bacteria in the water column. Therefore, it is possible that, during conditions that result in high wave energy, sediment (particularly organic-rich material) can act as a source of FC when resuspended in the water column as a result of tidal movement, storms, or boat activity. Because no FC was measured in the sediment samples in this study, additional, targeted investigation would be beneficial to determining the degree of FC contributions to the bay by tidal shifts or boat activity.
Groundwater—Class 5
The concentration of fecal coliform was below detection in the single groundwater sample collected at Zachs Bay, suggesting no septic influence from the site to South Oyster Bay. The lack of positive detections for FC in groundwater samples collected throughout Long Island for the larger MST study strongly suggests that direct groundwater seepage is an unlikely contributor of FC.
Summary
The U.S. Geological Survey, in collaboration with the New York State Department of Environmental Conservation, assessed the potential sources of fecal contamination entering South Oyster Bay on Long Island, New York, from June 2018 to June 2019. Water samples are routinely collected by the New York State Department of Environmental Conservation in Long Island embayments and analyzed for fecal coliform bacteria, an indicator of fecal contamination, to determine the closure of shellfish beds for harvest and consumption. Fecal indicator bacteria, such as fecal coliform, signify the potential for pathogenic (disease-causing) bacteria to be present.
Host sources of fecal contamination in South Oyster Bay were assessed based on bacterial Bacteroides and Helicobacter microbial source tracking (MST) markers. Overall, human contributions were ubiquitous in receptor samples while canine and waterfowl markers were prevalent in surface-water source samples. By evaluating the MST markers alongside fecal coliform bacteria (FC) data and land-use information, geographical sources of fecal contamination discharging from the culverts sampled as part of this study were better differentiated. Among the potential sources of fecal-contaminated water contributing to South Oyster Bay—groundwater, lake and wetland drainage, stormwater (municipal separate storm sewer systems), and marinas (boats)— stormwater was found to be the most likely transport mechanism of fecal contamination to South Oyster Bay. The highest frequency of FC detections in source sites occurred under wet summer conditions, and the highest FC concentrations also occurred under these conditions at the Cedar Creek near Bay Place and Unqua Lake Culvert sites (>16,000 MPN/100 mL each).
Canine contamination was prolific at source sites but was associated with low FC concentrations in the winter months. The absence of FC and human MST markers in groundwater samples collected throughout the larger study area indicates that water from cesspools or septic tanks do not contribute FC to the bay. Further, MST markers were not detected in the sandy sediment collected at Zach Bay. Although FC was not measured in this sediment sample, its sandy nature suggests that it is unlikely to contribute FC to South Oyster Bay when resuspended in the water column through tidal shifts or boat activity; however, additional sediment sampling would be needed to determine the contribution of FC loads to the bay. Future studies focused on monitoring and sample collection during multiple seasons may provide better insight into the conditions that contribute high FC concentrations to South Oyster Bay.
References Cited
Drozd, M., Merrick, N.N., Sanad, Y.M., Dick, L.K., Dick, W.A., and Rajashekara, G., 2013, Evaluating the occurrence of host-specific, general fecal indicators, and bacterial pathogens in a mixed-use watershed: Journal of Environmental Quality, v. 42, no. 3, p. 713–725, accessed June 23, 2021, at https://doi.org/10.2134/jeq2012.0359.
Fisher, S.C., McCarthy, B.A., Kephart, C.M., and Griffin, D.W., 2020, Assessment of water quality and fecal contamination sources at Hook Pond, East Hampton, New York: U.S. Geological Survey Scientific Investigations Report 2020–5071, 58 p, accessed March 30, 2021, at https://doi.org/10.3133/sir20205071.
Gao, G., Falconer, R.A., and Lin, B., 2015, Modelling the fate and transport of faecal bacteria in estuarine and coastal waters: Marine Pollution Bulletin, v. 100, no. 1, p. 162–168, accessed June 23, 2021, at https://doi.org/10.1016/j.marpolbul.2015.09.011.
Hassard, F., Gwyther, C.L., Farkas, K., Andrews, A., Jones, V., Cox, B., Brett, H., Jones, D.L., McDonald, J.E., and Malham, S.K., 2016, Abundance and distribution of enteric bacteria and viruses in coastal and estuarine sediments—A review: Frontiers in Microbiology, v. 7, accessed June 23, 2021, at https://doi.org/10.3389/fmicb.2016.01692.
Nassau County, 2015, Nassau County DPW sanitary sewer collection districts: Nassau County data, accessed March 30, 2021, at https://www.arcgis.com/home/item.html?id=26d010a660d047c495d2226df26af81a.
National Oceanic and Atmospheric Administration, [undated], NOAA tide predictions: National Oceanic and Atmospheric Administration web page, accessed April 26, 2021, at https://tidesandcurrents.noaa.gov/.
New York State Department of Environmental Conservation, 2020, Waterbody inventory/priority waterbodies list: New York State Department of Environmental Conservation data, accessed December 3, 2020, at https://www.dec.ny.gov/chemical/36730.html.
O’Mullan, G.D., Juhl, A.R., Reichert, R., Schneider, E., and Martinez, N., 2019, Patterns of sediment-associated fecal indicator bacteria in an urban estuary—Benthic-pelagic coupling and implications for shoreline water quality: The Science of the Total Environment, v. 656, p. 1168–1177, accessed December 6, 2021, at https://doi.org/10.1016/j.scitotenv.2018.11.405.
Rogers, S.W., Donnelly, M., Peed, L., Kelty, C.A., Mondal, S., Zhong, Z., and Shanks, O.C., 2011, Decay of bacterial pathogens, fecal indicators, and real-time quantitative PCR genetic markers in manure-amended soils: Applied and Environmental Microbiology, v. 77, no. 14, p. 4839–4848, accessed June 23, 2021, at https://doi.org/10.1128/AEM.02427-10.
Suffolk County, 2020, GIS viewer—Suffolk County: Suffolk County data, accessed March 30, 2021, at https://gisportal.suffolkcountyny.gov/gis/home/.
Tagliaferri, T.N., Fisher, S.C., Kephart, C.M., Cheung, N., Reed, A.P., and Welk, R.J., 2021a, Overview and methodology for a study to identify fecal contamination sources using microbial source tracking in seven embayments on Long Island, New York: U.S. Geological Survey Scientific Investigations Report 2021–5033, 8 p., accessed December 6, 2021, at https://doi.org/10.3133/sir20215033.
Tagliaferri, T.N., Fisher, S.C., Kephart, C.M., Cheung, N., Reed, A.P., and Welk, R.J., 2021b, Using microbial source tracking to identify fecal contamination sources in an embayment in Hempstead Harbor on Long Island, New York: U.S. Geological Survey Scientific Investigations Report 2021–5042, 19 p., accessed July 22, 2022, at https://doi.org/10.3133/sir20215042.
U.S. Food and Drug Administration, 2019, National shellfish sanitation program—Guide for the control of molluscan shellfish—2019 revision: U.S. Food and Drug Administration, 502 p., accessed March 1, 2021, at https://www.fda.gov/food/federalstate-food-programs/national-shellfish-sanitation-program-nssp.
U.S. Geological Survey, 2020a, USGS water data for the nation: U.S. Geological Survey National Water Information System database, accessed July 31, 2020, at https://doi.org/10.5066/F7P55KJN.
U.S. Geological Survey, 2020b, National land cover database: U.S. Geological Survey data, accessed March 30, 2021, at https://www.usgs.gov/centers/eros/science/national-land-cover-database?qt-science_center_objects=0#qt-science_center_objects.
Weather Underground, 2020, Farmingdale NY weather conditions—Republic Airport station: Weather Underground data, accessed May 25, 2021, at https://www.wunderground.com/weather/KFRG.
Appendix 1. Sample Collection in South Oyster Bay on Long Island, New York
Table 1.1.
Locations where samples were collected in South Oyster Bay on Long Island, New York, for bacterial genetic markers and fecal coliform analysis.[Data are from the National Water Information System (U.S. Geological Survey, 2020). Samples collected include blanks and replicates. Sample conditions of wet and dry indicate whether a sample was influenced by storm or nonstorm conditions, respectively; EST, eastern standard time;—, sample collected irrespective of wet or dry conditions]
Table 1.2.
Data summary of all samples collected in South Oyster Bay on Long Island, New York, for bacterial genetic markers and fecal coliform analysis.[Samples collected include replicates. Bacterial genetic markers are human-associated Bacteroides (HF183), ruminant-associated Bacteroides (Rum2Bac), waterfowl-associated Helicobacter (GFD), and canine-associated Bacteroides (BacCan) markers. Station data are from the National Water Information System (U.S. Geological Survey, 2020). Bacteroides and Helicobacter samples were analyzed by the U.S. Geological Survey Ohio Microbiology Laboratory. Fecal coliform samples were analyzed by the Suffolk County Department of Health Services Public and Environmental Health Laboratory unless denoted with a double asterisk (**), which indicates the sample was analyzed by the New York Department of Environmental Conservation Marine Laboratory. Bacterial genetic marker values in bold typeface indicate that the concentration was greater than the reporting limit; values preceded by a less than (<) symbol indicate the reporting limit for a given assay when a nondetect occurred; values preceded by a greater than (>) symbol indicate that the value exceeded the reporting limit for a given assay. copies/100mL, copies of genetic marker per 100 milliliters; MPN/100mL, most probable number per 100 milliliters; *, copies of genetic marker per gram dry weight sediment; E, estimate; b, concentration was greater than the limit of quantification but less than the reporting limit; ~, duplicate quantitative polymerase chain reaction (qPCR) results do not agree; V, result may be affected by contamination; c, contamination was found in a blank sample and was used to appropriately qualify associated samples;—, assay was not performed]
Reference Cited
U.S. Geological Survey, 2020, USGS water data for the nation: U.S. Geological Survey National Water Information System database, accessed July 31, 2020, at https://doi.org/10.5066/F7P55KJN.
Supplemental Information
Concentrations of fecal coliform bacteria are given in most probable number per 100 milliliters (MPN/100 mL).
Concentrations of microbial source tracking markers are given in marker copies per 100 milliliters (copies/100 mL) or marker copies per gram dry weight (copies/gdw).
Abbreviations
BacCan
canine-associated Bacteroides marker
FC
fecal coliform bacteria
GFD
waterfowl-associated Helicobacter marker
HF183
human-associated Bacteroides marker
MPN
most probable number
MST
microbial source tracking
NWIS
National Water Information System
NYSDEC
New York State Department of Environmental Conservation
Rum2Bac
ruminant-associated Bacteroides marker
USGS
U.S. Geological Survey
For more information, contact
Director, New York Water Science Center
U.S. Geological Survey
425 Jordan Road
Troy, NY 12180-8349
dc_ny@usgs.gov
or visit our website
https://www.usgs.gov/centers/ny-water
Publishing support provided by the Pembroke and Reston Publishing Service Centers
Suggested Citation
Tagliaferri, T.N., Fisher, S.C., Kephart, C.M., Cheung, N., Reed, A.P., and Welk, R.J., 2022, Using microbial source tracking to identify fecal contamination sources in South Oyster Bay on Long Island, New York: U.S. Geological Survey Scientific Investigations Report 2022–5082, 15 p., https://doi.org/10.3133/sir20225082.
ISSN: 2328-0328 (online)
Study Area
| Publication type | Report |
|---|---|
| Publication Subtype | USGS Numbered Series |
| Title | Using microbial source tracking to identify fecal contamination sources in South Oyster Bay on Long Island, New York |
| Series title | Scientific Investigations Report |
| Series number | 2022-5082 |
| DOI | 10.3133/sir20225082 |
| Year Published | 2022 |
| Language | English |
| Publisher | U.S. Geological Survey |
| Publisher location | Reston, VA |
| Contributing office(s) | New York Water Science Center |
| Description | Report: vi, 15 p.; Dataset |
| Country | United States |
| State | New York |
| Other Geospatial | Long Island, South Oyster Bay |
| Online Only (Y/N) | Y |
| Additional Online Files (Y/N) | N |
| Google Analytic Metrics | Metrics page |