

Updated Annual and Semimonthly Streamflow Statistics for Wild and Scenic Rivers, Owyhee Canyonlands Wilderness, Southwestern Idaho, 2021
Links
- Document: Report (5.6 MB pdf) , HTML , XML
- Data Release: USGS data release — Streamflow regressions and annual and semimonthly exceedance probability statistics for Wild and Scenic Rivers, Owyhee Canyonlands Wilderness, Idaho
- Download citation as: RIS | Dublin Core
Acknowledgments
The authors thank the Bureau of Land Management (BLM) and U.S. Geological Survey (USGS) staff who supported the data collection effort and project management, including Bryce Bohn, Thomas Clifford, Seth Flanigan, Kara Kirkpatrick, Jimmy McCray, Mike McGee, Alen Mosley, Kyle Paffett, Tipton Power, Fredric Price, Isaac Schultz, Galen Sparks, Casey Steenhoven, Cali Thomas, and Evan Worthington (BLM) and Michael Allen, John Carricaburu, Greg Clark, Will Elliott, David Evetts, David George, Connor Malloy, Russ Miller, Erin Murray, Douglas Ott, Gregory Pachman, Bryce Redinger, Alvin Sablan, James Schaefer, Peter Spatz, and John Wirt (USGS). The dedication and support from these individuals were essential in ensuring safety while providing dependable data for this study.
Abstract
The U.S. Geological Survey, in cooperation with the Bureau of Land Management (BLM), continued streamflow data collection in water years 2013–21 to update daily streamflow regressions and annual and semimonthly streamflow statistics initially developed in 2012 for streams designated as “wild,” “scenic,” or “recreational” under the National Wild and Scenic Rivers System in the Owyhee Canyonlands Wilderness in southwestern Idaho. To sustain “outstanding remarkable values” in the Owyhee Canyonlands Wilderness, BLM determined that maintaining specific streamflow conditions in rivers was important for sustaining ecological health, recreational opportunities, and water demands for stock water and irrigation in a region with increased pressure from upstream land development. Streamflow statistics previously developed using regional regressions based on limited number of streamgages and generalized basin characteristics were determined to inaccurately represent hydrologic characteristics in the Owyhee Canyonlands Wilderness.
In this study, updated streamflow regressions and statistics are provided for 11 partial-record sites in the Owyhee Canyonlands Wilderness using 311 additional streamflow measurements. A partial-record Maintenance of Variance Extension, Type 1 (MOVE.1) streamflow regression method was used to relate discrete streamflow measurements collected at partial-record sites with daily mean streamflow at nearby index sites. The updated regressions were used to estimate a synthetic daily mean streamflow record at each partial-record site for the period of record of the selected index site. The computed synthetic streamflow record was then used to determine annual and semimonthly streamflow statistics at each partial-record site. Annual bankfull streamflow statistics were calculated at each partial-record site using the computed bankfull streamflow at the selected index site and the updated streamflow regression.
Additional streamflow measurements representing a larger range of hydrologic conditions since 2012, reevaluation of index site selection, and updated regression techniques improved streamflow statistic estimates in the Owyhee Canyonlands Wilderness. Regression performance was evaluated based on the coefficient of determination (R2) between the partial-record and index sites, percent bias, and similarity of basin characteristics between the selected index site and the partial-record site. Generally, the updated regressions performed well for partial-record sites with an index site located upstream or downstream on the same stream. Regression performance was degraded and less robust for index sites located farther away from the corresponding partial-record site. Additional streamflow measurements at partial-record sites with few measurements over a small range in hydrologic conditions could improve regression performance and reduce prediction intervals. Furthermore, additional index sites in the Owyhee Canyonlands Wilderness could improve the updated streamflow regressions and statistics.
Introduction
The Owyhee Canyonlands Wilderness is a geographically remote area in southwestern Idaho (fig. 1). Designated as “wild,” “scenic,” or “recreational” under the Wild and Scenic Rivers Act (WSR Act) of 1968 (Public Law 90-542; 16 U.S.C. 1271 et seq.) and subsequent Omnibus Public Lands Management Act of 2009 (Public Law 111-11; 16 U.S.C. 7202), 325 miles (mi) of streams in the Owyhee Canyonlands Wilderness are now managed by the Bureau of Land Management (BLM). The BLM is responsible for maintaining any unique and rare habitat, geographic, or recreational opportunity deemed an outstanding remarkable value (ORV) in each stream segment within the Owyhee Canyonlands Wilderness. Maintaining specific streamflow conditions in waterways is important for sustaining ecological health, recreational opportunities, and water demands for stock water and irrigation in a region with increased pressure from upstream land development in recent decades (Bureau of Land Management, 2015). To support BLM’s effort in managing the Owyhee Canyonlands Wilderness, streamflow data and statistics can be used to determine necessary streamflows for sustaining ORVs.
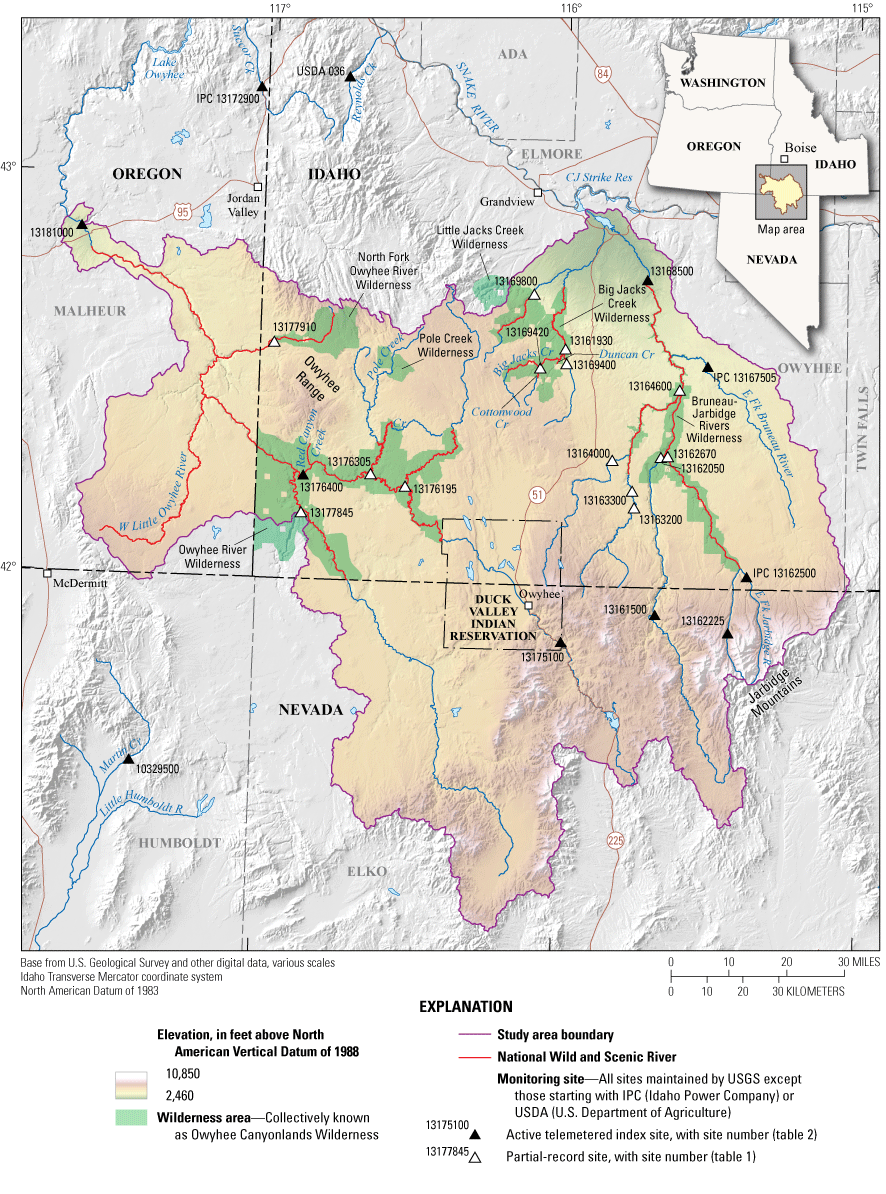
Study area extent and location of streamgages in the Owyhee Canyonlands Wilderness, southwestern Idaho.
Background
Rivers designated as “wild,” “scenic,” or “recreational” (hereinafter referred to as Wild and Scenic Rivers or WSR) may be free of or have very few impoundments or diversions, have varying levels of accessibility and shoreline development depending on the classification, and have one or more ORVs. Although none of the WSR segments are officially designated as “scenic,” every segment in the Owyhee Canyonlands Wilderness is classified with scenic, fish, and wildlife ORVs. Following the passing of the Omnibus Public Lands Management Act, BLM published the Final Management Plan and Environmental Assessment (hereinafter referred to as the wilderness management plan), which addresses future management of ORVs within the Owyhee Canyonlands Wilderness (Bureau of Land Management, 2015) in accordance with the WSR Act.
Streamflow statistics are often used for various water-resource related studies including emergency planning, water-resource management, road infrastructure designs, and for regulatory purposes that describe high and low streamflows. The wilderness management plan describes the importance of high and low streamflows for maintaining ORVs. The BLM commonly uses the bankfull streamflow statistics (hereinafter referred to as annual streamflow statistics) and the 20-, 50-, and 80-percent (hereinafter referred to as Q20, Q50, Q80, respectively) exceedance probability semimonthly daily mean streamflow statistics (hereinafter collectively referred to as semimonthly streamflow statistics) to file water right claims necessary for sustaining ORVs in the Owyhee Canyonlands Wilderness. Semimonthly streamflow statistics refer to streamflows that are equaled or exceeded 20-, 50-, and 80-percent of the time during any given semimonthly period. High streamflow periods, approximately equal to the semimonthly Q20, are necessary for recreational opportunities such as rafting, canoeing, and kayaking during the spring runoff. Median semimonthly streamflows (Q50) are commonly used to determine whether streamflow is greater than, equal to, or less than the median streamflow conditions. Low streamflow periods, approximately equal to the semimonthly Q80, are critical for sustaining habitat necessary for aquatic species survivability.
Ries and others (2004) developed the U.S. Geological Survey (USGS) StreamStats program in Idaho to estimate streamflow statistics at ungaged locations throughout the State. Basin characteristics for the Owyhee Canyonlands Wilderness are generalized by StreamStats. As a result, the region is poorly represented by regionalized streamflow regressions in StreamStats. Wood and Fosness (2013) and Wood (2014) developed streamflow regressions and statistics specific to the Owyhee Canyonlands Wilderness after determining StreamStats generated inaccurate statistics using regressions in the Intermountain Semidesert region occupied by the Owyhee Canyonlands Wilderness. In an effort to update the statewide streamflow statistic estimates, Wood and others (2016) used additional streamflow data and new statistical methods to update regional regressions in StreamStats, which did not include the previously developed regressions for the Owyhee Canyonlands Wilderness.
Beginning in water year 2013, the USGS collected streamflow data throughout the Owyhee Canyonlands Wilderness to improve streamflow statistics previously estimated in Wood and Fosness (2013) and Wood (2014), which were later used to file water rights claims for WSR segments. Because of the inherent difficulties with operating and maintaining real-time streamgages in geographically remote regions like the Owyhee Canyonlands Wilderness, only 1 year of streamflow measurements were made as part of Wood and Fosness (2013) and 2 years of streamflow measurements in Wood (2014). Historical streamflow data, where available, were compiled and used with recent streamflow measurements made since water year 2012 to update streamflow statistics from previous studies (Idaho Power Company, 2021; U.S. Geological Survey, 2022).
Purpose and Scope
In 2013, the U.S. Geological Survey (USGS), in cooperation with BLM, continued work in the Owyhee Canyonlands Wilderness in southwestern Idaho to improve annual and semimonthly streamflow statistics used to define the streamflows required to help sustain ORVs for rivers designated “wild,” “scenic,” or “recreational.” The streamflow statistics may support the Bureau of Land Management’s effort to develop and file a federal water rights claim for sustaining outstanding remarkable values for the rivers. The purpose of this study is to provide annual and semimonthly streamflow statistics using updated streamflow regressions. The streamflow regressions developed in this study were updated using streamflow data collected since water year 2013 and other historical data collected before this study began. This report presents the background of the study, methods used to develop streamflow regressions that were used to update annual and semimonthly streamflow statistics, an evaluation of regression performance, and a comparison with previously published statistics for WSR segments in the Owyhee Canyonlands Wilderness.
Description of Study Area
The Owyhee Canyonlands Wilderness comprises 16 WSR segments spanning 325 mi across six Wilderness Areas managed by the BLM. The wilderness areas encompass 517,000 acres with six main river corridors including the North Fork Owyhee River, South Fork Owyhee River, East Fork Owyhee River, Big Jacks Creek, Little Jacks Creek, Bruneau River, Jarbidge River, and Pole Creek (not discussed in this report). Streamflow regressions and statistics were determined at 11 locations along WSR segments in the Owyhee Canyonlands Wilderness (fig. 1). State and Federal owned land encompass the Owyhee Canyonlands Wilderness with neighboring parcels of land owned by private citizens and Native American Tribes (Bureau of Land Management, 2015).
The Owyhee Canyonlands Wilderness is characterized by deeply incised basaltic and rhyolitic canyons and open sagebrush-dominated highlands that make up the scenic ORVs in each WSR segment. Contributing to the recreational ORV associated with some WSR segments, the study area is pristine and void of human development providing excellent opportunities for hiking, camping, and other outdoor activities (Bureau of Land Management, 2015). Characterized by a generally semiarid and cool climate, summertime temperatures exceeding 100 °F are common. The general hydrology can be summarized by high streamflows usually occurring from rain-on-snow events that occur during March–June with timing dependent on the range of elevations in each individual drainage basin. Minimum streamflows generally occur during July–February.
Each WSR segment is characterized by fish and wildlife ORVs. The Owyhee Canyonlands Wilderness provides habitat for many biotic communities including the greater sage grouse (Centrocercus urophasianus), California bighorn sheep (Ovis canadensis californiana), redband trout (Oncorhynchus mykiss), bull trout (Salvelinus confluentus), and Bruneau hot springsnail (Pyrgulopsis bruneauensis). Numerous WSR segments have provided essential resources like access to permanent water, fuel, and other animal and vegetative materials for the Shoshone-Paiute people for countless generations (Bureau of Land Management, 2015). A complete description of the study area including topography, land use, and hydrology is provided in Wood and Fosness (2013).
Methods
This study included two phases, streamflow data collection and statistical analysis. Miscellaneous streamflow measurements were collected at partial-record streamflow sites and real-time streamgages. Streamflow data were then compiled and a synthetic streamflow record at partial-record sites was developed. Finally, annual and semimonthly streamflow statistics were estimated for each partial-record site based on the synthetic streamflow record.
Streamflow Data Collection
Discrete Streamflow Measurements
Beginning in water year 2013, 311 discrete streamflow measurements were made by USGS and BLM personnel at 14 partial-record sites in the Owyhee Canyonlands Wilderness (table 1). Partial-record sites are locations in the study area without a continuous streamflow record. Measurements were spatially clustered each year by basin with a goal to make a minimum of two measurements per month to cover a range of hydrologic conditions and to minimize uncertainty in semimonthly streamflow statistic estimates. However, due to the limited and weather-dependent access to partial-record sites in the study area, two measurements per month were not always possible. Some basins lacked an upstream real-time streamgage, which contributed to the difficulty in timing streamflow measurements made to represent the range of hydrologic conditions. USGS field crews collected additional measurements in 2017 to capture above-average streamflow conditions while BLM field crews collected low streamflow measurements at other partial-record sites throughout the duration of this study.
Table 1.
Monitoring sites used to estimate streamflow statistics for Wild and Scenic Rivers, Owyhee Canyonlands Wilderness, southwestern Idaho, 2021.[All USGS data collected for the study are available in the USGS National Water Information System (U.S. Geological Survey, 2022). Number of discrete streamflow measurements: Includes zero streamflow measurements and duplicate measurements made on the same day. Post water year 2012 measurements: Streamflow measurements made since the beginning of water year 2013 (October 1, 2012). Total: Includes streamflow measurements for entire period of record. Abbreviations: USGS, U.S. Geological Survey; No., number; NAD 83, North American Datum of 1983; mi2, square mile; mm-yyyy, month-year; ft3/s, cubic foot per second; Qmin, minimum streamflow measurement; Qmax, maximum streamflow measurement]
| USGS site No. (fig. 1) |
Site name | Latitude (NAD 83, decimal degrees) |
Longitude (NAD 83, decimal degrees) |
Drainage area (mi2) |
Discrete measurement period of record (mm-yyyy) |
Qmin (ft3/s) |
Qmax (ft3/s) |
Number of discrete streamflow measurements |
|
|---|---|---|---|---|---|---|---|---|---|
| Post water year 2012 measurements |
Total | ||||||||
| Big Jacks Creek Basin | |||||||||
| 13161930 | Big Jacks Creek at Parker Trail, near Grasmere | 42.5939 | –115.994 | 176 | 02-2014 to 10-2020 | 1.95 | 431 | 34 | 34 |
| 13169420 | Cottonwood Creek near Harvey Point, near Bruneau | 42.5447 | –116.078 | 11.4 | 02-2012 to 10-2020 | 0.66 | 17.7 | 20 | 24 |
| 13169400 | Wickahoney Creek near Grasmere | 42.5572 | –115.989 | 56.6 | 02-2012 to 10-2020 | 0 | 179 | 23 | 27 |
| Bruneau River and Jarbidge River Basins | |||||||||
| 13162050 | Bruneau River above Jarbidge River, near Grasmere | 42.3278 | –115.653 | 557 | 08-1986 to 09-2018 | 9.92 | 572 | 24 | 33 |
| 13164600 | Sheep Creek above mouth, near Grasmere1 | 42.4967 | –115.604 | 600 | 05-2012 to 10-2020 | 0 | 2,820 | 0 | 4 |
| 13164000 | Mary's Creek at Tindall | 42.2671 | –115.884 | 83.6 | 02-2014 to 10-2020 | 0 | 1,520 | 39 | 39 |
| 13163200 | Sheep Creek near Grasmere | 42.2000 | –115.750 | 213 | 11-1961 to 10-2020 | 0 | 2,760 | 25 | 42 |
| 13163300 | Sheep Creek at Ranch Bridge, near Grasmere | 42.2414 | –115.759 | 226 | 02-2014 to 05-2015 | 0 | 235 | 10 | 10 |
| 13162670 | Jarbidge River above mouth, near Grasmere | 42.3286 | –115.651 | 470 | 08-1986 to 04-2019 | 14.1 | 1,090 | 35 | 38 |
| Little Jacks Creek Basin | |||||||||
| 13169800 | Little Jacks Creek above Wilderness Road, near Bruneau | 42.7292 | –116.104 | 74.1 | 05-2012 to 10-2020 | 0.84 | 30.8 | 26 | 32 |
| Owyhee River Basin | |||||||||
| 13176195 | Battle Creek above mouth, near Riddle | 42.2400 | –116.524 | 263 | 05-2012 to 08-2019 | 3.46 | 1,140 | 16 | 21 |
| 13176305 | Deep Creek above mouth, near Riddle | 42.2686 | –116.642 | 450 | 05-2012 to 08-2019 | 0.87 | 1,370 | 13 | 18 |
| 13177910 | North Fork Owyhee River near Fairylawn | 42.5918 | –116.981 | 98.5 | 09-1989 to 10-2020 | 0.72 | 342 | 26 | 45 |
| 13177845 | South Fork Owyhee River below Little Owyhee River, near Crutcher Crossing | 42.1677 | –116.872 | 2,720 | 09-1989 to 10-2020 | 14.5 | 2,360 | 20 | 28 |
Partial-record measurement sites were selected based on proximity to downstream wilderness boundaries, ease of access, and suitability of measurement cross sections. A suitable location is a reasonably straight channel free of large rocks, weeds, and obstructions that create eddies, slack water, or turbulence (Turnipseed and Sauer, 2010). Methods for collecting and processing streamflow measurements using acoustic Doppler current profilers and acoustic Doppler velocimeters were consistent with those described in Wood and Fosness (2013) and follow all USGS policies and guidelines (Rantz, 1982; Oberg and Mueller, 2007; Turnipseed and Sauer, 2010; Mueller and others, 2013). All streamflow measurements are available and published in the USGS National Water Information System (U.S. Geological Survey, 2022). An additional 84 streamflow measurements made at partial-record sites prior to water year 2013 were compiled as part of this study for a total of 395 discrete streamflow measurements. Due to access difficulties to Deep Creek and Battle Creek partial-record sites, fewer streamflow measurements were collected as compared to other partial-record sites in this study.
A method that combines streamflow at measurements sites was used to quantify the streamflow entering the Bruneau River from Sheep Creek (fig. 1, table 1). The method was implemented because of difficulty in accessing and measuring streamflow at the mouth of Sheep Creek (USGS 13164600). The sum of streamflow measurements made on concurrent days at Mary’s Creek (USGS 13164000) and the two upstream Sheep Creek sites (USGS 13163200 or USGS 13163300) were used to represent the streamflow at the downstream Sheep Creek monitoring site (USGS 13164600). This method was determined to be the most suitable for quantifying streamflow in Sheep Creek and assumes any streamflow contributions between the measurement locations are not discernible. Hereinafter, measurements at Sheep Creek above mouth, near Grasmere (USGS 13164600) refer to measurements made at that site and all concurrent measurements made upstream. Of the 95 streamflow measurements made in the Sheep Creek Basin (USGS 13164600, USGS 13164000, USGS 13163200, USGS 13163300), a total of 37 streamflow measurements were used for the analysis to represent streamflow at Sheep Creek above mouth (USGS 13164600; table 1). Therefore, this study only updates streamflow regressions at 11 partial-record sites.
Real-Time Streamgages
Streamflow data from real-time streamgages throughout the region were used to develop synthetic streamflow records at partial-record sites. Currently (2022), the USGS operates six real-time streamgages upstream and downstream of WSR segments and one (USGS 10329500) in an adjacent basin. In addition to USGS streamgages, three Idaho Power Company (IPC) operated real-time streamgages and one U.S. Department of Agriculture (USDA) operated real-time streamgage in the region were evaluated as index sites, or locations where streamflow would be referenced to, in this study (fig. 1, table 2). Unlike partial-record sites, real-time streamgages have continuous streamflow records that vary in length. For example, the East Fork Owyhee River real-time streamgage (USGS 13176400) began operation at the start of this study to develop more accurate synthetic streamflow records at nearby partial-record sites in the East Fork Owyhee River Basin (figs. 1–2, table 2). Conversely, the period of record of the index site at Martin Creek near Paradise Valley, Nevada (USGS 10329500) dates back to 1921 (table 2). Using a developed stage-discharge rating, a continuous record of instantaneous and daily mean streamflow was available for each real-time USGS, IPC, and USDA streamgage (Pierson and others, 2001; Idaho Power Company, 2021; U.S. Geological Survey, 2022). Each USGS real-time streamgage is operated, maintained, and processed according to USGS policies and guidelines (Turnipseed and Sauer, 2010; Mueller and others, 2013).
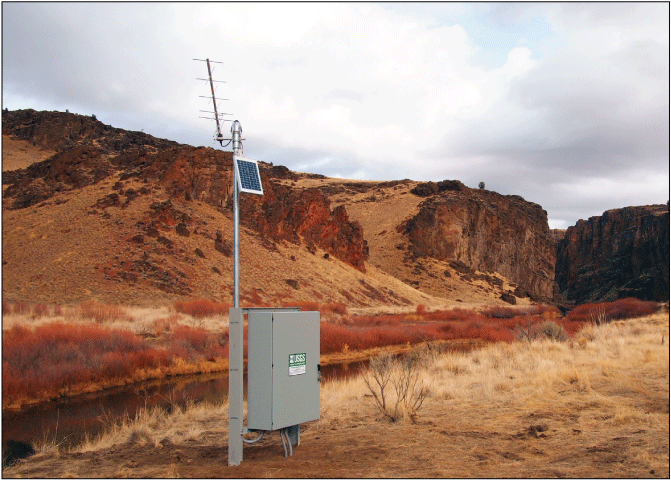
Real-time streamgage installed on East Fork Owyhee River at Crutcher Crossing (USGS 13176400), southwestern Idaho. Photograph by John Wirt, U.S. Geological Survey, December 6, 2012.
Table 2.
Streamgages evaluated as index sites for the development of synthetic streamflow records at partial-record sites, Owyhee Canyonlands Wilderness, southwestern Idaho, 2021.[All USGS data collected for the study are available in the USGS National Water Information System (U.S. Geological Survey, 2022). Site No.: USGS and Idaho Power streamgages were used in this analysis. In some cases, IPC continued streamgage operation and may have the same site number as the previously operated USGS streamgage. Abbreviations: No., number; NAD 83, North American Datum of 1983; mm-yyyy, month-year; Qdmin, minimum daily mean streamflow measurement; Qdmax, maximum daily mean streamflow measurement; IPC, Idaho Power Company; USDA, U.S. Department of Agriculture; USGS, U.S. Geological Survey; ft3/s, cubic foot per second; mi2, square mile]
| Site No. (fig. 1) |
Site name | Latitude (NAD 83, decimal degrees) | Longitude (NAD 83, decimal degrees) | Drainage area (mi2) | Period of record used in analysis (mm-yyyy) | Qdmin (ft3/s) | Qdmax (ft3/s) |
|---|---|---|---|---|---|---|---|
| Succor Creek Basin | |||||||
| IPC 13172900 | Succor Creek near Jordan Valley, Oregon | 43.2289 | –117.054 | 80.6 | 07-2007 to 10-2021 | 0 | 504 |
| Reynolds Creek Basin | |||||||
| USDA 036 | Reynolds Creek at Critical Zone Observatory outlet | 43.2614 | –116.753 | 92 | 01-1963 to 10-2021 | 0 | 3,850 |
| Little Humboldt Creek Basin | |||||||
| USGS 10329500 | Martin Creek near Paradise Valley, Nevada | 41.5346 | –117.418 | 175 | 10-1921 to 10-2021 | 2.00 | 2,500 |
| Bruneau River and Jarbidge River Basins | |||||||
| USGS 13162225 | Jarbidge River below Jarbidge, Nevada | 41.8905 | –115.429 | 30.6 | 04-1998 to 10-2021 | 1.00 | 633 |
| 1IPC 13162500 | East Fork Jarbidge River near Three Creek, Idaho | 42.0318 | –115.368 | 83.4 | 10-1928 to 03-1933, 09-1953 to 09-1971, 03-2006 to 10-2021 |
2.28 | 1,120 |
| USGS 13161500 | Bruneau River at Rowland, Nevada | 41.9332 | –115.675 | 382 | 06-1913 to 09-1918, 10-1966 to 10-2021 |
1.70 | 2,070 |
| 1IPC 13167505 | East Fork Bruneau River near Hot Spring, Idaho | 42.5568 | –115.511 | 502 | 08-1910 to 04-1915, 12-1948 to 09-1971, 03-2006 to 10-2021 |
0 | 791 |
| USGS 13168500 | Bruneau River near Hot Spring, Idaho | 42.7711 | –115.72 | 2,690 | 07-1909 to 02-1915, 10-1943 to 10-2021 |
21.0 | 6,470 |
| Owyhee River Basin | |||||||
| USGS 13175100 | Owyhee River near Mountain City, Nevada | 41.8606 | –115.988 | 391 | 04-1991 to 09-1995, 05-1997 to 10-2021 |
0.42 | 1,590 |
| USGS 13176400 | East Fork Owyhee River at Crutcher Crossing, Idaho | 42.2614 | –116.868 | 2,140 | 12-2012 to 10-2021 | 8.00 | 9,280 |
| USGS 13181000 | Owyhee River near Rome, Oregon | 42.8664 | –117.649 | 7,690 | 10-1949 to 10-2021 | 44.0 | 46,900 |
Statistical Analysis
All discrete streamflow measurements at partial-record sites and daily mean streamflow at evaluated index sites were compiled using the R programming language (R Core Team, 2020; De Cicco and others, 2021). Where available, historical data at partial-record sites dating back to 1961 were considered in this study (table 1). Duplicate measurements made for quality assurance and quality control collected on the same day were averaged and zero streamflow measurements were included. Conversely, measurements flagged for not meeting USGS quality standards were not included in this study. In total, 318 streamflow measurements were used to develop streamflow regressions and statistics at partial-record sites.
This study used three methods based on the Maintenance of Variance Extension, Type 1 (MOVE.1) regression technique (Hirsch, 1982) to develop an estimated, or synthetic, streamflow record at each partial-record site in the study area using one or two index sites. In some instances, field crews observed zero streamflow at partial-record sites, which required a unique logistic regression and MOVE.1 method to estimate the presence of streamflow.
Partial-Record Regression Method
Discrete streamflow measurements at partial-record sites were correlated with concurrent daily mean streamflow at each index site. The MOVE.1 regression technique is an improvement over the traditional ordinary least-squares regression technique, which preserves the variance of observed values, producing less bias in estimated streamflow values at a partial-record site (Hirsch, 1982; Colarullo and others, 2018). Wood and Fosness (2013) verified the partial-record method using the MOVE.1 regression was a valid technique for developing a synthetic streamflow record and estimating streamflow statistics as long as the partial-record and index sites had similar drainage basin characteristics, such as precipitation, air temperature, soil permeability, and vegetation. Further rationale for choosing the MOVE.1 regression is described in Wood and Fosness (2013).
Using the concurrent natural log transformed streamflow measurements from the partial-record site (dependent variable) and daily mean streamflow at the index sites (independent variable), a MOVE.1 regression was developed in the R statistics environment using the smwrBase package (Lorenz and De Cicco, 2017; R Core Team, 2020). To determine which index site provided the best estimate of daily mean streamflow at partial-record sites, a synthetic streamflow record was estimated using equation 1:
whereQPRS
is the synthetic or estimated daily mean streamflow at the partial-record site, in cubic feet per second;
ln
is the natural log;
a
is the regression intercept;
b
is the regression slope coefficient; and
QI
is the daily mean streamflow at the index site, in cubic feet per second.
When transforming the partial-record streamflow from log space to real space, the resulting conditional distribution was positively skewed (Helsel and others, 2020). The conditional mean was greater than the median and resulted in an underestimation of the true conditional mean. A non-parametric bias correction factor (BCF) was applied to the regression to remove bias introduced during transformation of the data back into real space (Duan, 1983). Methods for calculating the BCF are described in Wood and Fosness (2013). The final transformed regression equation used to develop the synthetic streamflow record at each partial-record site is:
whereQPRS
is the estimated daily mean streamflow at the partial-record site, in cubic feet per second;
BCF
is the Duan bias correction factor, dimensionless;
a
is the regression intercept;
b
is the regression slope coefficient; and
QI
is the daily mean streamflow at the index site, in cubic feet per second.
Initially, all available index sites (table 2) were evaluated using the MOVE.1 regression based on the correlation between the partial-record and index sites and the goodness of fit statistics of measured and predicted streamflow values at partial-record sites. This method provided a quantitative comparison of index sites while choosing which site or sites provided the most accurate estimates of streamflow at each partial-record site. An index site was then selected based on the correlation with the partial-record site, goodness of fit statistics (R2, coefficient of determination; RMSE, root mean square error; percent bias, the tendency of the predicted value to be larger or smaller than a measured value), geographic proximity to the partial-record site, similarity of basin characteristics (for example, drainage area and elevation), and, when possible, a lack of any diversions or upstream controls from agriculture, ranching, or beaver complexes. R2, RMSE, bias correction factor (BCF), and Pearson’s r close to one and a statistically significant fit (p>0.001) generally suggested a good statistical fit.
After selecting an index site, 95-percent prediction intervals were calculated for the synthetic streamflow values following methods used for ordinary least-squares regressions (Helsel and others, 2020). Prediction intervals provided a range that an estimated value from the regression is likely to fall within and considers the variability of the streamflow estimate around the mean and the error in estimating the synthetic streamflow. A regression with higher variability or a smaller sample size resulted in a wider prediction interval. The 95-percent prediction interval for a specified streamflow (
whereis the natural log of the estimated daily mean streamflow at the partial-record site;
is the natural log of the daily mean streamflow at the index site;
is the mean of the natural log of daily mean streamflow at the index site;
t
is the quantile of the Student’s t-distribution having n-2 degrees of freedom with probability of exceedance of 0.05/2;
SSx
is sum of squares of x;
s
is the standard error of the regression; and
n
is the number of streamflow measurements used to develop the regression.
Partial-Record Regression Using Multiple Index Sites
Using multiple index sites for record extension or augmentation is a common technique to improve estimates (Granato, 2009). To improve streamflow estimates, the use of multiple index sites was considered for each partial-record site to better represent basin characteristics. Using two index sites was determined to be suitable when a partial-record site is approximately geographically centered between two index sites in a basin. As a result, a MOVE.1 regression was developed for both index sites and a weighting factor was calculated for each index site used in the regression based on the average mean square error (Granato, 2009). To estimate streamflow at a partial-record site using two index sites, the synthetic streamflow record was computed using equation 4:
whereQPRS
is the estimated daily mean streamflow at the partial-record site, in cubic feet per second;
Weight1,2
is the weighting factor for both index sites, dimensionless;
BCF1,2
is the Duan bias correction factor at both index sites, dimensionless;
a1,2
is the regression intercept at both index sites;
b1,2
is the regression slope coefficient; and
Q1,2
is the daily mean streamflow at both index sites, in cubic feet per second.
When multiple index sites were selected for a regression, the standard error of the regression (s) was computed using the estimates from equation 4. The combined standard error of the regression was used to calculate the 95-percent prediction interval for each index site using equation 3. The prediction intervals for each index site were combined using a weighted average of the mean square error.
Regression for Partial-Record Sites with Zero Streamflow Measurements
A third method was necessary for estimating streamflow at two partial-record sites where zero streamflow measurements were observed. Zero streamflow measurements were considered useful for this study but could not be included in the standard MOVE.1 regression because the response data are log-transformed. Therefore, a logistic regression was first developed to determine the probability of zero streamflow using the index sites (Hortness, 2006). This probability was determined using equation 5:
wherePzero
is the probability of streamflow being equal to zero;
a
is the regression intercept;
b
is the regression slope coefficient;
QI
is the daily mean streamflow at the logistic regression index site in cubic feet per second; and
e
is a mathematical constant, approximately equal to 2.718.
If the resulting probability of zero streamflow was greater than 0.5, then streamflow at the partial-record site was more likely zero than not. Conversely, if the resulting probability of zero streamflow was less than 0.5, streamflow was more likely present at the partial-record site than not. Although each index site was considered for partial-record sites with zero streamflow measurements, a single index site was selected based on the accuracy of the logistic regression (the percentage of observations that were correctly classified) and goodness of fit statistics such as McFadden’s R2 (Helsel and others, 2020). Although a prediction interval could not be calculated for a binary logistic regression, the probability of zero streamflow or presence of streamflow provided the likelihood of that outcome, similar to prediction intervals. A MOVE.1 regression was developed with zero streamflow measurements removed using equations 1 and 2. A daily mean synthetic record was developed with a daily mean streamflow of zero when the logistic regression predicted less than 50-percent probability of the presence of streamflow and using the developed MOVE.1 regression when the logistic regression predicted a greater than 50-percent probability. Other left-censored regression methods, regressions where zero streamflow values are assigned values slightly greater than zero, such as the Tobit regression technique (Hald, 1949; Cohen, 1950) and censored MOVE.1 (Colarullo and others, 2018) regressions, were considered for this study; however, they did not improve estimates of streamflow compared to the combined logistic and MOVE.1 regression method.
Semimonthly Streamflow Statistics
Developing synthetic daily mean streamflow records using methods previously described provided the basis for calculating semimonthly streamflow statistics at each partial-record site in this study. Using the updated streamflow regressions, daily mean streamflow was estimated at each partial-record site for the entire period of record of the index site through the end of water year 2021 (table 2) resulting in a continuous synthetic daily mean streamflow record. The synthetic streamflow records were divided into semimonthly periods to calculate the streamflows corresponding to the Q20, Q50, and Q80 exceedance probabilities where the first semimonthly period was defined as the 1st through the 14th and the second semimonthly period was defined as the 15th through the end of the month. For each semimonthly period, the daily mean streamflow data were ranked in descending order using the Weibull plotting position formula, a standard procedure in Bulletin 17C, the standard reference for determining flood frequencies in the United States (England and others, 2019; Helsel and others, 2020). Daily mean streamflow values corresponding to the Q20, Q50, and Q80 exceedance probability (fig. 3) were extracted from the distribution. If the exceedance probability was not exactly equal to 20-, 50-, and 80-percent, linear interpolation between adjacent streamflow values was used to estimate exceedance probability streamflow. This same method was used to determine streamflows corresponding to the annual 20-, 50-, and 80-percent exceedance probability but instead of compiling semimonthly periods, the entire synthetic streamflow record was used.
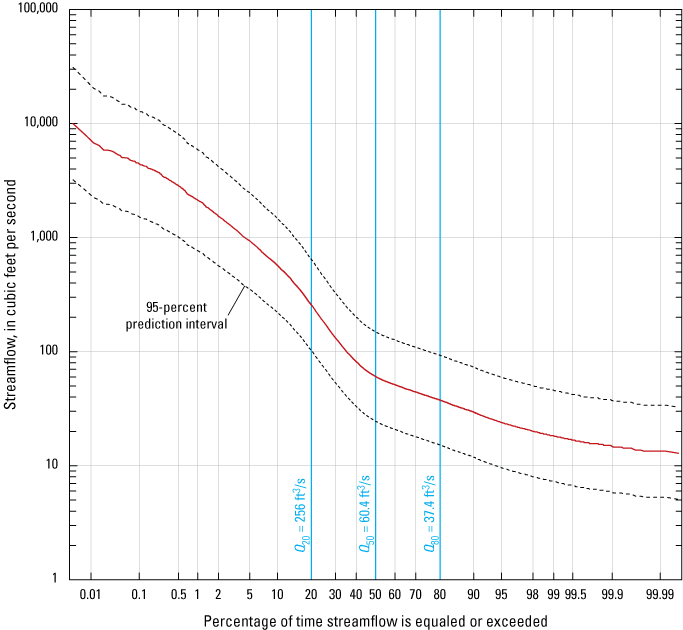
Example of determining 20-, 50-, and 80-percent (Q20, Q50, and Q80, respectively) exceedance probability streamflows from a streamflow exceedance probability curve for South Fork Owyhee River below Little Owyhee River, near Crutcher Crossing, southwestern Idaho (USGS 13177845).
Bankfull Streamflow Statistics
Bankfull streamflow is a biologically and geomorphologically important streamflow that “corresponds to the discharge at which channel maintenance is most effective, that is, the discharge at which moving sediment, forming or removing bars, forming or changing bends and meanders, and generally doing work results in the average morphologic characteristics of channels” (Leopold, 1994). Additionally, bankfull streamflows maintain vegetation recruitment by transporting instream nutrients to the upper banks, develop and maintain habitat for macroinvertebrate and fish species, and help maintain ORVs in the Owyhee Canyonlands Wilderness.
For this study, the bankfull streamflow statistic is defined as the 66.7 percent annual exceedance probability (AEP) streamflow. That is, the streamflow that has a 66.7 percent probability of being instantaneously exceeded in a given year. Annual peak streamflow data at each index site were retrieved for the period of record and loaded into the USGS PeakFQ program (Flynn and others, 2006). These data represent instantaneous values at the index site. As suggested in Bulletin 17C procedures, a log Pearson Type III distribution was fit to the logarithm of annual peak streamflow and a regional skew value was used to improve the fit of the log Pearson Type III distribution. Following Bulletin 17C procedures, the lower perception threshold for index sites with a broken record were set equal to infinity because additional information about streamflow during years with missing data was unavailable. A constant generalized regional skew of -0.07 with a model variance of 0.17 was used for each index site and weighted with the at-site skew (Wood and others, 2016). The bankfull streamflow determined from the frequency curve using USGS PeakFQ was an approximation and its accuracy depended on the sample appropriately representing the entire population frequency curve. A 90-percent confidence interval of the bankfull estimate was provided as a measure of the uncertainty associated with the estimate following Bulletin 17C procedures. Confidence intervals computed using PeakFQ only account for uncertainty in estimating annual peak exceedance probability and do not incorporate the uncertainty associated with estimating daily mean streamflow at partial-record sites. After determining the bankfull streamflow at the index site, the updated streamflow regressions were used to determine bankfull streamflow at each partial-record site and then compared to bankfull streamflow statistics and prediction intervals estimated at each partial-record site using peak-flow regional regression equations (Ries and others, 2017). When bankfull streamflow statistics could not be easily estimated and a nearby streamgage with a peak streamflow record was available, the bankfull streamflow statistic was calculated using that nearby streamgage. For example, a downstream discontinued streamgage at Little Jacks Creek (USGS 13170000) is close in proximity to the upstream partial-record site and has 11 years of annual peak streamflow record. Therefore, bankfull streamflow was estimated using the peak streamflow record at the discontinued streamgage.
Streamflow Regressions and Statistics at Partial-Record Sites
Regression Equations for Estimating Synthetic Streamflow
Of the 11 real-time streamgages evaluated as possible index sites, 6 were selected for the development of streamflow regressions at partial-record sites. Each index site was selected based on goodness-of-fit statistics between measured and predicted streamflow values at the partial-record sites. Moreover, the proximity of index sites to the partial-record sites also was considered when selecting an index site for streamflow regressions. Final updated regression coefficients and statistical performance metrics are published in Ducar and Dudunake (2022).
Updated streamflow regression equations were developed using one index site with the Maintenance of Variance Extension, Type 1 (MOVE.1) regression technique to estimate synthetic streamflow at eight partial-record sites (table 3). Because zero streamflow was not observed at these partial-record sites, a logistic regression was not required. Although Martin Creek (USGS 10329500, fig. 1, table 2), a high-elevation basin located in the Santa Rosa Range of northern Nevada, was outside the drainage basin of other sites in this study, it was selected as an index site for Big Jacks Creek (USGS 13161930), Cottonwood Creek (USGS 13169420), and Little Jacks Creek (USGS 13169800) due to similar runoff characteristics. Despite estimated streamflow values at Cottonwood Creek tending to be overbiased and underbiased at Big Jacks Creek compared to the measured streamflow values, Martin Creek was the best available index site in the study area. Similar to Martin Creek, the Bruneau River (USGS 13161500) was selected as an index site for the North Fork Owyhee River (USGS 13177910), which was attributed to the general regression performance and similar basin drainage area between each site. The East Fork Jarbidge River (IPC 13162500), a real-time streamgage located upstream from the partial-record site at the Jarbidge River (USGS 13162670), was selected for estimating streamflow at the downstream partial-record site. The real-time streamgage at East Fork Owyhee River (USGS 13176400), was selected as the best index site (table 3) for partial-record sites located upstream at Battle Creek (USGS 13176195) and Deep Creek (USGS 13176305). Despite surface-water regulation and diversions upstream on the South Fork Owyhee River near Duck Valley Indian Reservation (fig. 1), the Owyhee River (USGS 13181000) index site best represented the hydrologic characteristics at the South Fork Owyhee River (USGS 13177845, table 3).
Table 3.
Partial-record site and selected index site used to create synthetic streamflow records using the one index site Maintenance of Variance Extension, Type 1 (MOVE.1) approach (Hirsch, 1982), Owyhee Canyonlands Wilderness, southwestern Idaho, 2021.[All data collected for the study are available in the USGS National Water Information System (U.S. Geological Survey, 2022,) or from Idaho Power (Idaho Power Company, 2021). Abbreviations: IPC, Idaho Power Company; No., number; R2, coefficient of determination; USGS, U.S. Geological Survey]
| USGS site No. (fig. 1) |
Site name | Selected index site No. |
Number of measurements used in analysis |
R2 | Percentage of bias |
|---|---|---|---|---|---|
| Big Jacks Creek Basin | |||||
| 13161930 | Big Jacks Creek at Parker Trail, near Grasmere | USGS 10329500 | 34 | 0.865 | –19.3 |
| 13169420 | Cottonwood Creek near Harvey Point, near Bruneau | USGS 10329500 | 24 | 0.609 | 16.6 |
| Bruneau River and Jarbidge River Basins | |||||
| 13162670 | Jarbidge River above mouth, near Grasmere | IPC 13162500 | 34 | 0.987 | 4.2 |
| Little Jacks Creek Basin | |||||
| 13169800 | Little Jacks Creek above Wilderness Road, near Bruneau | USGS 10329500 | 32 | 0.865 | –1.5 |
| Owyhee River Basin | |||||
| 13176195 | Battle Creek above mouth, near Riddle | USGS 13176400 | 14 | 0.812 | –19.4 |
| 13176305 | Deep Creek above mouth, near Riddle | USGS 13176400 | 11 | 0.937 | 0.8 |
| 13177910 | North Fork Owyhee River near Fairylawn | USGS 13161500 | 44 | 0.891 | 1.5 |
| 13177845 | South Fork Owyhee River below Little Owyhee River, near Crutcher Crossing | USGS 13181000 | 28 | 0.882 | 26.9 |
In the instance of the Bruneau River (USGS 13162050, fig. 1), using one index site overbiased or underbiased streamflows at the partial-record site; therefore, two index sites were selected to develop a synthetic streamflow record with reasonable performance metrics that minimized overall bias (table 4). For example, Bruneau River at Rowland, Nevada (USGS 13161500) estimated low streamflow values better at the Bruneau River above Jarbidge River (USGS 13162050) although the Bruneau River near Hot Spring, Idaho (USGS 13168500) estimated high streamflow values better; therefore, both sites were selected and the MOVE.1 regression equations were combined using a weighted average of the mean square error (Granato, 2009).
Table 4.
Partial-record site and selected index sites used to create synthetic streamflow records at partial-record sites using multiple index sites Maintenance of Variance Extension, Type 1 (MOVE.1) approach (Hirsch, 1982), Owyhee Canyonlands Wilderness, southwestern Idaho, 2021.[All data collected for the study are available in the USGS National Water Information System (U.S. Geological Survey, 2022). Abbreviations: No., number; R2, coefficient of determination; USGS, U.S. Geological Survey; wt, weighting]
| USGS site No. (fig. 1) |
Site name | Selected index site No. |
Number of measurements used in analysis |
13161500wt | 13168500wt | R2 | Percentage of bias |
|---|---|---|---|---|---|---|---|
| Bruneau River and Jarbidge River Basins | |||||||
| 13162050 | Bruneau River above Jarbidge River, near Grasmere | USGS 13161500 and USGS 13168500 | 33 | 0.7462 | 0.2538 | 0.981 | 31 |
A combined logistic regression and MOVE.1 regression approach was used at partial-record sites where zero streamflow was observed to retain all records when using a log transformed MOVE.1 regression (table 5). To account for zero streamflow measurements at Sheep Creek (USGS 13164600), the probability of streamflow was determined using a logistic regression equation. Using the index site at Bruneau River at Rowland, Nevada (USGS 13161500) accurately predicted the presence of streamflow for all streamflow measurements at Sheep Creek (table 5). The Bruneau River near Hot Spring, Idaho (USGS 13168500) was selected as the index site when the logistic regression predicted streamflow at the Sheep Creek partial-record site. Similarly, Martin Creek (USGS 10329500) was used as the index site for the logistic regression, which accurately predicted the presence of streamflow for 63 percent of the measurements at Wickahoney Creek (USGS 13169400) (table 5). Additionally, the Martin Creek index site was used to predict the streamflow at Wickahoney Creek using the MOVE.1 regression technique.
Table 5.
Partial-record site and selected index sites used to create synthetic streamflow records at partial-record sites using multiple index sites Maintenance of Variance Extension, Type 1 (MOVE.1) approach (Hirsch, 1982), Owyhee Canyonlands Wilderness, southwestern Idaho, 2021.[All data collected for the study are available in the USGS National Water Information System (U.S. Geological Survey, 2022). R2: Coefficient of determination, which is for a MOVE.1 regression with zero streamflow measurements removed. Abbreviations: MOVE.1, Maintenance of Variance Extension, Type 1; No., number; USGS, U.S. Geological Survey]
Streamflow Statistics
The updated streamflow regressions at partial-record sites described in the previous section “Regression Equations for Estimating Synthetic Streamflow” are the basis for determining streamflow statistics used by BLM for maintaining ORVs in the Owyhee Canyonlands Wilderness. The final streamflow statistics determined in this study represent the best estimates of the Q20, Q50, and Q80 for semimonthly and annual periods in addition to bankfull streamflow statistics using the available streamflow records at index and partial-record sites. Using additional streamflow measurements and improved regression techniques, these streamflow statistics are an improvement over regional statistics in StreamStats (Ries and others, 2017) and those previously developed in Wood and Fosness (2013) and Wood (2014). A compilation of all calculated semimonthly and annual streamflow statistics for each partial-record site are published in Ducar and Dudunake (2022).
Semimonthly streamflow statistics represent the range of geographic and hydrologic conditions in the Owyhee Canyonlands Wilderness observed during this study. The largest streamflows corresponding to the Q20 in the Big Jacks Creek and Little Jacks Creek Basins generally occurred in the first semimonthly period of May and ranged from 9.52 ft3/s at Wickahoney Creek (USGS 13169400) to 38.5 ft3/s at Big Jacks Creek (USGS 13161930). Conversely, the lowest streamflow characterized by the Q80 typically occurred in August in Big Jacks Creek, Little Jacks Creek, and Cottonwood Creek with streamflows as low as 0.75 ft3/s at Cottonwood Creek and zero streamflow at Wickahoney Creek for all semimonthly periods beginning in mid-June through mid-March.
Streamflow statistics for all semimonthly periods generally were higher at partial-record sites with larger drainage areas (for example, Bruneau River and Jarbidge River) than those with small drainage areas (for example, Cottonwood Creek, Wickahoney Creek, Little Jacks Creek). The largest Q20 streamflows generally occurred from early May to mid-June at Sheep Creek (USGS 13164600), Bruneau River (USGS 13162050), and Jarbidge River (USGS 13162670) partial-record sites. The lowest streamflows characterized by the Q80 typically occurred from early September to early October on the Bruneau and Jarbidge Rivers. Although the drainage area of Sheep Creek is greater than the Bruneau and Jarbidge Rivers partial-record sites, the calculated Q80 for semimonthly periods from mid-July to the end of October was zero streamflow.
Streamflow statistics were updated at four partial-record sites in the Owyhee River Basin. With drainage areas from 98.5 square miles (mi2) at the North Fork Owyhee River (USGS 13177910) to 2,720 mi2 at the South Fork Owyhee River (USGS 1377845), partial-record sites in the Owyhee River Basin represent a larger range in drainage areas than other basins in the study. Timing of the largest Q20 streamflows occurred from mid-March to mid-April for the South Fork Owyhee River (USGS 1377845), Battle Creek (USGS 13176195), and Deep Creek (USGS 13176305). The largest Q20 streamflow occurs during the first semimonthly period of May at the North Fork Owyhee River partial-record site. The lowest Q80 streamflow statistic is greater than zero for all partial-record sites in the Owyhee River Basin and occurs in August or September.
The annual bankfull streamflow values at partial-record sites were calculated using updated streamflow regressions and measured peak streamflow data available at each index site (table 6). The bankfull streamflow values represent the best available estimates based on the currently (2022) available streamflow data and exemplify the range of hydrologic conditions within the Owyhee Canyonlands Wilderness. In general, estimated bankfull streamflow at partial-record sites increased with an increase in drainage areas. Exceptions to this included the North Fork Owyhee River (USGS 13177910) Basin, which is situated at a higher elevation than partial-record sites in the Big Jacks Creek and Little Jacks Creek Basins. Similarly, the estimated bankfull streamflows at the Jarbidge River (USGS 13162670) and Deep Creek (USGS 13176305) were higher than other partial-record sites with comparable drainage areas.
Table 6.
Bankfull streamflow statistics calculated from synthetic streamflow records at monitoring sites using PeakFQ (Flynn and others, 2006) and comparison with StreamStats (Ries and others, 2017) peak-flow regional regression equations estimates, Owyhee Canyonlands Wilderness, southwestern Idaho, 2021.[The bankfull statistic is defined as the streamflow with a 66.7 percent annual exceedance probability, or the streamflow that has a 66.7 percent change of occurring at any time in a given year (1.5-year recurrence interval). Estimates generated using PeakFQ following Bulletin 17C procedures (England and others, 2019). Estimates generated using StreamStats peak-flow regional regression equations: From Wood and others (2016). All data collected for the study are available in the USGS National Water Information System (U.S. Geological Survey, 2022). Abbreviations and symbol: USGS, U.S. Geological Survey; ft3/s, cubic foot per second; NA, not applicable/could not be calculated; %, percent]
| USGS site No. (fig. 1) |
Site name | Estimates generated using PeakFQ1,2 |
Estimates generated using StreamStats peak-flow regional regression equations |
||||
|---|---|---|---|---|---|---|---|
| Bankfull streamflow (ft3/s) |
Lower 90% confidence interval (ft3/s) |
Upper 90% confidence interval (ft3/s) |
Bankfull streamflow (ft3/s) |
Lower 90% prediction interval (ft3/s) |
Upper 90% prediction interval (ft3/s) |
||
| Big Jacks Creek Basin | |||||||
| 13161930 | Big Jacks Creek at Parker Trail, near Grasmere3 | 48.1 | 40.6 | 56.9 | 205 | 71.8 | 585 |
| 13169420 | Cottonwood Creek near Harvey Point, near Bruneau 3 | 11.5 | 9.9 | 13.3 | 49.5 | 17.3 | 142 |
| 13169400 | Wickahoney Creek near Grasmere3 | 14 | 10.4 | 18.6 | 120 | 42.7 | 337 |
| Bruneau River and Jarbidge River Basins | |||||||
| 13162050 | Bruneau River above Jarbidge River, near Grasmere | 412 | 342 | 466 | 364 | 122 | 1,090 |
| 13164600 | Sheep Creek above mouth, near Grasmere4 | 909 | 691 | 1,170 | 360 | 119 | 1,090 |
| 13162670 | Jarbidge River above mouth, near Grasmere | 741 | 640 | 847 | 331 | 112 | 981 |
| Little Jacks Creek Basin | |||||||
| 13169800 | Little Jacks Creek above Wilderness Road, near Bruneau5 | 82.2 | 36.1 | 162 | 117 | 40.2 | 341 |
| Owyhee River Basin | |||||||
| 13176195 | Battle Creek above mouth, near Riddle | 393 | 269 | 550 | 276 | 95.2 | 800 |
| 13176305 | Deep Creek above mouth, near Riddle | 1,618 | 922 | 2,670 | 362 | 123 | 1,070 |
| 13177910 | North Fork Owyhee River near Fairylawn | 318 | 234 | 382 | 164 | 57.8 | 465 |
| 13177845 | South Fork Owyhee River below Little Owyhee River, near Crutcher Crossing6 | 1,510 | 1,250 | 1,800 | 955.4 | NA7 | NA7 |
Selected index site outside of the study area of regional skew (Wood and others, 2016).
Streamflow at Sheep Creek above mouth includes all miscellaneous measurements at 13164600 or the sum of concurrent measurements at USGS 13164000 and either USGS 13163200 or 13163300.
Quality Assurance and Quality Control
Quality-assurance and quality-control measures were implemented in this study to assess the overall quality of updated streamflow regressions and statistics. A mass-balance approach was developed to compare measured streamflow values at a downstream location with estimated streamflow values on upstream tributaries within the same drainage basin. Assuming there was no loss or gain of streamflow to groundwater, smaller tributaries, or evapotranspiration, the comparison provided a way to assess how well streamflow regressions predicted actual conditions in the drainage basin.
To further evaluate the quality of the results in this study, the updated semimonthly streamflow statistics were compared to results from Wood and Fosness (2013) and Wood (2014). Furthermore, StreamStats peak-flow regional regression equations were used to determine bankfull streamflow estimates at partial-record sites and compared with corresponding bankfull streamflow estimates from updated streamflow regressions and peak streamflow records at index sites.
Mass Balance of Bruneau River and Jarbidge River Basins
The Bruneau River and Jarbidge River Basins provided a unique opportunity to evaluate the performance of updated streamflow regressions at partial-record sites using a mass-balance approach. The real-time streamgage at Bruneau River near Hot Spring, Idaho (USGS 13168500) provided a continuous record of daily mean streamflow draining four nested basins upstream in the Owyhee Canyonlands Wilderness. Streamflow at three partial-record sites—Bruneau River above Jarbidge River (USGS 13162050), Sheep Creek above mouth (USGS 13164600), Jarbidge River above mouth (USGS 13162670)—and one real-time streamgage at East Fork Bruneau River (IPC 13167505) were accumulated and compared to streamflow at the downstream real-time streamgage. The four nested basins have a combined drainage area of 2,129 mi2 accounting for 79 percent of the drainage area of the real-time streamgage at Bruneau River near Hot Spring, Idaho. The unaccounted drainage area generally is low-lying and lacks any major tributaries. Assuming no streamflow was gained or lost downstream of the four basins, the sum of daily mean streamflow in the four nested basins was expected to be approximately equal to the daily mean discharge at the downstream real-time streamgage. This assumption allows for a comparison of streamflow magnitude at each partial-record site and the overall influence they have on the streamflow draining from the Owyhee Canyonlands Wilderness.
For water years 1966–2021 when daily mean streamflow data were available at all index sites, the summation of the nested basins overestimates the daily mean streamflow at the downstream real-time streamgage by an average of 21.4 percent. Overall, the streamflow mass balance performs well at representing streamflow during baseflow conditions and throughout the rising-limb and falling-limb of the hydrograph but usually overestimates streamflow during peak streamflow conditions (fig. 4). The overestimation may be attributed to uncertainty in the streamflow estimates from updated regressions at the upstream partial-record sites. Alternatively, the assumption that gains and losses do not exist in the nested basins may be invalid. Additional peak streamflow measurements at the partial-record sites could improve the overall regression performance, estimated streamflow, and the Bruneau River and Jarbidge River Basins streamflow mass balance. For example, 2,820 ft3/s was measured at Sheep Creek (USGS 13164600), the highest recorded streamflow measurement at that partial-record site, during a short-duration rain-on-snow event on February 9, 2017. The concurrent daily mean streamflow at the Bruneau River index site (USGS 13168500) was 2,990 ft3/s. Assuming the measurement at Sheep Creek represented the daily mean discharge, streamflow at Sheep Creek accounted for 94 percent of the streamflow measured at the index site. Peak streamflow was recorded at the index site (5,140 ft3/s) from the same runoff event but occurred 1 day after the Sheep Creek partial-record site. Based on the updated streamflow regression at Sheep Creek, the estimated streamflow was 7,890 ft3/s, or 154 percent of the streamflow at the index site. Due to the lack of additional streamflow measurements at Sheep Creek when the index site streamflow was at least 3,000 ft3/s or higher, the estimated streamflow at Sheep Creek accounts for more streamflow than what was measured at the downstream index site. Additional streamflow measurements at Sheep Creek during long-duration peak streamflow conditions at the index site may improve the overall streamflow estimates at Sheep Creek. This observation suggests the assumption that measurements at partial-record sites representing daily mean streamflow conditions is invalid and can underestimate or overestimate actual streamflow conditions at a partial-record site. Moreover, an estimate of the lag-time between the partial-record site and index site in the basin also could improve daily streamflow estimates and the mass-balance in the Bruneau River and Jarbidge River Basins. However, the remoteness and difficulty of collecting measurements at partial-record sites in the basin makes estimating lag-time costly. The mass-balance method demonstrates the validity of updated streamflow regressions in the Bruneau River and Jarbidge River Basins and the need to further improve regressions that have high uncertainty to estimate streamflow more accurately at ungaged sites.
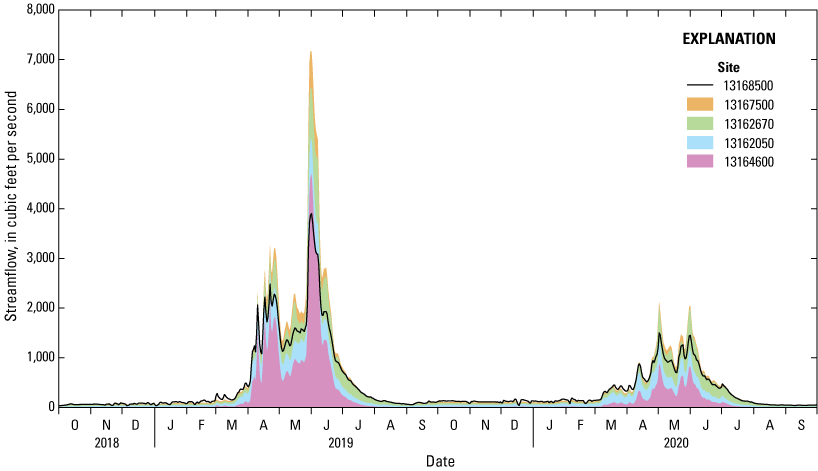
Summation of estimated streamflows at partial-record sites in the Bruneau River and Jarbidge River Basins compared to a real-time streamgage at Bruneau River near Hotspring, southwestern Idaho (USGS 13168500), for an above-average water year (2019) and average water year (2020). The water year is the 12-month period from October 1, for any given year, through September 30, of the following year.
PeakFQ and StreamStats Generated Bankfull Estimates
Long peak streamflow records at index sites and updated streamflow regressions provided a way to update annual streamflow statistics at partial-record sites in the Owyhee Canyonlands Wilderness. Bankfull streamflow statistics and confidence intervals at the index sites were computed using annual peak streamflow data in PeakFQ and compared to bankfull streamflow estimates and prediction intervals that were computed at each partial-record site using StreamStats peak-flow regional regression equations (Ries and others, 2017) (table 6).
The bankfull streamflow estimates generated using PeakFQ were better estimates than bankfull estimates from peak-flow regional regression equations, because the most current streamflow data were used from nearby streamgages and not regionalized. PeakFQ bankfull streamflow estimates at each partial-record site were within their computed upper and lower 90-percent confidence intervals but were outside of the 90-percent prediction intervals determined in peak-flow regional regression equations for Big Jacks Creek (USGS 13161930), Cottonwood Creek (USGS 13169420), Wickahoney Creek (USGS 13169400), Little Jacks Creek (USGS 13169800), Deep Creek (USGS 13176305), and South Fork Owyhee River (USGS 13177845). Confidence intervals for the peak-flow regional regression equations bankfull estimate at the South Fork Owyhee River could not be computed because the drainage area was outside the range for which regressions were developed; therefore, a comparison could not be made for the bankfull streamflow estimated using PeakFQ.
Bankfull streamflow estimates using peak-flow regional regression equations at the Big Jacks Creek (USGS 13161930) and Wickahoney Creek (USGS 13169400) partial-record sites (table 6) were higher than all streamflow measurements made at those sites except measurements that occurred during a low-duration high-magnitude rain-on-snow runoff event on February 10, 2017 (table 1). The bankfull streamflow estimate from peak-flow regional regression equations was higher than streamflow measurements collected during runoff events in an above normal water year (for example, 2017) at some partial-record sites, likely due to the poor performance of regionalized regressions in representing site conditions of small drainage areas. This suggested that the PeakFQ bankfull estimate was likely more representative of actual conditions at Big Jacks Creek and Wickahoney Creek. Similarly, the peak-flow regional regression equations bankfull estimate was higher than all streamflow measurements collected at the Cottonwood Creek partial-record site and, in turn, may suggest that PeakFQ bankfull streamflow estimates are more representative of conditions at the partial-record site (table 6). The peak-flow regional regression equations bankfull streamflow estimate also was higher than the PeakFQ estimate and all measurements at the Little Jacks Creek partial-record site. Altogether, each peak-flow regional regression equations bankfull streamflow estimate was higher than the PeakFQ bankfull streamflow estimate in the Big Jacks Creek and Little Jacks Creek Basins (table 6), which further supports the observation that site conditions are unique and may be poorly represented by peak-flow regional regression equations.
Peak-flow regional regression equations bankfull streamflow estimates for each partial-record site in the Bruneau River and Jarbidge River Basins were less than estimates from PeakFQ (table 6). Moreover, the peak-flow regional regression equations bankfull streamflow estimates ranged from 36 to 87 percent less than the maximum streamflow measurement at each partial-record site in the Bruneau River and Jarbidge River Basins. Similar to the Big Jacks Creek and Little Jacks Creek Basins, regional regressions provided in peak-flow regional regression equations do not accurately represent at-site conditions at the Bruneau River (USGS 13162050), Jarbidge River (USGS 13162670), or Sheep Creek (USGS 13164600) partial-record sites. PeakFQ bankfull streamflow estimates also were higher than all peak-flow regional regression equations estimates for partial-record sites in the Owyhee River Basin (table 6) and ranged from 52 to 75 percent less than the maximum streamflow measurement for each partial-record site in the Owyhee River Basin (table 1). This observation may suggest that peak-flow regional regression equations bankfull streamflow estimates may be less than actual bankfull conditions in the Owyhee River Basin and better estimated using PeakFQ.
Index Site Selection
In general, the selected index sites used to develop streamflow regressions were near the corresponding partial-record site, had similar drainage areas, and shared similar physiographic and hydrogeologic characteristics. Serial correlation between streamflow datasets, or the tendency for high flows to follow high flows and low flows to follow low flows between index sites and partial-record sites is an important observation when selecting an index site (Hirsch, 1982). Similar drainage areas and physiographic and hydrogeologic characteristics are important for maintaining serial correlation. If index sites in the same or nearby basins as a partial-record site did not correlate well or were not available, other index sites were considered to achieve the objective of the regression and update annual and semimonthly streamflow statistics.
Due to the remoteness and difficulty in accessing the Owyhee Canyonlands Wilderness, operating real-time streamgages also is inherently difficult. As a result, few index sites exist in the region that share similar basin characteristics as partial-record sites. The Jarbidge River (USGS 13162670), Bruneau River (USGS 13162050), Sheep Creek (USGS 13164600), Battle Creek (USGS 13176195), Deep Creek (USGS 13176305), and South Fork Owyhee River (USGS 13177845) partial-record sites indexed with a site or sites located within the same basin. Conversely, streamflow regressions for each partial-record site in the Big Jacks Creek and Little Jacks Creek Basins indexed best to Martin Creek (USGS 10329500), located in northern Nevada. Despite being in different drainage basins, Martin Creek shared similar runoff characteristics as the partial-record sites in the Big Jacks Creek and Little Jacks Creek Basins. Streamflow regressions, semimonthly, and annual statistics may be improved with a new index site within or near the Big Jacks Creek and Little Jacks Creek Basins and, in turn, would be in closer proximity and share similar basin characteristics. Similarly, the North Fork Owyhee River (USGS 13177910) partial-record site did not index well with nearby index sites in the Owyhee River Basin, which are affected by streamflow regulation upstream of the South Fork Owyhee River and East Fork Owyhee River, have differences in drainage area or runoff characteristics, or a combination of each. As a result, the index site at Bruneau River at Rowland, Nevada (USGS 13161500) was selected because of similarities in runoff characteristics and, in turn, produced the best streamflow regression.
Comparison of Previous and Updated Streamflow Estimates
Since streamflow regressions and statistics were originally developed in Wood and Fosness (2013) and Wood (2014), additional streamflow measurements were collected, regression techniques were modified, index site selections were reevaluated, updated regressions were developed, and new semimonthly and annual streamflow statistics were calculated. Peak-flow regional regression equations bankfull streamflow estimates computed in this study used the most updated regional regression equations from Wood and others (2016), which were not incorporated when estimates were originally computed using peak-flow regional regression equations in Wood and Fosness (2013) and Wood (2014). Therefore, peak-flow regional regression equations bankfull streamflow estimates in this study may not correspond to the peak-flow regional regression equations bankfull streamflow estimates in the previous studies.
Annual hydrographs showing the updated semimonthly Q20 estimates and annual bankfull estimates at each partial-record site and a comparison with previously published estimates are presented in figures 5–8. Although Q20, Q50, and Q80 all generally follow the same annual and seasonal trend (Ducar and Dudunake, 2022), annual hydrographs showing the calculated semimonthly Q20 estimates and annual bankfull estimates at each partial-record site were selected to provide a comparison with previously published Q20 estimates. With additional streamflow measurements at partial-record sites since the beginning of water year 2013, regression methods and equations were modified and, in some cases, different index sites were selected for partial-record sites than those previously published in Wood and Fosness (2013) and Wood (2014).
Big Jacks Creek Basin
Wood and Fosness (2013) calculated semimonthly and bankfull statistics at Big Jacks Creek using a direct computation method at a discontinued streamgage (USGS 13169500) and 65 years of available streamflow data (1939–2004). Peak streamflow at the discontinued streamgage generally occurred in March before drying up for the remainder of the year. Conversely, streamflow measurements collected since 2013 at the partial-record site (USGS 13161930) located approximately 21 mi upstream from the discontinued streamgage indicate streamflow generally is perennial. Based on previous measurements, Big Jacks Creek experienced large streamflow losses between the wilderness boundary and the discontinued streamgage as Big Jacks Creek exits the canyonlands. The loss is explained by the ephemeral and perennial characteristics at the discontinued streamgage and upstream partial-record site, respectively.
The largest updated and previously published Q20 streamflows were similar (35 and 38.5 ft3/s, respectively), but occurred nearly 2 months later using the updated regression (fig. 5A). The lag between Q20 streamflow estimates was likely attributed to index site selection for the updated regressions. Martin Creek (USGS 10329500) is dominated by snowmelt runoff from higher elevations resulting in peak streamflow that occurs later in the water year relative to Big Jacks Creek. Overall, Martin Creek performed better at estimating streamflow at the Big Jacks Creek partial-record site than other index sites (table 3; R2=0.865, percent bias = –19.3 percent). However, establishing a new index site in closer proximity to the Big Jacks Creek partial-record site may improve streamflow estimates and semimonthly and annual statistics. The updated bankfull streamflow estimate using PeakFQ was 42 percent less than the value calculated in Wood and Fosness (2013); however, the values were not comparable because the location represented by bankfull streamflow estimates are 21 mi apart and have different periods of record. To that end, the updated bankfull streamflow estimate using PeakFQ is considered to represent the best available estimate at Big Jacks Creek (table 6).
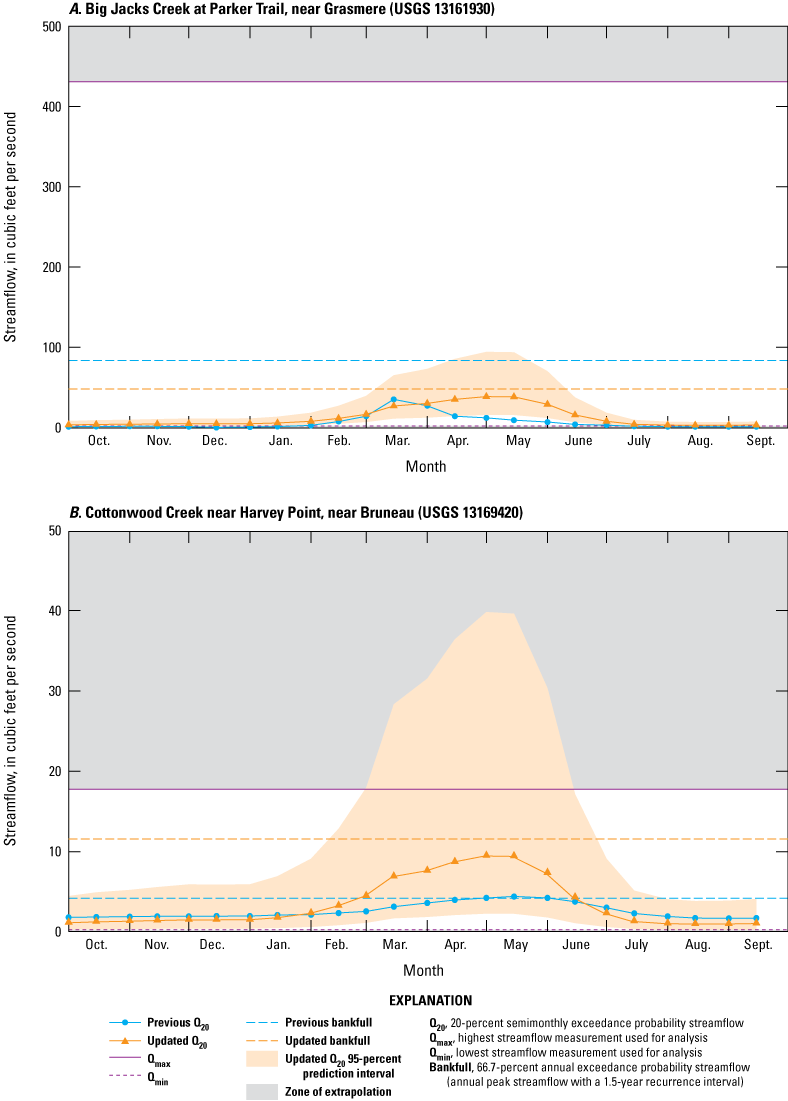
Updated and previously estimated semimonthly 20-percent exceedance probability and bankfull streamflow statistics (Wood and Fosness, 2013; Ducar and Dudunake 2022), maximum and minimum measured streamflow used in the analysis (U.S. Geological Survey, 2022), and updated 95-percent prediction interval (Ducar and Dudunake, 2022) at (A) Big Jacks Creek at Parker Trail, near Grasmere (USGS 13161930); (B) Cottonwood Creek near Harvey Point, near Bruneau (USGS 13169420); and (C) Wickahoney Creek near Grasmere (USGS 13169400) in the Big Jacks Creek Basin, southwestern Idaho. Previous estimates at Big Jacks Creek were estimated at the discontinued streamgage (USGS 13169500). All updated semimonthly and bankfull streamflow statistics are available in Ducar and Dudunake (2022).
Streamflow regressions and statistics at Cottonwood Creek (USGS 13169420), the smallest drainage area in the Big Jacks Creek Basin, were originally developed using the Bruneau River index site (USGS 13168500). Although the original streamflow regression performed well, it was developed using only four streamflow measurements at Cottonwood Creek. With 20 additional streamflow measurements at the partial-record site, the Martin Creek (USGS 10329500) index site performed nominally better (table 3) compared to the Bruneau River index site used in Wood and Fosness (2013). The updated streamflow regression is an improvement that is attributed to the selection of an index site with more similar basin and runoff characteristics. Additional streamflow data collection represented a wider range of hydrologic conditions that included a peak streamflow measurement in 2017, an above-average water year, and helped improve the overall regression performance. The updated streamflow regression generally performed poorly (R2=0.609) compared to the other updated regressions in this study, likely attributed to the spring-fed nature of Cottonwood Creek. The largest Q20 streamflow occurred in May using both regressions but was 115 percent greater using the updated regression (9.4 ft3/s, fig. 5B). The estimated bankfull streamflow using PeakFQ at Cottonwood Creek (11.5 ft3/s) was 178-percent greater than the previously estimated bankfull streamflow (4.14 ft3/s) and is likely a result of additional peak streamflow measurements that improved the streamflow regression performance (table 6, fig. 5B). In general, the updated streamflow regressions and statistics are a slight improvement over estimates in Wood and Fosness (2013); however, establishing a new index site that is in closer proximity to the Cottonwood Creek partial-record site may improve streamflow estimates and semimonthly and annual statistics.
An improved regression technique was used to update the streamflow regression and statistics at the Wickahoney Creek partial-record site (USGS 13169400), which included a combined logistic regression and MOVE.1 method (table 4). Unlike the regression developed in Wood and Fosness (2013), which used a Tobit regression model and the Bruneau River index site (USGS 13168500), zero streamflow measurements at Wickahoney Creek were used in a logistic regression instead of censoring the values. Using a logistic regression and streamflow at the Martin Creek index site (USGS 10329500) allowed for the calculation of the probability of zero streamflow occurring at Wickahoney Creek. Additionally, when streamflow was predicted using the logistic regression, a MOVE.1 regression was used with streamflow at the Martin Creek index site to estimate streamflow at Wickahoney Creek. Because zero streamflow was measured for 41 percent of the total streamflow measurements at the partial-record site (table 4), using the combined logistic regression and MOVE.1 method performed better than the Tobit regression model and improved overall streamflow statistics from Wood and Fosness (2013). The largest updated and previously published Q20 streamflows at Wickahoney Creek were similar (8.88 and 9.52 ft3/s, respectively) and both occurred in May. The updated bankfull statistic calculated using PeakFQ was 86 percent greater than the bankfull streamflow estimated in Wood and Fosness (2013) likely attributed to additional streamflow measurements (table 6, fig. 5C). The updated bankfull statistic calculated using PeakFQ was 86 percent greater than the bankfull streamflow estimated in Wood and Fosness (2013) likely attributed to additional streamflow measurements (table 6, fig. 5C). Similar to Big Jacks Creek, Cottonwood Creek, and Wickahoney Creek partial-record sites, an index site in the basin may improve the regression performance and streamflow estimates.
Bruneau River and Jarbidge River Basins
Wood and Fosness (2013) estimated semimonthly and annual streamflow statistics at the Bruneau River partial-record site (USGS 13162050) using a streamflow regression with the downstream real-time index site on the Bruneau River (USGS 13168500). The updated regression used the same index site as Wood and Fosness (2013) but also included an upstream index site on the Bruneau River (USGS 13161500) to better represent the basin characteristics of the partial-record site located at the intermediate location (table 4). The updated regression used 24 additional streamflow measurements, which encompassed the range of updated semimonthly streamflow statistics, unlike the previous estimates that extrapolated beyond the measured values. Additional peak streamflow measurements during above-average water years and measurements during semimonthly periods without measurements may further improve the streamflow statistics.
The largest previously estimated Q20 streamflow from Wood and Fosness (2013) was 745 ft3/s, approximately 165-percent greater than the updated estimate of 464 ft3/s, and occurred one semimonthly period after the new estimate. Moreover, the updated bankfull streamflow estimate (412 ft3/s) was 34 percent less than the previously estimated bankfull streamflow estimate (table 6, fig. 6A). The large difference in estimates was likely attributed to the inclusion of more streamflow measurements in the updated regression, which corresponded well to measured values at the partial-record site (R2=0.981, table 4).
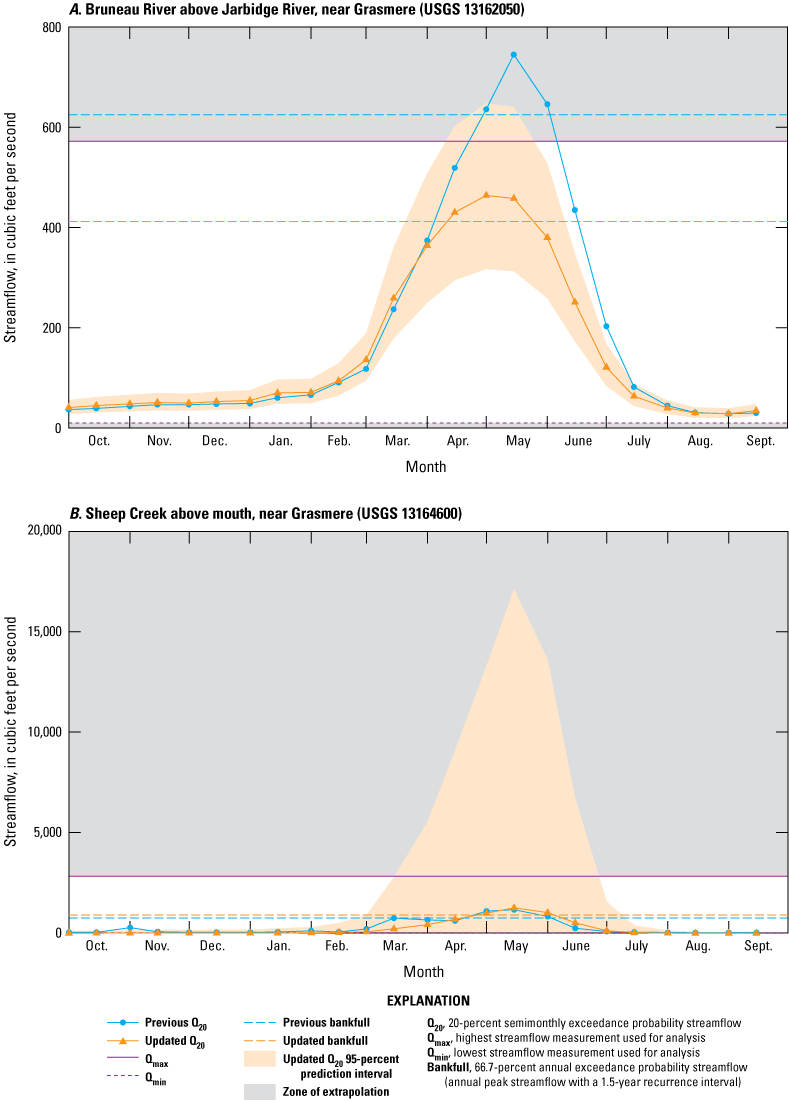
Updated and previously estimated semimonthly 20-percent exceedance probability and bankfull streamflow statistics (Wood and Fosness, 2013; Wood, 2014; Ducar and Dudunake 2022), maximum and minimum measured streamflow used in the analysis (U.S. Geological Survey, 2022), and updated 95-percent prediction interval (Ducar and Dudunake, 2022) at (A) Bruneau River above Jarbidge River, near Grasmere (USGS 13162050); (B) Sheep Creek above mouth, near Grasmere (USGS 13164600); and (C) Jarbidge River above mouth, near Grasmere (USGS 13162670) in the Bruneau-Jarbidge River Basin, southwestern Idaho.
Similar to methods that Wood (2014) used to update the Jarbidge River streamflow regression, Wood and Fosness (2013) created a synthetic streamflow record at Sheep Creek using a drainage-area-ratio method after accumulating streamflows that were calculated for upstream tributaries. As a result, a final streamflow regression was not initially developed for Sheep Creek. As part of this study, additional streamflow measurements were collected at the Sheep Creek partial-record site (USGS 13164600) and upstream tributaries (USGS 13164000, USGS 13163200, and USGS 13163300) to develop a streamflow regression since streamflow statistics were originally estimated in Wood and Fosness (2013). Based on the new streamflow regression using two Bruneau River index sites (USGS 13161500, USGS 13168500), the largest Q20 streamflow occurred in May (1,270 ft3/s) and was similar to the previously estimated value (1,080 ft3/s; fig. 6B). Although the streamflow accumulation method was used to assess the streamflow regression and quantify streamflow at the Sheep Creek partial-record site similar to the previous study, updated streamflow statistics for Sheep Creek represent the best available estimates based on the additional streamflow measurements. Bankfull streamflow was not easily estimated in the prior study because a synthetic record of annual peak streamflow was not calculated. Therefore, the peak-flow regional regression equations bankfull streamflow estimate (735 ft3/s) was considered the best available estimate at the time. However, this study established a streamflow regression used in conjunction with the peak streamflow record at the index sites to estimate a new bankfull streamflow (909 ft3/s) at the Sheep Creek partial-record site (table 6).
Instead of developing a regression to estimate streamflow statistics, Wood and Fosness (2013) directly computed statistics for the Jarbidge River using streamflow data at the real-time streamgage located approximately 40 river miles upstream of the WSR segment. Wood (2014) updated semimonthly and annual streamflow statistics using a drainage-area-ratio method to account for additional tributaries between the upstream real-time streamgage and the mouth of the Jarbidge River (USGS 13162670). To further update streamflow regressions and statistics, 31 additional streamflow measurements were made at the Jarbidge River partial-record site since the initial streamflow statistics were updated in Wood (2014). With additional measurements, a new regression was developed using the real-time index site on the East Fork Jarbidge River (IPC 13162500). Based on the new streamflow regression, the largest Q20 streamflow occurred in June (700 ft3/s), one semimonthly period later than the previously estimated Q20 (1,120 ft3/s, fig. 6C). The lag between updated and previously estimated Q20 streamflows is likely attributed to the index site selection and additional streamflow measurements since Wood (2014) estimated streamflow in the Jarbidge River. Wood (2014) considered using the drainage-area-ratio method to calculate bankfull streamflow but concluded that the bankfull streamflow was best estimated using peak-flow regional regression equations (691 ft3/s) because estimating and adjusting annual peak streamflow statistics using streamgages with varying periods of record provided inaccurate estimates. Conversely, this study updated bankfull streamflow estimates using PeakFQ, which evaluated the peak streamflow record at the nearby index site on the East Fork Jarbidge River. The updated streamflow regression at the partial-record site was used with the peak streamflow record at the index site to calculate a new bankfull streamflow estimate (741 ft3/s) and was considered to represent the best available estimate of bankfull streamflow at the Jarbidge River partial-record site (table 6).
Little Jacks Creek Basin
At the time of this study (2022), streamflow was not monitored using a real-time streamgage in the Little Jacks Creek Basin. Streamflow regressions and statistics at Little Jacks Creek (USGS 13169800), were originally developed using the Martin Creek index site (USGS 10329500). Martin Creek was outside the study area but shared similar runoff characteristics as Little Jacks Creek. After testing all possible index sites (table 2), Martin Creek was selected as the index site and the regression was updated with additional streamflow measurements. Because the updated and previously published regression used the same index site, differences in the streamflow statistics are related to the inclusion of additional streamflow measurements for updating the streamflow regression. The maximum measured streamflow used to update the regression was about nine times larger than the maximum streamflow that Wood and Fosness (2013) used to develop the initial regression, which improved the overall regression performance for estimating high streamflows. The largest Q20 streamflow occurred in May using both regressions but was 162-percent greater using the updated regression (12.2 ft3/s). The updated and previously developed regression estimated the lowest Q20 streamflows at Little Jacks Creek from August to January (fig. 7).
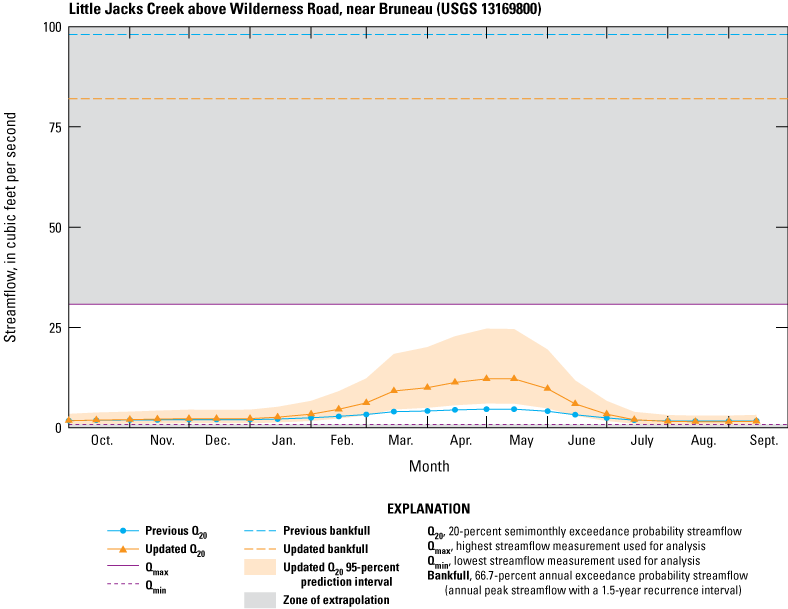
Updated and previously estimated semimonthly 20-percent exceedance probability and bankfull streamflow statistics (Wood and Fosness, 2013; Ducar and Dudunake 2022), maximum and minimum measured streamflow used in the analysis (U.S. Geological Survey, 2022), and updated 95-percent prediction interval (Ducar and Dudunake, 2022) at Little Jacks Creek above Wilderness Road, near Bruneau (USGS 13169800) in the Little Jacks Creek Basin, southwestern Idaho.
Bankfull streamflow estimated using the developed regression at Little Jacks Creek was 85 percent lower than the previously estimated bankfull streamflow (fig. 7). The previous bankfull streamflow was generated using a discontinued streamgage located downstream (USGS 13170000), which operated from 1938 to 1949. Wood and Fosness (2013) considered the streamflow statistics at the upstream site more representative of conditions in the WSR segment because Little Jacks Creek was a perennial stream while streamflow at the discontinued streamgage was ephemeral. However, due to the lack of high streamflow measurements at the upstream site and 11-year peak streamflow period of record from direct and indirect measurements at the discontinued streamgage, Wood and Fosness (2013) considered the bankfull streamflow from the downstream site a reasonable estimate for the WSR segment. Estimating bankfull streamflow at the discontinued streamgage is reasonable because losses to groundwater were less during peak streamflow conditions relative to baseflow conditions. The bankfull streamflow estimate, 82.2 ft3/s, was considered the best available estimate because it was computed using peak streamflow measurements and not a regression developed with daily mean streamflow.
Owyhee River Basin
The previously developed streamflow regression at Deep Creek (USGS 13176305) used an index site (USGS 13161500) in the Bruneau River Basin that resulted in a poor correlation. Although Deep Creek and Battle Creek are relatively close, the downstream index site on the Owyhee River (USGS 13181000) was previously used for the Battle Creek (USGS 13176195) streamflow regression. Moreover, the measurements at Deep Creek and Battle Creek were originally collected in less than 1 year and included five streamflow measurements used to develop a stage-discharge rating that was further used to develop streamflow regressions. With additional streamflow measurements at Deep Creek and Battle Creek and a reevaluation of index site selection since 2012, streamflow regressions and statistics were updated using the downstream East Fork Owyhee River index site (USGS 13176400, table 3) for both partial-record sites. As previously described, the real-time streamgage on the East Fork Owyhee River is more representative of basin characteristics than the selected index sites in Wood and Fosness (2013) despite a lower R2 compared to the previously developed regressions. The decrease in updated regression performance is likely attributed to the few corresponding measurements made at partial-record sites and the short period of record at the index site used to update the regressions (table 3).
The largest updated Q20 streamflow estimate at the Battle Creek partial-record site (USGS 13176195) was 211 ft3/s, consistent with the previous estimate of 242 ft3/s and occurred in the same semimonthly period (fig. 8A). However, the 95-percent prediction interval ranged from 32.6 to 1,360 ft3/s as published in Ducar and Dudunake (2022) and would likely decrease using additional high streamflow measurements to update the streamflow regression. Similarly, the updated bankfull streamflow estimate (393 ft3/s) was consistent with the previous estimate (389 ft3/s; fig. 8A). The largest difference between previous and updated Q20 streamflow estimates occurred at the Deep Creek partial-record site (USGS 13176305) where the largest Q20 streamflow was 3,420 ft3/s and occurred in May while the updated estimate was 640 ft3/s and occurred in March (fig. 8B). The difference in Q20 streamflow estimates is largely associated with index site selection and the length of the period of record at the index and partial-record site. The difference between the previous and updated Q20 suggests that previous estimates were not accurately represented using the Bruneau River index site (USGS 13161500) for the streamflow regression. The updated bankfull streamflow estimate (1,618 ft3/s) was consistent with the previous estimate (1,650 ft3/s) (fig. 8B) despite using different index sites to develop streamflow regressions. The updated bankfull streamflow estimate at Deep Creek was about 15 percent greater than the maximum measured streamflow on March 22, 2019. The estimated bankfull streamflow and semimonthly statistics at Battle Creek and Deep Creek were computed using the most representative index site and, in turn, are considered the best available estimates. However, additional measurements capturing high streamflow events at each partial-record site would likely improve regression performance.
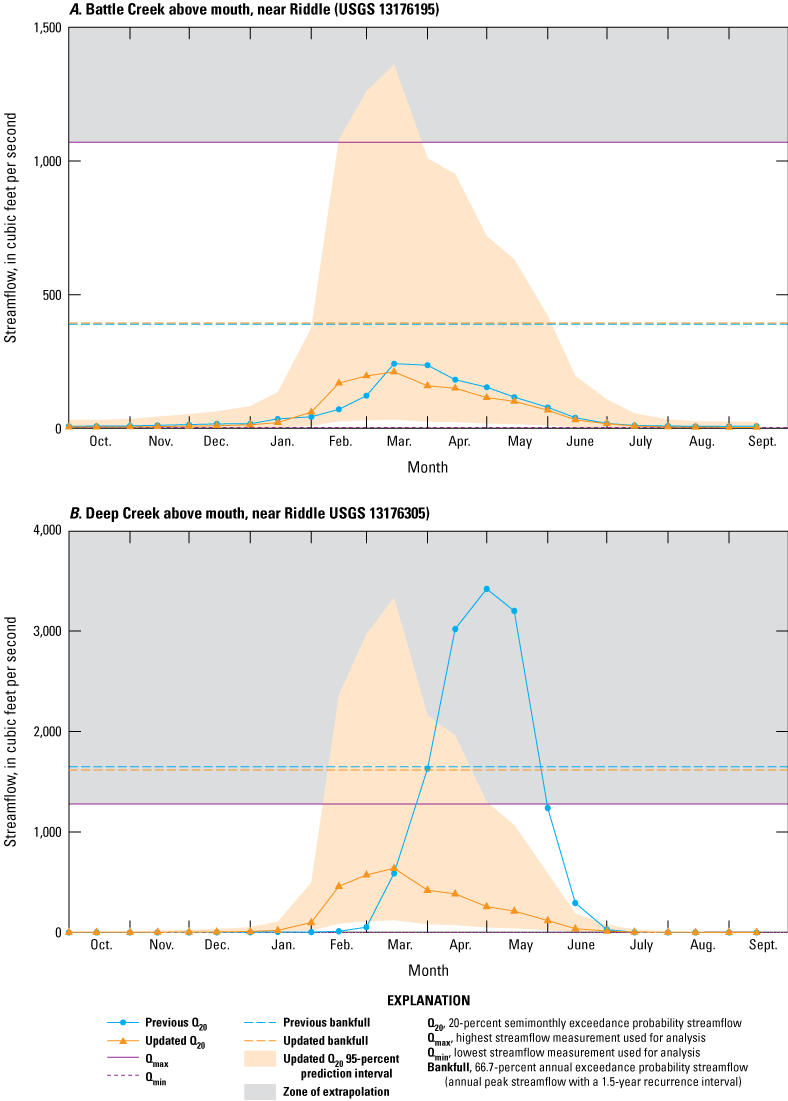
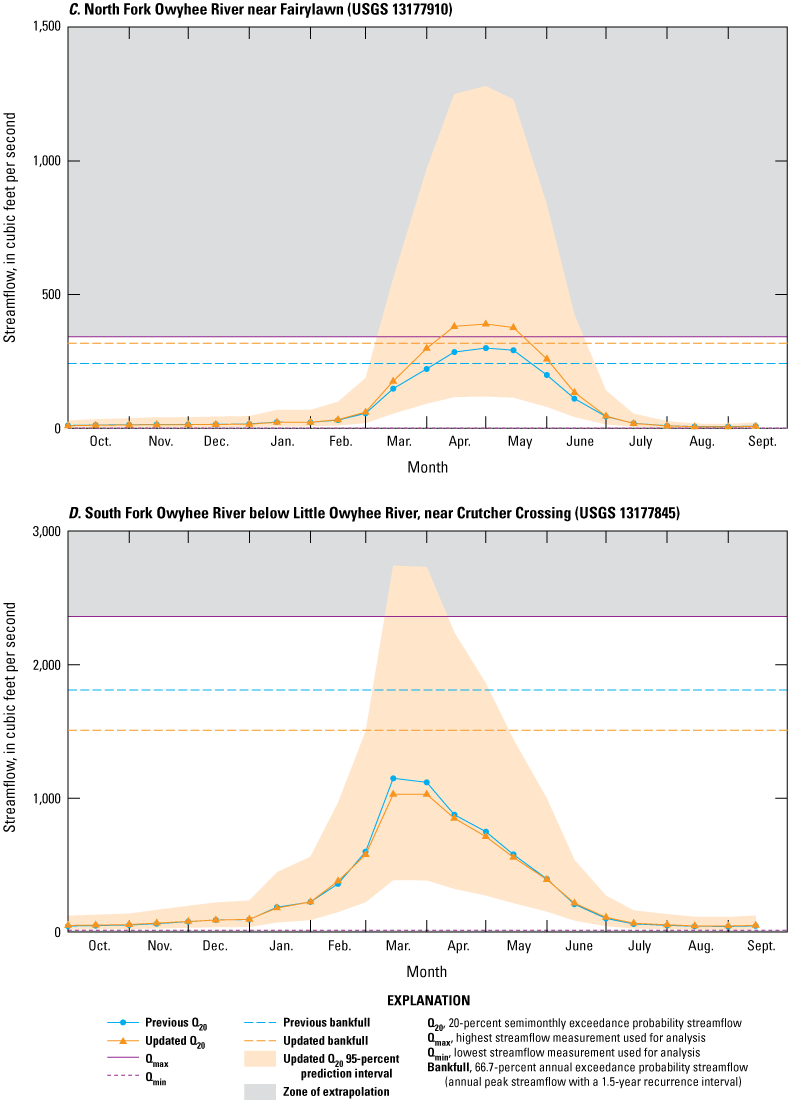
Updated and previously estimated semimonthly 20-percent exceedance probability and bankfull streamflow statistics (Wood and Fosness, 2013; Ducar and Dudunake 2022), maximum and minimum measured streamflow used in the analysis (U.S. Geological Survey, 2022), and updated 95-percent prediction interval (Ducar and Dudunake, 2022) at (A) Battle Creek above mouth, near Riddle (USGS 131761695); (B) Deep Creek above mouth, near Riddle (USGS 13176305); (C) North Fork Owyhee River near Fairylawn (USGS 13177910); and (D) South Fork Owyhee River below Little Owyhee River, near Crutcher Crossing in the Owyhee River Basin, southwestern Idaho.
Streamflow at the North Fork and South Fork Owyhee River partial-record sites (USGS 13177910 and USGS 13177845, respectively) was estimated using updated streamflow regressions and the same index sites used to generate previously developed regressions (table 3). Streamflow in the East Fork Owyhee River is monitored using a real-time streamgage (USGS 13176400) as previously described. Together, the three forks of the Owyhee River represent about 64 percent of the total drainage area at the downstream Owyhee River index site (USGS 13181000) with the South Fork Owyhee River being the largest drainage area of all partial-record sites in this study.
In general, the updated streamflow regression for the South Fork Owyhee River partial-record site performed only slightly better than the previously developed streamflow regression despite 20 additional measurements. The largest updated Q20 streamflow estimated at the South Fork Owyhee River partial-record site was 1,030 ft3/s, about 10 percent less than the previous estimate of 1,150 ft3/s and occurred during the same semimonthly period (fig. 8D). Conversely, the largest updated Q20 streamflow estimate at the North Fork Owyhee River partial-record site was 390 ft3/s, approximately 30 percent greater than the previous estimate of 300 ft3/s, which also occurred during the same semimonthly period (fig. 8C). Although the updated and previously developed streamflow regressions both used the Bruneau River index site (USGS 13161500), the updated regression performance decreased slightly with additional streamflow measurements resulting in wide prediction intervals. Moreover, the largest updated Q20 streamflow estimate was slightly larger than the highest measured streamflow value at the partial-record site suggesting the need for additional measurements during high streamflow conditions (fig. 8C). The updated bankfull streamflow estimate at the South Fork Owyhee River decreased about 17 percent to 1,510 ft3/s from the previous estimate and increased at the North Fork Owyhee River by 31 percent to 318 ft3/s. The changes in updated bankfull streamflow estimates were largely associated with the additional measurements at each partial-record site.
Limitations and Uncertainty
Methods used for this study and the resulting streamflow statistics have inherent uncertainty attributed to the limited number of index sites within the study area, limited number and range of streamflow measurements at partial-record sites, and lack of instantaneous peak streamflow measurements at the partial-record sites. Updated regression equations and streamflow statistics presented in this report are the best available for the study area through the end of water year 2021. Caution should be exercised when using updated regression equations. Users are encouraged to evaluate the regression uncertainty for their intended use (Ducar and Dudunake, 2022).
Currently, Idaho has one streamgage per 320 mi2 while only one streamgage exists for every 1,111 mi2 in the study area demonstrating the general lack of streamflow monitoring in the Owyhee Canyonlands Wilderness. Index sites selected for five partial-record sites in this study were in a different drainage basin. Differences in basin characteristic and timing of runoff between the index and partial-record sites may lead to uncertainties in the estimated streamflow statistics. The 95-percent prediction interval for each semimonthly streamflow statistic provided a range of estimated streamflow to account for the uncertainty associated with the updated regressions. Some partial-record sites had large prediction intervals which account for the differences in basin characteristics, timing of runoff between the index and partial-record sites, lack of streamflow measurements, and variability in the streamflow measurements around the regression line.
The updated regressions incorporated more streamflow measurements over a greater range of hydrologic conditions than were previously used to develop regressions in Wood and Fosness (2013) and Wood (2014). Regression performance for some partial-record sites decreased between the previous and updated regressions because of high values previously published due to the lack of measurements. For example, the R2 for the previously developed streamflow regression was 0.95 using seven measurements at the Little Jacks Creek partial-record site. Conversely, the updated regression R2 was 0.865 using 32 measurements. Despite the decrease in regression performance, the updated regression incorporates more streamflow measurements over a greater range of hydrologic conditions and therefore is the best available estimate.
Daily mean streamflow estimates outside of the range of measured streamflow at the partial-record sites could have substantial error. The highest estimated semimonthly Q20 was less than the highest measured streamflow for all partial-record sites except the North Fork Owyhee River. Conversely, the lowest semimonthly Q80 was greater than the minimum streamflow measurements for all partial-record sites except the Jarbidge River, Battle Creek, and Deep Creek.
The updated streamflow regressions were based on the relation between instantaneous streamflow measurements at the partial-record site and daily mean streamflow at an index site. The assumption was made that streamflow measurements collected at the partial-record site were representative of the daily mean streamflow. Error associated with this assumption is likely the greatest during short-duration high-intensity streamflow events (for example, rain-on snow or spring runoff) because streamflow is highly variable during the day and the measurement collected at the partial-record site may not represent the average streamflow for that day.
Regressions developed using daily mean streamflow were used to relate annual peak streamflow at the index site to an annual peak streamflow at the partial-record site to estimate bankfull streamflow. This assumes the relation between the instantaneous measurement at the partial-record site and the daily mean streamflow at the index site was representative of the relation between annual peak streamflow at the sites. This assumption was made because an annual peak streamflow at each partial-record site did not exist except at Little Jacks Creek, where 11 years of peak streamflow data were available from a nearby discontinued streamgage. The annual peak streamflow was always greater than or equal to the daily mean streamflow. As a result, the streamflow regression may have resulted in an underestimation of bankfull streamflow at some partial-record sites.
Streamflow in the Owyhee River and Big Jacks Creek Basins is regulated to an unknown degree by irrigation diversions and small upstream reservoirs. The streamflow measurements used in this report were made during regulated and non-regulated periods to account for the unknown timing and duration of the regulation and diversions. Changes to the regulation and diversions in these basins will impact the regressions and invalidate the streamflow statistics. Further improvement of the updated regressions may be accomplished by monitoring the timing of regulation and diversions to support data collection efforts and improve the overall regression and streamflow statistic certainty.
Suggestions for Further Work
As few as 11 streamflow measurements collected for 4 years were used to update regressions used to calculate streamflow statistics. Additional streamflow measurements over a wider range of hydrologic and climatic conditions could help improve the regressions and further confirm the relationship between the partial-record and selected index sites. Streamflow measurements collected at the partial-record sites during each semimonthly period would be more representative of streamflow conditions during each semimonthly period based on the estimated streamflow statistics. Furthermore, the accuracy of streamflow statistics for partial-record sites with an index site selected outside of the basin may improve by installing additional telemetered streamgages in the basin or an adjacent basin. A streamgage at Big Jacks Creek (USGS 13161930) may perform better as an index site for Cottonwood Creek and Wickahoney Creek as these sites are located upstream, as well as providing measured streamflow at Big Jacks Creek. Additionally, streamflow regression performance at Little Jacks Creek may benefit from an index site at Big Jacks Creek as the basins are adjacent and share similar physiographic and hydrogeologic characteristics.
Most partial-record sites in this report were observed to be perennial. However, field crews measured zero streamflow at Sheep Creek, Mary’s Creek, and Wickahoney Creek partial-record sites. This study incorporated the zero streamflow measurements using a logistic regression to estimate days when the partial-record site had zero streamflow. Alternative observation methods (for example, game camera) to determine days when a partial-record site dries up would improve the accuracy of the streamflow statistics and the understanding of the WSR segment during baseflow conditions. If game cameras are used, a daily stage could be photographed to determine when the annual peak streamflow occurs in relation to peak streamflow at the index site. These data may help to understand if there is a lag in peak streamflow timing between a partial-record site and the selected index sites and if bankfull streamflow can be estimated using the methods described in this report.
More complex data analysis and regression techniques compared to a simple linear regression may improve streamflow statistics estimates in the Owyhee Canyonlands Wilderness and may better account for uncertainty associated with limited miscellaneous streamflow measurements and zero streamflow conditions. Incorporating additional explanatory variables such as climatic parameters may improve correlation between partial-record and index sites when there are differences in basin characteristic (for example, drainage area). Other complex methods were not considered for this study given the limited dataset but may be explored as additional streamflow measurements are collected.
Summary
In 2013, the U.S. Geological Survey, in cooperation with the Bureau of Land Management (BLM), continued streamflow monitoring to improve previously developed streamflow regressions and update semimonthly and annual streamflow statistic estimates used to help sustain outstanding remarkable values for rivers designated as “wild,” “scenic,” or “recreational” in the Owyhee Canyonlands Wilderness. Previous streamflow statistics for Wild and Scenic Rivers in the Owyhee Canyonlands Wilderness were estimated using regressions developed with measurements collected during a short period with limited hydrologic variability. Updated streamflow regressions and statistics represent the best available estimates for each partial-record site using additional streamflow measurements that captured greater hydrologic variability and helped minimize overall uncertainty in this study.
Due to difficulties accessing various Wild and Scenic Rivers (WSR) segments, continuous streamflow monitoring at partial-record sites was not possible; therefore, beginning in water year 2013, 311 streamflow measurements were made to help improve streamflow regressions and statistics for 11 partial-record sites. Measurements at each partial-record site, assumed to represent daily mean streamflow conditions, were related to daily mean streamflow at a nearby index site or sites to develop a Maintenance of Variance Extension, Type 1 (MOVE.1) streamflow regression for each partial-record site. Similarly, an alternative method using a logistic regression and MOVE.1 regression was used to determine the probability of zero streamflow and estimate streamflow when zero streamflow was not predicted at partial-record sites. Daily mean streamflow at each partial-record site was estimated for the full period of record of the corresponding index site using the updated streamflow regression. Regression performance was evaluated based on the R2 between the partial-record and index sites, percent bias between measured streamflow and estimated streamflow at the partial-record site, and general proximity of the selected index site to the partial-record site. Regression performance was degraded and less robust for index sites located farther away from the corresponding partial-record site. For example, the East Fork Jarbidge River was selected as the index site for the downstream partial-record site at the Jarbidge River because the R2 was very close to 1. Conversely, the Martin Creek index site was selected for streamflow regressions in the Big Jacks Creek and Little Jacks Creek Basins; however, they performed poorly overall. Despite similar runoff and basin characteristics between Martin Creek and the Big Jacks Creek and Little Jacks Creek Basins, the poor regression performance was likely attributed to the distance between the index site and partial-record sites.
Q20, Q50, and Q80 semimonthly daily mean streamflow statistics and associated 95-percent prediction intervals were calculated using updated streamflow regressions. Temporal patterns between each semimonthly streamflow statistic at a partial-record site were consistent and dictated by streamflow patterns at each selected index site with the timing of the largest Q20 streamflow statistic generally occurring from March to June. Streamflows larger than the estimated Q20 were measured during various semimonthly periods and were useful for updating regressions and estimating daily mean streamflow during short-duration rain-on-snow runoff events that commonly occur in the Owyhee Canyonlands Wilderness.
Peak streamflow data at selected index sites were used with updated streamflow regressions to estimate the annual bankfull streamflow at partial-record sites. Although the updated streamflow regressions were developed using daily mean streamflow data, they provided the best available estimate of bankfull streamflow at most partial-record sites. The bankfull streamflow estimate at Little Jacks Creek was an exception that was computed using the peak streamflow record at the discontinued streamgage downstream of the partial-record site.
Partial-record sites with the highest streamflow statistic uncertainty include Big Jacks Creek, Cottonwood Creek, Wickahoney Creek, and Little Jacks Creek. The streamflow statistic uncertainty in the Big Jacks Creek and Little Jacks Creek Basins could be improved by establishing a new index site that is in closer proximity. Continued streamflow data collection at partial-record sites where regressions could be improved, such as Deep Creek and Battle Creek, would likely improve regression performance and streamflow statistic estimates because of a relatively short period of record at index or partial-record sites. Regression performance was further evaluated by performing a streamflow mass-balance analysis in the Bruneau River and Jarbidge River Basins. The analysis determined that regressions may not accurately estimate actual streamflow conditions during short-duration high-intensity runoff events. Moreover, it was determined the assumption that measurements at partial-record sites represent daily mean streamflow may be invalid, in turn, suggesting additional streamflow measurement at partial-record sites with large regression prediction intervals, few measurements, or poor index-site selection could improve overall regression performance.
This study provided updated annual and semimonthly streamflow statistics estimated using updated streamflow regressions for WSR segments in the Owyhee Canyonlands Wilderness. Updated streamflow statistics will help inform BLM about hydrologic characteristics in the Owyhee Canyonlands Wilderness and help sustain outstanding remarkable values for rivers designated “wild,” “scenic,” or “recreational.” The streamflow regressions developed in this study were updated using streamflow data collected since 2012 and other historical data collected before this study began. This report presented the background of the study, methods used to develop streamflow regressions that were used to update annual and semimonthly streamflow statistics, an evaluation of regression performance, and a comparison with previously published statistics for WSR segments in the Owyhee Canyonlands Wilderness.
References Cited
Bureau of Land Management, 2015, Management plan and environmental assessment—Owyhee Canyonlands wilderness areas and wild & scenic rivers: Boise, Idaho, Bureau of Land Management, Boise District, 99 p., accessed January 13, 2022, at https://eplanning.blm.gov/public_projects/nepa/12502/56781/61472/WMP_EA_04142015_FINAL.pdf.
Cohen, A.C., Jr., 1950, Estimating the mean and variance of normal populations from singly truncated and doubly truncated samples: The Annals of Mathematical Statistics, v. 21, no. 4, p. 557–569, accessed January 13, 2022, at https://doi.org/10.1214/aoms/1177729751.
Colarullo, S.J., Sullivan, S.L., and McHugh, A.R., 2018, Implementation of MOVE.1, censored MOVE.1, and piecewise MOVE.1 low-flow regressions with applications at partial-record streamgaging stations in New Jersey: U.S. Geological Survey Open-File Report 2018–1089, 20 p., accessed January 18, 2022, at https://doi.org/10.3133/ofr20181089.
De Cicco, L., Lorenz, D., Hirsch, R., Watkins, W., and Johnson, M., 2021, dataRetrieval: R packages for discovering and retrieving water data available from U.S. Federal hydrologic web services, accessed September 24, 2021, at https://doi.org/10.5066/P9X4L3GE.
Duan, N., 1983, Smearing estimate—A nonparametric retransformation method: Journal of the American Statistical Association, v. 78, no. 383, p. 605–610, accessed December 2, 2021, at https://doi.org/10.1080/01621459.1983.10478017.
Ducar, S.D., and Dudunake, T.J., 2022, Streamflow regressions and annual and semimonthly exceedance probability statistics for Wild and Scenic Rivers, Owyhee Canyonlands Wilderness, Idaho: U.S. Geological Survey data release, https://doi.org/10.5066/P9XSJA24.
England, J.F., Jr., Cohn, T.A., Faber, B.A., Stedinger, J.R., Thomas, W.O., Jr., Veilleux, A.G., Kiang, J.E., and Mason, .R.R., jJr., 2019, Guidelines for determining flood flow frequency—Bulletin 17C (ver. 1.1, May 2019): U.S. Geological Survey Techniques and Methods, book 4, chap. B5, 148 p., accessed January 13, 2022, at https://doi.org/10.3133/tm4B5.
Flynn, K.M., Kirby, W.H., and Hummel, P.R., 2006, User's manual for program PeakFQ, annual flood-frequency analysis using Bulletin 17B guidelines: U.S. Geological Survey Techniques and Methods, book 4, chap. B4, 48 p., accessed January 13, 2022, at https://doi.org/10.3133/tm4B4.
Granato, G.E., 2009, Computer programs for obtaining and analyzing daily mean streamflow data from the U.S. Geological Survey National Water Information System web site: U.S. Geological Survey Open-File Report 2008–1362, 123 p. on CD-ROM, 5 appendixes, accessed January 13, 2022, at https://doi.org/10.3133/ofr20081362.
Hald, A., 1949, Maximum likelihood estimation of the parameters of a normal distribution which is truncated at a known point: Scandinavian Actuarial Journal, v. 1949, no. 1, p. 119–134, accessed January 18, 2022, at https://doi.org/10.1080/03461238.1949.10419767.
Helsel, D.R., Hirsch, R.M., Ryberg, K.R., Archfield, S.A., and Gilroy, E.J., 2020, Statistical methods in water resources: U.S. Geological Survey Techniques and Methods, book 4, chap. A3, 484 p., accessed December 2, 2021, at https://doi.org/10.3133/tm4A3.
Hirsch, R.M., 1982, A comparison of four streamflow record extension techniques: Water Resources Research, v. 18, no. 4, p. 1081–1088, accessed September 15, 2021, at https://doi.org/10.1029/WR018i004p01081.
Hortness, J.E., 2006, Estimating low-flow frequency statistics for unregulated streams in Idaho: U.S. Geological Survey Scientific Investigations Report 2006–5035, 40 p., accessed January 13, 2022, at https://doi.org/10.3133/sir20065035.
Idaho Power Company, 2021, Idaho Power WebPortal, v. 2021, accessed December 2, 2021, at https://idastream.idahopower.com/.
Lorenz, D.L. and De Cicco, L.A., 2017, smwrStats—R functions to support statistical methods in water resources, version 0.7.6, accessed September 15, 2021, at https://github.com/USGS-R/smwrStats.
Mueller, D.S., Wagner, C.R., Rehmel, M.S., Oberg, K.A., and Rainville, F., 2013, Measuring discharge with acoustic Doppler current profilers from a moving boat (ver. 2.0, December 2013): U.S. Geological Survey Techniques and Methods, book 3, chap. A22, 95 p., accessed January 13, 2022, at https://doi.org/10.3133/tm3A22.
Oberg, K., and Mueller, D.S., 2007, Validation of streamflow measurements made with acoustic doppler current profilers: Journal of Hydraulic Engineering, v. 133, no. 12, p. 1421–1432, accessed January 13, 2022, at https://doi.org/10.1061/(ASCE)0733-9429(2007)133:12(1421).
Pierson, F.B., Slaughter, C.W., and Cram, Z.K., 2001, Long-term stream discharge and suspended-sediment database, Reynolds Creek Experimental Watershed, Idaho, United States: Water Resources Research, v. 37, no. 11, p. 2857–2861, accessed January 24, 2022, at https://doi.org/10.1029/2001WR000420.
R Core Team, 2020, R—A language and environment for statistical computing—Version 4.0.2: R Foundation for Statistical Computing web page, accessed June 22, 2020, at https://www.r-project.org/.
Rantz, S.E., 1982, Measurement and computation of streamflow: U.S. Geological Survey Water-Supply Paper 2175, accessed January 13, 2022, at https://doi.org/10.3133/wsp2175.
Ries, K.G., III, Newson, J.K., Smith, M.J., Guthrie, J.D., Steeves, P.A., Haluska, T., Kolb, K., Thompson, R.F., Santoro, R.D., and Vraga, H.W., 2017, StreamStats, version 4 2017-3046, accessed December 2, 2021, at https://streamstats.usgs.gov/ss/.
Ries, K.G., III, Steeves, P.A., Coles, J.D., Rea, A.H., and Stewart, D.W., 2004, StreamStats—A U.S. Geological Survey web application for stream information: U.S. Geological Survey Fact Sheet, 2004–3115, 4 p., accessed December 2, 2021, at https://doi.org/10.3133/fs20043115.
Turnipseed, D.P., and Sauer, V.B., 2010, Discharge measurements at gaging stations: U.S. Geological Survey Techniques and Methods, book 3, chap. A8, 87 p., accessed January 13, 2022, at https://doi.org/10.3133/tm3A8.
U.S. Geological Survey, 2022, National Water Information System: U.S. Geological Survey web interface, accessed May 2022, at https://doi.org/10.5066/F7P55KJN.
Wood, M.S., 2014, Streamflow statistics for development of water rights claims for the Jarbidge Wild and Scenic River, Owyhee Canyonlands Wilderness, Idaho, 2013–14—A supplement to Scientific Investigations Report 2013–5212: U.S. Geological Survey Scientific Investigations Report 2014–5143, 14 p., accessed December 3, 2020, at https://doi.org/10.3133/sir20145143.
Wood, M.S., and Fosness, R.L., 2013, Streamflow monitoring and statistics for development of water rights claims for Wild and Scenic Rivers, Owyhee Canyonlands Wilderness, Idaho, 2012: U.S. Geological Survey Scientific Investigations Report 2013–5212, 66 p., accessed December 3, 2020, at https://doi.org/10.3133/sir20135212.
Wood, M.S., Fosness, R.L., Skinner, K.D., and Veilleux, A.G., 2016, Estimating peak-flow frequency statistics for selected gaged and ungaged sites in naturally flowing streams and rivers in Idaho (ver. 1.1, April 2017): U.S. Geological Survey Scientific Investigations Report 2016–5083, 56 p., accessed January 13, 2022, at https://doi.org/10.3133/sir20165083.
Conversion Factors
Datums
Vertical coordinate information is referenced to the North American Vertical Datum of 1988 (NAVD 88).
Horizontal coordinate information is referenced to the North American Datum of 1983 (NAD 83).
Elevation, as used in this report, refers to distance above the vertical datum.
Abbreviations
AEP
annual exceedance probability
BCF
bias correction factor
BLM
Bureau of Land Management
IPC
Idaho Power Company
MOVE.1
Maintenance of Variance Extension, Type 1
ORV
outstanding remarkable value
R2
coefficient of determination
RMSE
root mean square error
USDA
U.S. Department of Agriculture
USGS
U.S. Geological Survey
WSR
Wild and Scenic Rivers
For more information about the research in this report, contact
Director, Idaho Water Science Center
U.S. Geological Survey
230 Collins Road
Boise, Idaho 83702-4520
https://www.usgs.gov/centers/idaho-water-science-center
Manuscript approved on September 6, 2022
Publishing support provided by the U.S. Geological Survey
Science Publishing Network, Tacoma Publishing Service Center
Suggested Citation
Dudunake, T.J., and Ducar, S.D., 2022, Updated annual and semimonthly streamflow statistics for Wild and Scenic Rivers, Owyhee Canyonlands Wilderness, southwestern Idaho, 2021: U.S. Geological Survey Scientific Investigations Report 2022–5095, 31 p., https://doi.org/10.3133/sir20225095.
ISSN: 2328-0328 (online)
Study Area
| Publication type | Report |
|---|---|
| Publication Subtype | USGS Numbered Series |
| Title | Updated annual and semimonthly streamflow statistics for Wild and Scenic Rivers, Owyhee Canyonlands Wilderness, southwestern Idaho, 2021 |
| Series title | Scientific Investigations Report |
| Series number | 2022-5095 |
| DOI | 10.3133/sir20225095 |
| Year Published | 2022 |
| Language | English |
| Publisher | U.S. Geological Survey |
| Publisher location | Reston, VA |
| Contributing office(s) | Idaho Water Science Center |
| Description | Report: viii, 31 p.; Data Release |
| Country | United States |
| State | Idaho |
| Other Geospatial | Owyhee Canyonlands Wilderness |
| Online Only (Y/N) | Y |
| Google Analytic Metrics | Metrics page |