

Technical Note—Performance Evaluation of the PhytoFind, an In-Place Phytoplankton Classification Tool
Links
- Document: Report (4.75 MB pdf) , HTML , XML
- Related Work: Techniques and Methods 1-D10 - Field Techniques for the Determination of Algal Pigment Fluorescence in Environmental Waters—Principles and Guidelines for Instrument and Sensor Selection, Operation, Quality Assurance, and Data Reporting
- Data Releases:
- USGS data release - Near-surface spatial water-quality surveys along the Caloosahatchee River, St. Lucie River and Lake Okeechobee in July and August 2019, south Florida (ver. 1.1, December 2020)
- USGS data release - Phytoplankton community composition and abundance in Lake Okeechobee and the Okeechobee Waterway, Florida, USA, July and August 2019
- USGS data release - Laboratory and field data for an evaluation of the Turner Designs PhytoFind, in situ algal classification tool
- Download citation as: RIS | Dublin Core
Abstract
In 2019, the U.S. Geological Survey evaluated the performance of the Turner Designs, Inc. PhytoFind, an in-place phytoplankton classification tool. The sensor was tested with sample blanks, monoculture and mixed phytoplankton cultures, and turbidity challenges in a laboratory, and was tested on a 120-mile survey of the Caloosahatchee and St. Lucie Rivers in Florida, including Lake Okeechobee. Results include the following:
-
The mixed phytoplankton group fluorescence channel (green excitation sensor) of the PhytoFind can be sensitive to interference.
-
The PhytoFind generally overestimated chlorophyll concentration relative to laboratory-measured chlorophyll a concentrations.
-
Turbidity interference may be less apparent in samples where green algae (chlorophytes) represent a high relative percentage of biovolume.
-
The dissolved organic matter compensation feature was effective in the environmental waters sampled during this evaluation.
-
The correlation between percent chlorophyll contribution per phytoplankton group measured by the PhytoFind and relative percent biovolume per phytoplankton group measured in the laboratory varied and was not explicitly determined to be related to dominant taxa, phytoplankton community composition, or environmental conditions.
Introduction
The U.S. Geological Survey (USGS) evaluates technology to determine the suitability of a given sensor or system for current or future use in USGS monitoring. These evaluations are performed by USGS staff using specific protocols, criteria, and quality assurance procedures. The USGS does not seek to rank or compare technologies, determine regulatory compliance, identify technologies as acceptable or not, and does not seek to determine “best available technologies” in any form. The USGS does not certify that a technology will always operate as demonstrated and makes no expressed or implied guarantee as to the performance of the technology. The end user is solely responsible for complying with any and all applicable Federal, State, and local requirements.
In summer 2019, the U.S. Geological Survey tested the performance of the Turner Designs, Inc. PhytoFind, an in-place phytoplankton classification tool, to evaluate the ability of the tool to make fluorescence-based measurements of total chlorophyll concentration (referred to as “chlorophyll concentration” in this report) and percent chlorophyll contributions from three target phytoplankton groups. The USGS maintains a network of algal fluorescence sensors as part of its national monitoring network. The data from these sensors can be used to estimate algal biomass and relative community composition, which are important for assessing spatiotemporal dynamics and developing early indicators for potentially harmful algal blooms (Foster and others, 2022). The instrument being evaluated in this report was being evaluated for use within that network. The instrument was tested in a laboratory and in the field during a moving-boat survey.
Phytoplankton suspended in the water column play a cornerstone role in aquatic ecosystems as the foundation of the food web and as primary producers that consume carbon dioxide to generate oxygen. The composition and growth of phytoplankton communities is dependent on many variables, including the availability of sunlight, carbon dioxide, and nutrients. Of these, increasing concentrations of nutrients in many rivers, lakes, and estuaries have a substantial effect on phytoplankton biomass. One possible consequence of excess nutrients is the potential for harmful algal blooms (HABs), a natural phenomenon caused by mass proliferation of phytoplankton and can have severe effects on human health, aquatic ecosystems, and the economy. Of particular interest are blooms of cyanobacteria (also called blue-green algae), which can produce a variety of toxins and taste- and odor-causing compounds, specifically in waterbodies used for drinking water supply and recreation (Graham and others, 2008). Increased concentrations of cyanobacterial toxins have caused illness and death of humans and animals throughout the United States (Graham and others, 2009; Trevino-Garrison and others, 2015).
Additional effects from HABs include degraded water quality, anoxia and fish kills, and decreased tourism and recreational use (Adams and others, 2018). With an apparent global increase in HABs during the past several decades, early detection and preventative management are increasingly important (Wang and others, 2009; O’Neil and others, 2012). One approach for the real-time detection of phytoplankton is the use of in-place fluorometers, which can measure relative changes in phytoplankton biomass based on the fluorescence of particular pigments in the phytoplankton; most commonly, chlorophyll, phycocyanin, and phycoerythrin (Zamyadi and others, 2016; Foster and others, 2022). Phytoplankton fluorometric measurement principles are not within the scope of this report and are discussed in Bertone and others (2018).
Most phytoplankton fluorometers currently [2022] available predominantly measure specific excitation and emission wavelengths to target fluorescence response from one or two phytoplankton pigments. The Turner Designs, Inc. PhytoFind is a multichannel fluorometer that uses responses from three phytoplankton pigments. Described by the manufacturer as an algal (phytoplankton) classification tool, the PhytoFind processes fluorescence data from three optical sensors with preset excitation and emission wavelength filters through deconvolution algorithms to determine estimates of chlorophyll concentration (in micrograms per liter) and the percent contribution relative to the whole phytoplankton population sampled from three groups: phycoerythrin-containing phytoplankton (such as cryptophytes and some cyanobacteria; reported by the PhytoFind as “mixed phytoplankton group”), phycocyanin-containing phytoplankton (such as cyanobacteria; reported by the PhytoFind as “cyanobacteria group”), and all other chlorophyll-containing phytoplankton (such as green algae [chlorophytes] and diatoms; reported by the PhytoFind as “green and brown phytoplankton group”; fig. 1). The novelty of this instrument is its potential to provide information on phytoplankton population dynamics in near real time. This is a valuable feature because shifts in phytoplankton communities may be an early indicator for development of algal blooms (Wang and others, 2009).
Additional features of the PhytoFind include integrated compensation for dissolved organic matter (DOM), which is known to interfere with optical measurements (Downing and others, 2012; Bertone and others, 2019), using a fourth optical sensor; optical filters for rejecting interference from suspended sediments; and a factory-installed water temperature probe and depth sensor. The PhytoFind is factory-calibrated; a solid reference standard assembly is an optional accessory that can be used for verification of sensor function.
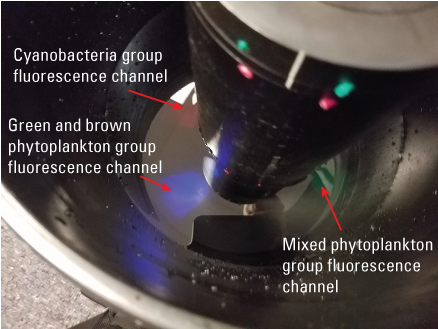
Photograph showing excitation lights from optical fluorescence sensors on the Turner Designs, Inc. PhytoFind in-place phytoplankton classification tool in water, indicated with red arrows; the blue light is a green and brown phytoplankton group fluorescence channel, the green light is a mixed phytoplankton group fluorescence channel, and the red light is a cyanobacteria group fluorescence channel; photograph by the U.S. Geological Survey.
The performance of the PhytoFind was comprehensively evaluated for fluorescence-based measurements of chlorophyll concentration and phytoplankton community composition with respect to effects from variables such as water temperature, cell morphology and aggregation, biomass, and other suspended material in the solution, all of which may affect phytoplankton fluorescence and sensor response (Choo and others, 2018). The PhytoFind was tested in laboratory and field environments. Specifications and operational information for the PhytoFind are detailed in Turner Designs, Inc. (2021); manufacturer specifications for the PhytoFind are listed in table 1.
Table 1.
Manufacturer specifications for the Turner Designs, Inc. PhytoFind.[Specifications are detailed in Turner Designs, Inc. (2021). µg/L, microgram per liter; Chl, chlorophyll; °C, degree Celsius; nm, nanometer; %, percent]
Laboratory Methods To Test PhytoFind Performance
A total of 45 tests were run in a controlled environment to assess the basic operation of the PhytoFind, including baseline stability and water temperature effects, and fluorescence response using the PhytoFind to dyes and cultures of live phytoplankton (fig. 2). All laboratory testing data are available in Reed and others (2022). For all tests of fluorescence response using the PhytoFind, a YSI EXO2 multiparameter sonde was used to collect ancillary water temperature, specific conductance, pH, dissolved oxygen, turbidity, fluorescent dissolved organic matter (fDOM), and algal fluorescence (chlorophyll and phycocyanin) data (YSI Inc., 2021a). Chlorophyll and phycocyanin concentrations were reported by the EXO Total Algae-PC sensor (based on a single excitation and emission wavelength fluorescence channel for each pigment; YSI Inc., 2021b). Data from the EXO Total Algae-PC sensor were collected during the tests as a reference from a more widely used tool for in-place monitoring of phytoplankton biomass and are not intended to be a direct comparison. A single set of sensors was used for all tests. The sensors were set up and calibrated in accordance with the manufacturers’ recommendations and to minimize the effect of ambient and reflected light (fig. 3). The sensors were thoroughly cleaned with anionic detergent, copious amounts of deionized water (DIW), soft-bristle brushes, and lint-free wipes prior to each test, with particular care taken with the optical lenses.
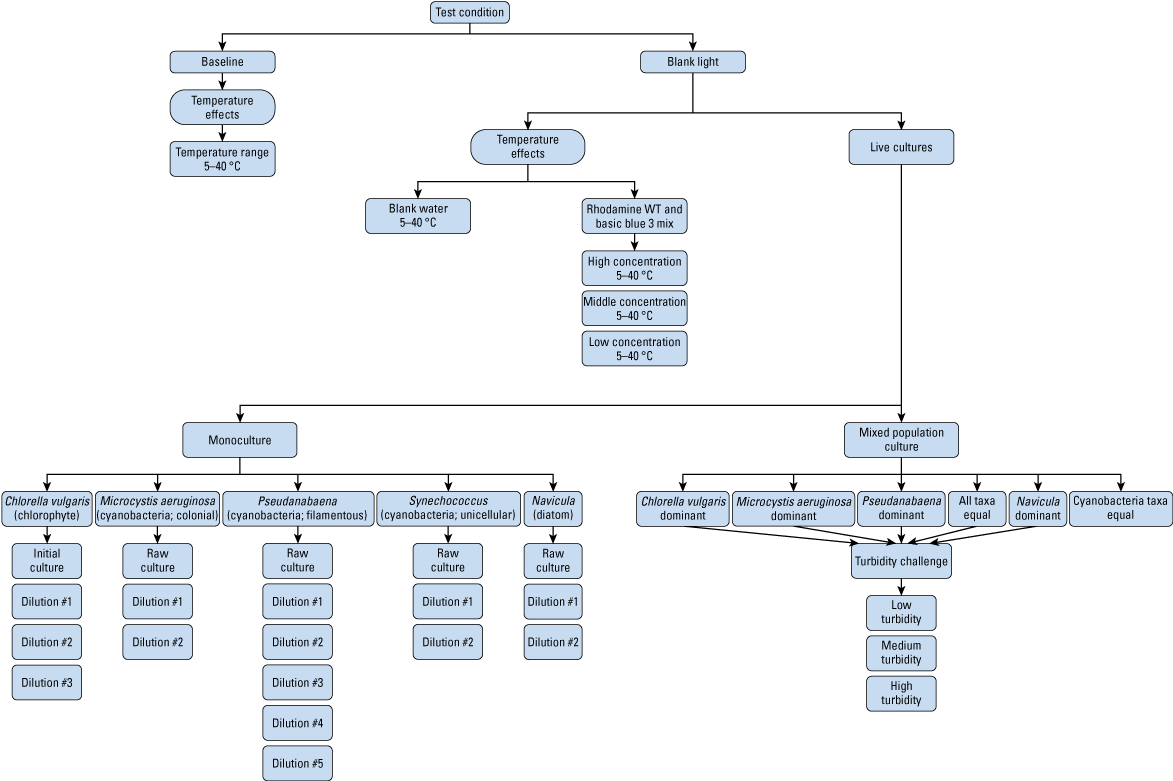
Flow chart of a laboratory test plan to assess the basic operation of a Turner Designs, Inc. PhytoFind in-place phytoplankton classification tool. Dilutions are listed in table 2. °C, degrees Celsius; WT, water tracer.
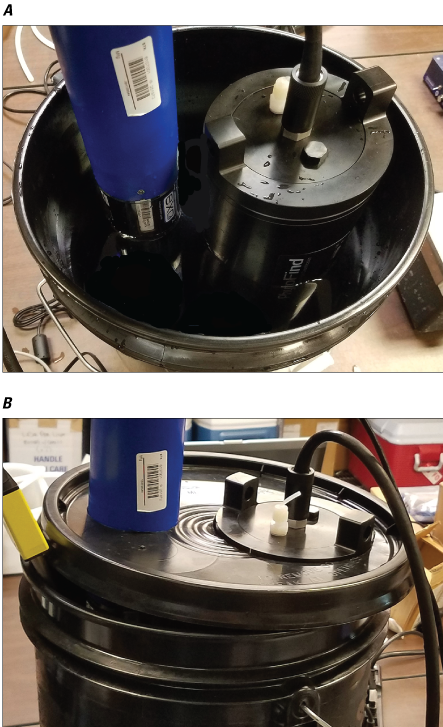
Photographs showing configuration of the Turner Designs, Inc. PhytoFind in-place phytoplankton classification tool and YSI Inc. EXO Total Algae-PC sensor mounted on a YSI, Inc. EXO2 multiparameter sonde for laboratory testing. View A, underneath the test vessel lid and B, with test vessel lid in place, as used during testing. Photographs by the U.S. Geological Survey.
Ambient Water Temperature Test Methods
Ambient temperature is important because it can affect the function and response of complex electronic sensors. For fluorometers, this effect can be internal within the electrical components of the sensor or external from the water-temperature dependent fluorescence of target constituents. To quantify these potential effects, baseline, blank signal, and dye signal tests were performed over a range of ambient water temperatures: the baseline was assessed with covered photodetectors (the absence of light) in a dark container with DIW, the blank signal was assessed with uncovered photodetectors in a dark container with inorganic blank water (that is, quality-assured water, free of inorganic analytes), and the dye signal was assessed with uncovered photodetectors in a dark container with DIW colored with dyes. Subsequent tests were done with analytical-grade laboratory DIW; additional instrument blanks indicated that the laboratory DIW was not a source of interference in this study. Live cultures were excluded from temperature tests to avoid the introduction of additional photochemical variables affecting fluorescence intensity other than water temperature.
Methods of Baseline Signal Test
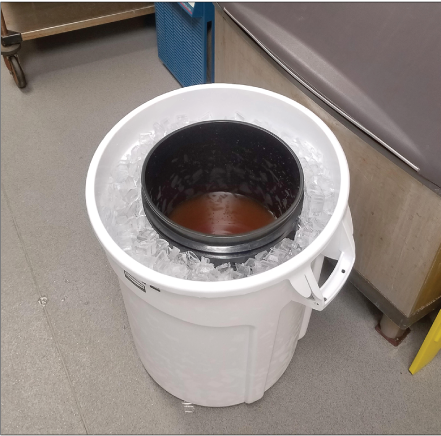
The baseline signal test measured the short-term variation of the instrument’s output when no input signal was present (that is, no light entered the photodetector; the photodetectors were covered). Variations of the output can be caused by electric fluctuations, changes in temperature, and other factors such as internal moisture. A temporally stable baseline is a crucial requisite for sensitive electronic instrumentation. To assess the effect of ambient water temperature on the stability of the dark signal baseline readings of chlorophyll concentrations from the PhytoFind, black tape was first placed over the photodetector lenses of the sensors to prevent detection of any light in the photodetector (fig. 4). The instrument was then submerged in DIW within the test vessel and gradually cooled to about 5 degrees Celsius (°C) by submersing the test vessel in a mixture of ice and rock salt. This method of cooling was used instead of a standard laboratory water bath because of the size of the instrument.
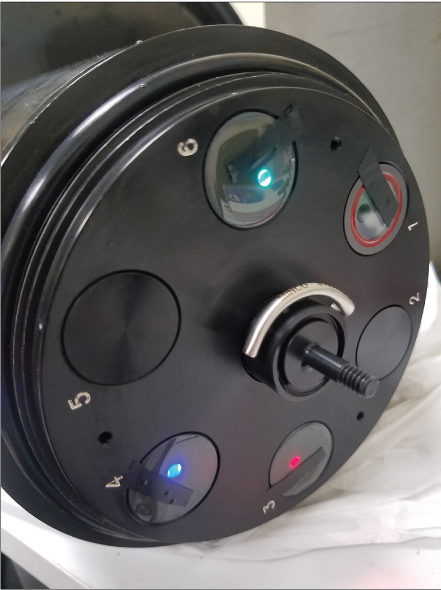
Photograph showing small strips of black electrical tape covering the photodetectors of the Turner Designs, Inc. PhytoFind in-place phytoplankton classification tool to prevent the detection of any light during the baseline signal test; photograph by the U.S. Geological Survey.
Data collection was initiated and maintained for 45 minutes while the water was heated gradually with an immersion heater to about 40 °C. During heating, the water temperature was stabilized briefly at 5 °C intervals. Water temperature was measured by the factory-installed water temperature probe of the PhytoFind. Prior to instrument testing, the factory-installed water temperature probe was verified by a National Institute of Standards and Technology (NIST)-traceable thermistor with a five-point check between 12 and 40 °C that showed the probe was accurate to within 0.2 °C.
Methods of Blank Signal Test
Instrument stability must also be evaluated in conditions with a null incident light intensity (that is, a zero-point check). To assess the effect of ambient water temperature on the chlorophyll concentrations from the PhytoFind, in the absence of fluoresced light with uncovered excitation lights and photodetectors, the instrument was submerged in inorganic blank water within the test vessel and gradually cooled to about 5 °C, as described for the baseline signal test. Data collection was initiated and maintained for 38 minutes while the water was heated gradually with an immersion heater to about 40 °C, allowing the water temperature to stabilize briefly at each 5 °C interval. Water temperature was measured by the factory-installed, NIST-verified water temperature probe on the PhytoFind.
Methods of Dye Signal Test
Water-temperature-induced changes in the fluorescence intensity of phytoplankton pigments may not be equivalent to changes in phytoplankton biomass (Hambrook Berkman and Canova, 2007). For this reason, corrections may be necessary and can be computed to compensate for this phenomenon when making optical fluorescence measurements (Downing and others, 2012). To assess the effect of water temperature on instrument-measured chlorophyll concentration, the test used DIW-diluted solutions of rhodamine water tracer (RWT) and basic blue 3 (BB3) dyes, based on the manufacturer’s recommendation. Both dyes trigger the green and brown phytoplankton group fluorescence channel (blue excitation); RWT also triggers the mixed group fluorescence channel (green excitation), and BB3 triggers the cyanobacteria group fluorescence channel (red excitation). Similar to phytoplankton pigment fluorescence, dyes exhibit water-temperature-induced changes in the fluorescence intensity, decreasing fluorescence with increasing water temperature (Foster and others, 2022). Target concentrations of dye were calculated, and dilutions were made using volumetric flasks. Light wavelength absorbances for the dye solutions were then measured on a Hach DR6000 benchtop spectrophotometer (Hach, 2020) for an independent verification of the dilution rates. The RWT was read at 556 nanometers (nm), and the BB3, at 654 nm; these wavelengths correlated with the peak absorbance of each dye.
Initially, the PhytoFind was submerged in a solution of RWT with a measured absorbance of 0.129 absorbance unit (AU) at 556 nm. However, this resulted in a saturated measurement of the chlorophyll concentration equal to about 1,360 micrograms per liter (µg/L). Saturation means that there is no additional photocurrent output from the photodetector as the incident light increases (that is, the reading is at its maximum). Dilutions of RWT were made down to an absorbance of 0.003 AU at 556 nm, but these all resulted in saturated measurements, far above the chlorophyll concentration range maximum of 250 µg/L. Next, the PhytoFind was submerged in a solution of BB3, with a measured absorbance of 0.009 AU at 654 nm, which yielded a chlorophyll concentration of about 196 µg/L.
Because the PhytoFind uses multiple fluorescence signals in its calculation algorithms, a mixture of the dye solutions was used in testing. The initial mixture of RWT and BB3 (fig. 5) was diluted down to absorbances of 0.001 AU at 556 nm and 0.002 AU at 654 nm and used as the “high” concentration. The test was repeated for two additional dilutions, designated as the “middle” and “low” concentrations, to absorbances of 0.001 AU at 556 nm for RWT and 654 nm for BB3 for the middle concentration, and less than 0.001 AU at 556 nm for RWT and 654 nm for BB3 for the low concentration.
Photograph showing a solution of rhodamine water tracer and basic blue 3 dyes, chilling in the test vessel by submersion in ice and rock salt; photograph by the U.S. Geological Survey.
Data were recorded for each of the concentrations at water temperatures between 5 and 40 °C, allowing the temperature to stabilize briefly at each 5 °C interval. Water temperature was measured by the factory-installed, NIST-verified water temperature probe on the PhytoFind. The tests were run for an average of about 45 minutes, with the samples mechanically mixed using a magnetic stir plate to homogenize the sample volume used for the sensors.
Cultured Phytoplankton Test Methods
Laboratory tests were run using monoculture and mixed-population cultures of known freshwater phytoplankton species. Three cyanobacteria (Pseudanabaena, Microcystis aeruginosa, and Synechococcus) were cultured by the USGS (fig. 6), and a diatom (Navicula) and a chlorophyte (Chlorella vulgaris) were cultured by Algae Research Supply (Algae Research Supply, 2021). These taxa were chosen because they have the fluorescence characteristics of the target groups measured by the PhytoFind and are relatively common in freshwater systems. Because cyanobacteria are a particular group of concern, three species were selected to represent the group based on unique traits that affect the fluorescence characteristics of cyanobacteria. Pseudanabaena was chosen because of its filamentous morphology, as well as its phycoerythrin content; Microcystis aeruginosa, for its phycocyanin content and colonial growth form; and Synechococcus, for its phycocyanin content and unicellular growth form. Pigment content of Chlorella vulgaris and Navicula is primarily chlorophyll a, without the presence of either phycoerythrin or phycocyanin.
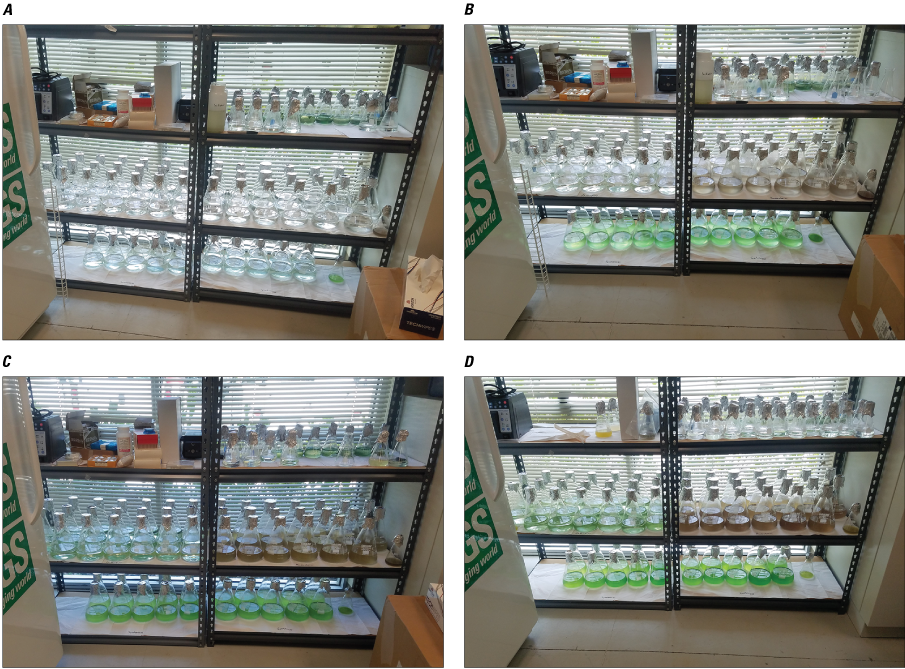
Photographs showing cultures of three cyanobacteria species incubating at a U.S. Geological Survey laboratory on A, day 0, B, day 11, C, day 30, and D, day 45; photograph by the U.S. Geological Survey.
Outside the test vessel, all live cultures were stored at room temperature and at ambient light conditions with a photosynthetic photon flux density (a measure of received light) ranging from 7.23 to 7.83 micromoles per square meter per second, measured by a LI–COR, Inc. LI–193 spherical quantum sensor (LI–COR, Inc., 2021). These conditions were selected to minimize variations in the photochemical processes of the phytoplankton cells. Samples inside the test vessel were kept at room temperature, covered from ambient light, and mechanically mixed using a magnetic stir plate (fig. 7). These conditions were selected to maintain the phytoplankton cells, minimize interference from ambient light on fluorescence measurements, and homogenize the sample volume used in testing.
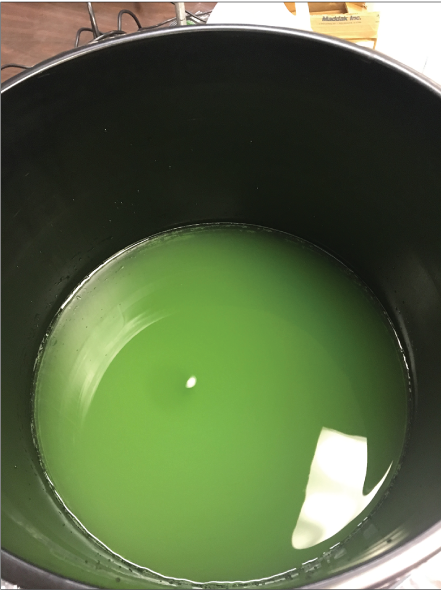
Photograph showing the Synechococcus culture mechanically mixing in the test vessel. The test vessel sits atop the magnetic stir plate (not pictured). Photograph by the U.S. Geological Survey.
After a brief equilibration period (about 1 minute), sensor data were collected for about 5 minutes—except for the first run of Pseudanabaena, which was about 10 minutes—for each of the test conditions. The mean chlorophyll concentration and percent chlorophyll contributions per phytoplankton group were compared with discrete comparison samples collected immediately thereafter; the comparison samples were analyzed for laboratory-measured chlorophyll a concentration and phytoplankton identification and enumeration. Duplicate samples for chlorophyll a concentration analysis were collected in accordance with USGS protocols as described in Hambrook Berkman and Canova (2007) and analyzed at the USGS National Water Quality Laboratory in Denver, Colorado, in accordance with Arar and Collins (1997). Concentration of chlorophyll a, as opposed to chlorophylls b, c, d and e, is commonly used as a proxy for total chlorophyll concentration in fluorescence monitoring because it is present in all phytoplankton. As such, the total chlorophyll concentration may be greater than that of chlorophyll a.
Phytoplankton samples were collected in a 250-milliliter, amber, high-density polyethylene bottle, preserved with 25 percent glutaraldehyde, and shipped to PhycoTech, Inc. for analysis by imaging flow cytometry (IFC). IFC uses a combination of flow cytometry and video technology to capture high-resolution images of suspended particles; laser-induced fluorescence and light scattering from individual particles are measured and used to trigger targeted image acquisition. High-resolution images (about 3.4 pixels per micrometer) of suspended particles ranging from less than 8 to 150 micrometers (µm) are generated. These images are initially identified and counted using an automated classifier; the resulting data are used to provide estimates of phytoplankton concentration and biovolume (the volume of cells in a unit amount of water). Results are verified by an algal taxonomist.
Between 1,000 and 2,000 images per milliliter of sample were collected and classified. Images classified as “miscellaneous” or “unclassified” by IFC are denoted as “other” in the results of this report. A taxon classification of “miscellaneous” was defined as “all other groups, generally neutral. Includes small chlorophytes or cyanobacteria less than 9 µm in diameter”; and “unclassified,” as “images that the classifier cannot confidently identify. The “unclassified” group included small flagellates entrained in detritus, taxa not yet included in the classifier, partial images, and images with multiple taxa.” Although not specifically allocable to the target groups, fluorescence may be emitted by organisms within the “other” group. Thus, as relative biovolume of the “other” group increases, so does uncertainty in the characterization of sensor responses in those test conditions. In total, 25 discrete samples were collected and used for comparison analyses.
Phytoplankton Monoculture Dilution Series Test Methods
Dilution series for each of the monocultures were achieved by removing part of a sample from the test vessel and replacing it with ShopRite bottled spring water to achieve the targeted lower concentration (table 2). Spring water is a commonly used diluent for algal media, especially in short-term culturing, because of its content of minerals and salts and generally sterile condition. Optical properties (such as fluorescence, absorption, attenuation) of the culture media and spring water are considered minimal for these live phytoplankton tests. These dilution volumes were guided by the measured chlorophyll concentrations from the PhytoFind and the EXO Total Algae-PC sensor; the chlorophyll concentrations were used to estimate the relative concentration of the initial culture sample and thus subsequent dilutions. For example, if the initial culture was diluted five times, it would yield a total of six samples. As a result of this method, between three and six concentrations were run for each species to achieve a range of chlorophyll concentration within the 0 to 250 µg/L range specified by the manufacturer of the PhytoFind. The results are represented as ratios of the instrument-measured chlorophyll concentration estimations to the laboratory-measured chlorophyll a concentrations (chlorophyll-to-chlorophyll a concentration ratio), allowing for comparisons over the range of concentrations and between sensors to be normalized.
Table 2.
Summary of phytoplankton monoculture dilution series for evaluating the performance of the Turner Designs, Inc. PhytoFind in-place phytoplankton classification tool.[Data are from Reed and others (2022). L, liter; µg/L; microgram per liter; %, percent]
Mixed-Population Culture Test Methods
Formulations for mixed-population tests (table 3) were guided by chlorophyll concentration readings of the initial culture samples as described in the “Monocultures” part of this section. The computed volumes of monoculture samples and spring water were added to the test vessel to achieve six unique mixed conditions within the 0 to 250 µg/L range specified for chlorophyll concentration by the manufacturer of the PhytoFind. The mixed-population conditions (table 3) were Chlorella vulgaris, Microcystis aeruginosa, and Navicula in about equal concentrations (CVL–MIC–NAV #1); Chlorella vulgaris dominant in the presence of Microcystis aeruginosa and Navicula (CVL-MIC-NAV #2); Microcystis aeruginosa dominant in the presence of Chlorella vulgaris and Navicula (MIC–CVL–NAV); Navicula dominant in the presence of Chlorella vulgaris and Microcystis aeruginosa (NAV–CVL–MIC); Pseudanabaena dominant in the presence of Chlorella vulgaris, Microcystis aeruginosa and Navicula (PAB–CVL–MIC–NAV); and Microcystis aeruginosa, Pseudanabaena, and Synechococcus in about equal concentrations (MIC–PAB–SYN).
Table 3.
Species composition of mixed-population phytoplankton cultures for evaluating the performance of the Turner Design, Inc. PhytoFind in-place phytoplankton classification tool.[Data are from Reed and others (2022). CVL, Chlorella vulgaris; MIC, Microcystis aeruginosa; NAV, Navicula; PAB, Pseudanabaena; SYN, Synechococcus; X, species present; —, species not present]
Turbid Mixed-Population Culture Test Methods
To assess the effects of suspended particles on the optical sensors, multipoint add-in turbidity was tested for five of the six mixed-population conditions; CVL–MIC–NAV #1, CVL–MIC–NAV #2, MIC–CVL–NAV, NAV–CVL–MIC, PAB–CVL–MIC–NAV. Elliott silt loam soil (U.S. Department of Agriculture, 2015) obtained from the International Humic Substances Society (https://humic-substances.org/) was added incrementally to each mixed-population sample, using continuously measured turbidity sensor data from the EXO2 multiparameter sonde as a guide to achieve a desired range of 0 to 1,000 nephelometric turbidity units (NTU; fig. 8). Samples for turbidity were collected before the first soil addition and then at three to five additional points of increasing turbidity through the test duration.
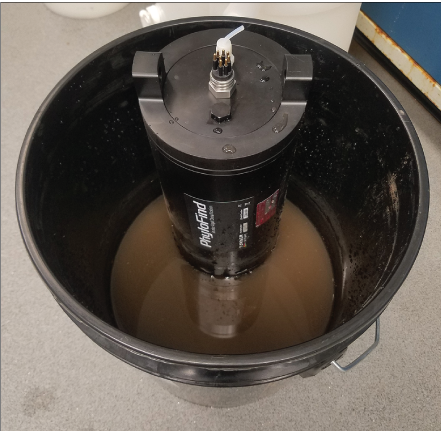
Photograph showing a Turner Designs, Inc. PhytoFind in-place phytoplankton classification tool in the test vessel in a solution of soil and a mixed-population phytoplankton culture for turbidity testing; photograph by the U.S. Geological Survey.
The turbidity test samples were analyzed on a calibrated Hach 2100AN laboratory turbidimeter (Hach, 2015) to verify the sensor readings. Select samples were used to define a rating equation to correct the EXO turbidity sensor readings (measured in formazin nephelometric units) based on comparison values obtained by the turbidimeter (measured in nephelometric turbidity units). The selected samples were from the test condition with Chlorella vulgaris, Microcystis aeruginosa, and Navicula in about equal concentrations (CVL–MIC–NAV #1). Samples from this condition were assumed to be the best representation of the mean response from the EXO turbidity sensor based on variations in light scattering or attenuation by differences in cell morphology. Turbidity sensor measurements are detailed in Foster and others (2021). The rating equation was derived by a regression analysis between the turbidimeter values and those made by the EXO turbidity sensor at the time of sample collection. The equation defining the relation is:
where NTU is turbidity in nephelometric turbidity units and FNU is turbidity in formazin nephelometric units. The coefficient of determination (R2) for this relation is 1, and the number of samples is 4. Samples from the other turbid mixed-population culture test conditions were used to validate the equation. The correction was done to facilitate a high-definition comparison between additive turbidity levels and the corresponding changes in the continuous measurements from the PhytoFind.Field Methods To Test PhytoFind Performance
A continuous run of about 120 miles was surveyed for water quality (U.S. Geological Survey, 2016; Booth and Knight, 2019a; Mazzei and others, 2022; Reed and others, 2022) from a moving boat on July 15–18, 2019, between the Gulf of Mexico and the Atlantic Ocean through the Caloosahatchee and St. Lucie Rivers connected by Lake Okeechobee in southern Florida (fig. 9; table 4). Throughout the survey, the PhytoFind was exposed to freshwater and estuarine environments, measuring chlorophyll concentration and percent chlorophyll contributions from three target phytoplankton groups. The instrument was mounted vertically (sensors upward), with the flow cap attached, and connected inline to an unfiltered flowthrough system powered by a Pentair Shurflo Pro Blaster II washdown pump model 4901 (Pentair, 2021); the intake was midship. A YSI EXO2 multiparameter sonde with a flowthrough chamber collected ancillary water temperature, specific conductance, pH, dissolved oxygen, turbidity, fluorescent dissolved organic matter, and algal fluorescence (chlorophyll and phycocyanin) data (fig. 10; Booth and Knight, 2019a).
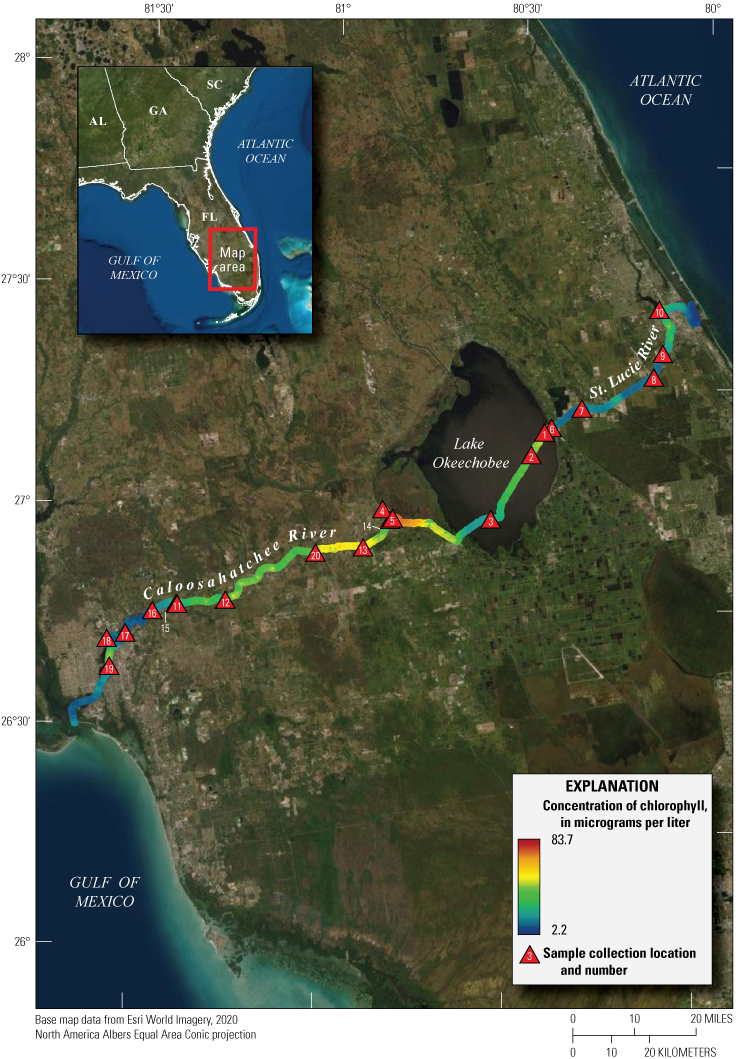
Map of continuous chlorophyll concentrations collected by using a Turner Designs, Inc. PhytoFind in-place phytoplankton classification tool in southern Florida during a moving-boat survey from July 15–18, 2019. The survey is detailed in U.S. Geological Survey (2016), Booth and Knight (2019a), Mazzei and others (2022), and Reed and others (2022). Sample locations are listed in table 4.
Table 4.
Water sample locations and corresponding U.S. Geological Survey station name and number.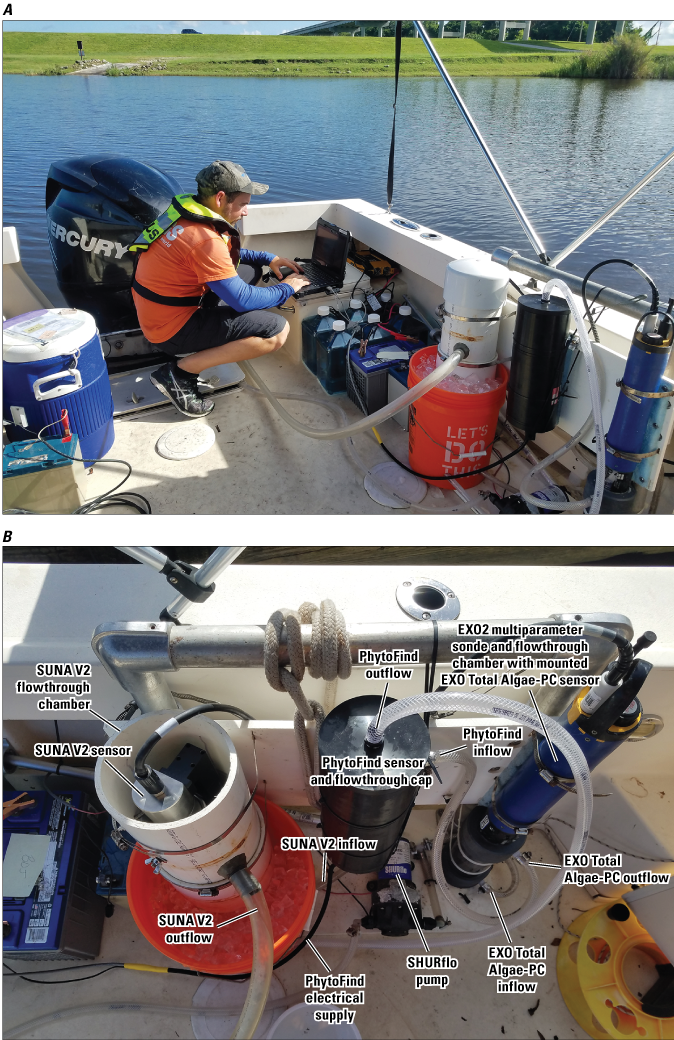
Photographs showing a Turner Designs, Inc. PhytoFind in-place phytoplankton classification tool, a YSI Inc. EXO Total Algae-PC sensor mounted on a EXO2 multiparameter sonde, and a Sea-Bird Scientific SUNA V2 nitrate sensor connected into a flowthrough system during a moving-boat survey from July 15–18, 2019, in southern Florida: A, stern-facing view of the onboard flowthrough system; and B, close view of the flowthrough system; photographs by the U.S. Geological Survey.
Chlorophyll and phycocyanin concentrations were reported by the EXO Total Algae-PC sensor (based on a single excitation and emission wavelength fluorescence channel for each pigment; YSI Inc., 2021b). Data from the EXO Total Algae-PC sensor were collected during the tests as a reference from a more widely used tool for in-place monitoring of phytoplankton biomass, and not intended to be a direct comparison. A single set of sensors was used for the entire survey; they were setup and calibrated in accordance with the manufacturers’ recommendations. The sensors were thoroughly cleaned with copious amounts of DIW, soft-bristle brushes, and lint-free wipes prior to use each day, with particular care taken with the optical lenses.
For comparison analyses, 20 discrete water samples were collected at predetermined intervals along the route (table 4; U.S. Geological Survey, 2016; Mazzei and others, 2022). Laboratory analysis of the samples was compared against measurements collected by the PhytoFind in the field. The discrete water samples for chlorophyll a concentration and phytoplankton analyses were collected and processed as described for the cultured phytoplankton tests, with one exception: live, rather than preserved, phytoplankton samples were sent for IFC analyses. All discrete samples were collected at freshwater locations, except one sample that was collected at a brackish site.
Dissolved Organic Matter Field Test Methods
On the basis of data previously collected along the same survey route (Booth and Knight, 2019b), DOM concentrations were expected to span from low to high concentrations. High concentrations were expected in the riverine and lake parts of the survey, lessening into the estuaries, and diminishing to low or no concentrations approaching the coast. fDOM sensor readings ranged from about 25 to 450 quinine sulfate equivalents (QSE; Booth and Knight, 2019a). To assess the performance of the DOM compensation feature integrated into the PhytoFind, a filtered environmental sample was collected before the start of data collection in each of the three waterbodies to measure the individual characteristics of each waterbody. These samples (referred to as “DOM blanks” by the manufacturer; Turner Designs, Inc., 2021) were measured by the PhytoFind to determine a DOM correction in accordance with instructions provided by the manufacturer. The DOM compensation feature was enabled for the duration of data acquisition each day.
Results of Laboratory Testing
When evaluating the instrument in the various laboratory tests, it is important to consider that the reported chlorophyll concentration and percent chlorophyll contributions per phytoplankton group from the PhytoFind are estimates and not associated with a specified accuracy by the manufacturer. The results from the instrument were assumed to have relative correlation with the discrete sample analyses.
Results of Temperature Effects
Baseline Signal Test Results
Between about 5 and 40 °C, baseline signal readings of chlorophyll concentration from the PhytoFind with tape-blocked photodetectors in a dark container ranged from 0.05 to 0.18 µg/L chlorophyll, with a mean of 0.11 µg/L chlorophyll and a standard deviation of 0.02 µg/L chlorophyll. The maximum, minimum, and mean readings were all well below the manufacturer-specified minimum detection limit (MDL) of 0.5 µg/L chlorophyll, indicating no apparent temperature-related effects on the baseline signal for the PhytoFind with no light input (fig. 11).
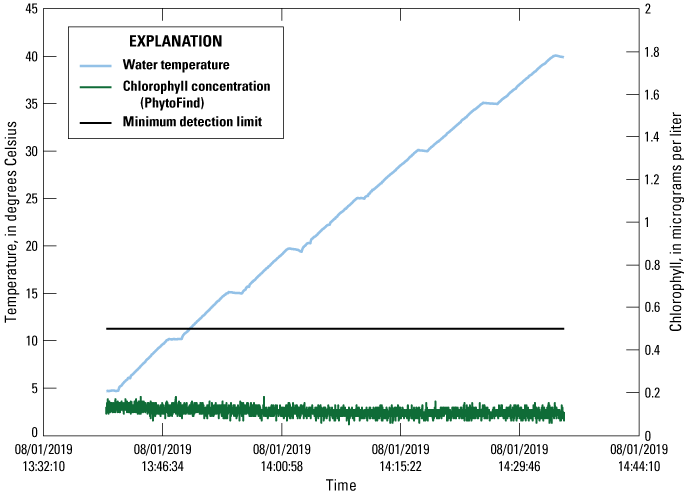
Graph of baseline signal (that is, no light entering the photodetector) readings of chlorophyll concentration measured by a Turner Designs, Inc. PhytoFind in-place phytoplankton classification tool recorded over a range of water temperatures. Data are from Reed and others (2022). MDL, minimum detection limit; °C, degree Celsius; µg/L, microgram per liter.
Blank Signal Test Results
Between about 5 and 40 °C, the PhytoFind with uncovered photodetectors in a dark container measured between 0.06 to 1.52 µg/L chlorophyll, with a mean of 0.35 µg/L and a standard deviation of 0.24 µg/L (table 5). The minimum and mean readings were well below the manufacturer-specified MDL of 0.5 µg/L chlorophyll; however, the maximum and many other readings throughout the test were in exceedance of the MDL (fig. 12). The standard deviation of readings increased substantially, by an order of magnitude, between the baseline and blank signals (table 5). The greatest fluctuations in chlorophyll concentrations were associated with the mixed phytoplankton group (standard deviation of 0.29 µg/L chlorophyll concentration). Fluctuations in the green and brown phytoplankton group (standard deviation of 0.10 µg/L chlorophyll concentration) and cyanobacteria group (standard deviation of 0.02 µg/L chlorophyll concentration) were less than the fluctuations of the mixed phytoplankton group, indicating that the mixed phytoplankton group fluorescence channel is potentially sensitive, which may have implications in anomalous data reported by the instrument.
Table 5.
Statistical summary of baseline signal and blank signal readings of chlorophyll concentration measured by a Turner Designs, Inc. PhytoFind in-place phytoplankton classification tool.[The baseline signal was assessed by the absence of light into the photodetector, and the blank signal from inorganic blank water. Data are from Reed and others (2022). µg/L, microgram per liter; °C, degree Celsius]
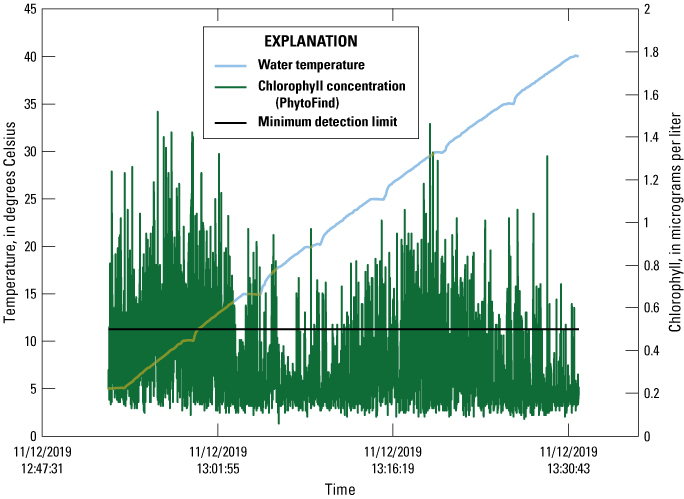
Graph of blank signal readings of chlorophyll concentration measured by a Turner Designs, Inc. PhytoFind in-place phytoplankton classification tool recorded over a range of temperatures. Data are from Reed and others (2022). MDL, minimum detection limit; °C, degree Celsius; µg/L, microgram per liter.
Dye Signal Test Results
Chlorophyll concentration reported by the PhytoFind were inversely proportional to increasing solution temperature between about 5 and 40 °C; decreasing linearly between about 50 and 60 percent for the high, middle, and low dye-concentration test conditions (fig. 13). Chlorophyll concentration reported by the EXO Total Algae-PC exhibited an inversely proportional relation to increasing solution temperatures from about 5 to 20 °C but a proportional relation from about 20 to 40 °C. Chlorophyll concentration decreased by about 20 to 40 percent from about 5 to 20 °C, with the greatest decreases being those for the high dye concentration test condition, and the least, for the low dye concentration test condition. Concentration increases of about 25 to 100 percent were observed from about 20 to 40 °C, with the greatest being for the low dye concentration test condition, and least, for the high dye concentration test condition.
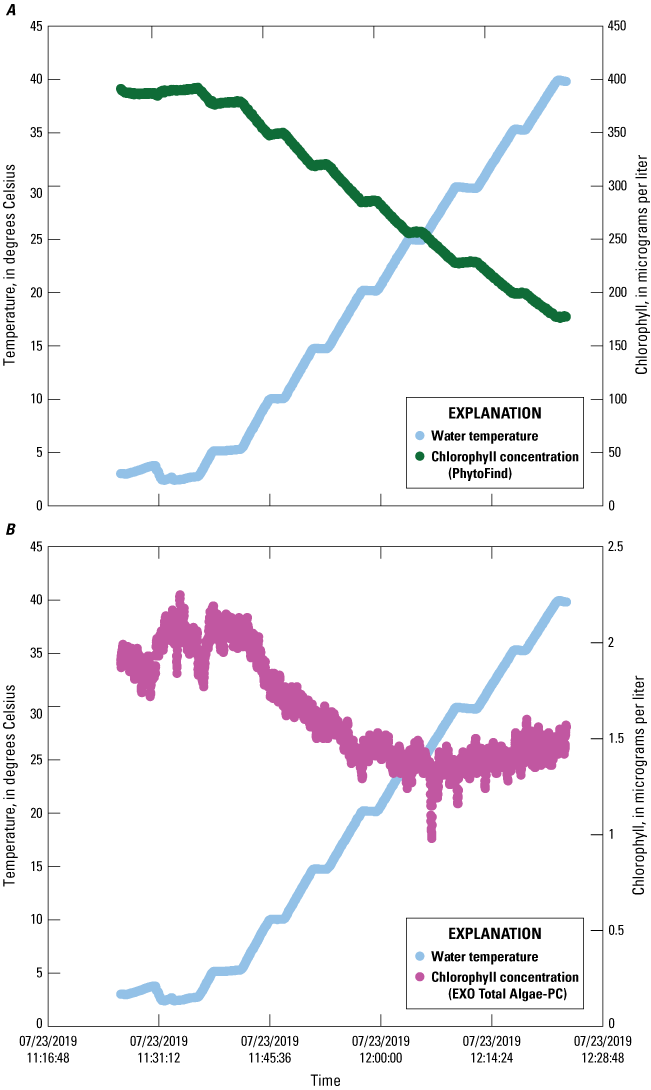
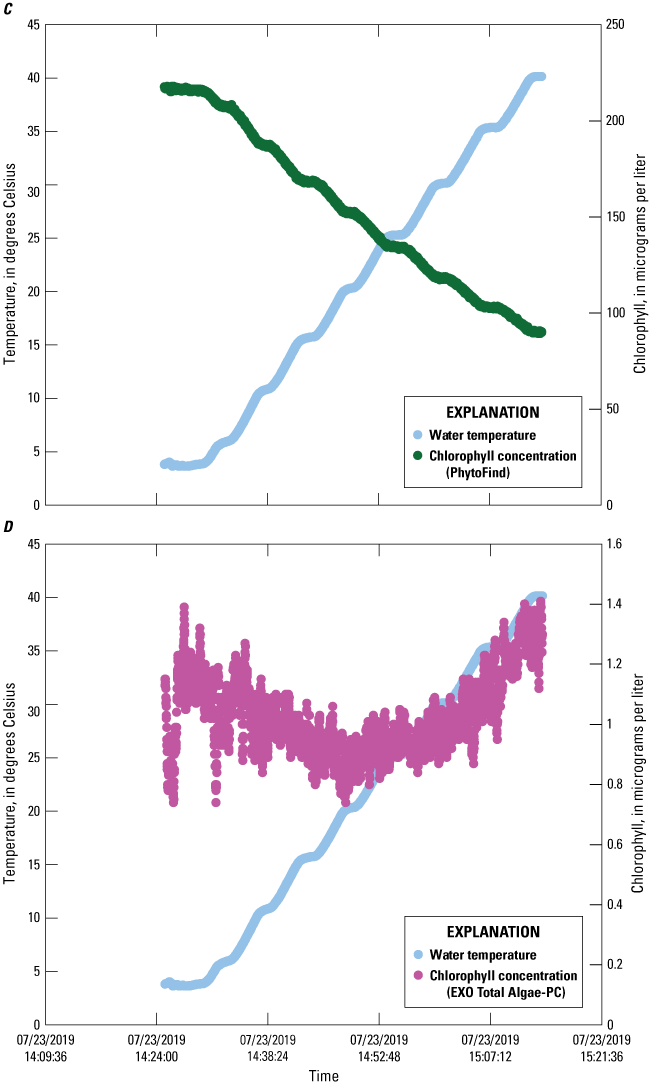
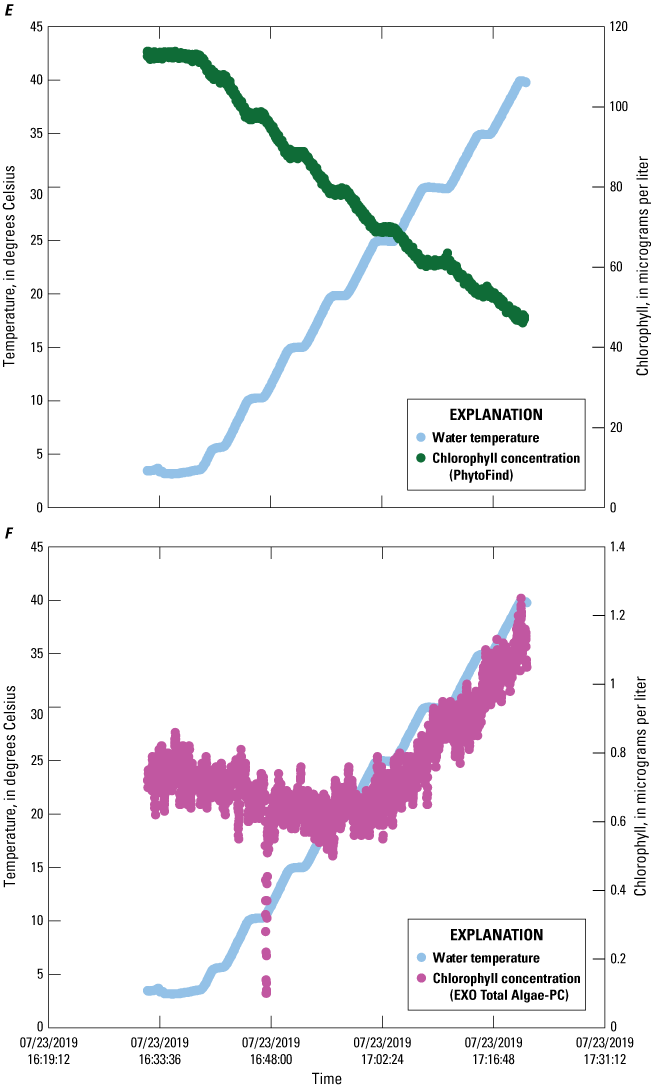
Graphs showing chlorophyll concentrations measured by a PhytoFind in-place phytoplankton classification tool and an EXO Total Algae-PC sensor in three concentrations of rhodamine water tracer and basic blue 3 dyes over a range of temperatures. Data are from Reed and others (2022). A, PhytoFind with high dye concentration; B, EXO Total Algae-PC with high dye concentration; C, PhytoFind with medium dye concentration; D, EXO Total Algae-PC with medium dye concentration; E, PhytoFind with low dye concentration; and F, EXO Total Algae-PC with low dye concentration.
Water temperature corrections are not factored into the algorithms of most field fluorometers (Foster and others, 2022). Observations from this study indicate the need for appropriate corrections to ameliorate the influence of water temperature on instrument-reported chlorophyll concentrations, which may not be linear or universal for all sensor types, as indicated by these test results. If the user’s data require a water-temperature correction, it would have to be computed and applied externally.
Results of Monoculture Dilution Series
Chlorella vulgaris Dilution Results
In a four-point dilution series of Chlorella vulgaris (table 2), the PhytoFind overestimated chlorophyll concentration relative to laboratory-measured chlorophyll a concentration within the operating range and underestimated chlorophyll concentration above the operating range of 0 to 250 µg/L chlorophyll. Chlorophyll concentration was overestimated by 350 percent at 19.9 µg/L chlorophyll a and about 75 percent at 119 µg/L chlorophyll a. When the operating range was exceeded, the PhytoFind underestimated chlorophyll concentration by about 50 percent at 452 µg/L chlorophyll a and about 80 percent at 1,210 µg/L chlorophyll a. Overall, the chlorophyll-to-chlorophyll a concentration ratio for the PhytoFind decreased exponentially with increasing chlorophyll a concentration. Reported contribution percentages from the green and brown phytoplankton group decreased from 87 to 0 percent with increasing chlorophyll a concentrations (fig. 14).
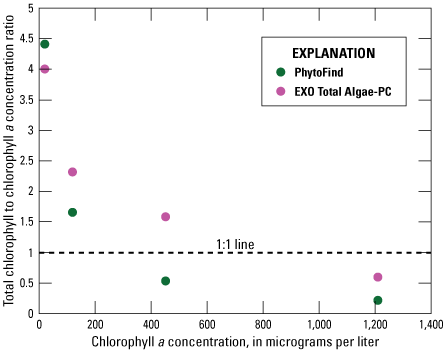
Graph showing instrument-measured total chlorophyll-to-laboratory-measured chlorophyll a concentration ratios related to the chlorophyll a concentration measurement of a monoculture dilution series of Chlorella vulgaris for the Turner Designs, Inc. PhytoFind in-place phytoplankton classification tool and YSI Inc. EXO Total Algae-PC sensor. Data are from Reed and others (2022). Dilution volumes are listed in table 2.
In the same four-point dilution series of Chlorella vulgaris, the EXO Total Algae-PC overestimated chlorophyll concentration relative to chlorophyll a concentration within its operating range, overestimated chlorophyll concentration just above the operating range, and underestimated chlorophyll concentration well above the operating range of 0 to 400 µg/L chlorophyll. Chlorophyll concentration was overestimated by about 300 percent at 19.9 µg/L chlorophyll a and about 150 percent at 119 µg/L chlorophyll a. When the operating range of 0 to 400 µg/L chlorophyll was exceeded, the EXO Total Algae-PC overestimated chlorophyll concentration relative to chlorophyll a by 58 percent at a concentration of 452 µg/L chlorophyll a and underestimated chlorophyll concentration by about 40 percent at 1,210 µg/L chlorophyll a. Overall, the chlorophyll-to-chlorophyll a concentration ratio for the EXO Total Algae-PC declined exponentially with increasing chlorophyll a concentrations (fig. 14).
Navicula Dilution Results
Phytoplankton analysis indicated that about 75 percent of the Navicula cells present were compromised; however, because of the potential for a sample with dead or damaged cells, the results of the tests are discussed in this section. In a three-point dilution series of Navicula (table 2), the PhytoFind underestimated chlorophyll concentration relative to laboratory-measured chlorophyll a concentration within and above the operating range of 0 to 250 µg/L chlorophyll. The PhytoFind underestimated chlorophyll concentration by about 50 percent at 68.2, 108, and 270 µg/L chlorophyll a. Overall, the chlorophyll to chlorophyll a concentration ratio for the PhytoFind did not change with increasing chlorophyll a concentration. Reported contribution percentages from all three phytoplankton groups were consistently about 30 percent, even when chlorophyll a concentration increased (fig. 15).
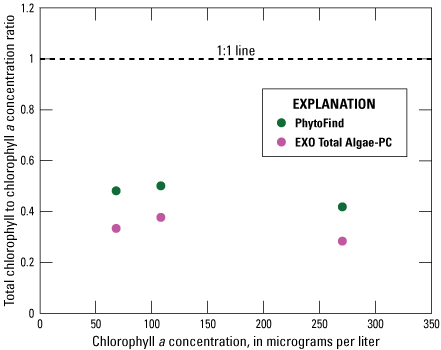
Graph showing instrument-measured total chlorophyll-to-laboratory-measured chlorophyll a concentration ratios related to the chlorophyll a concentration measurement of a monoculture dilution series of Navicula for the Turner Designs, Inc. PhytoFind in-place phytoplankton classification tool and YSI Inc. EXO Total Algae-PC sensor. Data are from Reed and others (2022). Dilution volumes are listed in table 2.
In the same three-point dilution series of Navicula, the EXO Total Algae-PC underestimated chlorophyll concentration within the operating range of 0 to 400 µg/L chlorophyll. The operating range of the EXO Total Algae-PC was not exceeded. The EXO Total Algae-PC underestimated chlorophyll concentration by about 70 percent at 68.2, 108, and 270 µg/L chlorophyll a. Overall, the chlorophyll to chlorophyll a concentration ratio for the EXO Total Algae-PC did not change with increasing chlorophyll a concentration (fig. 15).
Microcystis aeruginosa Dilution Results
In a three-point dilution series of Microcystis aeruginosa (table 2), the PhytoFind overestimated chlorophyll concentration relative to laboratory-measured chlorophyll a concentration at a lower chlorophyll a concentration within the operating range of 0 to 250 µg/L chlorophyll, measured accurately at a higher chlorophyll a concentration within the operating range, and underestimated the chlorophyll concentration above the operating range. Chlorophyll concentration was overestimated by about 50 percent at 66.8 µg/L chlorophyll a, measured within 1 percent at 231 µg/L, and underestimated by about 30 percent at 354 µg/L chlorophyll a. Overall, the chlorophyll to chlorophyll a concentration ratio for the PhytoFind decreased proportionally when chlorophyll a concentration increased. Reported contribution percentages from the cyanobacteria group decreased from 85 to 71 percent when chlorophyll a concentration increased (fig. 16).
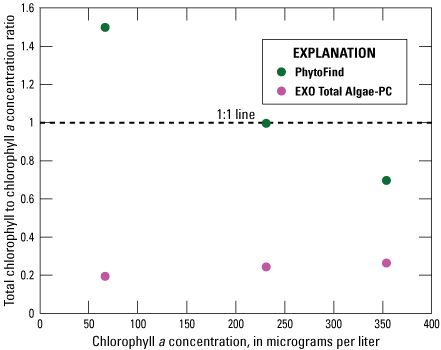
Graph showing instrument-measured total chlorophyll-to-laboratory-measured chlorophyll a concentration ratios related to the chlorophyll a concentration measurement of a monoculture dilution series of Microcystis aeruginosa for the Turner Designs, Inc. PhytoFind in-place phytoplankton classification tool and YSI Inc. EXO Total Algae-PC sensor. Data are from Reed and others (2022). Dilution volumes are listed in table 2.
In the same three-point dilution series of Microcystis aeruginosa, the EXO Total Algae PC underestimated chlorophyll concentration relative to laboratory-measured chlorophyll a concentration consistently within the operating range of 0 to 400 µg/L chlorophyll. The operating range of the EXO Total Algae-PC was not exceeded. Chlorophyll concentration was underestimated by about 75 percent at 66.8, 231, and 354 µg/L chlorophyll a. Overall, the chlorophyll-to-chlorophyll a concentration ratio for the EXO Total Algae-PC was consistent when chlorophyll a concentration increased (fig. 16).
Pseudanabaena Dilution Results
In a five-point dilution series of Pseudanabaena (table 2), the PhytoFind overestimated chlorophyll concentration relative to laboratory-measured chlorophyll a concentration consistently within and above the operating range of 0 to 250 µg/L chlorophyll. Chlorophyll concentration was most overestimated, by about 60 percent, at 130, 310 and 393 µg/L chlorophyll a. Chlorophyll concentration was least overestimated, by about 10 percent, at 919 µg/L chlorophyll a, the highest concentration tested. Overall, the chlorophyll-to-chlorophyll a concentration ratio for the PhytoFind decreased when chlorophyll a concentration increased. Reported contribution percentages from the cyanobacteria group (phycocyanin fluorescence channel) decreased from 34 to 21 percent with increasing chlorophyll a concentrations. Additionally, the contribution percentage from the mixed phytoplankton group (phycoerythrin fluorescence channel) ranged from 66 to 79 percent when chlorophyll a concentration increased. This response from the PhytoFind can be attributed, in part, to the content of phycoerythrin in Pseudanabaena (fig. 17).
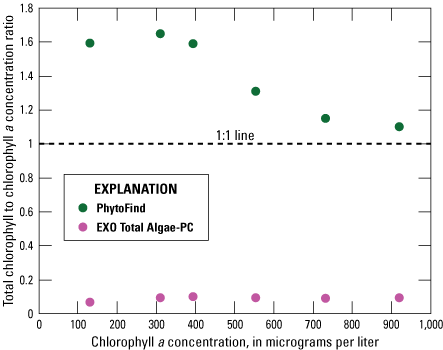
Graph showing instrument-measured total chlorophyll-to-laboratory-measured chlorophyll a concentration ratios related to the chlorophyll a concentration measurement of a monoculture dilution series of Pseudanabaena for the Turner Designs, Inc. PhytoFind in-place phytoplankton classification tool and YSI Inc. EXO Total Algae-PC sensor. Data are from Reed and others (2022). Dilution volumes are listed in table 2.
In the same five-point dilution series of Pseudanabaena, the EXO Total Algae-PC underestimated chlorophyll concentration relative to laboratory-measured chlorophyll a concentration consistently by about 90 percent within and above its operating range of 0 to 400 µg/L chlorophyll. Chlorophyll concentration was tested at the concentration range of 130 to 919 µg/L chlorophyll a. Overall, the chlorophyll-to-chlorophyll a concentration ratio for the EXO Total Algae-PC was consistent when chlorophyll a concentration increased (fig. 17).
Synechococcus Dilution Results
In a three-point dilution series of Synechococcus (table 2), the PhytoFind overestimated chlorophyll concentration relative to laboratory-measured chlorophyll a concentration within the operating range and underestimated chlorophyll above the operating range of 0 to 250 µg/L chlorophyll. Chlorophyll concentration was overestimated by about 150 percent at 25.6 µg/L chlorophyll a and about 40 percent at 138 µg/L chlorophyll a. When the operating range was exceeded, the PhytoFind underestimated chlorophyll concentration by about 65 percent at 698 µg/L chlorophyll a. Overall, the chlorophyll-to-chlorophyll a concentration ratio for the PhytoFind decreased exponentially when chlorophyll a concentration increased. Reported contribution percentages from the cyanobacteria group decreased from 100 to 76 percent with increasing chlorophyll a concentration (fig. 18).
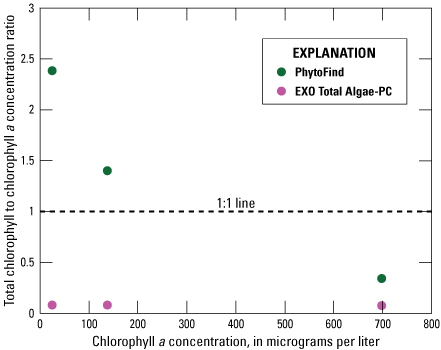
Graph showing instrument-measured total chlorophyll-to-laboratory-measured chlorophyll a concentration ratios related to the chlorophyll a concentration measurement of a monoculture dilution series of Synechococcus for the Turner Designs, Inc. PhytoFind in-place phytoplankton classification tool and YSI Inc. EXO Total Algae-PC sensor. Data are from Reed and others (2022). Dilution volumes are listed in table 2.
In these same test conditions, the EXO Total Algae-PC underestimated chlorophyll concentration relative to laboratory-measured chlorophyll a concentration consistently by about 90 percent through the concentration range of 25.6 to 698 µg/L chlorophyll a within and above the operating range of 0 to 400 µg/L chlorophyll. Overall, the chlorophyll to chlorophyll a concentration ratio for the EXO Total Algae-PC was consistent when chlorophyll a concentration increased (fig. 18).
Results of Mixed-Population Culture Testing
Mixed-Population Cultures Chlorophyll Results
In mixed-population cultures, the PhytoFind consistently overestimated chlorophyll concentration relative to laboratory-measured chlorophyll a concentration (table 6). The overestimation was most exaggerated, by 400 percent, in the mixture dominated by the chlorophyte Chlorella vulgaris. The least-overestimated chlorophyll concentration, by about 63 percent, was in the mixture dominated by the phycoerythrin-containing cyanobacterium Pseudanabaena (fig. 19; table 6).
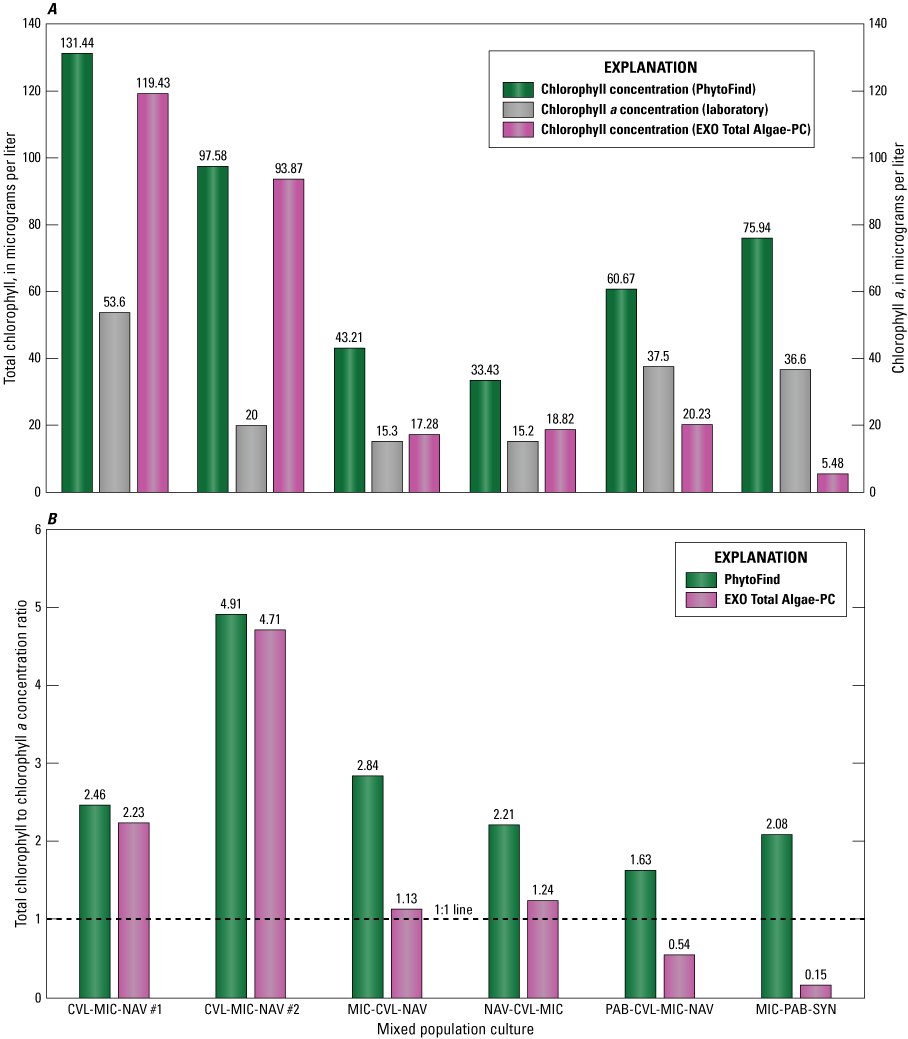
Bar charts showing A, total chlorophyll concentrations, measured with a Turner Designs, Inc. PhytoFind in-place phytoplankton classification tool and a YSI Inc. EXO Total Algae-PC sensor, and laboratory-measured chlorophyll a concentrations; and B, ratios of total chlorophyll, measured with a PhytoFind in-place phytoplankton classification tool and a EXO Total Algae-PC sensor, to laboratory-measured chlorophyll a concentrations, per mixed-population phytoplankton culture. Data are from Reed and others (2022). Description of mixed-population phytoplankton cultures are listed in table 3. CVL, Chlorella vulgaris; MIC, Microcystis aeruginosa; NAV, Navicula; PAB, Pseudanabaena; SYN, Synechococcus.
Table 6.
Summary of chlorophyll concentrations and laboratory-measured chlorophyll a concentrations in mixed-population phytoplankton cultures.[Chlorophyll concentrations were measured with a Turner Designs, Inc. PhytoFind in-place phytoplankton classification tool and a YSI Inc. EXO Total Algae-PC sensor. Data are from Reed and others (2022). µg/L, microgram per liter; CVL, Chlorella vulgaris; MIC, Microcystis aeruginosa; NAV, Navicula; PAB, Pseudanabaena; SYN, Synechococcus]
The EXO Total Algae-PC overestimated chlorophyll concentration relative to laboratory-measured chlorophyll a concentration in mixtures where the chlorophyte relative biovolume was greater than 15 percent and underestimated chlorophyll concentration in mixtures dominated by cyanobacteria with chlorophyte relative biovolume of less than 15 percent (table 6). The EXO Total Algae-PC overestimated chlorophyll by about 400 percent in the mixture dominated by the Chlorella vulgaris. The most severe underestimation was about 85 percent in the mixture containing only the cyanobacteria species. Of all the test conditions, the EXO Total Algae-PC measured the closest chlorophyll-to-chlorophyll a concentration, with a variability of less than 10 percent, in the mixture dominated by the cyanobacterium Microcystis aeruginosa (fig. 19; table 6).
Mixed-Population Culture Community Composition Results
Percent chlorophyll contributions per phytoplankton group of the total chlorophyll measured by the PhytoFind were compared with laboratory-measured relative percent biovolume as determined by IFC analyses (table 7). The comparison of community composition measured by the PhytoFind with relative percent biovolume is not direct; however, community composition measured by the PhytoFind and relative percent biovolume were assumed to be comparable (fig. 20). Of the four test conditions containing the chlorophyte Chlorella vulgaris with the diatom Navicula or the cyanobacterium Microcystis aeruginosa or all three species, the green and brown phytoplankton group was overestimated by the PhytoFind by about 40 percent in comparison to relative percent biovolume when Chlorella vulgaris was less than 40 percent relative percent biovolume. This result coincided with monoculture tests observations, indicating an increasing overestimation of chlorophyll concentration from Chlorella vulgaris as the chlorophyll a concentration decreases. Thus, the lower the Chlorella vulgaris concentration is in a mixture, the more likely its contribution to total chlorophyll concentration may be overestimated and underestimated in reverse.
Table 7.
Phytoplankton group proportions measured in mixed-population phytoplankton cultures.[Percent (%) of chlorophyll (chl) contribution was measured with a Turner Designs, Inc. PhytoFind in-place phytoplankton classification tool; relative percent biovolume (BV) measured in a laboratory by imaging flow cytometry (IFC). Test conditions are defined in table 3. Data are from Reed and others (2022). CVL, Chlorella vulgaris; MIC, Microcystis aeruginosa; NAV, Navicula; PAB, Pseudanabaena; SYN, Synechococcus; NA, not applicable]
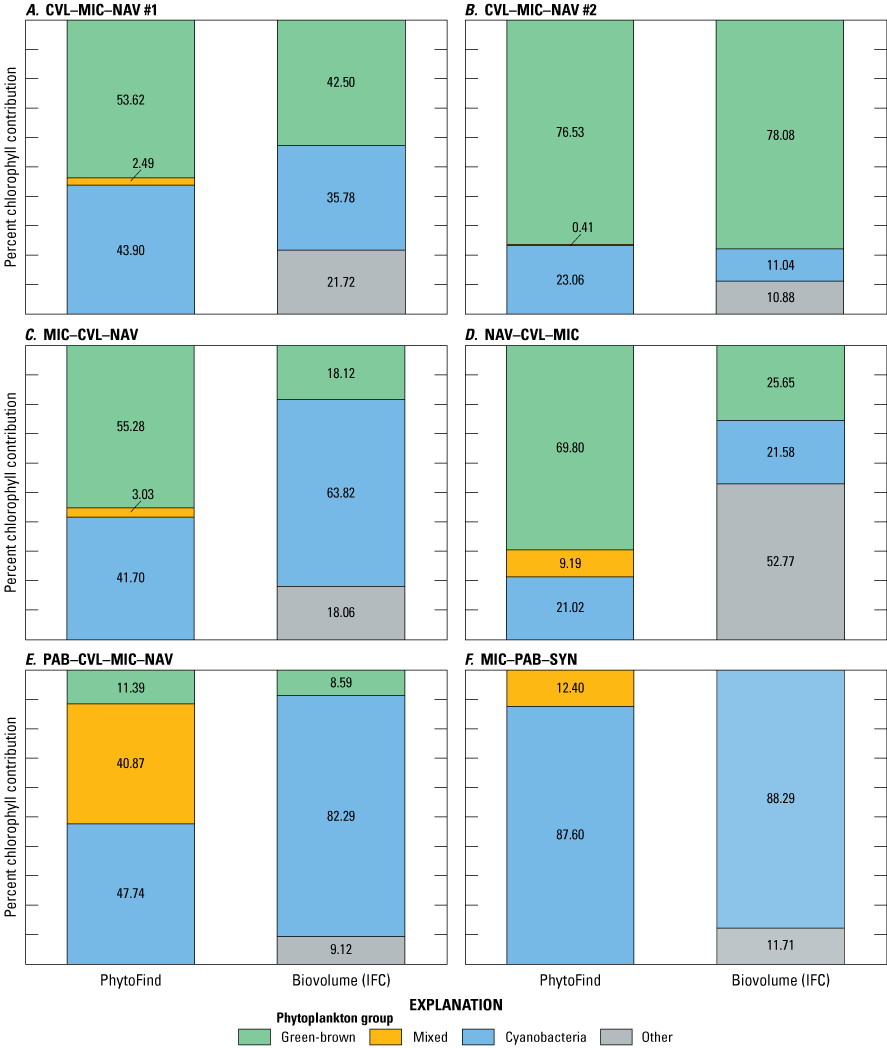
Percent chlorophyll contribution per phytoplankton group measured with a Turner Designs, Inc. PhytoFind in-place phytoplankton classification tool and laboratory-measured relative percent biovolume determined by imaging flow cytometry (IFC) for mixed-population phytoplankton cultures: A, CVL–MIC–NAV #1; B, CVL–MIC–NAV #2; C, MIC–CVL–NAV; D, NAV–CVL–MIC; E, PAB–CVL–MIC–NAV; and F, MIC–PAB–SYN. Mixed-population phytoplankton cultures are described in table 3. Data are from Reed and others (2022). CVL, Chlorella vulgaris; MIC, Microcystis aeruginosa; NAV, Navicula; PAB, Pseudanabaena; SYN, Synechococcus.
In the test condition with these species plus the dominant addition of the cyanobacterium Pseudanabaena, the PhytoFind overestimated the mixed phytoplankton group and underestimated the cyanobacteria group compared with relative percent biovolume. Although IFC analysis indicated that the relative percent biovolume of the cyanobacteria group was about 82 percent, the PhytoFind reported about 48 percent from the cyanobacteria group and about 41 percent from the mixed phytoplankton group. As with the monoculture tests, the mixed phytoplankton group (that is, phycoerytherin-containing phytoplankton) contribution was overestimated because this fluorescence channel detected the phycoerythrin present in Pseudanabaena. When the PhytoFind was tested in a mixture of only the cyanobacteria species—Pseudanabaena, Microcystis aeruginosa, and Synechococcus—the reported percent chlorophyll contribution and relative percent biovolume for the cyanobacteria group were 87.6 and 88.3 percent, respectively.
Turbid Mixed-Population Cultures Results
Multipoint additions of Elliott silt loam soil (U.S. Department of Agriculture, 2015) were applied to five of the six mixed-population culture mixtures—CVL–MIC–NAV #1, CVL–MIC–NAV #2, MIC–CVL–NAV, NAV–CVL–MIC, PAB–CVL–MIC–NAV—addressing effects of turbidity on chlorophyll concentration measurements (fig. 21). In conditions where the relative percent biovolume of Chlorella vulgaris was greater than 40 percent, chlorophyll concentration measured by the PhytoFind varied by approximately ±10 percent around the mean in turbidity ranges from 0 to 1,000 NTU. For those conditions where relative percent biovolume of Chlorella vulgaris values were lower than 40 percent, chlorophyll concentration from the PhytoFind showed a proportional response to increasing turbidity levels, increasing by about 100 percent through the range of 0 to 1,000 NTU. As the turbidity increased, the percent chlorophyll contribution of the mixed phytoplankton group measured with the PhytoFind increased and the percent chlorophyll contribution of the green and brown phytoplankton group concurrently decreased.
In conditions where the relative percent biovolume of Chlorella vulgaris was greater than 40 percent, the EXO Total Algae-PC had an inversely proportional relation to increasing turbidity levels, particularly for concentrations greater than 100 NTU, decreasing by about 60 percent through the range of 0 to 1,000 NTU. For those conditions where relative percent biovolume of Chlorella vulgaris values were lower than 40 percent, the EXO Total Algae-PC chlorophyll concentration measurements were consistent overall and had a slightly inversely proportional relation, decreasing by only about 5 µg/L, or about 25 percent, through the range of 0 to 1,000 NTU (fig. 21).
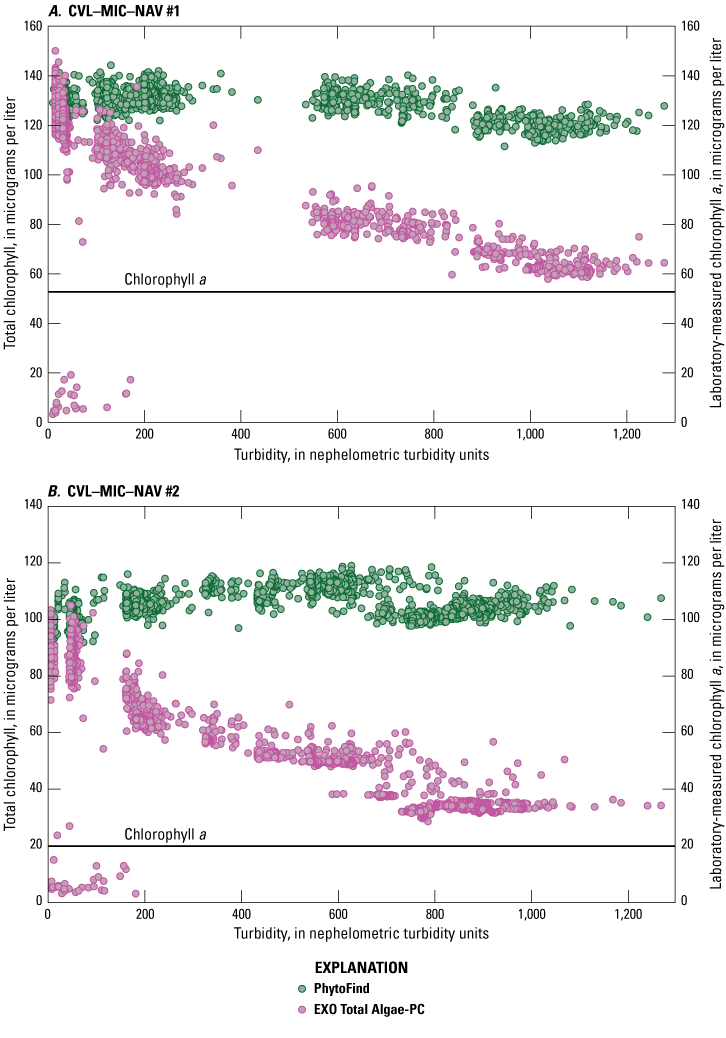

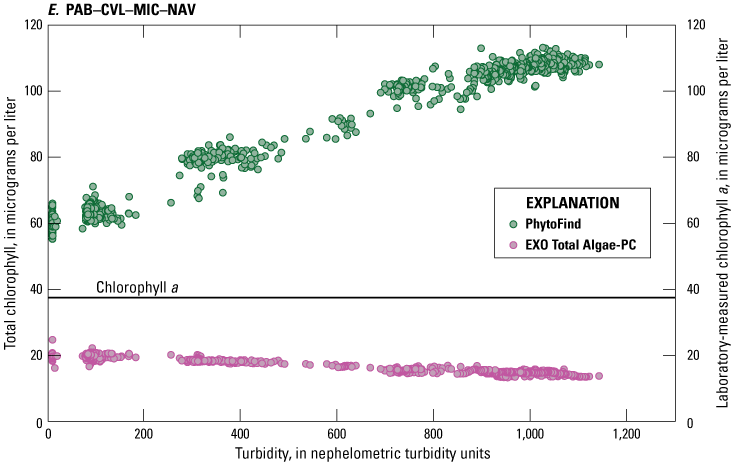
Graphs showing chlorophyll concentrations, measured with a Turner Designs, Inc. PhytoFind in-place phytoplankton classification tool and a YSI Inc. EXO Total Algae-PC sensor, over a range of turbidity in mixed-population phytoplankton cultures for test conditions: A, CVL–MIC–NAV #1; B, CVL–MIC–NAV #2; C, MIC–CVL–NAV; D, NAV–CVL–MIC; E, PAB–CVL–MIC–NAV. Data are from Reed and others (2022). Mixed-population phytoplankton cultures are described in table 3. CVL, Chlorella vulgaris; MIC, Microcystis aeruginosa; NAV, Navicula; PAB, Pseudanabaena; SYN, Synechococcus.
Results of Field Testing
As with laboratory tests, when evaluating the instrument in the field, it is important to consider that the reported chlorophyll concentration and percent chlorophyll contribution per phytoplankton group from the PhytoFind are estimates and not associated with a specified accuracy by the manufacturer. The results from the instrument were assumed to have relative correlation with the discrete sample analyses.
Chlorophyll Field Test Results
The PhytoFind overestimated chlorophyll concentration relative to laboratory-measured chlorophyll a concentration at 17 of 20 sample locations. Based on IFC analyses, the phytoplankton communities were dominated by organisms classified in either the green and brown phytoplankton group or the cyanobacteria group. The highest overestimations were observed in samples dominated by the cyanobacteria group, by about 200 percent. In the three sample locations where chlorophyll concentration was underestimated (varying by about 10 to 30 percent less than the laboratory-measured chlorophyll a concentration), a chlorophyte was dominant (fig. 22). Overall, the magnitude of overestimation by the PhytoFind in the range of chlorophyll a concentrations sampled was similar to results of the laboratory tests using phytoplankton cultures, whereas the magnitude of underestimations was not. IFC analyses indicated phytoplankton community compositions with more than 10 different species or classifications at each location and, thus, may have led to sensor responses not observed during laboratory tests.
The EXO Total Algae-PC underestimated chlorophyll concentration relative to laboratory-measured chlorophyll a concentration at 19 of 20 sample locations; the greatest underestimations, by about 60 percent, were in samples dominated by cyanobacteria. In the one sample location where chlorophyll concentration was overestimated, by about 15 percent relative to laboratory-measured chlorophyll a concentration, a cyanobacterium was dominant (fig. 22). Overall, the magnitude of underestimations by the EXO Total Algae-PC in the range of chlorophyll a concentration sampled—especially when cyanobacteria were dominant—was similar to results of the laboratory tests (fig. 22). Overestimation of chlorophyll concentration relative to laboratory-measured chlorophyll a concentration when cyanobacteria were dominant in the sample corresponds to the laboratory-testing results of the mixed population test condition MIC–CVL–NAV (where the cyanobacterium Microcystis aeruginosa was dominant in the presence of Chlorella vulgaris and Navicula) where chlorophyll concentration was also overestimated.
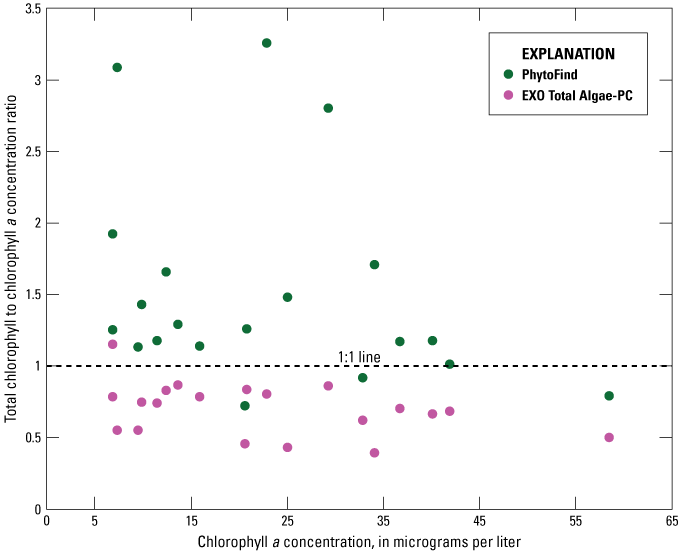
Graph showing ratios of total chlorophyll concentration, measured with a Turner Designs, Inc. PhytoFind in-place phytoplankton classification tool and a YSI Inc. EXO Total Algae-PC sensor, to laboratory-measured chlorophyll a concentration, compared with laboratory-measured chlorophyll a concentration, from samples collected during a moving-boat survey from July 15–18, 2019, in southern Florida. Data are from U.S. Geological Survey (2016), Booth and Knight (2019a), and Reed and others (2022).
Dissolved Organic Matter Field Test Results
Within fDOM measurements of about 25 to 450 QSE, the chlorophyll-to-chlorophyll a concentration ratio distributions around the one-to-one line do not show a significant trend for the PhytoFind (fig. 23). These results support the effectiveness of the DOM compensation feature of the PhytoFind. Within fDOM measurements of about 25 to 450 QSE, the chlorophyll-to-chlorophyll a concentration ratio distributions around the one-to-one line do not show a significant trend for the EXO Total Algae-PC.
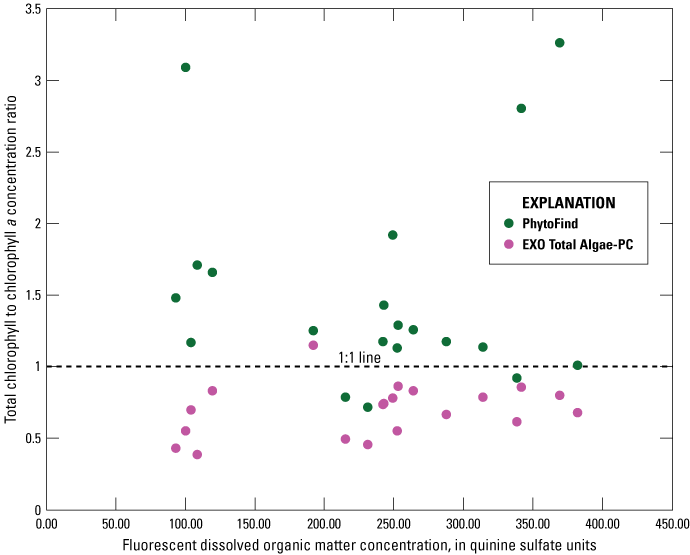
Graph showing relation of chlorophyll concentration, measured with a Turner Designs, Inc. PhytoFind in-place phytoplankton classification tool and a YSI Inc. EXO Total Algae-PC sensor, to laboratory-measured chlorophyll a concentration, as ratios, to fluorescent dissolved organic matter, of surface water samples collected during a moving-boat survey from July 15–18, 2019, in southern Florida. Data are from U.S. Geological Survey (2016), Booth and Knight (2019a), and Reed and others (2022).
Community Composition Field Test Results
Community compositions were diverse during the July 15–18, 2019, moving-boat survey in southern Florida. IFC analyses indicated about 10 to 20 different phytoplankton taxa for each of the 20 locations. Of these taxa, six were dominant in one or more samples, including chlorophytes, cyanobacteria, and diatoms. Relative percent biovolume measured by IFC analyses shows that the green and brown phytoplankton group ranged from about 8 to 80 percent; the mixed phytoplankton group, from about 0 to 1 percent; and the cyanobacteria group, from about 8 to 70 percent (table 8). For algae not specifically classified by IFC as belonging to one of the PhytoFind target phytoplankton groups, the relative percent biovolume was accounted for in a group labeled “other” and ranged from about 8 to 60 percent.
Table 8.
Summary of phytoplankton group proportions at locations sampled during a moving-boat survey from July 15–18, 2019, in Florida.[Percent chlorophyll contribution was measured by the PhytoFind; relative percent biovolume is measured in laboratory. Data are from Mazzei and others (2022) and Reed and others (2022). Locations are detailed in table 4 and figure 9. PF, PhytoFind; IFC, imaging clow cytometry; %, percent; chl, chlorophyll; BV, biovolume; NA, not applicable]
No consistent correlation was found in the relations between percent chlorophyll contribution per phytoplankton group from the PhytoFind and relative percent biovolume per phytoplankton group from IFC analysis. The relationship was not determined to be controlled by dominant taxa, specific population ratio, or environmental condition. Most commonly, the PhytoFind overestimated the mixed phytoplankton group, which happened for 17 of the 20 locations sampled, and the PhytoFind overestimations of the mixed phytoplankton group chlorophyll contributions were the largest in magnitude out of all the target phytoplankton groups. The IFC reported mixed phytoplankton biovolume at each location as about 0 to 1 percent, whereas the PhytoFind reported several chlorophyll contribution percentages as high as 87 percent (fig. 24; table 8). These data indicate potential sensitivity of the mixed phytoplankton group fluorescence channel to interference from internal or external sources beyond the intended target phycoerythrin.
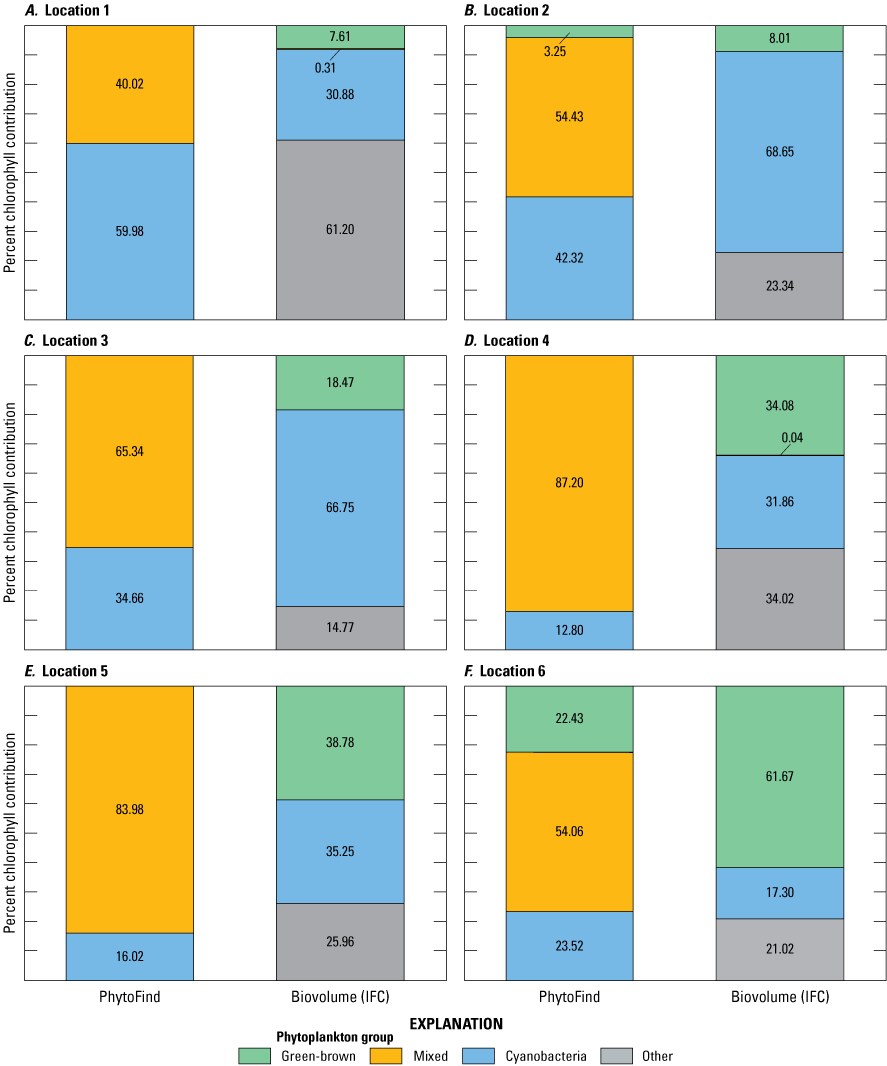
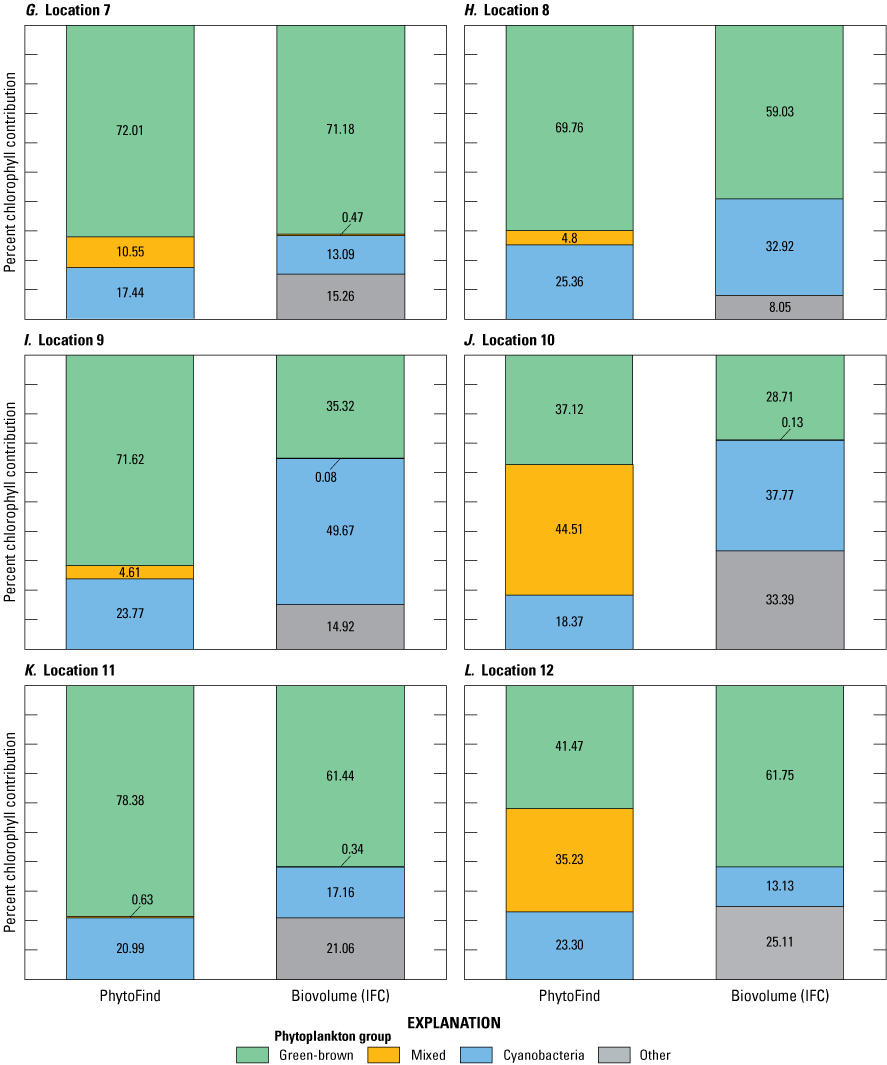
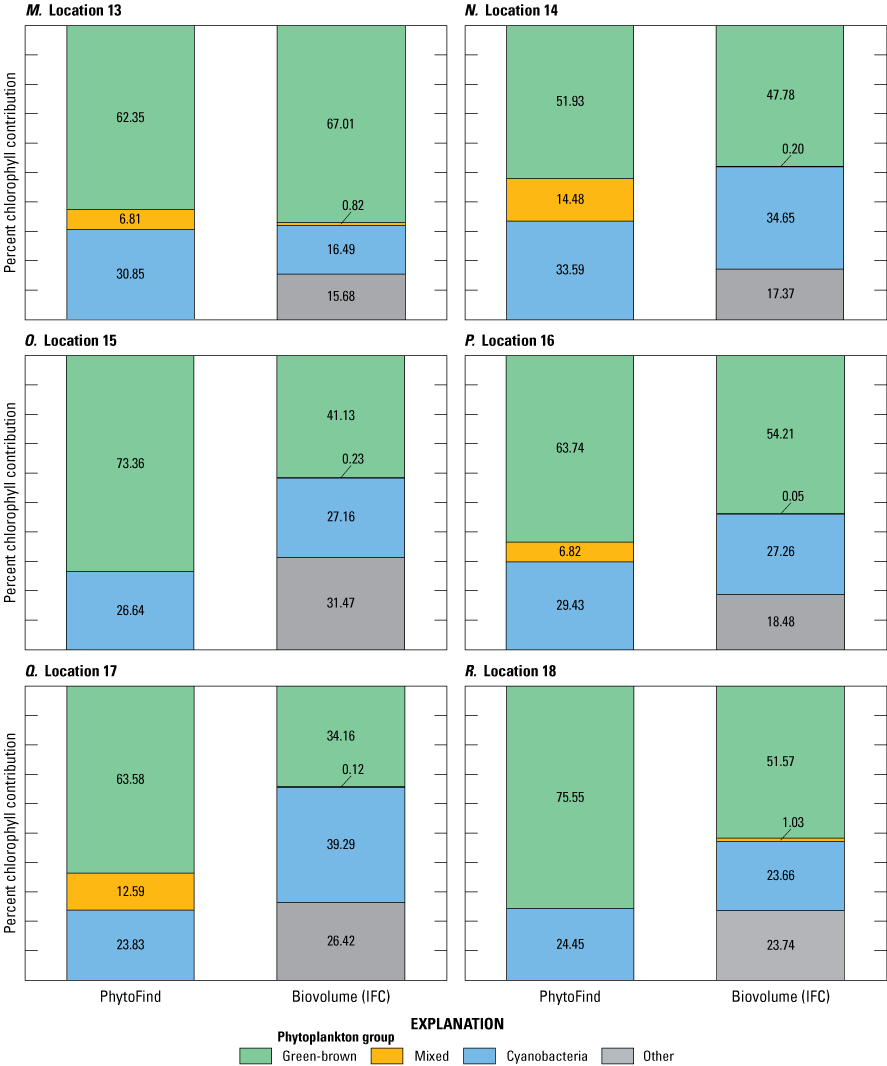
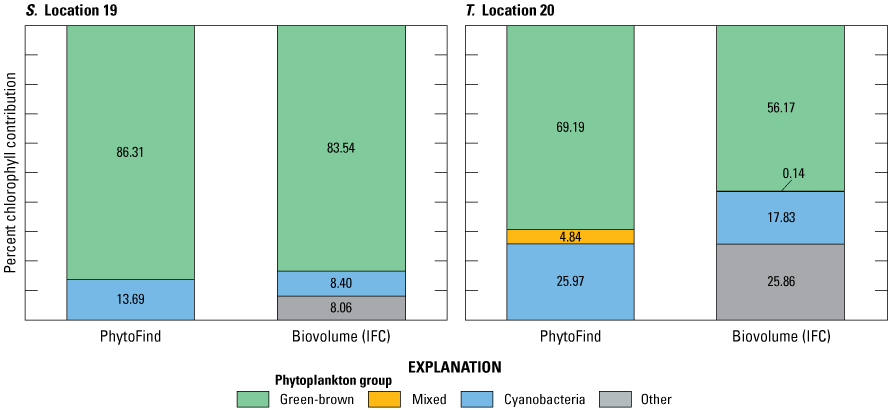
Graphs showing percent chlorophyll contribution per phytoplankton group measured with the Turner Designs, Inc. PhytoFind, and laboratory-measured relative percent biovolume at A–T, locations 1 to 20, sampled during the moving-boat survey in Florida. Locations are shown on figure 9 and listed in table 4. Data are from Mazzei and others (2022) and Reed and others (2022).
Because the algorithm of the PhytoFind factors in signals from all fluorescence channels (phycoerythrin, phycocyanin, chlorophyll and DOM) to determine estimates for chlorophyll concentration and percent chlorophyll contributions, it is possible that interference in one fluorescence channel could affect the estimates of all values reported. Additional testing across a range of water-quality and phytoplankton community types may better elucidate potential interferences.
Summary
In summer 2019, the U.S. Geological Survey evaluated the performance of the Turner Designs, Inc. PhytoFind, an in-place phytoplankton classification tool that uses multiple optical sensors with preset excitation and emission wavelength filters to distinguish among three phytoplankton groups. The instrument was tested in a laboratory and in the field during a moving-boat survey. The tests were designed to evaluate the ability of the PhytoFind to report estimates of the chlorophyll concentration and percent chlorophyll contributions from specific phytoplankton groups in controlled and natural settings. The laboratory and field measurements from the PhytoFind were evaluated against laboratory-measured values from discrete samples.
The PhytoFind incorporates fluorometric measurements at multiple wavelength channels into an algorithm to determine estimates of chlorophyll concentration and percent chlorophyll contribution from three target groups: phycoerythrin-containing phytoplankton (such as cryptophytes and some cyanobacteria; reported by the PhytoFind as “mixed phytoplankton group”), phycocyanin-containing phytoplankton (such as cyanobacteria; reported by the PhytoFind as “cyanobacteria group”), and all other chlorophyll-containing phytoplankton (such as green algae (chlorophytes) and diatoms; reported by the PhytoFind as “green and brown phytoplankton group”). The baseline stability of the instrument was tested over ambient water temperatures within the operating range of the PhytoFind. The maximum, minimum, and mean readings were all well below the minimum detection limit of 0.5 microgram per liter. The stability of the blank signal test measurements over the same range of temperatures did not indicate apparent influence of ambient water temperature on chlorophyll concentration measurements; however, the blank signal test measurements did exhibit substantial variability—some values in exceedance of the minimum detection limit—which could be attributed to fluctuations in the fluorescence channel that measured the mixed phytoplankton group. Water temperature was a factor that affected sensor readings in dye solutions; the PhytoFind measured chlorophyll concentration inversely proportional to increasing solution temperatures. Temperature corrections are not factored into chlorophyll concentration measurements directly reported by the PhytoFind and would have to be computed and applied externally if required.
In laboratory testing using dilution series of phytoplankton monocultures, the PhytoFind generally overestimated chlorophyll concentration relative to laboratory-measured chlorophyll a concentration within its operating range. Where laboratory-measured chlorophyll a concentration exceeded the operating range of the sensor, the chlorophyll-to-chlorophyll a concentration ratio for readings from the PhytoFind generally decreased with increasing concentration.
In mixed-population cultures, the PhytoFind demonstrated a consistent overestimation of chlorophyll concentration relative to laboratory-measured chlorophyll a concentration. The overestimation was most exaggerated in the mixture dominated by the chlorophyte Chlorella vulgaris, by about 400 percent. The least overestimation was in the mixture dominated by the phycoerythrin-containing cyanobacterium Pseudanabaena, by about 63 percent.
In mixed-population cultures with added turbidity, conditions where the relative percent biovolume of Chlorella vulgaris was greater than 40 percent, chlorophyll concentration measured by the PhytoFind varied by approximately ±10 percent from the mean in turbidity ranges from 0 to 1,000 nephelometric turbidity units. For those conditions where relative percent biovolume of Chlorella vulgaris values were lower than 40 percent, chlorophyll concentration from the PhytoFind showed a proportional response to increasing turbidity levels.
During field testing in the moving-boat water-quality survey, the PhytoFind indicated similar responses to those observed in laboratory tests. The PhytoFind generally overestimated chlorophyll concentration relative to laboratory-measured chlorophyll a concentration, at a magnitude in line with laboratory tests in the range of chlorophyll a concentration sampled. Chlorophyll concentration was overestimated the most, by about 200 percent, relative to chlorophyll a concentration in samples dominated by the cyanobacteria group.
Throughout the results of the moving-boat survey, fluorescent dissolved organic matter measurements ranged from about 25 to 450 quinine sulfate equivalents; however, plotted distributions of the chlorophyll-to-chlorophyll a concentration ratios did not show a noticeable pattern for the PhytoFind. These results support the effectiveness of the dissolved organic matter compensation feature of the PhytoFind in the waters sampled. With regard to community composition, correlation between percent chlorophyll contribution per phytoplankton group measured by the PhytoFind and laboratory-measured relative percent group biovolume measured by imaging flow cytometry varied from location to location and was not explicitly determined to be affected by a dominant taxon, specific population ratio, or environmental condition based on these results. Most commonly, the PhytoFind overestimated the mixed phytoplankton group. The overestimations of the mixed phytoplankton group chlorophyll contributions by the PhytoFind were the largest in magnitude out of all groups.
Overall, testing consistently indicated potential sensitivity of the mixed phytoplankton group fluorescence channel to interference beyond the intended target of the sensor, phycoerythrin. Such interference can contribute to increased uncertainty because the algorithm used by the PhytoFind factors in signals from all fluorescence channels to determine estimates for chlorophyll concentration and percent chlorophyll contributions. Therefore, interference affecting one fluorescence channel could further affect all values reported. Given the well-documented challenges with field-based fluorescence measurement of phytoplankton pigments, additional corrections by the user, such as those for temperature and other interferences described in this report, could decrease uncertainty of these data.
Acknowledgments
The authors are grateful for the assistance of Barry Rosen, Brian Pellerin, Amanda Booth, Travis Knight, Megan Montgomery, Emily Karwacki, Joshua Rosen, Michael Stouder, Kaitlyn Finkelstein, and Jason Finkelstein of the U.S. Geological Survey, whose contributions enhanced the quality of this report.
Selected References
Adams, C.M., Larkin, S.L., Hoagland, P., and Sancewich, B., 2018, Assessing the economic consequences of harmful algal blooms—A summary of existing literature, research methods, data, and information gaps, chap. 8 of Shumway, S.E., Burkholder, J.M., and Morton, S.L., eds., Harmful algal blooms—A compendium desk reference: New York, John Wiley & Sons, Inc., p. 337–354. [Also available at https://doi.org/10.1002/9781118994672.ch8.]
Algae Research Supply, 2021, Phytoplankton for everyone: Algae Research Supply web page, accessed May 19, 2021, at https://algaeresearchsupply.com/.
Arar, E.J., and Collins, G.B., 1997, Method 445.0—In vitro determination of chlorophyll a and pheophytin a in marine and freshwater algae by fluorescence (revision 1.2, September 1997): U.S. Environmental Protection Agency, 22 p., accessed June 23, 2020, at https://cfpub.epa.gov/si/si_public_record_report.cfm?Lab=NERL&dirEntryId=309417.
Bertone, E., Chuang, A., Burford, M.A., and Hamilton, D.P., 2019, In-situ fluorescence monitoring of cyanobacteria—Laboratory-based quantification of species-specific measurement accuracy: Harmful Algae, v. 87, article 101625, 14 p., accessed December 19, 2020, at https://doi.org/10.1016/j.hal.2019.101625.
Bertone, E., Burford, M.A., and Hamilton, D.P., 2018, Fluorescence probes for real-time remote cyanobacteria monitoring—A review of challenges and opportunities: Water Research, v. 141, p. 152–162. [Also available at https://doi.org/10.1016/j.watres.2018.05.001.]
Booth, A., and Knight, T., 2019a, Near-surface spatial water-quality surveys along the Caloosahatchee River, St. Lucie River, and Lake Okeechobee in July and August 2019, south Florida (ver. 1.1, December 2020): U.S. Geological Survey data release, accessed January 7, 2020, at https://doi.org/10.5066/P95WYHHE.
Booth, A.C., and Knight, T., 2019b, Near-surface spatial water-quality surveys along the St. Lucie and Caloosahatchee Rivers in October 2017, Lake Okeechobee and Caloosahatchee River in July 2018, and Caloosahatchee River, St. Lucie River and Lake Okeechobee in August of 2018, south Florida (ver. 1.1, December 2020): U.S. Geological Survey data release, accessed January 7, 2020, at https://doi.org/10.5066/P9TJ40N7.
Choo, F., Zamyadi, A., Newton, K., Newcombe, G., Bowling, L., Stuetz, R., and Henderson, R.K., 2018, Performance evaluation of in situ fluorometers for real-time cyanobacterial monitoring: H2Open Journal, v. 1, no. 1, p. 26–46. [Also available at https://doi.org/10.2166/h2oj.2018.009.]
Downing, B.D., Pellerin, B.A., Bergamaschi, B.A., Saraceno, J.F., and Kraus, T.E.C., 2012, Seeing the light—The effects of particles, dissolved materials, and temperature on in situ measurements of DOM fluorescence in rivers and streams: Limnology and Oceanography Methods, v. 10, no. 10, p. 767–775. [Also available at https://doi.org/10.4319/lom.2012.10.767.]
Foster, G.M., Graham, J.L., Bergamaschi, B.A., Carpenter, K.D., Downing, B.D., Pellerin, B.A., Rounds, S.A., and Saraceno, J.F., 2022, Field techniques for the determination of algal fluorescence in environmental waters—Principles and guidelines for instrument and sensor selection, operation, quality assurance, and data reporting: U.S. Geological Survey Techniques and Methods, book 1, chap. D10, 34 p., accessed December 5, 2022, at https://doi.org/10.3133/tm1D10.
Foster, G.M., King, L.R., Jastram, J.D., Joiner, J.K., Pellerin, B.A., Graham, J.L., and Williams, T.J., 2021, Technical note—Relative variability of selected turbidity standards and sensors in use by the U.S. Geological Survey: U.S. Geological Survey Open-File Report, 2021–1009, 41 p., appendixes, accessed September 23, 2022, at https://doi.org/10.3133/ofr20211009.
Graham, J.L., Loftin, K.A., Ziegler, A.C., and Meyer, M.T., 2008, Cyanobacteria in lakes and reservoirs—Toxin and taste-and-odor sampling guidelines (ver. 1.0): U.S. Geological Survey Techniques of Water-Resources Investigations, book 9, chap. A7.5, 65 p., accessed May 20, 2021, at https://doi.org/10.3133/twri09A7.5.
Hach, 2015, 2100AN laboratory turbidimeter, EPA, 115 vac: Hach web page, accessed May 20, 2021, at https://www.hach.com/2100an-laboratory-turbidimeter-epa-115-vac/product?id=7640450972.
Hach, 2020, DR6000 laboratory spectrophotometer: Hack web page, accessed May 20, 2021, at https://www.hach.com/spectrophotometers/dr6000-laboratory-spectrophotometer/family?productCategoryId=35547203833.
Hambrook Berkman, J.A., and Canova, M.G., 2007, Algal biomass indicators: U.S. Geological Survey Techniques of Water-Resources Investigations, book 9, chap. A7.4, 82 p., accessed April 23, 2020, at https://doi.org/10.3133/twri09A7.4.
LI–COR, Inc., 2021, LI–192 and LI–193 underwater quantum sensors: LI–COR, Inc. web page, accessed May 17, 2021, at https://www.licor.com/env/support/LI-192-and-LI-193/manuals.html.
Mazzei, V., Reed, A.P., and Booth, A.C., 2022, Phytoplankton community composition and abundance in Lake Okeechobee and the Okeechobee Waterway, Florida, USA, July and August 2019: U.S. Geological Survey data release, accessed January 7, 2020, at https://doi.org/10.5066/P9M9JOAF.
O’Neil, J.M., Davis, T.W., Buford, M.A., and Gobler, C.J., 2012, The rise of harmful cyanobacterial blooms—The potential roles of eutrophication and climate change: Harmful Algae, v. 14, p. 313–334. [Also available at https://doi.org/10.1016/j.hal.2011.10.027.]
Pentair, 2021, Pentair Shurflo Pro Blaster II washdown pumps: Pentair web page, accessed May 20, 2021, at https://www.pentair.com/en-us/products/residential/water-supply-disposal/marine/shurflo-pro-blaster-ii-washdown-pumps.html.
Reed, A.P., Johnston, B.D., Graham, J.L., Foster, G.M., and Downing, B.D., 2022, Laboratory and field data for an evaluation of the Turner Designs Inc. PhytoFind: U.S. Geological Survey data release, https://doi.org/10.5066/P9VHWTYC.
Sea-Bird Scientific, 2021, SUNA V2 nitrate sensor: Sea-Bird Scientific web page, accessed May 20, 2021, at https://www.seabird.com/nutrient-sensors/suna-v2-nitrate-sensor/family?productCategoryId=54627869922.
Trevino-Garrison, I., DeMent, J., Ahmed, F.S., Haines-Lieber, P., Langer, T., Ménager, H., Neff, J., van der Merwe, D., and Carney, E., 2015, Human illnesses and animal deaths associated with freshwater harmful algal blooms—Kansas: Toxins, v. 7, no. 2, p. 353–366. [Also available at https://doi.org/10.3390/toxins7020353.]
Turner Designs, Inc., 2021, PhytoFind in situ algal classification: Turner Designs, Inc. web page, accessed May 18, 2021, at https://www.turnerdesigns.com/phytofind-algal-classification.
U.S. Department of Agriculture, 2015, Elliott series (revision JBF–JWS–EJE–DEC): U.S. Department of Agriculture Established Series web page, accessed May 20, 2021, at https://soilseries.sc.egov.usda.gov/OSD_Docs/E/ELLIOTT.html#:~:text=The%20Elliott%20series%20consists%20of,from%200%20to%207%20percent.
U.S. Geological Survey, 2016, USGS water data for the nation: U.S. Geological Survey National Water Information System database, accessed September 7, 2022, at https://doi.org/10.5066/F7P55KJN.
Wang, C., Huang, Y., He, S., Lin, Y., Wang, X., and Kong, H., 2009, Variation of phytoplankton community before an induced cyanobacterial (Arthrospira platensis) bloom: Journal of Environmental Sciences (China), v. 21, no. 12, p. 1632–1638. [Also available at https://doi.org/10.1016/S1001-0742(08)62466-3.]
YSI Inc., 2021a, EXO2 multiparameter sonde: YSI Inc. web page, accessed May 14, 2021, at https://www.ysi.com/EXO2.
YSI Inc., 2021b, EXO Total Algae PC smart sensor: YSI Inc. web page, accessed May 14, 2021, at https://www.ysi.com/exo/talpc.
Zamyadi, A., Choo, F., Newcombe, G., Stuetz, R., and Henderson, R.K., 2016, A review of monitoring technologies for real-time management of cyanobacteria: recent advances and future direction: TrAC Trends in Analytical Chemistry, v. 85, pt. A, p. 83–96. [Also available at https://doi.org/10.1016/j.trac.2016.06.023.]
Conversion Factors
Datums
Vertical coordinate information is referenced to the North American Vertical Datum of 1988 (NAVD 88).
Horizontal coordinate information is referenced to the North American Datum of 1983 (NAD 83).
Supplemental Information
Photosynthetic photon flux density is measured in micromoles per square meter per second (µmol/m2/s). Concentration of chlorophyll and chlorophyll a is measured in micrograms per liter (µg/L).
Abbreviations
BB3
basic blue 3 (dye)
DOM
dissolved organic matter
DIW
deionized water
fDOM
fluorescent dissolved organic matter
FNU
formazin nephelometric unit
HAB
harmful algal bloom
IFC
imaging flow cytometry
MDL
minimum detection limit
NTU
nephelometric turbidity unit
QSE
quinine sulfate equivalents
RWT
rhodamine water tracer (dye)
USGS
U.S. Geological Survey
For more information, contact
Director, New York Water Science Center
U.S. Geological Survey
425 Jordan Road
Troy, NY 12180–8349
dc_ny@usgs.gov
or visit our website at
https://www.usgs.gov/centers/ny-water
Publishing support provided by the Pembroke Publishing Service Center
Suggested Citation
Johnston, B.D., Graham, J.L., Foster, G.M., and Downing, B.D., 2022, Technical note—Performance evaluation of the PhytoFind, an in-place phytoplankton classification tool: U.S. Geological Survey Scientific Investigations Report 2022–5103, 36 p., https://doi.org/10.3133/sir20225103.
ISSN: 2328-0328 (online)
| Publication type | Report |
|---|---|
| Publication Subtype | USGS Numbered Series |
| Title | Technical note—Performance evaluation of the PhytoFind, an in-place phytoplankton classification tool |
| Series title | Scientific Investigations Report |
| Series number | 2022-5103 |
| DOI | 10.3133/sir20225103 |
| Year Published | 2022 |
| Language | English |
| Publisher | U.S. Geological Survey |
| Publisher location | Reston, VA |
| Contributing office(s) | Caribbean Water Science Center, Kansas Water Science Center, New York Water Science Center |
| Description | Report: vi, 36 p.; Data Releases |
| Online Only (Y/N) | Y |
| Additional Online Files (Y/N) | N |
| Google Analytic Metrics | Metrics page |