

Groundwater-Level Altitudes and Groundwater-Flow Direction and Nature and Extent of Volatile and Semivolatile Organic Compounds at Petro-Chemical Systems, Inc. (Turtle Bayou), Superfund Site, Liberty County, Texas, 2020
Links
- Document: Report (1.56 MB pdf) , HTML , XML
- Data Release: USGS data release —Groundwater-level altitudes and volatile and semivolatile organic compound concentrations at the Petro-Chemical Systems, Inc. (Turtle Bayou) Superfund site, Liberty County, Texas, 2020
- Download citation as: RIS | Dublin Core
Abstract
The Petro-Chemical Systems, Inc. (Turtle Bayou), Superfund site is 15 miles southeast of Liberty, Texas, in Liberty County. Improper disposal of waste oils led to contamination of soil and groundwater at the site. In cooperation with the U.S. Environmental Protection Agency, the U.S. Geological Survey collected water-quality samples from 11 monitoring wells at the site, in particular the area near well MW-109A (the MW-109 area), in August and September 2020 and compared the water-quality results to the results from previous water-quality sampling events at the site in June 2016 and August 2018 with a focus on benzene concentrations. Contours of groundwater-level altitudes in the MW-109 area indicate that groundwater-flow direction is south-southeasterly in the eastern part and south-southwesterly in the western part.
Of the 51 volatile organic compounds analyzed, 13 were detected in groundwater samples from 1 or more wells. In all but 1 well, MW-109A, concentrations of these compounds were less than 100 micrograms per liter. Benzene is still the principal contaminant of concern, as it persists at concentrations exceeding 53,000 micrograms per liter, although naphthalene also appears to be a contaminant of concern, as it was detected at the greatest concentration of any semivolatile organic compound analyte (1,100 micrograms per liter in the sample from well MW-109A).
Introduction
The Petro-Chemical Systems, Inc. (Turtle Bayou), Superfund site (hereinafter referred to as “the site”) is 15 miles (mi) southeast of Liberty, Texas, in Liberty County (fig. 1). Improper disposal of waste oils led to contamination of soil and groundwater at the site. The U.S. Environmental Protection Agency (EPA) Superfund Redevelopment Program website explains that waste oils from nearby petroleum refining activities were disposed of illegally at the site in unlined pits and on County Road 126 (also known as Frontier Park Road) (EPA, 2022a).
In cooperation with the EPA, the U.S. Geological Survey (USGS) collected water-quality samples from monitoring wells at the site in August and September 2020 and compared the water-quality results to the results from previous water-quality sampling events in June 2016 and August 2018 with a focus on benzene concentrations. The part of the site that was the focus of the 2020 assessment is near well MW-109A, which is hereinafter referred to as the “MW-109 area” (fig. 1A). In addition to well MW-109A, the MW-109 area includes 10 other monitoring wells that were sampled as part of this assessment.
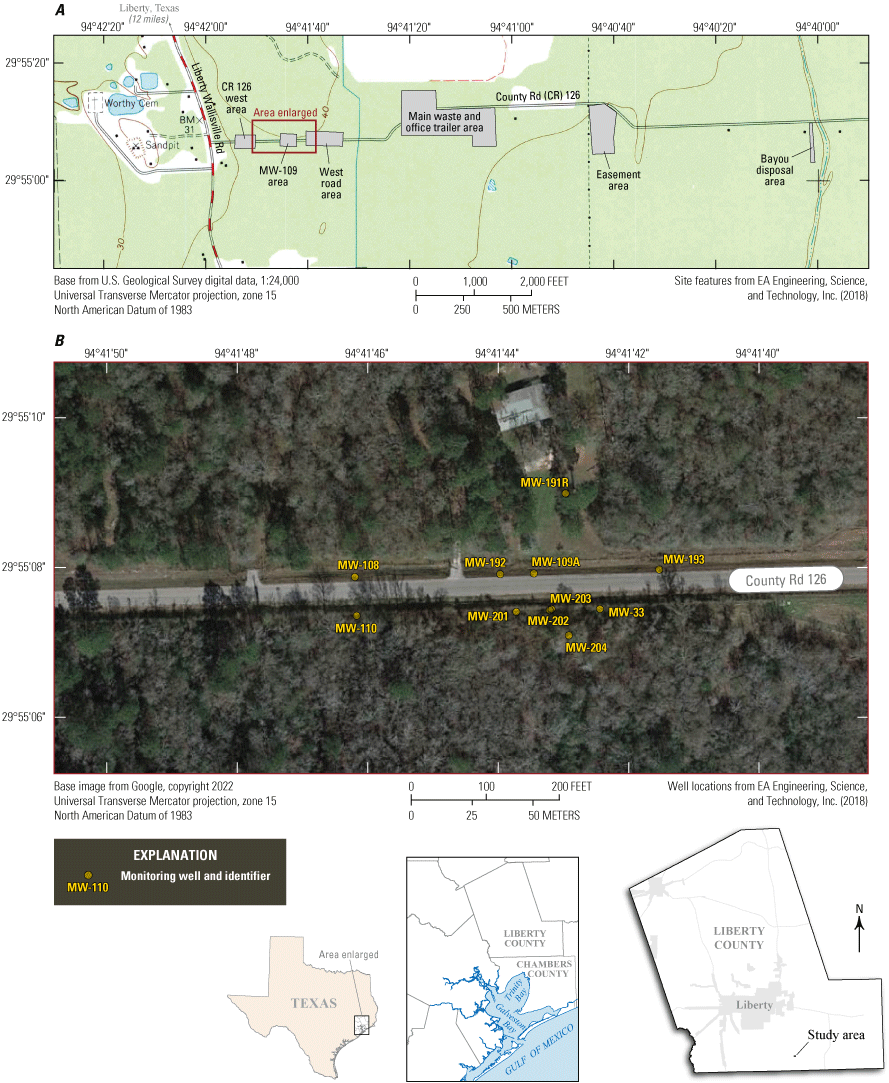
A, Location of study area and B, locations of monitoring wells sampled in the area near well MW-109A at the Petro-Chemical Systems, Inc. (Turtle Bayou), Superfund site, Liberty County, Texas, August and September 2020.
Study Area
The site is in southeast Texas in a low-lying area close (less than 30 mi) to the Gulf of Mexico coast and less than 10 mi from Trinity Bay (fig. 1). County Road 126 (Frontier Park Road) traverses the site. Land surface at the site is relatively flat, and land-surface altitudes in the MW-109 area range from 35 to 45 feet (ft) above the North American Vertical Datum of 1988 (fig. 1A). The 11 monitoring wells in the MW-109 area that were sampled in conjunction with this assessment are screened in the upper part of the Chicot aquifer (Casarez, 2020), which is contained in the Pleistocene-age Beaumont Formation in the study area (Aronow and others, 1982).
Site Background
The following background information regarding the site is summarized from the sampling and analysis plan (SAP) for the site (EA Engineering, Science, and Technology, Inc., 2019). The disposal of waste at the site, which included dumping of waste oils in unlined pits and on County Road 126 (Frontier Park Road), was documented as early as 1971 in Texas Water Quality Board records. However, because the site was not authorized as a waste disposal facility, it is unclear which substances were disposed of at the site and the mass of disposed substances. According to the EPA, it appears that the waste was dumped indiscriminately from trucks at numerous locations and that the waste disposal activities continued until the late 1970s (EPA, 2022a).
In 1971, an application for a commercial industrial waste disposal permit, which included a site development plan, under the name Petro-Chemical Systems, Inc., was filed with the State of Texas. After local citizens organized to oppose the application, public hearings were held, and additional information was evaluated in response to a citizen’s lawsuit. The State’s approval for the application was withheld, and in 1974, Petro-Chemical Systems, Inc., withdrew their application (EPA, 2016a). The site was subsequently subdivided into 5- and 15-acre plots and sold for residential development starting in 1974.
In 1984, the EPA proposed the site for inclusion on the National Priorities List, and in 1986, the site was officially added; the National Priorities List is a “list of sites of national priority among the known releases or threatened releases of hazardous substances, pollutants, or contaminants throughout the United States and its territories” (EPA, 2022b). Also in 1986, the site was divided into two operable units (OUs), where OU 1 included contaminated soil along County Road 126 (Frontier Park Road) and OU 2 included several areas of contaminated soil and groundwater, including the west road area, main waste and office trailer area, easement area, and bayou disposal area (fig. 1A). Subsequent assessments identified additional areas of contaminated soil and groundwater, including the County Road 126 west area (CR 126 west area) and the MW-109 area (fig. 1A).
MW-109 Area
The following background information regarding the MW-109 area is taken from the SAP for the site (EA Engineering, Science, and Technology, Inc., 2019, p. 4–6). Bracketed information in this section was added by the authors of the current report.
The MW-109 area is an area of concern at the site (figure * * *). The explanation of significant difference (ESD) for the site, dated 23 September 2010 (EPA, 2012), documents the decision to perform a RA [remedial action] for contaminated soil at the MW-109 area using ISCO [in situ chemical oxidation] and excavation with bio-treatment, as well as installation of three new monitoring wells.
MW-109 was a shallow groundwater monitoring well (30 feet below ground surface [bgs]) located approximately 1,000 feet east of the CR [County Road] 126 west area and approximately 300 feet west of the west road area along CR 126 (figure * * *). From August 2000 through May 2005, groundwater samples collected from MW-109 indicated elevated contaminant concentrations of benzene varying from nondetect to 13,000 parts per billion; however, the sample results indicated a decreasing [downward] trend.
In September 2000, Lyondell replaced a poorly constructed residential well with a new well. The new residential well has a completed depth of 186 feet bgs and was constructed to prevent the well from acting as a potential migration pathway for impacted groundwater from the shallow water-bearing zone into deeper water-bearing zones.
Analyses of groundwater samples collected from two nearby monitoring wells (MW-33 and MW-110) have not detected any contaminants of concern since August 2003. Analysis of a May 2005 sample collected from MW-108 showed a single detection of tert-butyl alcohol above the TCEQ’s [Texas Commission on Environmental Quality] protective concentration level. In April 2005, three temporary wells were installed near MW-109 and sampled. Analysis of the groundwater samples did not detect any volatile organic compounds (VOCs), semivolatile organic compounds (SVOCs), or target analyte list metals concentrations above respective maximum contaminant levels (MCLs) * * * or EPA risk-based regional screening levels (RSLs). Groundwater monitoring in the MW-109 area indicates that the extent of groundwater contamination is limited. The terrain is largely wooded with low relief, and shallow groundwater is typically encountered between 12 and 15 feet bgs.
Additional studies were conducted in 2007 to evaluate the extent of soil contamination in the MW-109 area. The evaluations found contaminated soil exceeding the soil cleanup criteria for benzene and naphthalene at depth intervals between 3.5 and 14.5 feet bgs. The October 2007 evaluation document indicated an estimated volume of 2,388 cubic yards of impacted soil in the MW-109 area.
The 1998 ROD [Record of Decision] amendment identified excavation with bio-treatment as a remedy for hot spots. Hot spots were areas where there was increased soil permeability above that found in background areas. Though the MW-109 area did not meet the soil permeability criteria of 1 × 10⁻⁶ centimeters per second established for a hot spot, like several other areas of the site, it did meet the general requirements of a hot spot based on elevated benzene concentrations. Approximately 2,209 cubic yards of contaminated soil from the MW-109 area were excavated and bio-treated onsite. This included impacted soils from 3 to 14 feet bgs. Soils within the 0- to 3-foot depth interval were demonstrated to meet the soil cleanup criteria (as identified in the 2006 ROD amendment). Following bio-treatment, the soil that met the residential soil cleanup criteria was used to backfill the excavated areas, and the soil that met the non-residential (industrial) soil cleanup criteria was used to backfill the right-of-way area adjacent to the excavation.
In 2009, EPA entered into an interagency agreement with the U.S. Army Corps of Engineers (USACE) to implement the RD [remedial design] and RA [remedial action] at the MW-109 area. This area was remediated using ISCO and excavation with bio-treatment. ISCO was the remedy that was used for the nearby CR-126 west area and was selected as the remedy for that area in the 2006 ROD amendment.
Cleanup criteria from the previous ROD amendments were applied at the MW-109 area; in particular, residential soil cleanup criteria for the soils in the residential remediation area and industrial soil cleanup criteria for the soils in the roadway right-of-way. Following several rounds of chemical injections in the MW-109 area, soil samples were collected and evaluated. A reduction in benzene and naphthalene concentrations was observed; however, the results indicated that the three rounds of chemical injections originally indicated in the design would not be sufficient to achieve soil cleanup criteria in a timely and cost-effective manner, and that additional injection events were required to clean up the highly plastic clay soil. Hence, an alternate remedy of excavation and bio-treatment was implemented, as identified in the 1998 ROD amendment.
Data collected within the MW-109 area indicate that the extent of groundwater contamination is limited (based on the results of groundwater sampling conducted in surrounding permanent and temporary wells). As part of the 2010 ESD [explanation of significant difference], USACE [U.S. Army Corps of Engineers] plugged and abandoned MW-109 and installed replacement well MW-109A, as well as the three new monitoring wells screened in the S1 sand: MW-191, MW-192, and MW-193 (figure * * * ).
To help determine the nature and extent of contamination, quarterly groundwater sampling was completed by EA [EA Engineering, Science, and Technology, Inc.] between April 2011 and January 2013 consisting of a total of eight groundwater monitoring and sampling events. Based upon a review of the groundwater analytical data, it is apparent that the majority of detected groundwater impact is limited to MW-109A, with principal contaminants of concern being benzene, naphthalene, and toluene. A review of the groundwater analytical data, in conjunction with the predicted groundwater flow and spatial distribution of wells, indicates a potential data gap in the groundwater monitoring well network to the south of MW-109A. Due to the apparent lack of a downgradient groundwater monitoring well, a complete evaluation of the nature and extent of the contamination was not performed.
Purpose and Scope
The purpose of this report is to depict groundwater-level altitudes and groundwater-flow direction by using data collected in 2020 and to compare concentrations of VOC and SVOC detections in 2020 to those from prior sampling events in June 2016 and August 2018, with emphasis on the 2020 extent of the benzene plume in the MW-109 area at the site. A map of groundwater-flow direction derived from groundwater-level altitudes is provided, along with descriptions of USGS data-collection activities and summaries of the water-quality data.
Methods
This section describes (1) the methods used to measure groundwater-level altitudes; (2) the methods used to collect water-quality data, including the use of passive diffusion bag (PDB) samplers; (3) how water-level data were used during the deployment of PDB samplers; (4) the methods used by the EPA Contract Laboratory Program (CLP) to analyze the water-quality samples that were collected for both VOCs and SVOCs; and (5) the different types of quality assurance samples that were collected and how the quality assurance information was used to support the water-quality results for samples collected at the site in August and September 2020. PDB samplers consist of a low-density polyethylene bag that has been prefilled with water that has been analyzed to determine the concentrations of the compounds of interest prior to sealing the bag; the bag acts as a semipermeable membrane, which allows most VOCs to pass through it, thereby facilitating the collection of a representative, equilibrium concentration sample of groundwater in the bag during deployment.
Sampling Methods
Previous water-quality assessments in June 2016 and August 2018 at the site (EA Engineering, Science, and Technology, Inc., 2018) used a HydraSleeve passive grab sampler (HydraSleeve, 2021) to collect groundwater samples following procedures described in the SAP (app. A in EA Engineering, Science, and Technology, Inc., 2019) that represent a continuation of previously established procedures for HydraSleeve use. The HydraSleeve resembles a PDB sampler that is devoid of water and remains collapsed as it is lowered to the interval of interest within the well (HydraSleeve, 2021). Water pressure keeps the check valve closed and the bag collapsed as the water in the well surrounding the sampling device is allowed to return to equilibrium (HydraSleeve, 2021). When the HydraSleeve is pulled upward at a velocity greater than 1 ft per second, the check valve opens, and water flows into the HydraSleeve (HydraSleeve, 2021). The sample contained within the HydraSleeve would, therefore, represent the depth interval that was traversed by the opening (that contains the check valve) while the bag was in the process of being filled (HydraSleeve, 2021). On the basis of discussions with the EPA remedial project manager (RPM) and the EPA technical lead RPM in Region 6, it was decided that an alternative sample collection method should be used for this assessment to ensure the collection of sufficient sample volume for both VOCs and SVOCs and to avoid any possible negative bias in the concentrations of these compounds. McHugh and others (2015) reported a median negative bias of 20 percent in VOC concentrations when the HydraSleeve was used relative to other methods for sampling monitoring wells at three test sites. In the assessment by McHugh and others (2015), the negative bias was more pronounced in samples collected from wells with more than 10 ft of water above the screened interval (26 percent) compared to wells at which the top of the screened interval coincided with the water table (7 percent). On the basis of these results, McHugh and others (2015) concluded that negative bias and increased variability appeared to be at least partially caused by an apparent filling anomaly that sometimes happens when there is standing water above the screened interval of the monitoring well. Hence, the follow-up study documented in this report and in its companion data release (Lucena, 2022) was completed.
Except for well MW-202, at which the water table was 22.87 ft above the top of the screened interval on August 24, 2020, the water table was less than 5.3 ft above the top of the screened interval in the 10 remaining wells (Lucena, 2022). Instead of using a passive grab sampler to collect groundwater samples, for this assessment a series of PDB samplers were deployed at different depth intervals in each of the 11 monitoring wells to collect VOC samples, and a peristaltic pump was used to collect SVOC samples and measure water-quality field properties.
Water-level measurements from each well were used to optimize placement of the PDB samplers within the water column in each well following methods described in Imbrigiotta and Harte (2020). PDB samplers were secured at three discrete depth intervals in each well (figs. 2 and 3). Each PDB sampler was 2 ft long and contained sufficient volume to collect a VOC sample (consisting of three 40-milliliter [mL] volatile organic analysis [VOA] vials) and an occasional replicate sample (consisting of two 40-mL VOA vials). In 9 of the 11 wells sampled, 2 of the 3 PDB samplers were placed within the screened interval to explore possible stratification within the benzene plume. In well MW-202, only one of the three PDB samplers was placed within the screened interval because the screened interval was short (5 ft; fig. 3C) relative to the length of the PDB samplers. In well MW-110, half of the uppermost PDB sampler was within the screened interval because the upper extent of the screened interval in this well was only 2.3 ft below the water table, and there were concerns that the uppermost PDB sampler could become partially emerged during the equilibration period if the water table decreased more than 0.3 ft (fig. 3F). PDB samplers were placed above the screened interval to investigate how VOC concentrations within the saturated zone of the well casing (which is not in direct communication with the aquifer and is more subject to VOC volatilization because of proximity to the air/water interface within the well casing) compared to those in the screened interval (which is in direct communication with the aquifer and is less subject to VOC volatilization) (Imbrigiotta and Harte, 2020).
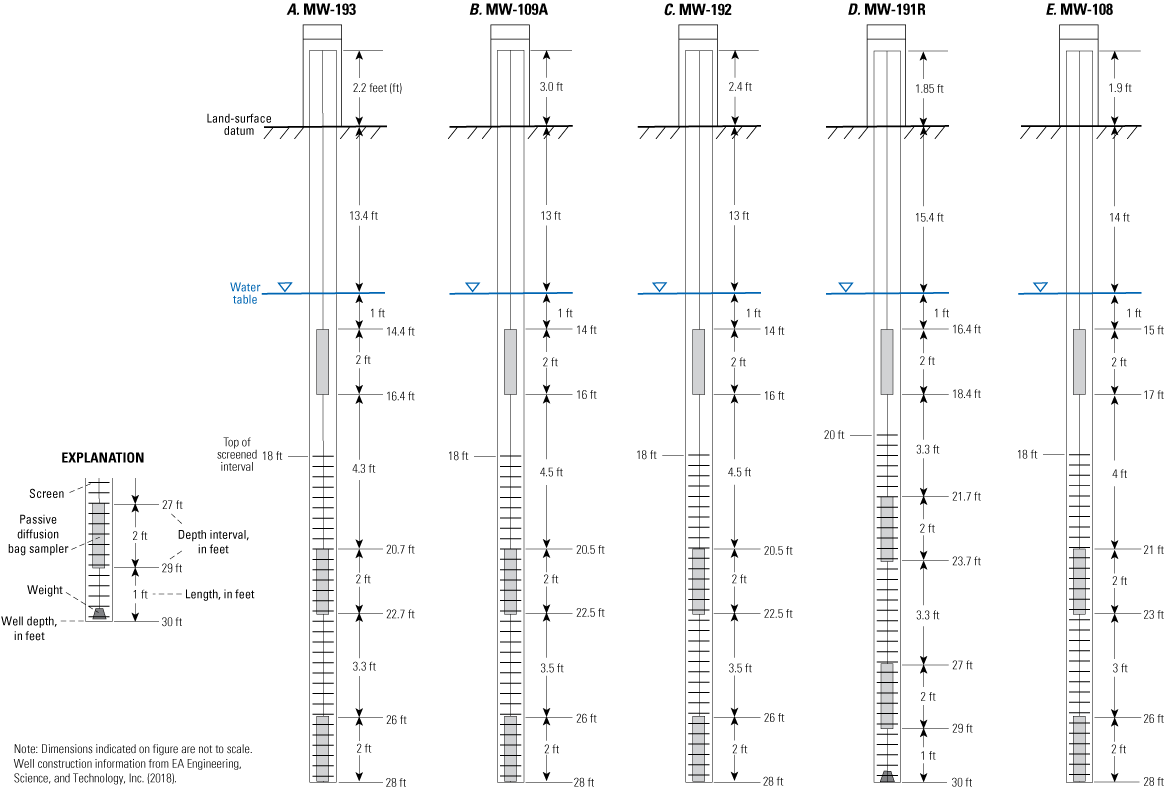
Placement of passive diffusion bag samplers in monitoring wells A, MW-193, B, MW-109A, C, MW-192, D, MW-191R, and E, MW-108 on August 5, 2020, north of County Road 126 in the area near well MW-109A at the Petro-Chemical Systems, Inc. (Turtle Bayou), Superfund site, Liberty County, Texas.
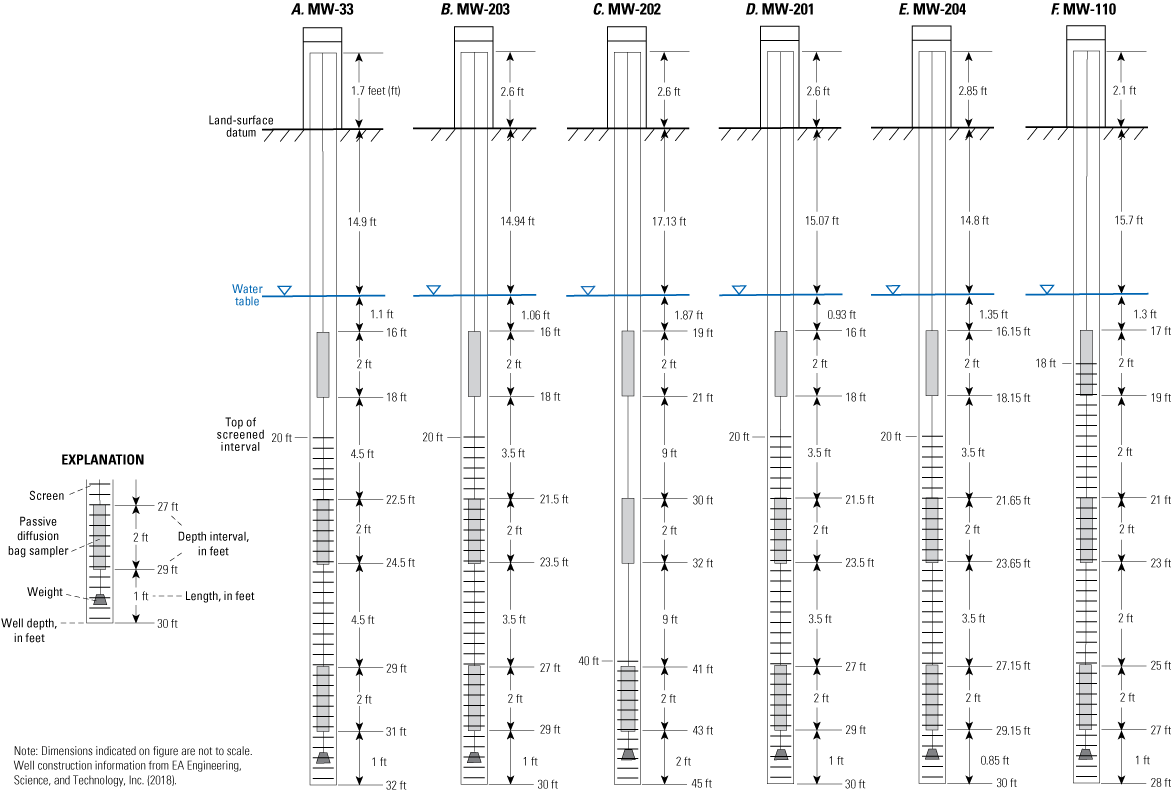
Placement of passive diffusion bag samplers in monitoring wells A, MW-33, B, MW-203, C, MW-202, D, MW-201, E, MW-204, and F, MW-110 on August 24, 2020, south of County Road 126 in the area near well MW-109A at the Petro-Chemical Systems, Inc. (Turtle Bayou), Superfund site, Liberty County, Texas.
PDB sampler deployment and associated sampling were done in two phases. PDB samplers were deployed in the wells north of County Road 126 on August 5, 2020 (figs. 1 and 2), whereas PDB samplers were deployed in the wells south of County Road 126 on August 24, 2020 (figs. 1 and 3). In both phases, PDB samplers were left in place for 2 weeks to provide sufficient time (Imbrigiotta and Harte, 2020) for diffusion and equilibration between the water contained within each of the PDB samplers and the water inside the well casing over the course of the 2-week period. PDB sampler deployment was split into two phases because several of the wells south of County Road 126 were inaccessible on August 5. Rather than wait to deploy PDB samplers at all 11 wells at a later date, the decision was made to split the deployment in an attempt to make the subsequent PDB sampler extractions and SVOC sampling, which followed 2 weeks after each deployment, more manageable. After 2 weeks, the PDB samplers were removed from each well and perforated before slowly filling (to avoid agitation of the water) three 40-mL amber VOA vials with Teflon-lined caps from each PDB sampler. Vials were pre-preserved with hydrochloric acid, which means that vials were purchased with hydrochloric acid already added at a volume sufficient to reduce the pH of the sample to 2 pH units or less. Two additional VOA vials were also filled from 4 of the 44 PDB samplers to serve as replicate samples. Each vial was given a temporary label containing relevant sample-specific information (well number, depth of sample, and sampling time), and this information was entered into Scribe, a software tool developed by the EPA to manage environmental data (EPA, 2021), to generate the final label for each vial and chain-of-custody information prior to sample submittal for laboratory analyses.
After the VOC samples were collected at each well, dedicated silicone tubing (tubing used at one well only, which was not cleaned prior to use) was extended between 19 and 21 ft below land-surface datum (roughly 1–3 ft below the tops of the screens in all wells except well MW-202) to collect samples for SVOC analyses. Two 1-liter (L) samples were collected in amber glass bottles with Teflon-lined caps in conjunction with each environmental sample at all 11 monitoring wells, and replicate samples (two additional 1-L bottles) were collected at 2 of the wells. USGS standard procedures (USGS, variously dated) prescribe that the tubing orifice be placed at a depth below the screened interval equaling 7–10 times the diameter of the well. In the case of the monitoring wells in the MW-109 area, this depth equates to 14–20 inches below the top of the screened interval for the majority of the wells (8 of the 11 wells have 2-inch casing diameters). The 3 remaining wells (MW-33, MW-108, and MW-110) have 4-inch casing diameters, so tubing orifice placement would be 28–40 inches below the top of the screened interval in these wells (Lucena, 2022). With the exception of well MW-202, the placement of tubing orifices during sample collection was within 2 ft of the depth intervals prescribed by USGS standard procedures (USGS, variously dated) and was always below the top of the screened interval. A peristaltic pump was used to collect the samples.
Typically, water-quality field properties are measured prior to collecting environmental samples for laboratory analyses; the stabilization of these field properties is used as an indicator that water representative of the groundwater in the aquifer is being sampled as opposed to any stagnant water that may have been present in the well casing (USGS, variously dated). However, results from previous field assessments indicated that groundwater-level altitudes for wells in the MW-109 area are slow to recover following groundwater withdrawals (groundwater-level altitudes were not monitored during the retrieval of the PDB samplers). To avoid the risk of not being able to collect SVOC samples at all, it was decided in conversations with the RPM prior to sampling that the water-quality field properties would be measured following SVOC sample collection and that three casing volumes of water would not be pumped from each well prior to SVOC sampling (a deviation from USGS standard procedures [USGS, variously dated]). Removing the PDB samplers from each well likely led to an abrupt reduction in the groundwater-level altitude at each well, resulting in the mixing of water in the well casing in addition to an influx of water from the adjacent aquifer into the well, thereby resulting in SVOC samples that represented water from the aquifer as desired. After SVOC samples had been collected at each well, a flowthrough cell attached to a calibrated water-quality sonde (YSI 6920 V2-2 multiparameter sonde) was used to measure water temperature, specific conductance, dissolved oxygen, and pH (Xylem Inc., 2022). All water-quality field properties were documented in Lucena (2022). The concentration listed for dissolved oxygen at each well should be considered as an upper limit because the dissolved oxygen sensor is slow to equilibrate at low groundwater withdrawal rates; groundwater was withdrawn slowly to help prevent the wells from going dry (well MW-203 was still inadvertently pumped dry during SVOC sample collection).
Methods associated with the calibration of water-quality sondes used to measure water-quality field properties are described in the USGS “National Field Manual for the Collection of Water-Quality Data” (USGS, variously dated). Methods associated with the collection, preservation, holding times, and shipping/handling of groundwater water-quality samples followed protocols associated with the EPA analytical methods selected for VOCs and SVOCs and specified by the EPA CLP (EPA, 2016b).
Analytical Methods
All samples were analyzed by the EPA CLP following analytical methods for both VOCs and SVOCs described in exhibit D of the “EPA Contract Laboratory Program Statement of Work for Organic Superfund Methods Multi-Media, Multi Concentration SOM02.4” (EPA, 2016b).
VOC samples were preserved and shipped overnight on ice to maintain a temperature of less than 6 degrees Celsius (°C) until they reached the EPA contract laboratory, at which point the samples were analyzed within 14 days of sample collection to meet holding times. Only two VOA vials were submitted in conjunction with each sample submitted for replicate analyses of VOCs because there was insufficient sample volume in each PDB sampler to fill six VOA vials (three for each of the environmental and replicate samples).
SVOC samples were preserved and shipped overnight on ice to maintain a temperature of less than 6 °C until they reached the EPA contract laboratory, at which point the samples were extracted within 7 days and analyzed within 40 days of sample collection to meet holding times.
Quality Assurance and Quality Control
VOC and SVOC concentrations that were less than the contract-required quantitation limits (CRQLs) but greater than the method detection limits are included in the discussion in this report but are considered estimates. The CRQL is the minimum level of reliable quantitation acceptable under the contract statement of work (SOW). The SOW (for organic analytes) for the CLP specifies CRQLs, and they are used for reporting limits (after adjustment for moisture percentage and dilution). The CLP CRQLs are set at the concentration of the lowest nonzero standard in the calibration curve. Organic analytes that are positively identified at concentrations less than the CLP CRQL are reported as present (and thus, considered as “detections”) but at an estimated concentration. The term “method detection limit” is defined as “the minimum concentration of a substance that can be measured and reported with 99-percent confidence that the analyte concentration is greater than zero” (EPA, 2014, p. 23).
Replicate samples are a type of quality-assurance sample collected in a manner such that the samples are thought to be essentially identical in composition (Mueller and others, 2015). There are many types of possible replicate samples, each of which may yield slightly differing results, particularly in more dynamic hydrologic settings. For this project, split sampling, which is a type of replicate in which a sample is split into subsamples that represent simultaneous time and space, was used to collect VOC replicate samples (Mueller and others, 2015). Sequential sampling, which is a type of replicate in which multiple samples are collected consecutively (typically over a short period of time), was used to collect a second (or duplicate) set of SVOC samples (Mueller and others, 2015).
Replicate samples were collected in the field in conjunction with 4 of the 44 VOC samples (2 from each sampling trip) collected and 2 of the 11 SVOC samples (1 from each sampling trip) collected. For this project, contaminants that were detected in both the environmental and replicate samples (Lucena, 2022) were compared by calculating the relative percent difference (RPD) by using the following equation:
whereC1
is the contaminant concentration in the environmental sample, and
C2
is the contaminant concentration in the replicate sample.
Of the 16 instances for which RPDs could be calculated for VOCs, the RPD exceeded 20 percent in only 2 cases (1,1-dichloroethane in well MW-193 at the 14.4–16.4-ft depth interval and acetone in well MW-33 at the 22.5–24.5-ft depth interval; Lucena, 2022). For SVOCs, RPDs could be calculated for 10 replicate pairs. The RPD exceeded 20 percent in half of the cases (Lucena, 2022). Several of the RPDs calculated for the SVOC analyte group that exceeded 20 percent were associated with SVOCs detected at lesser concentrations (less than approximately 18 micrograms per liter [µg/L]). For low concentrations, small differences between replicate pairs typically result in greater RPDs. Three of the RPDs that exceeded 20 percent were associated with concentrations that were less than the CRQL.
The difference in collection methods between VOCs and SVOCs may be at least partly responsible for the differences in the RPDs between the two. Environmental and replicate samples associated with VOC sample collection were collected from a single PDB sampler, which would classify these as split replicate samples. However, replicate samples collected for SVOC samples were collected sequentially; thus, the environmental and sequential replicate samples would likely represent slightly different geochemical conditions based on the origin of the sample water within the aquifer or well casing during sample collection. Because of the differing sample collection methodology, the environmental and replicate samples associated with VOC sample collection were likely more geochemically equivalent to one another than were the environmental and replicate samples associated with SVOC sample collection, hence the greater RPDs associated with the SVOC replicate samples relative to the VOC replicate samples.
Blank samples, which contain source water (referred to as “blank water”) and are anticipated to be devoid of the analytes of interest, were also collected to assess the potential for contamination in environmental samples during the data-collection process. Any measured value associated with a specific analyte in a blank sample that was absent in the blank water used to prepare the blank sample is likely the result of contamination but could also be caused by laboratory error. There are many types of possible blank samples, each designed to evaluate a different part of the data-collection and analysis process, which includes sampling, filtration, preservation, storage, transportation, and analysis (Mueller and others, 2015).
Trip blanks are a type of blank sample for which, in a clean environment, blank water is put in the same bottle type that will be used for the environmental sample. Trip blanks are kept with the set of environmental samples before and after sample collection and are used to demonstrate that the transport and shipment of bottles and samples are not sources of contamination (Mueller and others, 2015). Two VOC trip blanks (one from each sampling trip) were collected using deionized water as the blank water. A single VOC (chlorobenzene) was detected in one of the two trip blanks (TB-1; Lucena, 2022) at a concentration less than the CRQL of 0.21 µg/L. Trip blanks were not collected in conjunction with SVOCs for this project.
Laboratory blanks are a type of blank sample for which a solution is prepared in the analyzing laboratory and processed in the same manner as the associated environmental samples collected in the field. Laboratory blanks can provide an indication of potential sources of contamination at the laboratory (Mueller and others, 2015). Four laboratory blanks (two of which were associated with each sample set submitted to the laboratory) were prepared and analyzed for VOCs, whereas two laboratory blanks (one of which was associated with each sample set submitted to the laboratory) were prepared and analyzed for SVOCs. A single VOC (methylene chloride) was detected at a concentration less than the CRQL (approximately 0.16 µg/L) in one of the laboratory blanks for VOCs (VBLK25; Lucena, 2022), whereas there were no detections in either of the SVOC laboratory blanks (Lucena, 2022). Methylene chloride is a common solvent used in laboratory settings; often when methylene chloride is detected it was inadvertently introduced to the sample during the laboratory-analysis process (EPA, 1997, 2014).
Groundwater-Level Altitudes and Groundwater-Flow Direction
The site is in a low-lying area relatively close (less than 30 mi) to the Gulf of Mexico coast and less than 10 mi from Trinity Bay (fig. 1). Land surface at the site is relatively flat, and land-surface altitudes in the MW-109 area range from 35 to 45 ft above the North American Vertical Datum of 1988 (fig. 1A). The 11 monitoring wells in the MW-109 area that were sampled in conjunction with this assessment (fig. 1B) are screened in the upper part of the Chicot aquifer (Casarez, 2020). A minimum of two depth to water measurements were made from the top of the casing in each well by using a steel tape and following protocols outlined in Cunningham and Schalk (2011). If the first two measurements made at a well were not within 0.02 ft of each other, additional measurements were made either until two of the measurements were within 0.02 ft of one another or until the hydrographer had confidence that the selected measurement was of good quality. The measured depth to water in each well was then subtracted from the surveyed altitude of the top of the casing for each well (EA Engineering, Science, and Technology, Inc., 2018) to calculate the groundwater-level altitude in each well (Lucena, 2022).
The depths of 10 of the 11 wells that were sampled range from 28 to 32 ft below land-surface datum, and the depth of 1 well, MW-202, which is in a nest of wells with well MW-203, is 45 ft below land-surface datum. The measured groundwater-level altitude at well MW-202 is approximately 2 ft deeper than the groundwater-level altitudes measured in surrounding wells (Lucena, 2022) (fig. 4) likely because it is screened in a deeper interval (40–45 ft) relative to the 10 other wells, all of which are screened no deeper than 32 ft below land-surface datum (figs. 2 and 3). The differences in groundwater-level altitude and screened interval at well MW-202 compared to the other wells indicate that well MW-202 is likely screened in a different transmissive zone (but still within the Chicot aquifer) than are the other wells in the MW-109 area. As a result of these differences, the groundwater-level altitude calculated for well MW-202 was not considered when contouring the August 2020 groundwater-level altitudes in the MW-109 area (fig. 4).
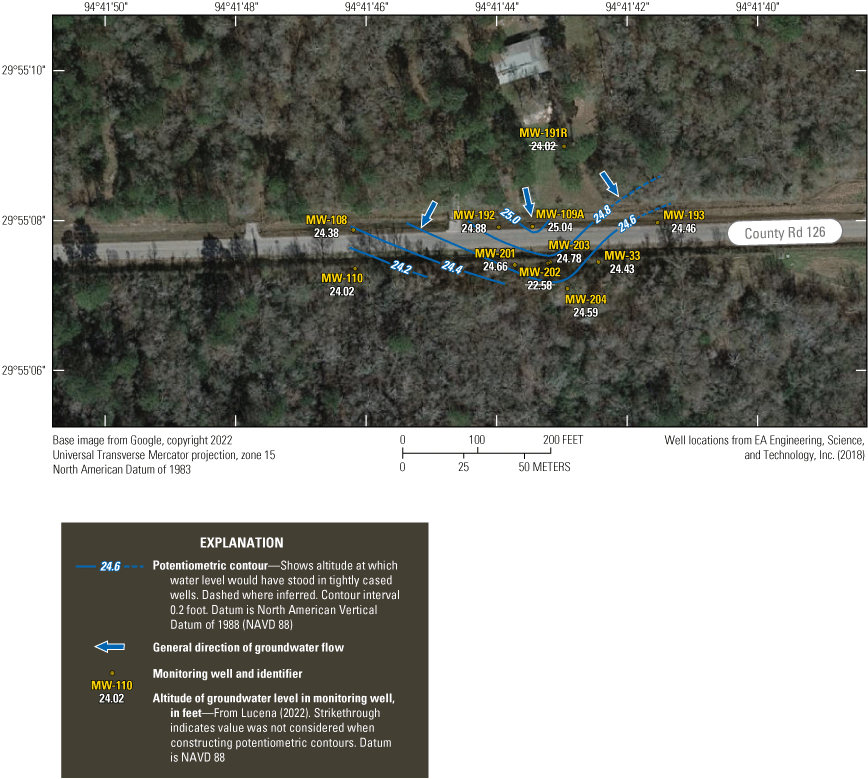
Approximate August 2020 groundwater-level altitudes and groundwater-flow direction in the Chicot aquifer in the area near well MW-109A at the Petro-Chemical Systems, Inc. (Turtle Bayou), Superfund site, Liberty County, Texas.
During the contouring process, the groundwater-level altitude at each well was compared to the groundwater-level altitudes of the surrounding wells to examine the data for anomalies or outliers. The groundwater-level altitude at one of the wells, MW-191R, did not seem to fit with the groundwater-level altitudes of the surrounding wells. In the absence of groundwater withdrawals, the regional groundwater-flow direction is south-southeasterly in the Chicot aquifer, toward the Gulf of Mexico coast, but the groundwater-level altitude measured in well MW-191R indicated that groundwater would flow in approximately a north-northwesterly direction. There are several potential explanations for this discrepancy in groundwater-flow direction. For example, the surveyed altitude of the top of the casing at well MW-191R could be erroneous, which seems plausible considering that the groundwater-level altitudes measured on different dates and provided in table 1 of the final addendum remedial action report (EA Engineering, Science, and Technology, Inc., 2018) indicate a similar north-northeasterly direction of groundwater flow toward well MW-191R. Alternatively, because well MW-191R is on a private residence, it is possible that a shallow domestic well is on the property near well MW-191R and that groundwater withdrawals from that domestic well have created a localized cone of depression that has reversed the groundwater-flow direction within its area of influence (which would include well MW-191R). Because of this discrepancy in flow direction, well MW-191R was also excluded from the contouring process.
Groundwater-level altitudes calculated for the nine remaining wells were contoured by hand at a 0.2-ft interval (fig. 4). The flow-direction arrows on figure 4 (oriented perpendicularly to the contours) indicate that groundwater in the eastern part of the MW-109 area likely flows in a south-southeasterly direction, coincident with the regional pattern in groundwater-flow direction in the Chicot aquifer in the absence of groundwater withdrawal (Braun and Ramage, 2020). However, in the western part of the MW-109 area, groundwater flows in a south-southwesterly direction, which indicates that there is likely a local groundwater divide that trends in a roughly north-south direction centered on well MW-109A. It is unclear what might be causing groundwater flow on the western side of the study area to deviate from the regional pattern of groundwater flow and instead flow to the south-southwest, but one possibility is that groundwater withdrawals associated with nearby industrial activities 1–3 mi south-southwest of the study area may have introduced an appreciable cone of depression and thus changed the flow direction.
Nature and Extent of Volatile and Semivolatile Organic Compounds
This section characterizes the nature and extent of VOC and SVOC contamination detected in samples collected from the PDB samplers that were placed within and above screened intervals of selected monitoring wells at the site. A discussion of the plume map that was delineated to reflect benzene concentrations is also included. VOCs are divided into two groups for discussion: (1) samples collected from PDB samplers placed within the screened intervals and (2) samples collected from PDB samplers placed above the screened intervals. All SVOC samples will be discussed collectively even though samples collected from well MW-202 were collected above the screened interval.
The data from the PDB samplers deployed during this sampling event indicated that there are some differences in concentrations within the screened intervals, although not large differences. Because the greatest concentration of benzene in well MW-109A was detected in the sample collected near the top of the screened interval, it may be beneficial for samples to be collected near the top of the screened interval in future sampling events.
Volatile Organic Compounds
Of the 51 VOCs analyzed, 13 were detected in 1 or more wells at concentrations less than 100 µg/L except at well MW-109A, where benzene was detected at concentrations of 42,000 and 65,000 µg/L and ethylbenzene was detected at concentrations greater than or equal to 100 µg/L in both samples collected within the screened interval (Lucena, 2022). Because of the high concentrations of VOCs in well MW-109A, the samples (from each depth interval) required dilution by a factor of 100 prior to analysis of all analytes in the VOC schedule used by the laboratory (except for benzene, which was diluted by a factor of 5,000). As a result, the CRQLs associated with VOC analyses at well MW-109A were 100 times the values in samples collected in the 10 remaining wells and 5,000 times in the case of benzene relative to the remaining wells (Lucena, 2022). The elevated CRQLs associated with well MW-109A may have prevented the detection (or estimation) of VOCs that were present at concentrations less than approximately 10 µg/L; however, the inability to detect VOCs at concentrations less than 10 µg/L in well MW-109A did not appreciably affect the interpretation of the data, which was primarily focused on benzene. Well MW-109A was the only well without a detection of acetone, but the CRQL for acetone in this well (500 µg/L) was greater than the measured acetone concentrations in the 10 remaining wells because the VOC sample required dilution to enable quantification of the elevated benzene concentrations during analysis. Acetone was detected at all depth intervals in each of the remaining wells, and concentrations ranged from 19 to 43 µg/L in samples collected above the screened interval and from 15 to 37 µg/L in samples collected within the screened interval, all of which are more than an order of magnitude less than the CRQL at well MW-109A. During previous sampling at the site (EA Engineering, Science, and Technology, Inc., 2018), acetone was not detected. Acetone, like methylene chloride, is a common laboratory contaminant since it is used as a cleaning and drying agent for laboratory glassware (EPA, 2014). However, the trip blanks and laboratory blanks did not indicate any detectable concentrations of acetone. The half-life of acetone is very short in the environment (22 days), and acetone typically does not sorb to soil (Agency for Toxic Substances and Disease Registry, 1994). Acetone is water soluble and can readily infiltrate into groundwater (Agency for Toxic Substances and Disease Registry, 1994). Because of the lack of documented acetone use at the site, it is unlikely that acetone would be a contaminant of concern.
Benzene, which was identified as 1 of the principal contaminants of concern by EA Engineering, Science, and Technology, Inc. (2019), was detected in only 4 of the 11 wells sampled, and benzene concentrations in 2 of these 4 wells were low enough that they could only be estimated (Lucena, 2022) (fig. 5). A benzene plume map was generated, in which the concentrations depicted on the map represent the maximum concentrations in PDB samples obtained within the screened interval in each well; nondetects (values less than the method detection limit) (EPA, 1997, 2014) were not considered during averaging, and estimated values were treated as measured values (figs. 5 and 6). As has been the case historically (EA Engineering, Science, and Technology, Inc., 2018), the benzene plume is centered on well MW-109A, and concentrations decrease radially from the well within relatively short distances (not detected outside of an approximately 100-ft radius). The plume is oriented along a line that trends in a south-southeasterly direction that is coincident with the groundwater-flow direction depicted near well MW-109A on figure 4.
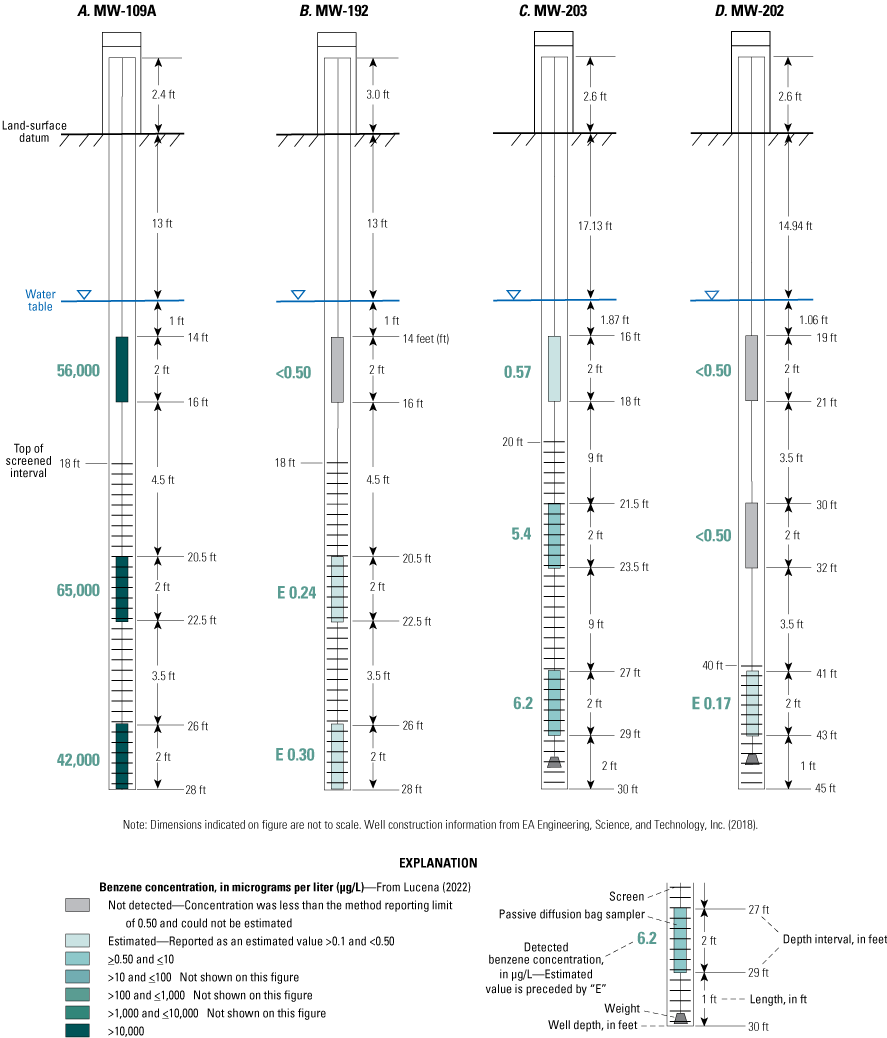
Benzene concentrations in groundwater samples collected from passive diffusion bag samplers deployed at three discrete depth intervals in monitoring wells A, MW-109A, B, MW-192, C, MW-203, and D, MW-202 in the area near well MW-109A at the Petro-Chemical Systems, Inc. (Turtle Bayou), Superfund site, Liberty County, Texas, in August and September 2020.
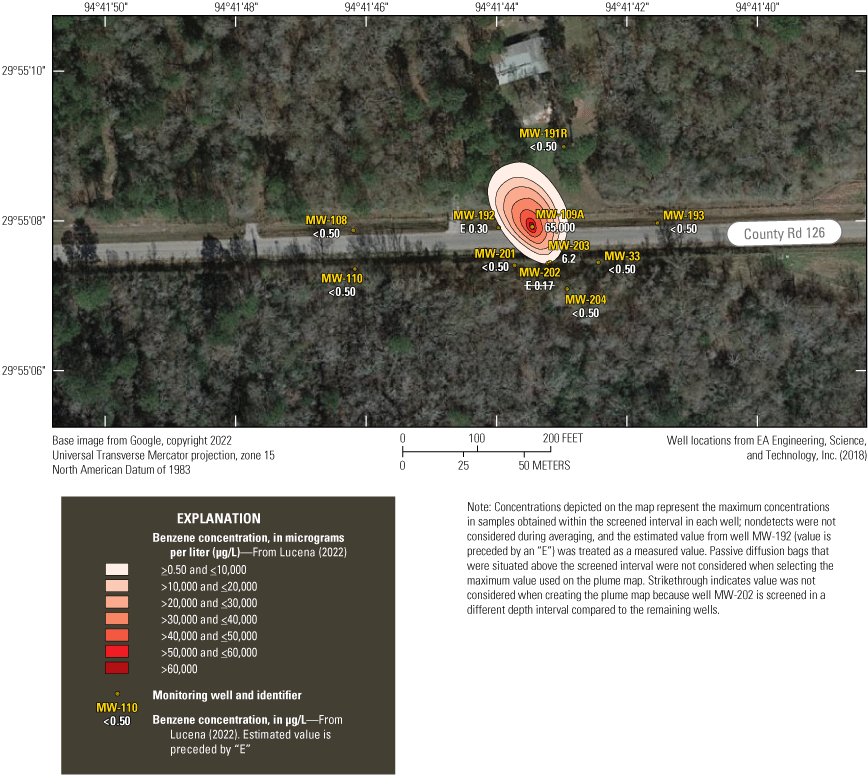
Benzene plume based on measured concentrations in groundwater samples collected from passive diffusion bag samplers deployed in monitoring wells in the area near well MW-109A at the Petro-Chemical Systems, Inc. (Turtle Bayou), Superfund site, Liberty County, Texas, in August and September 2020.
The concentrations of benzene detected in samples from well MW-109A in June 2016 and August 2018 were 137,000 and 94,700 µg/L, respectively (EA Engineering, Science, and Technology, Inc., 2018). The concentrations of benzene detected in well MW-109A from the August and September 2020 samples were 65,000 µg/L (depth interval of 20.5–22.5 ft) and 42,000 µg/L (depth interval of 26–28 ft) in the samples collected within the screened interval and 56,000 µg/L (depth interval of 14–16 ft) from the sample collected above the screened interval (fig. 5) (Lucena, 2022). Although sampling methodologies differed (a HydraSleeve was used in both June 2016 and August 2018, and PDB samplers were used in August and September 2020) and information related to sampling depth intervals associated with the June 2016 and August 2018 sampling events is unknown, on the basis of the collective analytical results from June 2016, August 2018, and August and September 2020, it appears that the benzene concentrations in well MW-109A are decreasing with time. Well MW-203 is downgradient from well MW-109A and in the past (2016) has had detections of benzene greater than 9,000 µg/L (EA Engineering, Science, and Technology, Inc., 2018). The benzene concentrations in the samples obtained from well MW-203 in August 2018 (EA Engineering, Science, and Technology, Inc., 2018) and in August and September 2020 (average of PDB samplers within the screened interval; Lucena, 2022) were 20.9 and 5.8 µg/L, respectively.
There were no consistent patterns among VOC concentrations of individual analytes detected in samples collected at different depth intervals either within the screened interval or above the screened interval at the same well. However, in almost all cases, concentrations of a specific analyte differed by less than an order of magnitude between different depth intervals sampled at a well either within the screened interval or above the screened interval.
Some of the major findings from the SAP by EA Engineering, Science, and Technology, Inc. (2019), were reviewed in comparison with the data collected and analyzed for this report. For example, the SAP states that data collected within the area near well MW-109A indicate that “the extent of groundwater contamination is limited (based on the results of groundwater sampling conducted in surrounding permanent and temporary wells)” (EA Engineering, Science, and Technology, Inc., 2019, p. 5). The findings described in this report seem to confirm this assertion. As shown on the benzene plume map (fig. 6), benzene contamination in the aquifer appears to be concentrated near well MW-109A and is reduced by a minimum of four orders of magnitude within a 100-ft radius. In addition, concentrations of benzene decreased over time in samples collected in 2016 and 2018 (EA Engineering, Science, and Technology, Inc., 2018) and in 2020 (Lucena, 2022) at wells MW-109A and MW-203. The SAP (EA Engineering, Science, and Technology, Inc., 2019, p. 6) also stated that “a review of the groundwater analytical data, in conjunction with the predicted groundwater flow and spatial distribution of wells, indicates a potential data gap in the groundwater monitoring well network to the south of MW-109A.” Because of the groundwater-flow direction near well MW-109A, it appears that the well nest (wells MW-202 and MW-203) is directly downgradient from well MW-109A (fig. 4). The benzene data seem to confirm the assertion that wells MW-202 and MW-203 are directly downgradient from well MW-109A because benzene was detected in both well MW-202 and well MW-203 but was not detected in well MW-201, which is about 60 ft to the west of well MW-202 (fig. 6). The findings in this report appear to indicate that the coverage provided by the groundwater-monitoring network south of well MW-109A is sufficient, particularly considering the limited options for drilling south of that well, assuming that drilling through County Road 126 (Frontier Park Road) would not be permitted.
Semivolatile Organic Compounds
Of the 68 SVOCs listed, 10 were detected in 1 or more wells, and 9 of the 10 were detected in well MW-109A (Lucena, 2022). SVOC concentrations were typically less than 100 µg/L. The exceptions were caprolactam, which was detected at concentrations greater than 100 µg/L in four wells (MW-109A, MW-193, MW-192, and MW-191R), and naphthalene, which was detected only in the sample from well MW-109A but at a concentration of 1,100 µg/L (Lucena, 2022). Dimethyl phthalate was detected in all 11 wells at concentrations less than 10 µg/L, and caprolactam was detected in 10 of the 11 wells (all but MW-108) at concentrations less than 500 µg/L (Lucena, 2022). The data available from previous sampling events did not include caprolactam or dimethyl phthalate; thus, no comparison can be made for those compounds. However, when comparing naphthalene and phenol concentrations detected in samples collected from well MW-109A in previous assessments to those in this assessment, concentrations of both compounds appear to be decreasing over time (EA Engineering, Science, and Technology, Inc., 2018; Lucena, 2022).
Comparison of Volatile and Semivolatile Organic Compounds
As stated in the SAP by EA Engineering, Science, and Technology, Inc. (2019), the majority of detected VOCs and SVOCs in groundwater in June 2016 and August 2018 were from samples collected from well MW-109A, with principal contaminants of concern being benzene, naphthalene, and toluene. Most of this statement still seems accurate on the basis of the findings of this assessment. Benzene is still the principal contaminant of concern, as it persists at concentrations exceeding 53,000 µg/L (the approximate average of two depth intervals sampled in the screened interval at well MW-109A in August and September 2020; Lucena, 2022). Naphthalene also seems to be a contaminant of concern, as it was detected at the greatest concentration of any SVOC analyte (1,100 µg/L in the sample from well MW-109A in August 2020; Lucena, 2022). Toluene, however, was only detected in samples collected from three wells at concentrations less than the CRQL (Lucena, 2022), which raises the question of whether toluene should still be considered a contaminant of concern. In two of the three wells where toluene was detected, it was only present in one of the three depth intervals and at concentrations less than 0.15 µg/L in both cases (Lucena, 2022). Caprolactam, which was not analyzed in the previous sampling events in 2016 and 2018, may have emerged as a new contaminant of concern because it was detected in 10 of the 11 wells (all but MW-108) and at concentrations greater than 250 µg/L in 4 wells (MW-109A, MW-193, MW-192, and MW-191R) in August and September 2020 (Lucena, 2022). However, there is not an established maximum contaminant level for caprolactam, and the measured concentrations are less than Texas Risk Reduction Program protective concentration levels (Texas Commission on Environmental Quality, 2022).
Summary
The Petro-Chemical Systems, Inc. (Turtle Bayou), Superfund site (hereinafter referred to as “the site”) is 15 miles southeast of Liberty, Texas, in Liberty County. Improper disposal of waste oils led to contamination of soil and groundwater at the site. The U.S. Environmental Protection Agency Superfund Redevelopment Program website explains that waste oils from nearby petroleum refining activities were disposed of illegally at the site in unlined pits and on County Road 126 (also known as Frontier Park Road).
In cooperation with the U.S. Environmental Protection Agency, the U.S. Geological Survey collected water-quality samples from monitoring wells at the site in August and September 2020 and compared the water-quality results to the results from previous water-quality sampling events in June 2016 and August 2018 with a focus on benzene concentrations. The part of the site that was the focus of this assessment is near well MW-109A, which is hereinafter referred to as the “MW-109 area.” In addition to well MW-109A, the MW-109 area includes 10 other monitoring wells that were sampled as part of this assessment.
Polyethylene-based passive diffusion bag (PDB) samplers were deployed at 3 discrete depth intervals in each of the 11 monitoring wells to collect volatile organic compound samples. PDB samplers were left in place for 2 weeks to provide sufficient time for diffusion and equilibration between the water contained within each of the bags and the water inside the well casings.
On the basis of the evaluation of water-level altitudes during groundwater-contour development, several potential anomalies were identified. One anomaly could be related to the reported altitude of the top of the casing at well MW-191R, which would benefit from verification. If the altitude of the top of the casing at well MW-191R is correct, this indicates the possible occurrence of local groundwater withdrawals that could be affecting groundwater flow in this area. Flow direction in the western part of the site, which deviates from the regional pattern of groundwater flow, may also be affected by nearby groundwater withdrawals.
Of the 51 volatile organic compounds analyzed, 13 were detected in groundwater samples from 1 or more wells. In all but 1 well, MW-109A, concentrations of volatile organic compounds were less than 100 micrograms per liter (µg/L). The data from the PDB samplers deployed during this sampling event indicated that there are some differences in concentrations within the screened intervals, although not large differences. Because the greatest concentration of benzene in well MW-109A was detected in the sample collected near the top of the screened interval, it may be beneficial for samples to be collected near the top of the screened interval in future sampling events. Some of the major findings from the sampling and analysis plan (SAP) for the site were reviewed in comparison with the data collected and analyzed for this report. For example, the SAP states that data collected within the MW-109 area indicate that the groundwater contamination extent is limited (based on the results of groundwater sampling conducted in permanent and temporary wells in the surrounding area). The findings described in this report seem to confirm this assertion. On the basis of the benzene plume map generated for this report, benzene contamination in groundwater at the site appears to be concentrated near well MW-109A and is reduced by a minimum of four orders of magnitude within a 100-foot radius. In addition, concentrations of benzene decreased over time in samples collected in 2016, 2018, and 2020 at wells MW-109A and MW-203. The SAP also stated that groundwater analytical and flow direction data, when considered in conjunction with the spatial distribution of wells, indicate a possible data gap in the groundwater-monitoring network south of well MW-109A. Because of the groundwater-flow direction near well MW-109A, it appears that the well nest (wells MW-202 and MW-203) is directly downgradient from well MW-109A. The benzene data seem to confirm the assertion that wells MW-202 and MW-203 are directly downgradient of well MW-109A because benzene was detected in both well MW-202 and well MW-203 but was not detected in well MW-201, which is about 60 feet to the west of well MW-202. The findings in this report appear to indicate that the coverage provided by the groundwater-monitoring well network south of well MW-109A is sufficient, particularly considering the limited options for drilling south of well MW-109A, assuming that drilling through County Road 126 (Frontier Park Road) would not be permitted.
The SAP also stated that the majority of detected volatile and semivolatile organic compounds in groundwater in June 2016 and August 2018 were from samples collected from well MW-109A, with principal contaminants of concern being benzene, naphthalene, and toluene. Most of this statement still seems accurate on the basis of the findings associated with this assessment. Benzene is still the principal contaminant of concern, as it persists at concentrations exceeding 53,000 µg/L (the approximate average of two depth intervals sampled in the screened interval at well MW-109A). Naphthalene also seems to be a contaminant of concern, as it was detected at the greatest concentration of any semivolatile organic compound analyte (1,100 µg/L in the sample from well MW-109A). Toluene, however, was detected in samples collected from only three wells and at concentrations less than the contract-required quantitation limit, which raises the question of whether toluene should still be considered a contaminant of concern. In two of the three wells where toluene could be detected, it was present in only one of the three depth intervals and at concentrations less than 0.15 µg/L in both cases. Caprolactam, which was not analyzed in previous sampling events, may have emerged as a new contaminant of concern because in this assessment it was detected in 10 of the 11 wells (all but MW-108) and at concentrations greater than 250 µg/L in 4 wells (MW-109A, MW-193, MW-192, and MW-191R). However, there is not an established maximum contaminant level for caprolactam, and the measured concentrations are less than the protective concentration levels established by the State of Texas.
References Cited
Agency for Toxic Substances and Disease Registry, 1994, Toxicological profile for acetone—Draft for public comment, July 2021: U.S. Department of Health and Human Services, 255 p., accessed April 12, 2022, at https://www.atsdr.cdc.gov/toxprofiles/tp21.pdf.
Braun, C.L., and Ramage, J.K., 2020, Status of groundwater-level altitudes and long-term groundwater-level changes in the Chicot, Evangeline, and Jasper aquifers, Houston-Galveston region, Texas, 2020: U.S. Geological Survey Scientific Investigations Report 2020–5089, 18 p., accessed April 12, 2022, at https://doi.org/10.3133/sir20205089.
Casarez, I.R., 2020, Aquifer extents in the coastal lowlands aquifer system regional groundwater availability study area in Texas, Louisiana, Mississippi, Alabama, and Florida: U.S. Geological Survey data release, accessed September 20, 2022, at https://doi.org/10.5066/P9BH2KG2.
Cunningham, W.L., and Schalk, C.W., comps., 2011, Groundwater technical procedures of the U.S. Geological Survey: U.S. Geological Survey Techniques and Methods, book 1, chap. A1, 151 p., accessed April 12, 2022, at https://pubs.usgs.gov/tm/1a1/.
EA Engineering, Science, and Technology, Inc., 2018, Final addendum remedial action report—Petro-Chemical Systems, Inc. (Turtle Bayou) site Liberty County, Texas: U.S. Environmental Protection Agency, Region 6, EPA identification no. TXD980873350, prepared by EA Engineering, Science, and Technology, Inc., September 2018, 39 p., accessed September 26, 2022, at https://semspub.epa.gov/work/06/100012070.pdf.
EA Engineering, Science, and Technology, Inc., 2019, Sampling and analysis plan for Petro-Chemical Systems, Inc. (Turtle Bayou) site Liberty County, Texas: U.S. Environmental Protection Agency, Region 6, prepared by EA Engineering, Science, and Technology, Inc., March 2019, 1,132 p., accessed September 26, 2022, at https://semspub.epa.gov/work/06/100016435.pdf.
HydraSleeve, 2021, Why the HydraSleeve?: HydraSleeve web page, accessed December 13, 2021, at https://www.hydrasleeve.com/why-choose-the-hydrasleeve/learn-about-the-hydrasleeve.
Imbrigiotta, T.E., and Harte, P.T., 2020, Passive sampling of groundwater wells for determination of water chemistry: U.S. Geological Survey Techniques and Methods, chap. 8, section D, book 1, 80 p., accessed April 12, 2022, at https://doi.org/10.3133/tm1D8.
Lucena, Z., 2022, Groundwater-level altitudes and volatile and semivolatile organic compound concentrations at the Petro-Chemical Systems, Inc. (Turtle Bayou) Superfund site, Liberty County, Texas, 2020: U.S. Geological Survey data release, https://doi.org/10.5066/P9GX8YU7.
McHugh, T.E., Kulkarni, P.R., Beckley, L.M., Newell, C.J., and Zumbro, M., 2015, Negative bias and increased variability in VOC concentrations using the HydraSleeve in monitoring wells: Ground Water Monitoring and Remediation, v. 36, no. 1, p. 79–87, accessed November 30, 2021, at https://doi.org/10.1111/gwmr.12141.
Mueller, D.K., Schertz, T.L., Martin, J.D., and Sandstrom, M.W., 2015, Design, analysis, and interpretation of field quality-control data for water-sampling projects: U.S. Geological Survey Techniques and Methods, book 4, chap. C4, 54 p., accessed April 12, 2022, at https://doi.org/10.3133/tm4C4.
Texas Commission on Environmental Quality, 2022, TRRP protective concentration levels—March 2022 tier 1 PCL tables: Texas Commission on Environmental Quality web page, accessed September 19, 2022, at https://www.tceq.texas.gov/remediation/trrp/trrppcls.html.
U.S. Environmental Protection Agency [EPA], 1997, Guidelines establishing test procedures for the analysis of pollutants; EPA Method 1613, app. B, part 136, of Definition and procedures for the determination of the method detection limit (revised July 1, 1997): U.S. Code of Federal Regulations, Title 40, p. 265–267, accessed April 13, 2022, at https://www.federalregister.gov/documents/1997/09/15/97-23841/guidelines-establishing-test-procedures-for-the-analysis-of-pollutants-epa-method-1613#:~:text=Guidelines%20Establishing%20Test%20Procedures%20for%20the%20Analysis%20of,the%20Environmental%20Protection%20Agency%20on%2009%2F15%2F1997%20Published%20Document?msclkid=e90a0563bb2a11ecb5322c1e9d2d5ef4.
U.S. Environmental Protection Agency [EPA], 2012, Explanation of significant differences, Petro-Chemical Systems, Inc. (Turtle Bayou) site, Liberty County, Texas: U.S. Environmental Protection Agency web page, accessed April 13, 2022, at https://semspub.epa.gov/work/06/670602.pdf.
U.S. Environmental Protection Agency [EPA], 2014, Laboratory data review for the non-chemist: U.S. Environmental Protection Agency, 59 p., accessed April 12, 2022, at https://clu-in.org/conf/tio/rcraexpert_100516/slides/Data-Review-Manual-110114.pdf.
U.S. Environmental Protection Agency [EPA], 2016a, Fourth five-year review report for Petro-Chemical Systems, Inc. (Turtle Bayou) Superfund site, Liberty County, Texas: U.S. Environmental Protection Agency, 92 p., accessed April 13, 2022, at https://semspub.epa.gov/work/06/500023244.pdf.
U.S. Environmental Protection Agency [EPA], 2016b, Exhibit D—Introduction to organic analytical methods of EPA Contract Laboratory Program statement of work for organic Superfund methods multi-media, multi concentration, SOM02.4: U.S. Environmental Protection Agency, 384 p., accessed April 13, 2022, at https://19january2017snapshot.epa.gov/sites/production/files/2016-11/documents/som24d.pdf.
U.S. Environmental Protection Agency [EPA], 2021, Site profile—Scribe—EPA OSC response: U.S. Environmental Protection Agency web page, accessed November 30, 2021, at https://response.epa.gov/site/site_profile.aspx?site_id=ScribeGIS&msclkid=c0043975ba6c11ecb422426fb755b6d4.
U.S. Environmental Protection Agency [EPA], 2022a, Superfund site—Petro-Chemical Systems, Inc. (Turtle Bayou) Liberty, TX: U.S. Environmental Protection Agency web page, accessed March 28, 2022, at https://cumulis.epa.gov/supercpad/SiteProfiles/index.cfm?fuseaction=second.Cleanup&id=0602957.
U.S. Environmental Protection Agency [EPA], 2022b, Superfund—National Priorities List (NPL): U.S. Environmental Protection Agency web page, accessed March 24, 2022, at https://www.epa.gov/superfund/superfund-national-priorities-list-npl.
U.S. Geological Survey [USGS], [variously dated], National field manual for the collection of water-quality data: U.S. Geological Survey Techniques of Water-Resources Investigations, book 9, chaps. A1–A9. [Also available at https://doi.org/10.3133/twri09.]
Xylem Inc., 2022, YSI 6920 V2-2 multiparameter water quality sonde: YSI Inc. web page, accessed April 13, 2022, at https://www.ysi.com/6920-v2-2.
Conversion Factors
Datum
Vertical coordinate information is referenced to the North American Vertical Datum of 1988 (NAVD 88).
Horizontal coordinate information is referenced to the North American Datum of 1983 (NAD 83).
Altitude, as used in this report, refers to distance above the vertical datum.
Supplemental Information
Specific conductance is given in microsiemens per centimeter at 25 degrees Celsius (µS/cm at 25 °C).
Concentrations of chemical contaminants in water are given in micrograms per liter (µg/L [parts per billion]).
Abbreviations
bgs
below ground surface
CLP
Contract Laboratory Program
CRQL
contract-required quantitation limit
EPA
U.S. Environmental Protection Agency
ISCO
in situ chemical oxidation
OU
operable unit
PDB
passive diffusion bag
ROD
Record of Decision
RPD
relative percent difference
RPM
remedial project manager
SAP
sampling and analysis plan
SVOC
semivolatile organic compound
USGS
U.S. Geological Survey
VOA
volatile organic analysis
VOC
volatile organic compound
For more information about this publication, contact
Director, Oklahoma-Texas Water Science Center
U.S. Geological Survey
1505 Ferguson Lane
Austin, TX 78754–4501
For additional information, visit
https://www.usgs.gov/centers/ot-water
Publishing support provided by
Lafayette Publishing Service Center
Suggested Citation
Braun, C.L., and Becher, K.D., 2022, Groundwater-level altitudes and groundwater-flow direction and nature and extent of volatile and semivolatile organic compounds at Petro-Chemical Systems, Inc. (Turtle Bayou), Superfund site, Liberty County, Texas, 2020: U.S. Geological Survey Scientific Investigations Report 2022–5104, 17 p., https://doi.org/10.3133/sir20225104.
ISSN: 2328-0328 (online)
Study Area
| Publication type | Report |
|---|---|
| Publication Subtype | USGS Numbered Series |
| Title | Groundwater-level altitudes and groundwater-flow direction and nature and extent of volatile and semivolatile organic compounds at Petro-Chemical Systems, Inc. (Turtle Bayou), Superfund site, Liberty County, Texas, 2020 |
| Series title | Scientific Investigations Report |
| Series number | 2022-5104 |
| DOI | 10.3133/sir20225104 |
| Year Published | 2022 |
| Language | English |
| Publisher | U.S. Geological Survey |
| Publisher location | Reston, VA |
| Contributing office(s) | Oklahoma-Texas Water Science Center |
| Description | Report: v, 17 p.; Data release |
| Country | United States |
| State | Texas |
| County | Liberty County |
| Other Geospatial | Petro-Chemical Systems, Inc. (Turtle Bayou), Superfund site |
| Online Only (Y/N) | Y |
| Google Analytic Metrics | Metrics page |