

Nutrient and Suspended-Sediment Concentrations, Loads, and Yields in Upper Macoupin Creek, Illinois, 2017–21
Links
- Document: Report (2.40 MB pdf) , HTML , XML
- Dataset: USGS National Water Information System database —USGS water data for the Nation
- Data Release: USGS data release —Nutrient and sediment concentrations, loads, and yields in the Upper Macoupin Creek watershed, water years 2018–2021
- Download citation as: RIS | Dublin Core
Acknowledgments
This project was supported through funding and cooperation from the Macoupin County Soil and Water Conservation District, American Farmland Trust, and in collaboration with the Walton Family Foundation, and Mosaic Foundation. Waterborne Environmental personnel were very much appreciated for their assistance with weekly sample collection.
The author acknowledges Stephen Kalkhoff and Lindsey Schafer of the U.S. Geological Survey for their technical reviews of the report.
Abstract
The U.S. Geological Survey, in cooperation with the Macoupin County Soil and Water Conservation District and the American Farmland Trust, undertook a monitoring effort from 2017 to 2021 in the upper Macoupin Creek watershed. The monitoring effort was to determine and characterize nitrogen, phosphorus, and suspended-sediment concentrations, loads, and yields for a 566.7 square kilometer area of the Macoupin Creek watershed at two locations on upper Macoupin Creek bracketing a segment of the watershed where increased implementation of conservation land-use practices was planned. Two monitoring stations were established, consisting of an upstream site (Macoupin Creek at Highway 108 near Carlinville, Illinois; U.S. Geological Survey streamgage 05586647) and a downstream site (Macoupin Creek at Highway 111 near Summerville, Ill.; U.S. Geological Survey streamgage 05586745). Data collected at these stations included continuous stream discharge and periodic samples for nutrients and suspended sediment. A Weighted Regressions on Time, Discharge, and Season–Kalman model was implemented to estimate daily concentrations for nitrate plus nitrite, total phosphorus, and suspended sediment for both monitoring stations. These daily concentrations were used in conjunction with the continuous stream discharge data to derive estimates of constituent flux, loads, and yields.
During the study period, the study area subbasin of the upper Macoupin Creek watershed reduced downstream nitrate and total phosphorus cummulative yields by approximately 54 and 21 percent, respectively; however, the cummulative yield of suspended sediment increased by approximately 10 percent from inputs within the study area. These data indicate that nitrate and phosphorus transport is greater from the upstream subbasin and being diluted in the combined subbasin by lower transport from the study area, whereas suspended sediment is being contributed from the study area reach, presumably through surface runoff and streambank and streambed erosion.
Introduction
Illinois rivers contribute 20 percent of the nitrogen load and 11 percent of the phosphorus load, but only 7 percent of the water discharge, to the Gulf of Mexico through the Mississippi River (David and others, 2014). The Illinois Nutrient Loss Reduction Strategy (Illinois Environmental Protection Agency, 2017) identifies the Macoupin Creek 8-digit subbasin Hydrologic Unit Code (HUC; 07130012) watershed as one of the three highest phosphorus-yielding watersheds in the State and outlines a voluntary approach to stemming nutrient loss through widespread adoption of agricultural conservation management practices.
With limited available funding, partnerships are critical for the implementation of practices and programs to address excess nutrient and sediment inputs to the watershed, and such a partnership was formed in the upper Macoupin Creek watershed. The partnership, led by American Farmland Trust, was supported as a Regional Conservation Partnership Program (RCPP) by the U.S. Department of Agriculture NRCS. With this designation, $1 million over 5 years (from 2017 to 2022) in Federal cost-share program financing was designated for farmers in the watershed to implement phosphorus-loss reduction and soil-health practices. An additional $750,000 in Federal cost-share program financing was available from the U.S. Department of Agriculture NRCS Mississippi River Basin Healthy Watersheds Initiatives Program during the same time period for three subwatersheds within the upper Macoupin Creek project area. The goals of the RCPP and Mississippi River Basin Healthy Watersheds Initiatives Program were to improve awareness and understanding of (1) watershed issues, (2) the Illinois Nutrient Loss Reduction Strategy, and (3) the benefits of improved soil health. Additional objectives were to increase conservation activities by 40 percent, to stabilize soils on agricultural and forest lands, and to ultimately achieve a phosphorus-loss reduction of at least 136 kilograms per year from the study area watershed (Northwater Consulting and American Farmland Trust, 2019).
In support of these objectives, the USGS partnered with the Macoupin County Soil and Water Conservation District and American Farmland Trust to monitor stream discharge and collect water samples to analyze for nutrient and suspended-sediment concentrations from 2017 to 2021.
The study area for this monitoring effort consisted of the portion of the upper Macoupin Creek watershed between Highway 108 near Carlinville, Illinois, and Highway 111 near Summerville, Ill., including six 12-digit HUC watersheds with a cumulative area of 566.7 square kilometers (km2). Five 12-digit HUC watersheds, with a cumulative area of 419.6 km2, are tributaries to the Macoupin Creek upstream from the study area and U.S. Geological Survey (USGS) streamgage 05586647 (fig. 1). The study area and upstream subbasin are characterized by rolling topography and the dominant land uses are row-crop agriculture and forest. Land cover differences are small between subbasins; primarily cultivated crops cover 80 percent of the upstream basin compared to 60 percent of the study area, and 10 percent of the upstream basin is forested land compared to 30 percent of the study area (Dewitz, 2019). A comprehensive description of the Macoupin Creek watershed is provided by Natural Resources Conservation Service (NRCS; 2008).
Concurrent with this monitoring effort, American Farm Trust and Macoupin Soil and Water Conservation District conducted conservation management education and implementation activities included landowner and agricultural producer outreach (field days, workshops, farmer interviews), soil transect surveys, water-quality monitoring, a partnership with local retailers to offer reduced-rate custom conservation tillage and cover crop application, and a partnership with Blackburn College to raise awareness of phosphorus and sediment loading from unmanaged woodlands.
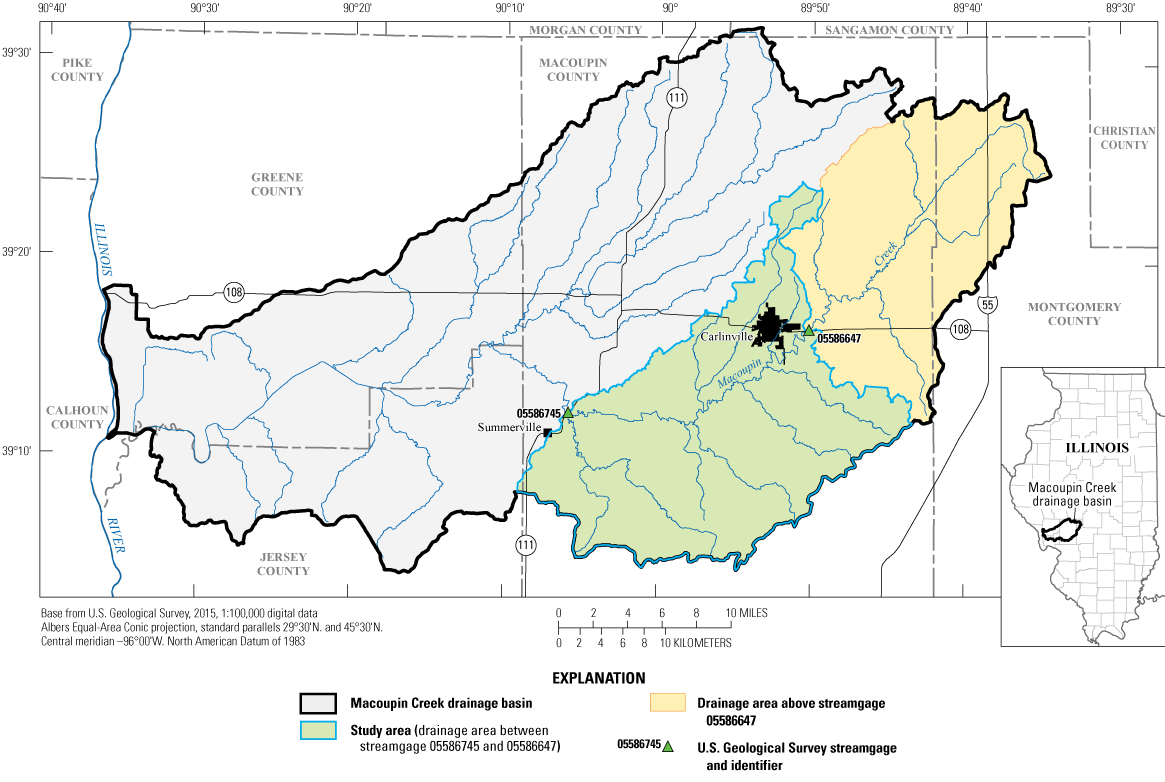
The Macoupin Creek watershed and upper Macoupin Creek study area in Illinois.
Purpose and Scope
The primary purpose of this report is to present nitrogen (nitrate and nitrite), phosphorus, and suspended-sediment concentrations and loads at two locations on upper Macoupin Creek and use the findings to document the effect of a 5-year RCPP effort to reduce nitrogen, phosphorus, and sediment transport. Results from this study could be used to increase understanding of the effectiveness of a multicomponent approach to reducing nitrogen, phosphorus, and sediment transport in Macoupin Creek, as well as other streams in Illinois, the Midwest, and other comparable agricultural-dominated watersheds throughout the Nation.
Methods
Macoupin Creek was monitored at two locations: one monitoring station at the upstream boundary of the study area (Macoupin Creek at Highway 108 near Carlinville, Ill.; USGS streamgage 05586647) and one monitoring station at the downstream boundary (Macoupin Creek at Highway 111 near Summerville, Ill.; USGS streamgage 05586745) (fig. 1, table 1). These streamgages were monitored to (1) document the concentrations and loads of nutrients and suspended sediment entering the study area, (2) determine the changes in concentrations and loads in the creek within the study area, (3) compute the addition or reduction in constituent loads from the study area, and (4) provide data to determine the effectiveness of best management practice (BMP) implementation within the study area throughout the monitoring period. The in-stream monitoring effort to assess the effectiveness of nutrient-reduction practices implemented in the study area include continuous stream discharge and routine and flow-event focused water-quality sample collection at the two study sites (fig. 1) from water year 2018 to water year 2021. Samples were analyzed for dissolved nitrate plus nitrite nitrogen, total phosphorus, dissolved orthophosphorus, and suspended-sediment concentrations. Results from this monitoring were used to determine the concentration and loading characteristics of Macoupin Creek and the contributions of these constituents from the upstream watershed (upstream subbasin), study area watershed (study area subbasin), and the downstream watershed (downstream subbasin).
Discharge Measurement
Two monitoring stations were established in October 2017: one at the upstream streamgage (05586647) and one at the downstream streamgage (05586745). Discharge measurements were made according to established USGS protocols (Turnipseed and Sauer, 2010) using an Acoustical Doppler Current Profiler tethered and pulled across the stream channel from the bridge or by wading and using a Sontek Flowtracker handheld Acoustic Doppler Velocimeter. Continuous record (15-minute interval) of the stream stage at each station was measured using a Design Analysis H-3613 radar unit and a Sutron Satlink 2 data-collection platform. Daily discharge values were calculated for the two monitoring stations according to established USGS methods and procedures (Turnipseed and Sauer, 2010). Discharge was measured periodically at each site, then correlated with stage readings to create a surrogate model used to report continuous discharge values. Wire-weight gages were also installed on the downstream side of the bridge at each location and functioned as the base gages. General site information of the monitoring stations is shown in table 1. Stage and discharge measurements for each site are available in the USGS National Water Information System database (U.S. Geological Survey, 2022a) using the station numbers provided in table 1.
Water-Quality Sample Collection and Analyses
Approximately 140 water samples were collected at each monitoring station between October 2017 and August 2021. Samples were collected on a weekly schedule and during select high-flow events. Sampling frequency was sometimes extended to a biweekly schedule when variance in concentrations was expected to be minimal, such as during periods of extended low flow or of sustained normal flow conditions, primarily during late fall and winter. Sample collection was typically at the center of the creek using a weighted-bottle sampler suspended from the bridge with a rope and lowered and raised by hand (U.S. Geological Survey, variously dated). The openings on the polypropylene sample-collection bottles were sized to collect water from the entire water column under various flow conditions and depths. Cross-section samples were collected during periods of high flow, higher stream velocities, and increased depth; these samples were collected using a DH-95 integrating sampler, a 4-wheel base and crane, and a polypropylene churn splitter (U.S. Geological Survey, variously dated).
Following collection, the water samples were stored in cooler on ice until processing and preservation before being shipped overnight in ice to the USGS National Water Quality Laboratory in Denver, Colorado, for analysis. Sample preparation and preservation included filtration of samples analyzed for the dissolved fraction (nitrate plus nitrite nitrogen and orthophosphorus) and the addition of sulfuric acid to samples analyzed for total phosphorus. Suspended-sediment samples were stored in the dark until shipment to the USGS Iowa Sediment Laboratory in Iowa City, Iowa.
Analytical methods for the sample analyses are given in table 2. References for descriptions of the analytical methods include Fishman (1993), Guy (1969), Patton and Kryskalla (2003, 2011).
Water-quality data collected for this study are available in the USGS National Water Information System database (U.S. Geological Survey, 2022a) using the station numbers provided in table 1.
Table 2.
Analytical methods used at the National Water Quality Laboratory and the Iowa City Sediment Laboratories.[NWIS, National Water Information System (U.S. Geological Survey, 2022a); N, nitrogen; P, Phosphorus]
Computation of Concentration, Flux, Loads, and Yields
Daily concentration and flux values of suspended sediment, phosphorus, and nitrate were computed using Weighted Regressions on Time, Discharge, and Season–Kalman (WRTDS–K; Zhang and Hirsch, 2019), which is part of the Exploration and Graphics for RivEr Trends (Hirsch and De Cicco, 2015) R-package incorporating continuous discharge and periodic water-quality constituent concentration data.
The default computation of daily concentration and flux estimates in Exploration and Graphics for RivEr Trends is completed using Weighted Regressions on Time, Discharge, and Season (WRTDS). This computation was calculated using a weighted regression model (eq. 1) for days on which a sample was collected, as shown in the following equation:
wherec
is concentration, in milligrams per liter;
β
are the regression coefficients;
q
is ln(Q) where Q is daily mean discharge, in cubic meter per second;
T
is time, in decimal years; and
ε
is the error (unexplained variation).
WRTDS calculates a bias correction factor (r) to estimate daily concentrations for days when a sample was not collected (Hirsch and De Cicco, 2015). A modification to the original WRTDS model is WRTDS–K, which was used in this report to compute daily concentration and flux values. WRTDS–K differs from WRTDS in two notable ways. First, sampled values are substituted for model-derived daily concentration values for days when samples were collected, which results in no difference between model values and sample values. Laboratory-derived concentration values were used in this report instead of estimated values because the laboratory values reflect the most accurate environmental value. Second, residuals (r) are calculated from the differences between predicted concentrations and observed concentrations. The residuals (r) take the place of random error (ε) in the model (eq. 2). The resulting equation is applied between sampling dates, with weighted regression being applied between sample dates as compared to the entire period (Zhang and Hirsch, 2019):
wherec
is concentration, in milligrams per liter;
β
are the regression coefficients;
q
is ln(Q) where Q is daily mean discharge, in cubic meter per second;
T
is time, in decimal years; and
r
is the calculated bias correction factor.
The flux values, in kilograms per day, are then computed by multiplying the daily estimated concentration by discharge values. The term “load” is synonymous to flux but the time component is often stated at the onset (that is, daily loads, annual loads, and so forth). Loads are shown as annual amounts in kilograms within this report. Yields are the loads divided by the drainage area of the basin and are represented in kilograms per square kilometer. All modeled derived estimates of concentration and flux for nutrient and sediment data calculated for this study for stations listed in table 1 are available in a USGS data release (Garcia, 2023); additional discharge and sample data are available from the USGS National Water Information System database (U.S. Geological Survey, 2022b, c).
Constituent yields are an informative measure by which to evaluate nutrient contributions from different portions of the study area. Yields are derived by dividing the loads for each station by the respective drainage areas to provide a comparable value from which to compare areas of different drainage areas. Yields can be reported in different ways, represent different time periods, and provide information characterizing the transport of constituents during storm events, annually, or over longer periods of time.
Nutrient and Suspended-Sediment Concentrations, Loads, and Yields
Daily discharge values and water-quality sample collection dates for the two monitoring stations are shown in figure 2. The discharge for the upstream station (05586647) typically mirrored the variability and seasonality of the downstream station (05586745), although having generally lower discharge quantities, as would be expected given the smaller contributing drainage area. Total annual discharge quantities for the stations are reported in table 3. Total annual discharge at the upstream station (05586647) represented approximately 40 to 47 percent of the total annual discharge at the downstream station (05586745) for each water year, with the percentage contribution increasing approximately 2 percent per year during the monitoring period. Discharges were typically higher during the first half of each calendar year. Overall, discharge was relatively lower in water years 2018 and 2021 compared to water years 2019 and 2020 (fig. 2). Correlating with these discharge values, lower precipitation values were seen for water years 2018 and 2021 (National Weather Service, 2022). Cumulative precipitation for water years 2018 and 2021 was 44.7 and 45.9 inches, respectively. For water years 2019 and 2020, total annual precipitation was 54.7 and 50.1 inches, respectively. These values were gathered from the National Weather Service for the St. Louis area (National Weather Service, 2022) and are assumed to be representative of the study area. For constituent transport, the highest discharge storm events and annual discharges occurred in 2019 and 2020 (fig. 2); these discharges were significant factors for constituent loads and yields. The concentrations, loads, and yields will be described in the following sections.
Table 3.
Total annual discharge at the two Macoupin Creek monitoring stations for the 2018–21 water years. Data from U.S. Geological Survey (2022a).[WY, water year; NA, not applicable]
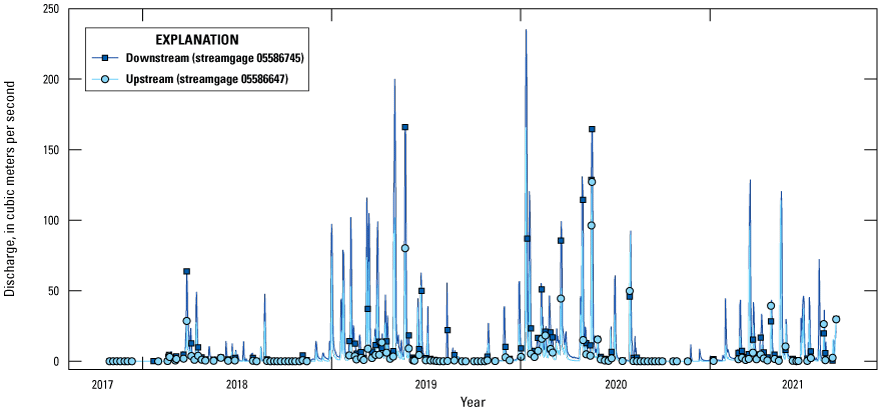
Time series of measured and computed discharge at Macoupin Creek at Highway 108 near Carlinville, Illinois (U.S. Geological Survey station number 05586647; upstream) and Macoupin Creek at Highway 111 near Summerville, Ill. (U.S. Geological Survey station number 05586745; downstream), 2017–21. Data from U.S. Geological Survey (2022a).
Concentrations
Approximately 140 water-quality samples were collected at each of the two monitoring stations during the study period. Summary statistics for the water-quality constituents (dissolved nitrate plus nitrite, total phosphorus, and suspended sediment) are shown in table 4 (hereafter, nitrate plus nitrite will be referred to simply as “nitrate”). The interquartile range (IQR) is the difference between the 75th percentile and the 25th percentile concentration values, represents the middle 50 percent of the concentration values, and indicates the variability of the concentrations. Nitrate and total phosphorus at the upstream station (05586647) had higher median concentrations (nitrate=3.04 milligrams per liter [mg/L], total phosphorus=0.25 mg/L) and IQR (nitrate=5.43 mg/L, total phosphorus=0.25 mg/L) concentrations than the median concentrations for samples collected at the downstream station (05586745) (nitrate=2.13 mg/L, total phosphorus=0.24 mg/L) and IQR (nitrate=3.51 mg/L, total phosphorus=0.21 mg/L). Conversely, the suspended-sediment median and IQR values for the downstream station (34.0 and 109.3 mg/L, respectively) were higher than for the upstream station (15.0 and 34.5 mg/L, respectively).
WRTDS–K was used to estimate concentrations for days on which a sample was not collected. Estimated daily concentrations of constituents for the two monitoring stations for the study period are shown in figure 3. Measured constituent concentrations by month for the study period are shown in figure 4.
Seasonal variability of nitrate concentrations can be seen in figures 3A and 4A. Nitrate concentrations were highest from January to July each year. The seasonal variability likely is due to a combination of environmental causes such as seasonal fluctuations in discharge and aquatic and terrestrial growth, and anthropogenic causes such as nutrient consumption, agricultural activities (including fertilizer application), and other processes within the watershed.
Variability in phosphorus and suspended-sediment concentrations did not follow the same strong seasonal variability as nitrate (figs. 3B,C and 4B,C). Phosphorus concentrations are more highly dependent on discharge (fig. 5). Variations in flow-concentration relations for phosphorus and discharge between the two stations was noticed. At the upstream station (05586647) periods of low flow and somewhat elevated phosphorus concentrations were present in late 2017, early 2018, late 2020, and early 2021, whereas concentrations were lower during this period at the downstream station (05586745) (fig. 3B). Higher phosphorus concentrations during periods of low flow at the upstream station (05586647) might reflect some local inflow or anthropogenic sources such as agricultural practices, wastewater or septic input. More focused monitoring that would target sub-watersheds or regulated inputs (such as septic inputs) upstream of station 05586647 would be beneficial to help narrow down the cause of the elevated concentrations.
Table 4.
Summary of measured nitrate plus nitrite, total phosphorus, and suspended-sediment concentrations, 2017–21, in Macoupin Creek at Highway 108 near Carlinville, Illinois (U.S. Geological Survey station number 05586647) and at Highway 111 near Summerville, Ill. (U.S. Geological Survey station number 05586745). Data from U.S. Geological Survey (2022a).[mg/L, milligram per liter; N, nitrogen; P, phosphorus; DS, downstream; US, upstream]
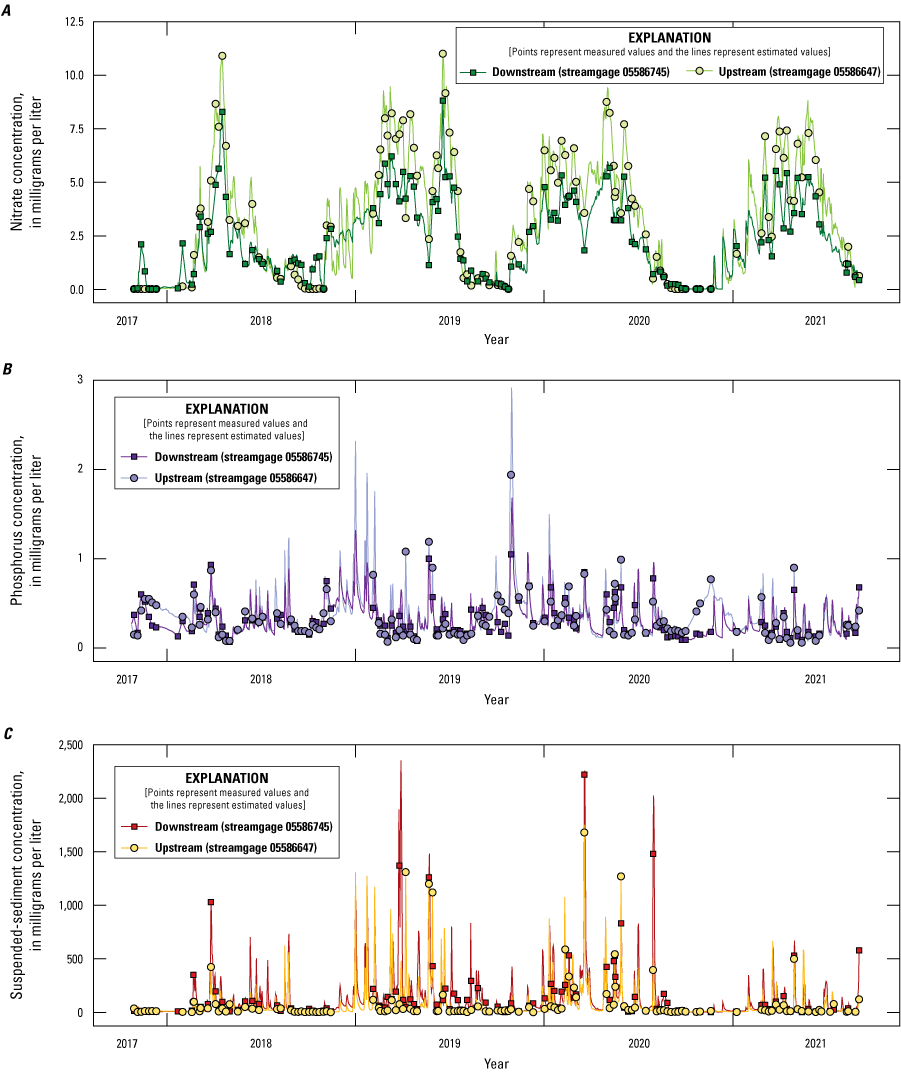
Time series of measured and estimated constituent concentrations at Macoupin Creek at Highway 108 near Carlinville, Illinois (U.S. Geological Survey station number 05586647; upstream) and Macoupin Creek at Highway 111 near Summerville, Ill. (U.S. Geological Survey station number 05586745; downstream), 2017–21. A, Nitrate concentrations. B, Phosphorus concentrations. C, Suspended-sediment concentrations. Data from U.S. Geological Survey (2022a) and Garcia (2023).
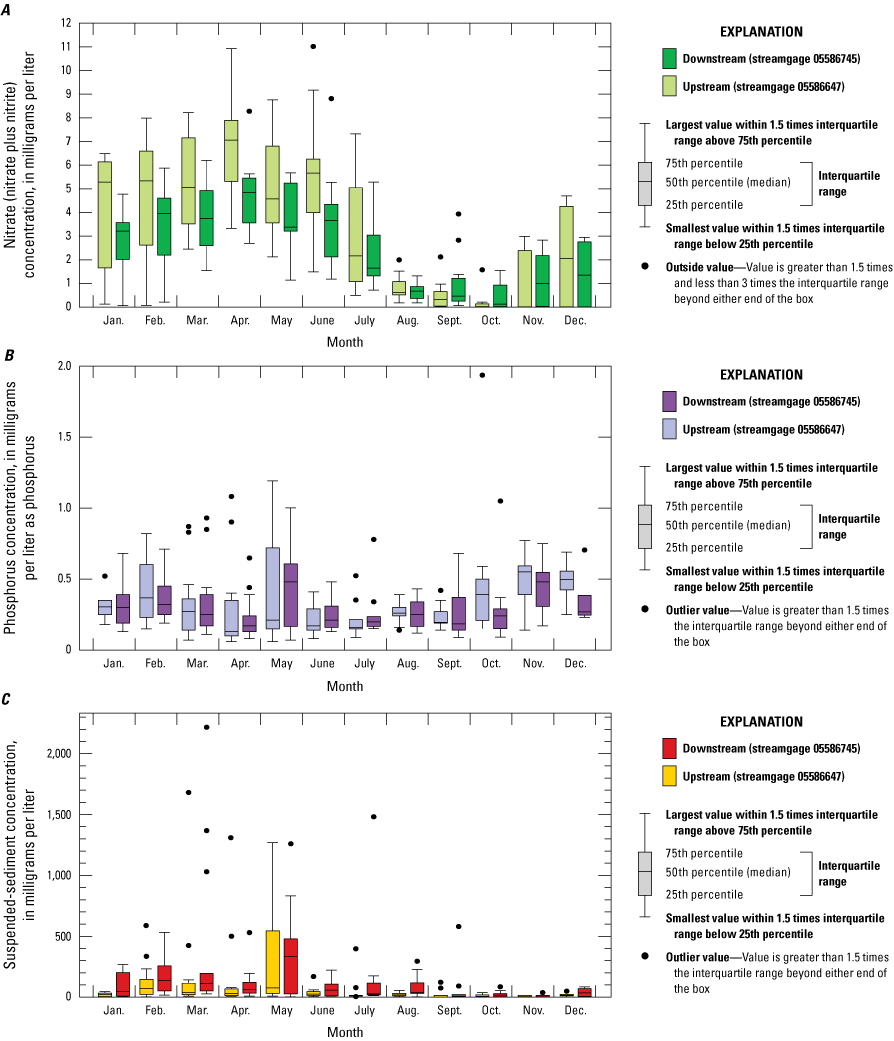
Boxplots of measured constituent concentrations, by month, at Macoupin Creek at Highway 108 near Carlinville, Illinois (U.S. Geological Survey station number 05586647; upstream) and Macoupin Creek at Highway 111 near Summerville, Ill. (U.S. Geological Survey station number 05586745; downstream), 2017–21. A, Nitrate plus nitrite concentrations. B, Phosphorus concentrations. C, Suspended-sediment concentrations.
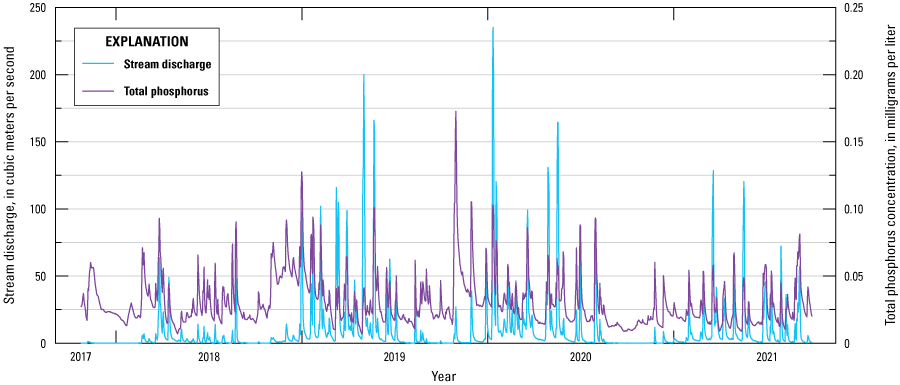
Time series of measured stream discharge and estimated total phosphorus concentration for Macoupin Creek at Highway 111 near Summerville, Ill. (U.S. Geological Survey station number 05586745). Data from U.S. Geological Survey (2022a) and Garcia (2023).
Loads and Yields
A summary of the mean daily fluxes for the upstream (05586647) and downstream (05586745) monitoring stations is provided in table 5, and a summary of the annual loads and yields (by water year) for each of the three subbasins is provided in table 6. The study area subbasin constitutes approximately 57 percent of the total area of the downstream monitoring station. The loads and yields for the study area subbasin were computed by calculating the difference between drainage areas of the upstream and the downstream monitoring stations, 419.6 and 986.3 km2, respectively (table 1). The area of the drainage basin between the two monitoring stations is approximately 567 km2.
Nitrate loads and yields from the study area subbasin were lower than the loads and yields from the upstream subbasin for all years of the study. Furthermore, because the study area subbasin is marginally larger than the upstream subbasin, total phosphorus yields from within the study area were lower than within the upstream basin (table 6).
Unlike nitrate and phosphorus, suspended-sediment loads were greater from the study area subbasin than from the upstream subbasin values for all water years. The study area contributed between 50 and 79 percent of the suspended-sediment load measured at the downstream station (05586745) (table 6).
Table 5.
Summary of estimated mean daily flux for Macoupin Creek at Highway 108 near Carlinville, Illinois (U.S. Geological Survey station number 05586647; upstream) and Macoupin Creek at Highway 111 near Summerville, Ill. (U.S. Geological Survey station number 05586745; downstream). Data from Garcia (2023).[WY, water year; US, upstream; DS, downstream]
Table 6.
Estimated nitrate nitrogen, total phosphorus, and suspended sediment loads and yields from Macoupin Creek at Highway 108 near Carlinville, Illinois (U.S. Geological Survey station number 05586647; upstream) and Macoupin Creek at Highway 111 near Summerville, Ill. (U.S. Geological Survey station number 05586745; downstream). Data from Garcia (2023).[WY, water year; kg, kilogram; t/km2, metric ton per square kilometer]
Time series plots of estimated daily yields for nitrate, phosphorus, and suspended sediment are shown in figure 6. Annual yields (the sum of the daily yields during the respective water-year period) depict differences in constituent transport affected primarily by yearly variation in precipitation and runoff as well as land-use practices that can change from year to year. Bar charts of estimated annual yields for nitrate, phosphorus, and suspended sediment are shown in figure 7, and estimated cumulative yields for the entire study period (2018–21), reported are shown in figure 8. The graphs for yield, unlike those for concentration, all show a similar pattern, with periods of greatest yield occurring during the periods of greatest flow (figs. 2 and 6). The seasonal pattern of nitrate concentration is muted when the flow is incorporated for yield computations, partly owing to the variability of the magnitude in yield values.
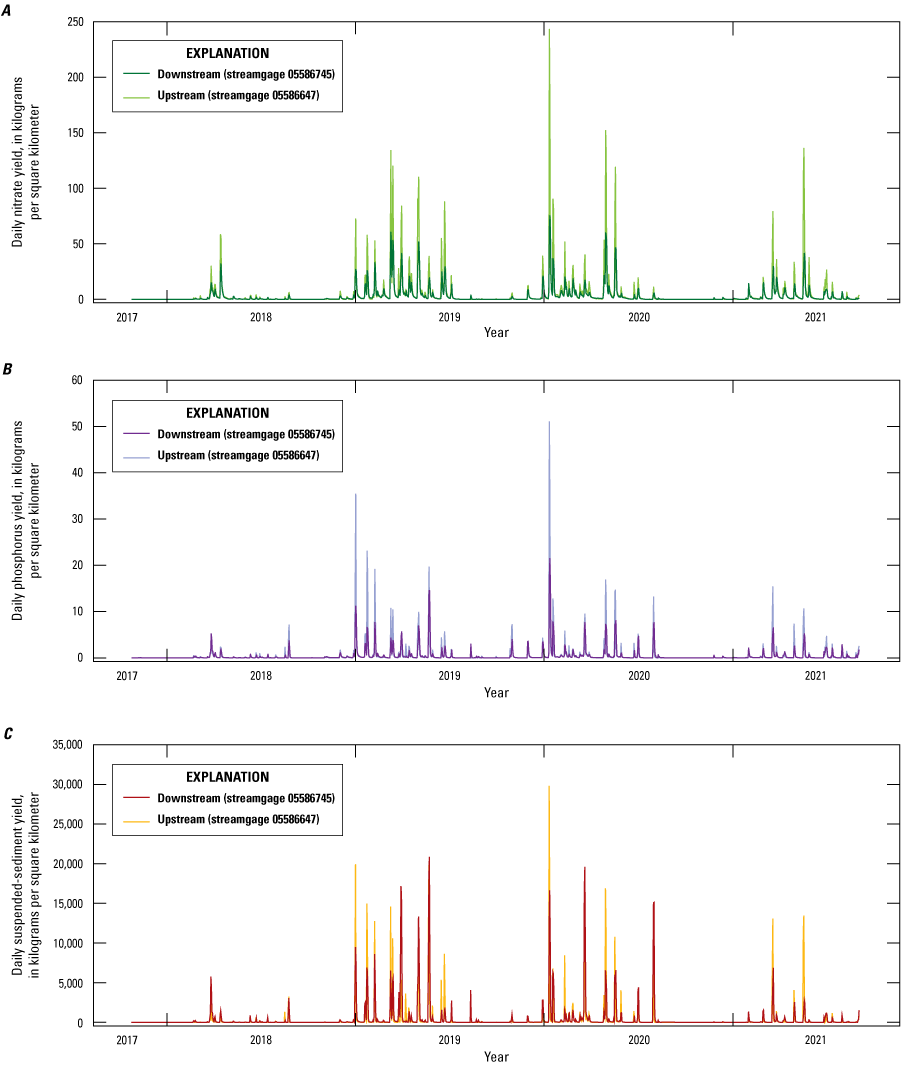
Estimated daily yields of nutrients and suspended sediment at Macoupin Creek at Highway 108 near Carlinville, Illinois (U.S. Geological Survey station number 05586647) and Macoupin Creek at Highway 111 near Summerville, Ill. (U.S. Geological Survey station number 05586745), 2017–21. A, Nitrate plus nitrite yields. B, Phosphorus yields. C, Suspended-sediment yields. Data from Garcia (2023).
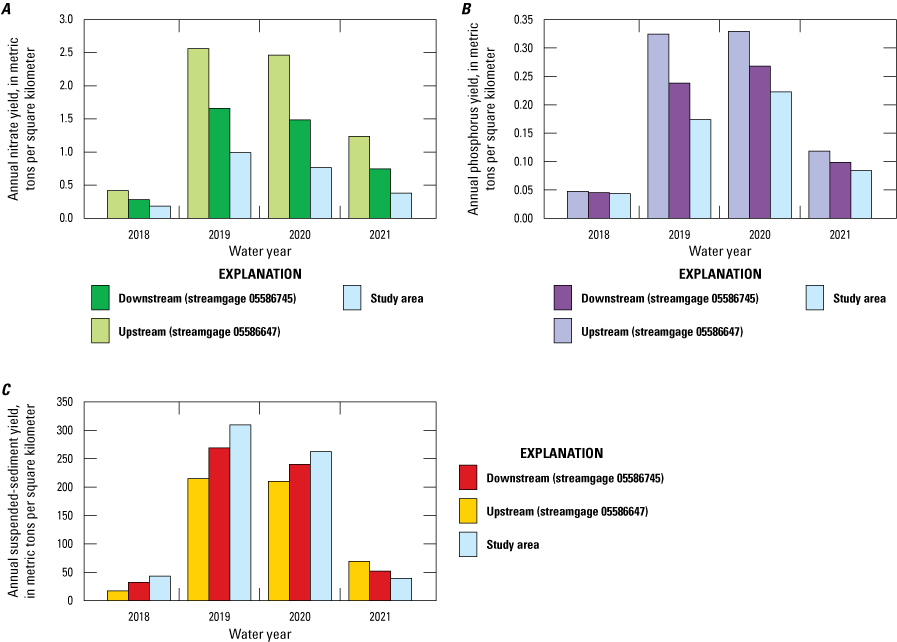
Estimated annual yields of nutrients and suspended sediment at Macoupin Creek at Highway 108 near Carlinville, Illinois (U.S. Geological Survey station number 05586647) and Macoupin Creek at Highway 111 near Summerville, Ill. (U.S. Geological Survey station number 05586745), 2017–21. A, Nitrate plus nitrite yields. B, Phosphorus yields. C, Suspended-sediment yields. Data from Garcia (2023).
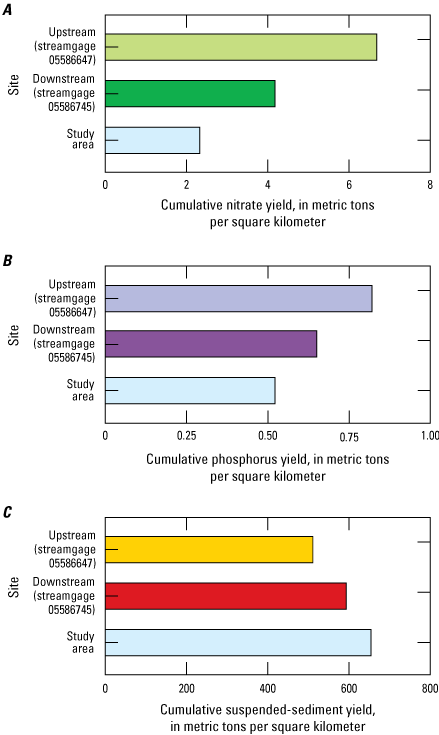
Estimated cumulative yields of nutrients and suspended sediment at Macoupin Creek at Highway 108 near Carlinville, Illinois (U.S. Geological Survey station number 05586647) and Macoupin Creek at Highway 111 near Summerville, Ill. (U.S. Geological Survey station number 05586745), 2017–21. A, Nitrate plus nitrite yields. B, Phosphorus yields. C, Suspended-sediment yields. Data from Garcia (2023).
The yield data provide two important conclusions. First, the mean annual yield values indicate the downstream subbasin is exporting lower yields of nitrogen and phosphorus than the upstream subbasin because of the smaller contribution from the study area. Second, the study area is contributing a greater amount of suspended sediment than the upstream subbasin. The mean annual yield of nitrate at the upstream station (05586647) during water years 2018–21 was approximately 1.64 metric tons per square kilometer (t/km2). The mean annual yield of nitrate from the study area was approximately 0.60 t/km2, a yield of about 36 percent of the mean annual yield at the upstream station. Similarly, the mean annual phosphorus yields for the upstream station and study area were approximately 0.21 and 0.13 t/km2, respectively; the yield from the study area was about 62 percent of the upstream yield. Mean annual suspended-sediment yields showed an opposite pattern, with a mean annual yield at the upstream station of approximately 131 t/km2 and a mean annual yield from the study area of approximately 166 t/km2, which is about a 126-percent increase.
The cumulative yields during the study period help to indicate the effect the study area subbasin reach of the upper Macoupin Creek has on the overall watershed. The cumulative yields of nitrogen at the upstream station (05586647) during the water years 2018–21 was approximately 6.6 t/km2, whereas the cumulative yield for the downstream station (05586745) was approximately 4.2 t/km2 (fig. 8, table 6). The total yield of nitrate within the study area itself was approximately 2.4 t/km2. Similarly, the total yield of total phosphorus for the upstream station was approximately 0.83 t/km2, the total yield of total phosphorus for the downstream station was was approximately 0.67 t/km2, and the total yield for the study area itself was approximately 0.53 t/km2 during the study period. The total yield of suspended sediment for the upstream and downstream stations was approximately 524 and 605 t/km2, respectively, and the total yield for the study area was approximately 663 t/km2. Overall, the study area subbasin of the upper Macoupin Creek watershed reduces the yields from the watershed by 54 percent for nitrate and by 21 percent for total phosphorus while increasing the yield of suspended sediment by 10 percent. This increase in sediment in the study area likely is due to gully and streambank erosion determined in a previous study (Northwater Consulting and American Farmland Trust, 2019).
The decrease in yield of nitrate and phosphorus from the upstream (05586647) to downstream (05586745) monitoring sites is likely due to the smaller contribution (load) from the study area subbasin. Although it is outside the scope of this report to evaluate what environmental changes or land-use activities might contribute to these reductions, a concerted effort was made by collaborating partners to educate and encourage landowners within the study area subbasin to adopt nutrient and sediment BMPs during the study period. A further look at land-use practices and recent BMP implementation might explain some of the causes of these findings. Further study might also reveal trends within the watersheds that reflect other land-use changes.
Summary
The U.S. Geological Survey, in cooperation with the Macoupin County Soil and Water Conservation District and the American Farmland Trust, undertook a monitoring effort from 2017 to 2021 in the upper Macoupin Creek watershed. This monitoring effort quantified concentrations and in-stream transport of nitrate plus nitrite, total phosphorus, and suspended sediment for a 566.7 square kilometer portion of the watershed between Macoupin Creek at Highway 108 near Carlinville, Illinois (U.S. Geological Survey station number 05586647) and Macoupin Creek at Highway 111 near Summerville, Ill. (U.S. Geological Survey station number 05586745). Determination and documentation of nutrient concentration and loads for this segment of the upper Macoupin Creek watershed, in conjunction with land-use and management-practice data, is an essential step in determining what effect conservation and best management practices have on nutrient and suspended-sediment transport within the study area and the entire Macoupin Creek watershed.
Nitrate and total phosphorus median concentrations and variability in concentrations were typically greater at the upstream station (05586647) than at the downstream station (05586745), indicating decreased input and (or) retention of nutrients within the study area. Conversely, concentrations and variability of suspended sediment were greater at the downstream station, indicating increased input of soil and particulate matter within the management area.
The Weighted Regressions on Time, Discharge, and Season–Kalman model was used to derive estimates of daily nitrate, total phosphorus, and suspended-sediment concentrations. These daily concentrations were used in conjunction with the continuous stream discharge to derive estimates of constituent concentration, loads, and yields. Nitrate concentrations were generally highest between January and July each year, whereas concentrations of total phosphorus and suspended sediment were typically highest from October through December. Seasonality of nutrient and suspended-sediment transport and yields were similar among the constituents, with the periods of greatest flux for all constituents concurrent with the periods of highest discharge (typically December through May). Similarly, years with higher precipitation and subsequent discharge (2019 and 2020) experienced higher loads in all subbasins.
The analyses and calculations of constituent concentrations and yields were useful for evaluating the inputs and effects of the study area on the larger upper Macoupin Creek watershed. Concentrations and yields of nitrate plus nitrite and phosphorus from within the management subbasin were less than from the control watershed upstream from the study area. Conversely, concentrations and yields of suspended sediment were greater within the management area than from the control watershed upstream. The inputs from the study area subbasin of the upper Macoupin Creek watershed reduced downstream nitrite plus nitrate and total phosphorus yields by 54 percent and 21 percent, respectively; however, the yield of suspended sediment increased by 10 percent from inputs within the study area.
References Cited
David, M.B., McIsaac, G.F., Schnitkey, G.D., Czapar, G.F., and Mitchell, C.A., 2014, Science assessment to support an Illinois nutrient loss reduction strategy—University of Illinois at Urbana-Champaign, College of Agricultural: Urbana, Illinois, Consumer and Environmental Sciences, 65 p. [Also available at http://biogeochemistry.nres.illinois.edu/Biogeochem_lab/Science_documents/Illinois_Science_Assessment_Report_May_6.pdf.]
Dewitz, J., 2019, National Land Cover Database (NLCD) 2016 products: U.S. Geological Survey data release, accessed February 2021 at https://doi.org/10.5066/P96HHBIE.
Fishman, M.J., ed., 1993, Methods of analysis by the U.S. Geological Survey National Water Quality Laboratory—Determination of inorganic and organic constituents in water and fluvial sediments: U.S. Geological Survey Open-File Report 93–125, 217 p. [Also available at https://doi.org/10.3133/ofr93125.]
Garcia, L.A., 2023, Nutrient and sediment concentrations, loads, and yields in the upper Macoupin Creek watershed, water years 2018–2021: U.S. Geological Survey data release, https://doi.org/10.5066/P95IC7QS.
Guy, H.P., 1969, Laboratory theory and methods for sediment analysis: U.S. Geological Survey Techniques of Water-Resources Investigations, book 5, chap. C1, 58 p. [Also available at https://doi.org/10.3133/twri05C1.]
Hirsch, R.M., and De Cicco, L.A., 2015, User guide to Exploration and Graphics for RivEr Trends (EGRET) and dataRetrieval—R packages for hydrologic data (version 2.0, February 2015): U.S. Geological Survey Techniques and Methods, book 4, chap. A10, 93 p., accessed November 2021 at https://doi.org/10.3133/tm4A10.
Illinois Environmental Protection Agency, Illinois Department of Agriculture, and University of Illinois Extension, 2017, Illinois Nutrient Loss Reduction Strategy Biennial Report 2015-–2017: Illinois Environmental Protection Agency and Illinois Department of Agriculture, Springfield, Illinois, accessed December 28, 2022, at http://www2.illinois.gov/epa/Documents/iepa/water-quality/watershed-management/excess-nutrients/NLRS-Biennial-Report/NLRS%20Biennial%20Report.pdf.
National Weather Service, 2022, Monthly rainfall and seasonal totals–St. Louis, MO: accessed August 1, 2022, at https://www.weather.gov/media/lsx/climate/stl/precip/precip_stl_monthly_seasonal.pdf.
Natural Resources Conservation Service, 2008, Illinois Macoupin Creek watershed rapid watershed assessment report. U.S. Department of Agriculture, Natural Resources Conservation Service, 28 p. [Also available at https://www.nedc.nrcs.usda.gov/wps/portal/nrcs/main/il/technical/dma/rwa/.]
Northwater Consulting and American Farmland Trust, 2019, Upper Macoupin Creek Watershed Plan; Macoupin County Illinois, accessed July 2022 at https://www2.illinois.gov/epa/topics/water-quality/watershed-management/watershed-based-planning/Documents/UpperMacoupinCreekWatershedPlan_Nov2019.pdf.
Patton, C.J., and Kryskalla, J.R., 2003, Methods of analysis by the U.S. Geological Survey National Water Quality Laboratory—Evaluation of alkaline persulfate digestion as an alternative to Kjeldahl digestion for determination of total and dissolved nitrogen and phosphorus in water: U.S. Geological Survey Water-Resources Investigations Report 2003–4147, 33 p. [Also available at https://doi.org/10.3133/wri034174.]
Patton, C.J., and Kryskalla, J.R., 2011, Colorimetric determination of nitrate plus nitrite in water by enzymatic reduction, automated discrete analyzer methods: U.S. Geological Survey Techniques and Methods, book 5, chap. B8, 34 p. [Also available at https://doi.org/10.3133/tm5B8.]
Turnipseed, D.P., and Sauer, V.B., 2010, Discharge measurements at gaging stations: U.S. Geological Survey Techniques and Methods book 3, chap. A8, 87 p. [Also available at https://doi.org/10.3133/tm3A8.]
U.S. Geological Survey, variously dated, National field manual for the collection of water-quality data: U.S. Geological Survey Techniques of Water-Resources Investigations, book 9, chaps. A1–A9, [variously paged], accessed November 2021 at https://pubs.water.usgs.gov/twri9A.
U.S. Geological Survey, 2022a, USGS water data for the Nation: U.S. Geological Survey National Water Information System database, accessed March 20, 2022, at https://doi.org/10.5066/F7P55KJN.
U.S. Geological Survey, 2022b, USGS 05586647, Macoupin Creek at Highway 108 near Carlinville, Illinois, in USGS water data for the Nation: U.S. Geological Survey National Water Information System database, accessed March 20, 2022, at https://doi.org/10.5066/F7P55KJN. [Site information directly accessible at https://waterdata.usgs.gov/nwis/inventory/?site_no=05586647&agency_cd=USGS&.]
U.S. Geological Survey, 2022c, USGS 05586745, Macoupin Creek at Highway 111 near Summerville, Illinois, in USGS water data for the Nation: U.S. Geological Survey National Water Information System database, accessed March 20, 2022, at https://doi.org/10.5066/F7P55KJN. [Site information directly accessible at https://waterdata.usgs.gov/nwis/inventory/?site_no=05586745&agency_cd=USGS&.]
Zhang, Q., and Hirsch, R.M., 2019, River water‐quality concentration and flux estimation can be improved by accounting for serial correlation through an autoregressive model: Water Resources Research, v. 55, no. 11, p. 9705–9723. [Also available at https://doi.org/10.1029/2019WR025338.]
Conversion Factors
U.S. customary units to International System of Units
International System of Units to U.S. customary units
Temperature in degrees Celsius (°C) may be converted to degrees Fahrenheit (°F) as follows: °F = (1.8 × °C) + 32.
Supplemental Information
Concentrations of chemical constituents in water are given in either milligrams per liter (mg/L) or micrograms per liter (µg/L).
A water year is defined as the period from October 1 of an initial year through September 30 of the following year and is identified as the year in which it ends; for example, water year 2021 was from October 1, 2020, to September 30, 2021.
Abbreviations
BMP
best management practice
HUC
Hydrologic Unit Code
IQR
interquartile range
NRCS
Natural Resources Conservation Service
RCPP
Regional Conservation Partnership Program
USGS
U.S. Geological Survey
WRTDS
Weighted Regression on Time, Discharge, and Season
WRTDS–K
Weighted Regression on Time, Discharge, and Season–Kalman
Suggested Citation
Garcia, L.A., Terrio, P.J., and Manaster, A.E., 2023, Nutrient and suspended-sediment concentrations, loads, and yields in upper Macoupin Creek, Illinois, 2017–21: U.S. Geological Survey Scientific Investigations Report 2022–5131, 17 p., https://doi.org/10.3133/sir20225131.
ISSN: 2328-0328 (online)
Study Area
| Publication type | Report |
|---|---|
| Publication Subtype | USGS Numbered Series |
| Title | Nutrient and suspended-sediment concentrations, loads, and yields in upper Macoupin Creek, Illinois, 2017–21 |
| Series title | Scientific Investigations Report |
| Series number | 2022-5131 |
| DOI | 10.3133/sir20225131 |
| Year Published | 2023 |
| Language | English |
| Publisher | U.S. Geological Survey |
| Publisher location | Reston, Va. |
| Contributing office(s) | Central Midwest Water Science Center |
| Description | Report: vii, 17 p.; Data Release; Dataset |
| Country | United States |
| State | Illinois |
| Other Geospatial | Upper Macoupin Creek |
| Online Only (Y/N) | Y |
| Google Analytic Metrics | Metrics page |