

Evaluation of Potential Stresses and Hydrologic Conditions Driving Water-Level Fluctuations in Well ER-5-3-2, Frenchman Flat, Southern Nevada
Links
- Document: Report (6 MB pdf) , HTML , XML
- Data Release: MODFLOW 6 models used to evaluate potential stresses and hydrologic conditions driving water-level fluctuations in well ER-5-3-2, Frenchman Flat, southern Nevada
- Download citation as: RIS | Dublin Core
Acknowledgments
The authors acknowledge Ken Rehfeldt, Brian Haight, Jeff Wurtz, and Milinka Watson-Garrett, Navarro Research and Engineering, Inc., for providing well ER-5-3-2 aquifer-test data and hydrochemistry data from pumping-sampling events stored in the Underground Test Area activity chemistry database. The authors also acknowledge Chuck Russell, Desert Research Institute, for providing ambient and stressed-flow log data. The authors thank Keith Halford, U.S. Geological Survey retired, for providing hydrologic expertise and guidance throughout the project. The authors also gratefully acknowledge the reviewers of this report for their helpful comments: Jeff Wurtz (Navarro Research and Engineering, Inc.), Joseph M. Fenelon (U.S. Geological Survey, retired), Philip M. Gardner (U.S. Geological Survey), and Seth Gainey (U.S. Geological Survey).
Abstract
Well ER-5-3-2 is part of a well network designed to monitor long-term water levels and radionuclide concentrations downgradient from underground nuclear tests that occurred in Frenchman Flat, an area of the U.S. Department of Energy Nevada National Security Site in southern Nevada. Interpretation of monitoring records for well ER-5-3-2 was confounded by previously unexplained water-level fluctuations in the well hydrograph. This study integrated geologic, hydrologic, and water-chemistry data to evaluate potential stresses and hydrologic conditions that likely affected the well ER-5-3-2 hydrograph. Numerical groundwater models were applied to evaluate four model scenarios: (1) wellbore leakage without recharge, (2) wellbore leakage with recharge, (3) equilibration to vertical heterogeneities between shallow (low transmissivity) and deep (higher transmissivity) carbonate zones, and (4) equilibration to lateral heterogeneities in carbonate rocks.
Meteoric recharge was not the cause of the 21-foot (ft) water-level rise in well ER-5-3-2 from 2001 to 2011 or the 4-ft decline from 2012 to 2016. Based on observed water-level fluctuations in nearby wells, the water-level rise and decline from recharge for these periods was less than 3 and 1 ft, respectively. The lateral-heterogeneity scenario is based on the assumption that the 21-ft water-level rise from 2001 to 2011 was a natural water-level reequilibration following the pumping-induced depressurization of a large volume of high transmissivity and low-storage carbonate rock that is surrounded by low transmissivity and high-storage carbonate rock. The lateral-heterogeneity scenario was discounted because simulated water levels cannot match the well ER-5-3-2 hydrograph. Underground nuclear testing and temperature effects were discounted based on hydraulic connections and water-temperature data.
Wellbore-leakage scenarios are based on the assumption that the water-level rise was sustained from leakage rates required to cause a localized mounding in the carbonate system near well ER-5-3-2, where the carbonate transmissivity is 530 square feet per day. Even though simulated and measured water levels compare favorably for scenarios of wellbore leakage with and without recharge, large volumes (178–184 million gallons) of groundwater from volcanic rocks would be required to leak into the carbonate system, which is not supported by water-chemistry data.
An alternative conceptualization of wellbore leakage is based on the assumption that the 21-ft water-level rise from 2001 to 2011 was sustained by the hydraulic disconnection of well ER-5-3-2 from the carbonate system. The disconnection occurred several months after a constant-rate test in well ER-5-3-2 when carbonate rocks were hydraulically disconnected from the well by either (1) the shifting of sloughed fill in the open hole or (2) the encrusting of carbonate precipitate in the well screen. The hydraulic disconnection effectively sealed the well and caused a 21-ft water-level rise from wellbore leakage during 2001–11. In this case, total wellbore leakage from 2001 to 2011 was about 50 gallons. The 4-ft water-level decline from 2012 to 2016 was conceptualized to have occurred from the slow breaking of the seal and reconnection of the well to the carbonate system. This alternative conceptualization of wellbore leakage was consistent with water-chemistry analyses because the computed wellbore leakage (50 gallons) was small relative to purged volumes (30,000–40,000 gallons) for sampling, and the water chemistry would not be expected to change.
The shallow-deep carbonate scenario provided another explanation for the well ER-5-3-2 hydrograph. This scenario is based on the assumption that well-construction effects and vertical heterogeneity of the carbonate system explain the ER-5-3-2 water-level trend. Well-construction effects are attributed to a temporary clogging of the open interval below the well screen that was opened during pumping events, which affected the hydraulic connection of deep transmissive carbonate rocks to the wellbore. The 21-ft water-level rise from 2001 to 2011 was a natural equilibration to shallow, low-transmissivity carbonate rocks during a period when the lower open interval was clogged. The 4-ft decline from 2012 to 2016 represents equilibration between the shallow and deep intervals, because of a partial unclogging of the connection between the two intervals. The low water levels from 2016 to 2021 resulted from pumping for sampling and an unclogging of the open interval so that the low head in the deep carbonate dominated the water level. Despite potential well-construction effects, from either a wellbore leakage or shallow-deep carbonate scenario, samples collected from well ER-5-3-2 are representative of the carbonate system.
Introduction
Frenchman Flat is in the southeastern part of the Nevada National Security Site (NNSS) in southern Nevada (fig. 1). From 1965 to 1971, 10 nuclear tests were detonated between 500 and 1,000 feet below land surface (ft bls) in Frenchman Flat (U.S. Department of Energy, 2015a). Between 1995 and 2010, hydrogeologic investigations characterized groundwater flow and radionuclide transport from underground nuclear tests in Frenchman Flat as part of the U.S. Department of Energy (DOE) Underground Test Area activity (U.S. Department of Energy, Nevada Operations Office, 1999; Navarro Nevada Environmental Services, LLC, 2010; U.S. Department of Energy, 2010). The groundwater remediation strategy employed for the NNSS is long-term monitoring with the implementation of land-use restrictions to protect the public and environment from contaminated groundwater (U.S. Department of Energy, 2010). In 2016, a long-term monitoring network was established for Frenchman Flat that included water-level and water-quality monitoring at six wells, including well ER-5-3-2 (U.S. Department of Energy, 2016).
Well ER-5-3-2 is the only well open to carbonate rocks in Frenchman Flat. Water levels have been measured quarterly since 2001, and water-quality samples have been taken annually from 2016 to 2020 to assess groundwater conditions and potential radionuclide migration at well ER-5-3-2 (U.S. Department of Energy, 2019). However, interpretation of long-term water-level monitoring records for well ER-5-3-2 is confounded by unexplained water-level fluctuations observed in the well hydrograph. Unexplained water-level responses in well ER-5-3-2 are hypothesized to result from poor well completion. If water levels in well ER-5-3-2 are the result of poor well completion, then DOE can determine whether the well should be abandoned or recompleted. The U.S. Geological Survey (USGS) was tasked by DOE to determine whether water levels in well ER-5-3-2 are a response to poor well completion or aquifer stresses in the carbonate system.
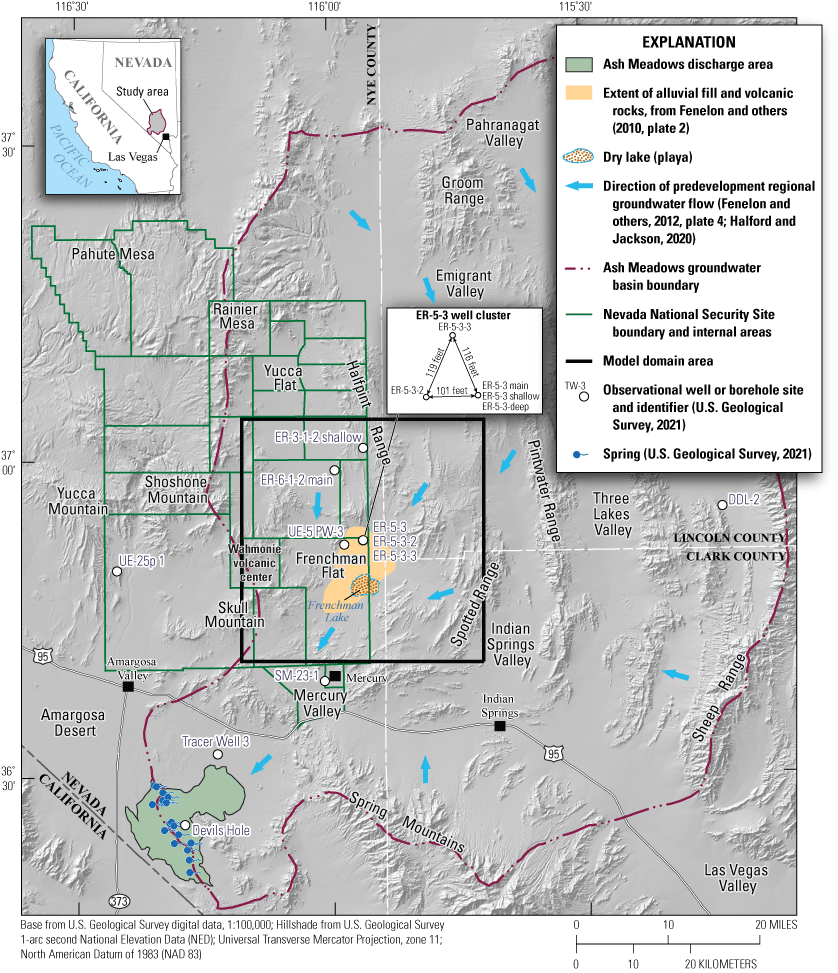
Physiography and selected boreholes in Frenchman Flat and surrounding areas, southern Nevada.
Purpose and Scope
The study objective was to evaluate potential stresses or hydrologic conditions causing the water-level changes in well ER-5-3-2. Geologic, hydrologic, and water-chemistry data were integrated to evaluate water-level changes in the well ER-5-3-2 hydrograph. Geologic data included the lithologic well log for borehole ER-5-3-2 and hydrostratigraphic cross sections (Bechtel Nevada, 2005a; Fenelon and others, 2010). Hydrologic data included water levels for well ER-5-3-2 and nearby wells open to carbonate rocks and the single-well aquifer-test transmissivity estimate for well ER-5-3-2. Water-chemistry data included major-ion and trace-element compositions for wells ER-5-3-2 (carbonate), ER-5-3 shallow (alluvial), and UE-5 PW-3 (volcanic; fig. 1).
Numerical groundwater models, regional hydraulic-head analyses, and statistical and graphical water-chemistry analyses were used to evaluate potential stresses. Four model scenarios were developed using three-dimensional, MODFLOW 6 groundwater models that simulated (1) wellbore leakage without recharge, (2) wellbore leakage with recharge, (3) equilibration following pumping events in response to vertical heterogeneity between shallow and deep carbonate zones, and (4) equilibration following pumping events in response to lateral heterogeneities in carbonate rocks. All model scenarios simulated the drawdown and recovery of water levels during a constant-rate aquifer test and the pumping period for annual groundwater sampling events from 2016 to 2020. A regional analysis was done to determine a representative hydraulic head for the carbonate system at the ER-5-3-2 well site. Statistical and graphical analyses of water-chemistry data for well ER-5-3-2 and nearby alluvial-volcanic wells determined the likelihood of mixing between alluvial-volcanic and carbonate groundwater via annulus leakage in the wellbore of ER-5-3-2. Other factors considered included underground nuclear testing and water-temperature effects. Results can be used to determine whether well ER-5-3-2 requires recompletion. The data and numerical models discussed in this report are documented in a separate data release (Jackson and Frus, 2023, https://doi.org/10.5066/P95C0NG5).
Description of Study Area
The study area was focused on the ER-5-3-2 well site but included the surrounding areas shown on figure 1. Areas outside the ER-5-3-2 well site were included in the study area so that geologic, water-level, and water-chemistry interpretations were consistent between the local scale (well ER-5-3-2) and regional scale. The study area is part of the Basin and Range physiographic province (Harrill and Prudic, 1998).
The ER-5-3-2 well site is in Frenchman Flat, an intermontane basin with a spatial extent defined by the extent of alluvial and volcanic rocks shown on figure 1. Frenchman Flat has a valley floor that slopes gently toward the dry playa of Frenchman Lake. Land-surface altitudes range from 3,078 feet (ft) at the playa to about 4,000–6,000 ft within the mountains bounding Frenchman Flat (fig. 1).
The climate of the study area is arid to semi-arid, characteristic of a high desert region. Average summertime maximum temperatures at Frenchman Flat are about 98 degrees Fahrenheit (°F), whereas average wintertime minimum temperatures are about 25 °F (Soulé, 2006). Precipitation at Frenchman Flat occurs primarily in winter and mid-summer, where annual precipitation is about 5 inches (in.; Soulé, 2006) and primarily falls as rain (fig. 1).
Geology and Hydrogeology
The tectonic basin of Frenchman Flat is composed of alluvium, volcanic rocks, and carbonate rocks. Localized alluvium and volcanic rocks in Frenchman Flat are underlain by regionally extensive carbonate rocks (Winograd and Thordarson, 1975; Laczniak and others, 1996; Bechtel Nevada, 2005a; Fenelon and others, 2010). Regionally extensive carbonate rocks encompass the Ash Meadows groundwater basin (fig. 1; Fenelon and others, 2010).
Carbonate rocks extend to great depths in Frenchman Flat and consist of thick sequences of mostly Paleozoic limestone and dolomite. These rocks have been offset and fractured by strike-slip and eastward-directed thrust faulting during the Mesozoic and by normal faulting from basin-and-range extension during the Cenozoic (Bechtel Nevada, 2005a). Carbonate rocks have a saturated thickness of more than 15,000 ft beneath Frenchman Flat (Winograd and Thordarson, 1975; Slate and others, 1999; Bechtel Nevada, 2005a). Carbonate rocks outcrop in highland areas bounding the eastern and southern parts of Frenchman Flat and are buried beneath more than 7,000 ft of Tertiary rocks in central Frenchman Flat, south of well ER-5-3-2 (Bechtel Nevada, 2005a).
Carbonate rocks form a regionally extensive aquifer that is part of the Great Basin carbonate-rock province (Prudic and others, 1995). Even though carbonate rocks regionally function as an aquifer, these rocks can function, locally or at great depth, as confining units. Carbonate rocks have negligible matrix porosity and permeability. Therefore, carbonate-rock transmissivity is based on the degree of hydraulically connected fractures and dissolution features. Aquifer-test results indicated that carbonate rocks have a wide range in transmissivity (from less than 1 to more than 1,000,000 square feet per day [ft2/d]) because of their variable faulting and fracturing (Winograd and Thordarson, 1975; Halford and Jackson, 2020).
The tuff confining unit (TCU) forms a hydraulic barrier between underlying carbonate rocks and overlying alluvium and volcanic rocks in Frenchman Flat (Fenelon and others, 2010). At the base of the TCU is a clay-rich paleocolluvium that functions as a confining unit (IT Corporation, 2000). Other rocks composing the TCU include nonwelded or partially welded ash-flow tuffs, bedded tuffs, and reworked tuffaceous sediments, all of which commonly have been subjected to zeolitic, argillic, or hydrothermal alteration (Winograd and Thordarson, 1975; Laczniak and others, 1996; Bechtel Nevada, 2005a). These rocks typically form confining units because matrix permeability is reduced by alteration, and fracture permeability is negligible from the low susceptibility of these rocks to strain fractures (Sweetkind and others, 2010). The saturated thickness of the TCU typically ranges between 500 and 2,000 ft in Frenchman Flat (Fenelon and others, 2010).
Alluvium and volcanic rocks laterally interfinger and form a localized alluvial-volcanic groundwater system that overlies the TCU in Frenchman Flat (Sweetkind and others, 2010). Alluvial deposits consist of unconsolidated to partially consolidated gravel, sand, and silt; and playa and lacustrine sediments (Slate and others, 1999). Coarse-grained alluvial deposits are characterized by high-matrix porosity and permeability, and typically form aquifers, whereas fine-grained alluvial deposits form confining units. Volcanic rocks consist of Miocene lava flows and moderately to densely welded ash-flow tuffs where fracturing causes laterally extensive and hydraulically connected fracture networks (Winograd and Thordarson, 1975; Laczniak and others, 1996). Volcanic rocks are predominantly of basaltic and dacitic composition and were derived from the Wahmonie volcanic center west of Frenchman Flat (fig. 1; Bechtel Nevada, 2005a). Alluvium and volcanic rocks increase in thickness from the margins to the center of Frenchman Flat, with a maximum saturated thickness of about 7,000 ft (Fenelon and others, 2010, plate 2).
Predevelopment Flow
Groundwater is conveyed in and out of Frenchman Flat. Small amounts of groundwater recharge occur locally to Frenchman Flat from precipitation infiltrating bounding mountain ranges, including the Spotted and Halfpint Ranges and Shoshone and Skull Mountains (fig. 1; Fenelon and others, 2016; Halford and Jackson, 2020). Locally derived recharge in Frenchman Flat moves vertically and laterally into carbonate rocks (Fenelon and others, 2010). In Frenchman Flat, localized alluvium and volcanic rocks form a laterally continuous, alluvial-volcanic groundwater system. Groundwater movement from the alluvial-volcanic system to the carbonate system occurs by downward leakage across the low-permeability TCU (Winograd and Thordarson, 1975; Fenelon and others, 2010). Groundwater in the underlying regional carbonate system moves from the northeast to the southwest through Frenchman Flat and discharges to springs and seeps in the Ash Meadows discharge area (fig. 1; Fenelon and others, 2012, plate 4; Halford and Jackson, 2020). No discharge occurs to perennial streams, springs, or seeps within Frenchman Flat.
The vertical hydraulic gradient is downward in Frenchman Flat. The hydraulic head in the alluvial-volcanic system is 2,407 ft at well ER-5-3 main. This head is more than 10 ft higher than measured hydraulic heads in the carbonate-rock at well ER-5-3-2, which range from 2,374 to 2,395 ft (U.S. Geological Survey, 2021). Depths to water in the alluvial-volcanic system range between 700 and 950 ft bls in Frenchman Flat (fig. 1; Elliott and Fenelon, 2018).
Hydrochemistry
Hydrochemical studies of Frenchman Flat indicate that alluvial-volcanic and carbonate groundwater have distinct geochemical compositions (Chapman and Lyles, 1993; Hershey and others, 2005). Alluvial-volcanic groundwater is a sodium-bicarbonate type with total dissolved solids (TDS) concentrations that range from about 250 to 550 milligrams per liter (mg/L) (Hershey and others, 2005). Groundwater in carbonate rocks at well ER-5-3-2 is a sodium-calcium-magnesium bicarbonate type with a high TDS concentration of 692 mg/L (Hershey and others, 2005).
Well ER-5-3-2 History
Well ER-5-3-2 was drilled to obtain geologic, hydrologic, and radionuclide information from the carbonate system beneath Frenchman Flat (IT Corporation, 2000). Drilling and recompletion activities occurred from 2000 to 2001. Following well recompletion in 2001, well development, step drawdown, and aquifer testing was done in well ER-5-3-2. Flow logging and water-chemistry sampling occurred during well-development and step-drawdown activities. Quarterly water-level measurements and periodic water-temperature measurements were the only site activities at well ER-5-3-2 from 2001 to 2016. Pumping for annual water-quality sampling occurred from 2016 to 2020.
Drilling and Recompletion
Well ER-5-3-2 was drilled and completed from March 16 to May 19, 2000; however, the finished well design did not meet design specifications and the well required recompletion in 2001 (IT Corporation, 2000, 2001). Original design specifications were for a well with a single open interval, hydraulically connected only to carbonate rocks (IT Corporation, 2000). The completed well in 2000 was open to volcanic and carbonate rocks. Overlying volcanics were unintentionally included in the open interval because the completion string occurred at a shallower depth than targeted, a consequence of drilling complications that included sloughing and unstable borehole conditions (IT Corporation, 2000). Most of the sloughed material was assumed to be from the TCU (IT Corporation, 2000).
Well ER-5-3-2 was recompleted from March 9 to March 21, 2001, with the goal of isolating the open interval to carbonate rocks only (Bechtel Nevada, 2005b). Well ER-5-3-2 was recompleted by cementing the annulus around the 5.5-in. slotted interval open to volcanic rocks to ensure the open interval is hydraulically connected only with carbonate rocks (fig. 2; IT Corporation, 2001). The recompleted well is open to carbonate rocks through the non-cemented section of slotted casing and open borehole from 4,678 to 5,680 ft bls (Bechtel Nevada, 2005b). Stratigraphic, lithologic, hydrogeologic, water-production, and well-construction information at recompleted well ER-5-3-2 is provided on figure 2.
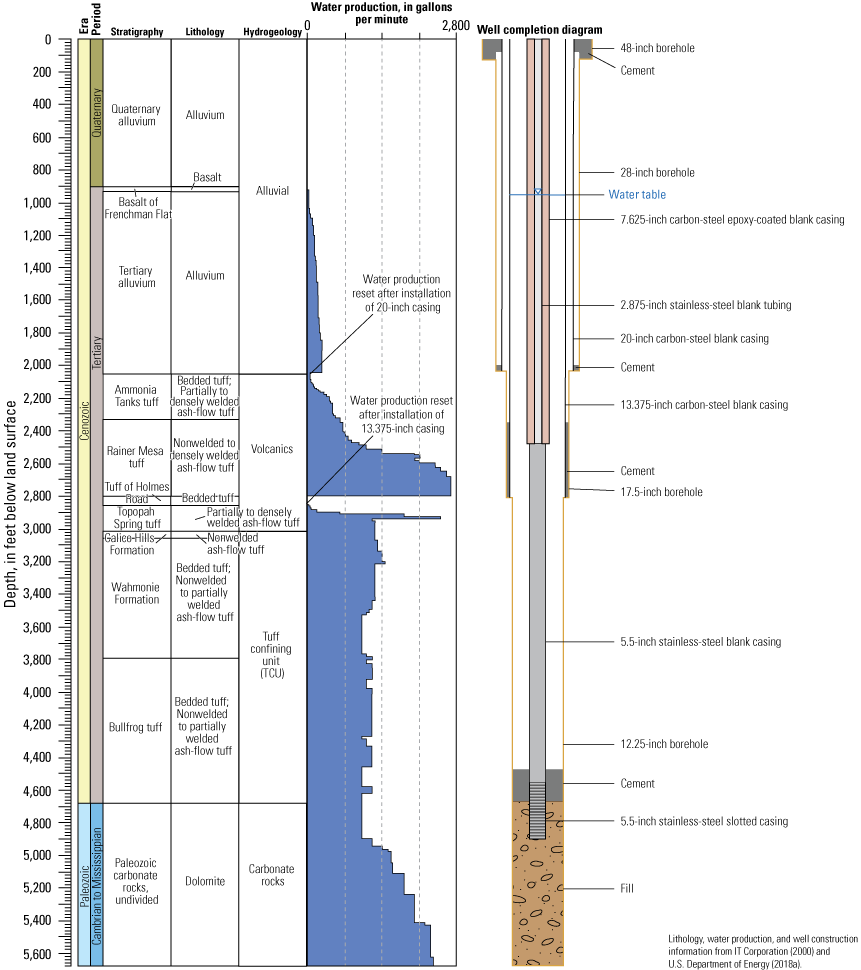
Stratigraphy, lithology, hydrogeology, water production, and construction of well ER-5-3-2, Frenchman Flat, southern Nevada (modified from figure 4-6 of IT Corporation [2000] and figure C-3 of U.S. Department of Energy [2018a]).
A total of 104 million gallons of groundwater were withdrawn during drilling activities at well ER-5-3-2 (Bechtel Nevada, 2005b). Based on the water-production log, about 20 percent of the 104 million gallons (or about 20 million gallons) were withdrawn from carbonate rocks (fig. 2).
Recompleted well ER-5-3-2 has relatively little measured deviation. A deviation survey was done after well recompletion on May 1, 2001. Results from the deviation survey show that the lowest surveyed depth, at 4,890 ft bls, has a small drift of 148.1-ft north of the wellhead (Bechtel Nevada, 2005b). At the approximate depth of water in the well (950 ft), the horizontal drift in the well is 1.9 ft; this means a correction of the measured water-level depth for vertical borehole deviation is less than 0.01 ft.
Well Development, Step Drawdown, and Aquifer Testing
The well-development period spanned from April 6 to 24, 2001 (fig. 3A). An electric submersible pump functionality test was done on April 6 and was followed by well development and step-drawdown testing from April 6 to 19. The step-drawdown test involved short (hourly) durations of pumping at rates of 65, 90, 115, 140, and 165 gallons per minute (gal/min) with overnight pumping at a constant rate of 160 gal/min (fig. 3A). The step-drawdown test was interrupted by a temporary shutdown of pumping caused by the failure of the pump assembly on April 10 (IT Corporation, 2001). Pumping also was stopped for 2 days to perform scheduled activities of stressed-flow logging on April 17 and depth-discrete bailer sampling on April 18 (IT Corporation, 2001). After a final, brief period of pumping on April 19, water levels were allowed to recover for 5 days from April 19 to 24. During well-development and step-drawdown testing from April 6 to 19, water-temperature changes and the repeated removal and reinstallation of the pressure transducer resulted in different relative water-level changes between periods of step-drawdown testing (fig. 3A).
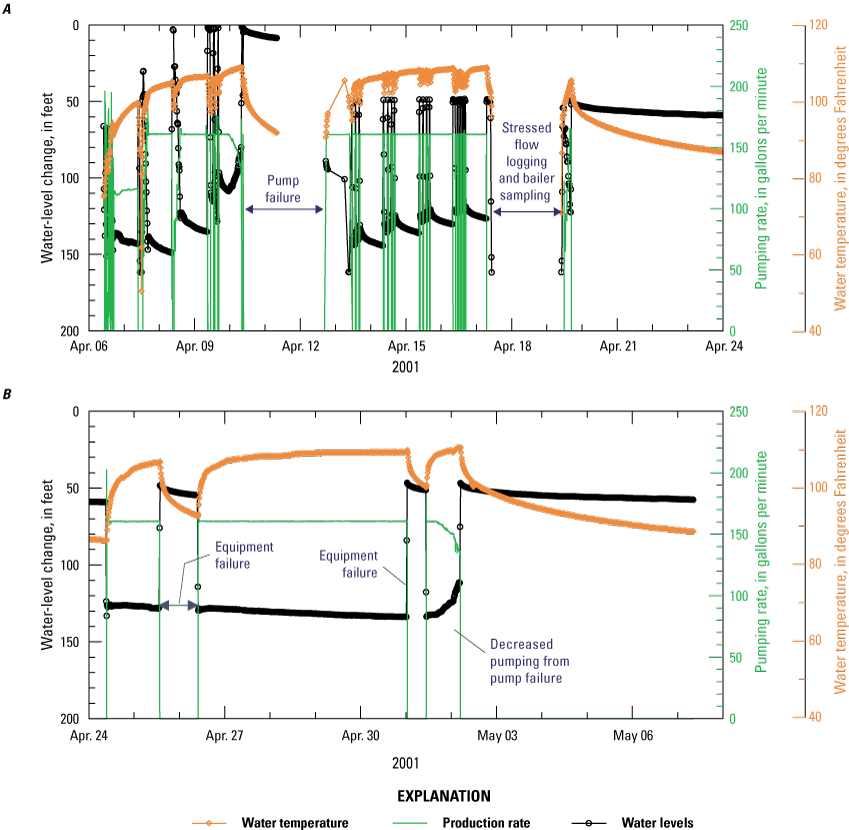
Water levels, production rates, and water temperature in well ER-5-3-2 during A, well development and step-drawdown testing and B, the constant-rate aquifer test, April–May 2001, Frenchman Flat, southern Nevada. Data and testing details are available in IT Corporation (2001).
During the constant-rate test, the well was planned to be pumped at a constant rate of 160 gal/min for 10 days, from April 24 to May 2, 2001 (fig. 3B). The constant-rate test ceased temporarily from April 25 to 26 and again on May 1 because of equipment failures (IT Corporation, 2001). When pumping recommenced from May 1 to 2, a constant pumping rate of 160 gal/min could not be maintained because the electric submersible pump was failing. During this period of pump failure, water levels rose 21 ft as the pumping rate slowly decreased from 160 to 135 gal/min (fig. 3B). Because of repeated equipment failures, the constant-rate test was stopped on May 2.
About 3.4 million gallons of groundwater were withdrawn from April 6 to May 2, 2001, during the combined periods of well development, step-drawdown testing, and the constant-rate test (fig. 3). About 1.9 million gallons of groundwater were withdrawn during well development and step-drawdown testing, and 1.5 million gallons of groundwater were withdrawn during the constant-rate test.
Water temperatures increased in the open interval of well ER-5-3-2 during pumping periods for well development, step-drawdown testing, and the constant-rate test (fig. 3). The measured water temperature at the open interval was warmer compared to the top of the water column (water table), which is about 3,700 ft above the open interval. During pumping, the water-temperature increased, and the density of the entire water column decreased, which caused the water level in the well to rise. For example, during the constant-rate test, water temperatures in the open interval increased from 86 to 111 °F (fig. 3B), which resulted in an estimated water-level rise of 12 ft (Jackson and Frus, 2023, appendix E). Most of the water-level rise was masked by drawdowns from pumping. The temperature-induced water-level rise had the greatest effect during the early period of pumping because of the rapid rise in water temperature.
Transmissivity was estimated for carbonate rocks at well ER-5-3-2 using water-level data from the constant-rate test. Drawdown-recovery periods from April 24 to 26, 2001, and from April 26 to May 7, 2001, were analyzed using the Cooper and Jacob (1946) method. Estimated transmissivities were 620 ft2/d (April 24–26) and 530 ft2/d (April 26–May 7; Jackson and Frus, 2023, appendix C). The best estimate is 530 ft2/d because temperature effects had mostly dissipated during late-time drawdown and late-time recovery (fig. 3B).
Water levels in nearby observation wells open to alluvium (ER-5-3 main, ER-5-3 shallow, and ER-5-3-3) and open to alluvial-volcanics (ER-5-3 deep) were monitored during well development, step-drawdown testing, and aquifer testing at well ER-5-3-2 (fig. 1). Water levels in these nearby observation wells did not respond to pumping from well ER-5-3-2 (IT Corporation, 2001). The lack of observed drawdown in these close-proximity observation wells after this prolonged period of pumping indicate that the carbonate system at well ER-5-3-2 is hydraulically isolated from overlying alluvial-volcanics. This result confirms that the more than 1,500 ft of low-permeability TCU at well site ER-5-3-2 hydraulically isolates the carbonate rocks from overlying alluvial-volcanics (fig. 2).
Flow Logging
Stressed-flow logging was done near the end of well development and step-drawdown testing on April 17, 2001 (IT Corporation, 2001). During flow logging, the well was pumped at a constant rate and a spinner (impeller) tool was raised or lowered at a constant line speed in the wellbore to measure the flow rate of water into the well. Well ER-5-3-2 was pumped at three constant rates: 65, 115, and 165 gal/min. For each constant-pumping period, the spinner tool was run at three line speeds and directions: (1) downward at 20 ft/min, (2) upward at 60 or 70 ft/min, and (3) downward at 40 ft/min (IT Corporation, 2001).
Thermal-flow logging was done after the constant-rate test, on May 11, 2001, to quantify circulation within the well (IT Corporation, 2001). For details on the applied instrumentation and methodology of thermal-flow logging, see IT Corporation (2001).
Stressed- and thermal-flow logging provide information on the vertical distribution of groundwater inflow into well ER-5-3-2. Results of the flow-logging were used to infer transmissive intervals in the wellbore. Stressed- and thermal-flow logging only were done in the 5.5-in. slotted casing at depths from 4,500 to 4,890 ft bls (fig. 2). Therefore, this study used the water-production log recorded during the initial drilling of well ER-5-3-2 to infer transmissive intervals in the open borehole below the slotted casing to a depth of 5,680 ft (fig. 2).
Flow and water-production logs indicate that the most transmissive carbonate intervals open to well ER-5-3-2 occur deeper within the open borehole. Stressed- and thermal-flow logging results indicate that zones of inflow occur at depths of 4,725–4,890 ft bls (IT Corporation, 2001). However, the water-production log indicates that carbonate rocks are more transmissive below the slotted casing, and transmissivity likely increases with depth in the open borehole.
Water-Quality Sampling
Water-quality samples were collected during well development and step-drawdown testing and after aquifer testing in 2001. Depth-discrete bailer samples were collected on April 18, 2001, near the end of well development and step-drawdown testing. During depth-discrete bailer sampling, a constant pumping rate of 165 gal/min was maintained while groundwater samples were collected near the bottom of the 5.5-in. slotted casing, at a depth of 4,870 ft bls, using a wireline bailer (IT Corporation, 2001). Composite groundwater samples under pumping conditions were collected at the wellhead sampling port on May 17, 2001. Before composite wellhead sampling, the well was purged overnight by pumping at a constant rate of 36 gal/min (IT Corporation, 2001). Water-quality parameters analyzed included a suite of 105 major and trace constituents, stable isotopes, and radionuclides (Jackson and Frus, 2023, appendix D). See U.S. Department of Energy (2018b) for sampling and analysis methods and U.S. Department of Energy (2015b) for quality-assurance methods.
Composite wellhead sampling was done annually from 2016 to 2020. Before each sampling event, well ER-5-3-2 was purged by pumping overnight (at least 12 hours). Pumping rates ranged from 21.1 to 29.9 gal/min and total groundwater withdrawals were between 30,000 and 46,000 gallons (table 1). During the 2016 and 2017 pumping-sampling events, a similar suite of 67–77 major and trace constituents and radionuclides were analyzed (U.S. Department of Energy, 2017, 2018a). For subsequent (2018–20) pumping-sampling events, a reduced suite of 12 trace constituents and radionuclides were analyzed (U.S. Department of Energy, 2019, 2020, 2021).
Table 1.
Pumping and non-pumping periods for well ER-5-3-2 from 2001 to 2021, Frenchman Flat, southern Nevada.[Start and end date: refer to time interval of well activity, in month (mm), day (dd), year (yyyy), hour (hh), and minute (mm). Pumping rate: reported in gallons per minute (gal/min). Total pumped is total groundwater withdrawal during well activity, in gallons (gal). Data compiled from IT Corporation (2001) and U.S. Department of Energy (2017, 2018a, 2019, 2020, 2021) 49515253Abbreviation: —, no data]
Water-Level Data
Water levels in well ER-5-3-2 were monitored with pressure transducers for short durations after completion and recompletion. Water-level altitudes were about 2,462 ft in well ER-5-3-2 from September 20 to November 21, 2000, which is about 4 months after the well was initially drilled (IT Corporation, 2001). A water-level altitude of 2,462 ft is elevated relative to alluvial-volcanic water-level altitudes in Frenchman Flat, which are about 2,408 ft (Elliott and Fenelon, 2018). A water-level altitude of 2,462 ft also is elevated relative to regional carbonate water-level altitudes, which range from about 2,370 to 2,400 ft (Fenelon and others, 2010, 2012). The elevated level of 2,462 ft is suspect and attributed to high-viscosity polymer (drilling fluid) that could not easily drain out of the borehole (IT Corporation, 2001). Following recompletion, from March 30 to April 4, 2001, water-level altitudes were about 2,373 ft in well ER-5-3-2 (fig. 4; Bechtel Nevada, 2005b).
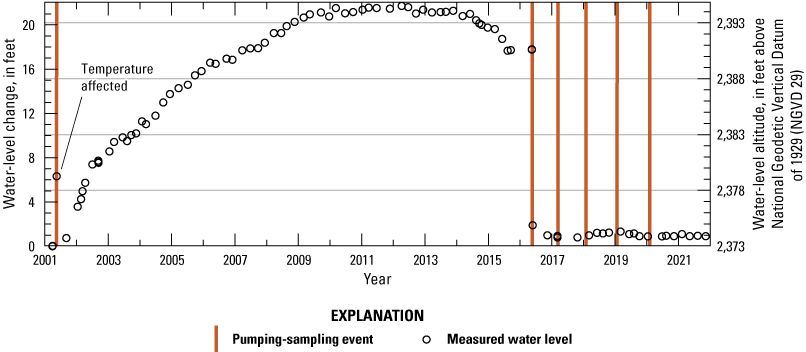
Water-level hydrograph of well ER-5-3-2 in Frenchman Flat, southern Nevada. Data are available in U.S. Geological Survey (2021).
Static water-level altitudes for well ER-5-3-2 were about 2,373 ft before well development, step-drawdown testing, and the constant-rate test (Elliott and Fenelon, 2018). A maximum drawdown of about 80 ft occurred during the constant-rate test and water temperature increased 25 °F (13.9 degrees Celsius, °C) in the open interval of the well (fig. 3B). Water levels recovered to a static water-level altitude of 2,374 ft within several months of the constant-rate test (fig. 4). During water-level recovery, water levels declined as water in the borehole cooled to pre-pumping temperatures (see temperature affected water-level measurement from May 18, 2001, fig. 4).
From late 2001 to 2011, water levels rose about 21 ft before declining 4 ft from 2012 to 2016 (fig. 4). In 2016, a pumping-sampling event resulted in an abrupt 17-ft decline in water levels. Water levels have not recovered between annual pumping-sampling events from 2016 to 2020. Instead, water levels from 2016 to 2021 were stable at an altitude of 2,374 ft (fig. 4). This 2,374-ft altitude is similar to the water-level altitudes measured within months of water-level recovery from the constant-rate test.
Methods
Geologic, water-level, water-chemistry, and aquifer-test data were compiled for analyses in this study. Regional hydraulic-head data were used to determine the hydraulic head most representative of the carbonate system at the ER-5-3-2 well site. Geologic, water-level, and aquifer-test data for well ER-5-3-2 were used to calibrate hypothetical groundwater models. These groundwater models were used to evaluate potential stresses and hydrologic conditions affecting the well ER-5-3-2 hydrograph for the 2001–21 period (fig. 4). Water-chemistry data were used to support interpretation of results from groundwater models simulating wellbore leakage and to determine if the chemistry is indicative of water from the carbonate system.
Data Compilation
Manual depth-to-water measurements at well ER-5-3-2 were compiled from the USGS National Water Information System Database (https://waterdata.usgs.gov/nwis; U.S. Geological Survey, 2021). Depth-to-water measurements were collected using calibrated electric tapes. The tapes are marked with 0.01-ft graduations but have an accuracy of plus or minus (±) 0.1 ft at measured depths of about 1,000 ft (Fulford and Clayton, 2015).
Predevelopment hydraulic heads from regional wells in the study area, open to carbonate rock were compiled from Fenelon and others (2010, 2012) and Jackson and Frus (2023, appendix A). Fenelon and others (2010, 2012) computed predevelopment hydraulic heads by averaging manual depth-to-water measurements flagged as representing steady-state (predevelopment) conditions. A steady-state hydrologic condition is based on the assumption that the measured water level is minimally affected by pumping and responds primarily to natural recharge fluctuations.
Geologic data include stratigraphic, lithologic, and hydrogeologic data (fig. 2). Geologic data at well ER-5-3-2 were compiled from IT Corporation (2001) and U.S. Department of Energy (2018a). Hydrogeologic data from regional wells were compiled from Bechtel Nevada (2005a) and Fenelon and others (2010, 2012)16.
Aquifer-test data for well ER-5-3-2 include high-frequency (5-second) water-level, barometric-pressure, water-temperature, and water-production data compiled from IT Corporation (2001) and Jackson and Frus (2023, appendix B; fig. 3). Water levels and temperatures were measured with a vented transducer, which has a pressure range of 0–50 pounds per square inch (lb/in2) with an accuracy of + 0.01 lb/in2 and a temperature range of 0–40 °C with an accuracy of + 1 °C (Design Analysis Associates, 2021). Barometric pressure was measured with a barometer that has an operational range of 600–1,060 millibars and an accuracy of + 0.6 millibar at 20 °C (68 °F; Campbell Scientific, Incorporated, 1994). A data logger with an integrated barometer was used to record water-level, temperature, and barometric-pressure data at well ER-5-3-2 every 5 seconds, or more often, if the measured water level changed more than 0.5 lb/in2 (1.2 ft). Pumping rates in well ER-5-3-2 were measured with a flowmeter that measures rates between 18 and 230 gal/min and has a flow-rate accuracy of 0.5 percent (Schneider Electric, 2020).
Water-chemistry data for wells ER-5-3-2, ER-5-3 shallow (alluvial), and UE-5 PW-3 (volcanic) were compiled from the Underground Test Area activity chemistry database (Navarro, 2021) and are documented in Jackson and Frus (2023, appendix D). Major- and trace-ion concentrations that were assigned data qualifiers in the database were evaluated using a coefficient of variation (CV), defined as the standard deviation divided by the mean (Helsel and others, 2020). For a specific ion measured in a well, the CV was computed using all ion concentrations from all sampling events. A CV threshold of 30 percent was used to determine if the ion with the data qualifier was used in the analysis. A threshold of 20 percent has been commonly used to quantify the acceptable variability of environmental samples (Mueller and others, 2015); but for this study, a threshold of 30 percent was established to allow for testing of scenarios that could have influenced the water chemistry at this well. If an ion concentration had a CV that was greater than the threshold, then the ion concentration with the data qualifier was not used in the analyses. If the CV was less than the threshold, then the qualified ion concentration was included in the analyses. For example, the UE-5 PW-3 sample date of September 10, 2008, had a data qualifier on the potassium concentration (4.54 mg/L) indicating “contamination in associated blank(s)” (Jackson and Frus, 2023, appendix D). Potassium concentrations at this well (n=20) had a CV of 6 percent, which was below the 30-percent threshold and allowed the September 10, 2008, potassium concentration to be used in the analysis. Major- and trace-ion concentrations that were reported below method detection limits were eliminated from the analysis. Major- and trace-ion concentrations with no data qualifiers that were above method detection limits were included in the analysis. Greater than 90 percent of all radionuclide results were below method detection limits, which included no measurable tritium in any of the wells analyzed for this study. Therefore, all radionuclide results were eliminated from the water-quality analyses.
Regional Analysis of Hydraulic Heads
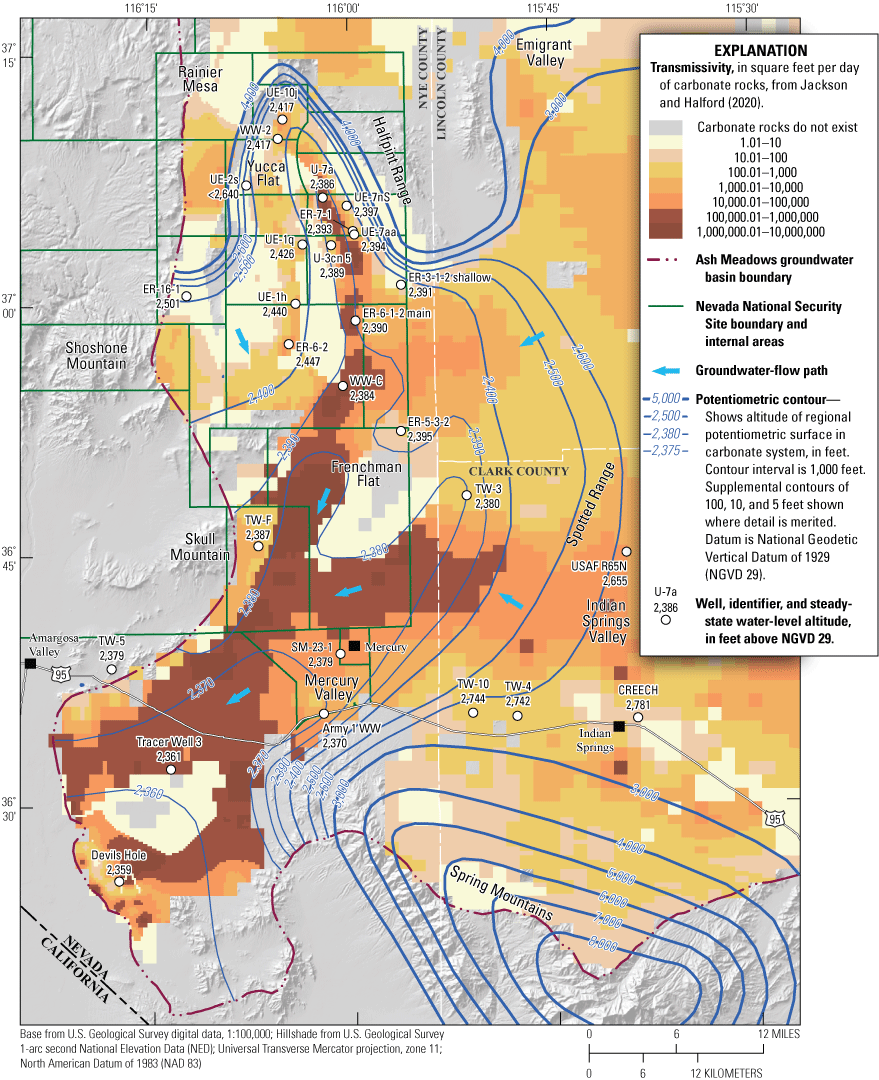
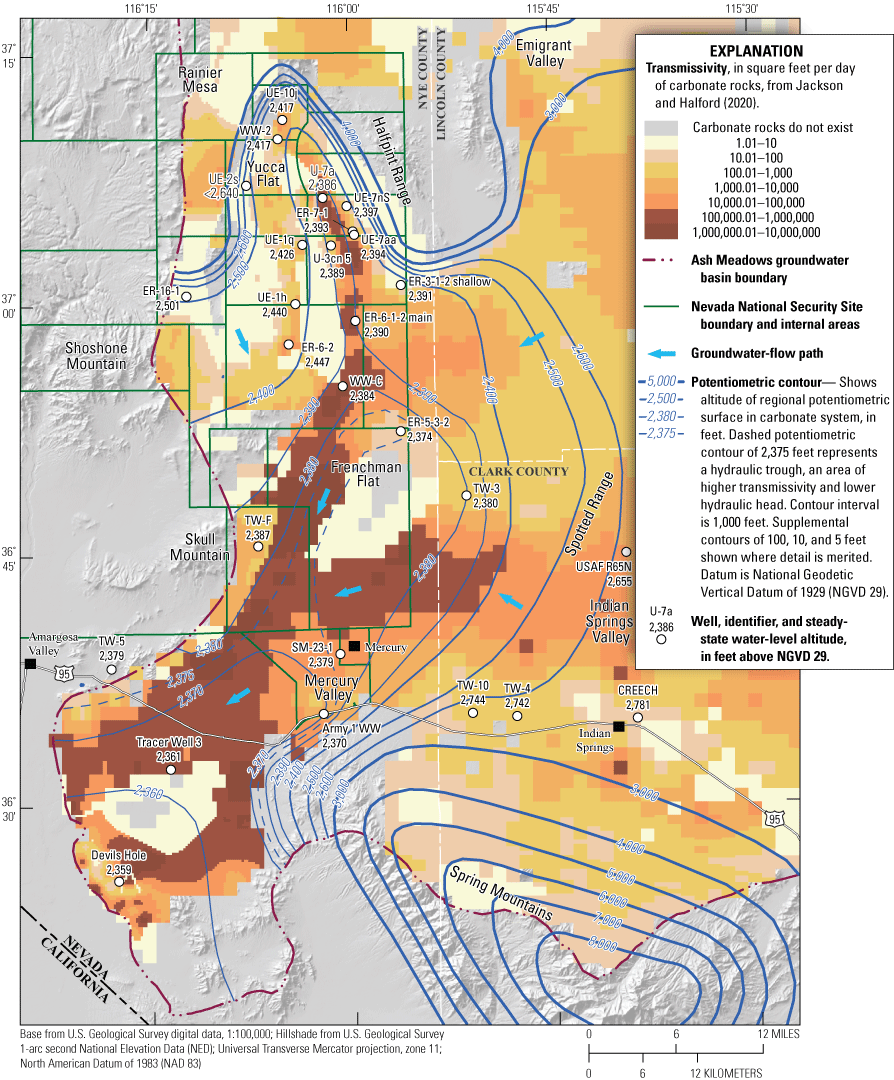
An analysis of regional hydraulic heads was done to determine whether the lowest or highest non-pumping hydraulic head measured in well ER-5-3-2 could be representative of predevelopment conditions in the carbonate system. The analysis involved the development of two regional potentiometric maps of the carbonate system using either the low (2,374 ft) or high (2,395 ft) head at well ER-5-3-2 (fig. 4). Potentiometric maps were developed using predevelopment hydraulic heads compiled from 31 wells open to carbonate rock (Fenelon and others, 2010, 2012). These wells are in Frenchman Flat, Yucca Flat, Yucca Mountain, Indian Springs Valley, Mercury Valley, and near Ash Meadows discharge area (fig. 1). Compiled hydraulic heads used in the regional analysis are documented in Jackson and Frus (2023, appendix A).
Potentiometric contours developed in this study were guided by a transmissivity map, simulated water-level contours from a regional model, and potentiometric maps from previous work. Simulated water-level contours and the transmissivity map of carbonate rocks in Ash Meadows groundwater basin were obtained from a regional numerical model (Jackson and Halford, 2020). A potentiometric map of the regional carbonate system (Fenelon and others, 2010, plate 4) and a detailed potentiometric map of the carbonate system beneath Yucca Flat (Fenelon and others, 2012, plate 4) guided contouring in Frenchman Flat.
Water-Chemistry Analyses
Statistical analyses were done on water-chemistry data for three sampling periods: (1) the average of analytical results from sampling on April 18 and May 17, 2001; (2) analytical results from sampling on May 20, 2016; and (3) analytical results from sampling on March 15, 2017. These sampling periods are referred to herein as the 2001, 2016, and 2017 sampling events. Water-chemistry data for the 2018, 2019, and 2020 sampling events were not used because major-ion chemistry was not analyzed, and only a few radionuclides and trace elements were analyzed with concentrations primarily below detection. Water-chemistry data used in analyses of this report are documented in Jackson and Frus (2023, appendix D).
Water-chemistry data were analyzed with statistical analyses using up to 20 parameters that included major and trace constituents and water-quality indicators from pumping-sampling events at well ER-5-3-2. A nonparametric Wilcoxon matched-pairs signed-rank test was used to determine if the difference in water-quality analytical results between the 2001 and the 2016 or 2017 sampling events in well ER-5-3-2 was statistically significant (Wilcoxon, 1945; Helsel and others, 202023).
Piper and stiff diagrams were generated using Geochemist’s Workbench Release 11.0.6 software (Bethke and Farrell, 2021). Well ER-5-3-2 major-ion chemistry was plotted for the 2001, 2016, and 2017 sampling events to determine observed differences. The piper and stiff diagrams also were used to visually compare the major-ion chemistry of water in the carbonate system (well ER-5-3-2) to water in the alluvial (well ER-5-3 shallow) and volcanic (well UE-5 PW-3) systems (fig. 1).
Development and Calibration of Groundwater Models
Three-dimensional, groundwater-flow models were used to evaluate potential stresses or hydrologic conditions causing the water-level responses in well ER-5-3-2. All groundwater models simulated the constant-rate aquifer test and the pumping during annual sampling events from 2016 to 2020. Four model scenarios were developed that simulated (1) wellbore leakage without recharge, (2) wellbore leakage with recharge, (3) equilibration following pumping events in response to vertical heterogeneity between shallow and deep carbonate zones, and (4) equilibration following pumping events in response to lateral heterogeneities in carbonate rocks.
Groundwater-flow equations were solved using the USGS finite-difference model, MODFLOW 6 (Langevin and others, 2017). Groundwater models were calibrated by fitting simulated water-level drawdown to measured drawdowns (fig. 3B) and the well ER-5-3-2 hydrograph (fig. 4) using the Parameter ESTimation code (PEST; Doherty, 2010a). Archives of the groundwater models containing executables, PEST calibration files, MODFLOW 6 files, and post-processing utilities for extracting results are available in Jackson and Frus (2023, appendix F).
Common Construction of Models
All groundwater models share a common domain and discretization. The model domain is a square box, 140,000 ft (26.5 miles) on a side, that is centered on well ER-5-3-2 (figs. 1, 5A). Lateral domain boundaries were specified as no-flow boundaries. These no-flow boundaries were sufficiently far to avoid boundary effects from pumping-drawdown in well ER-5-3-2.
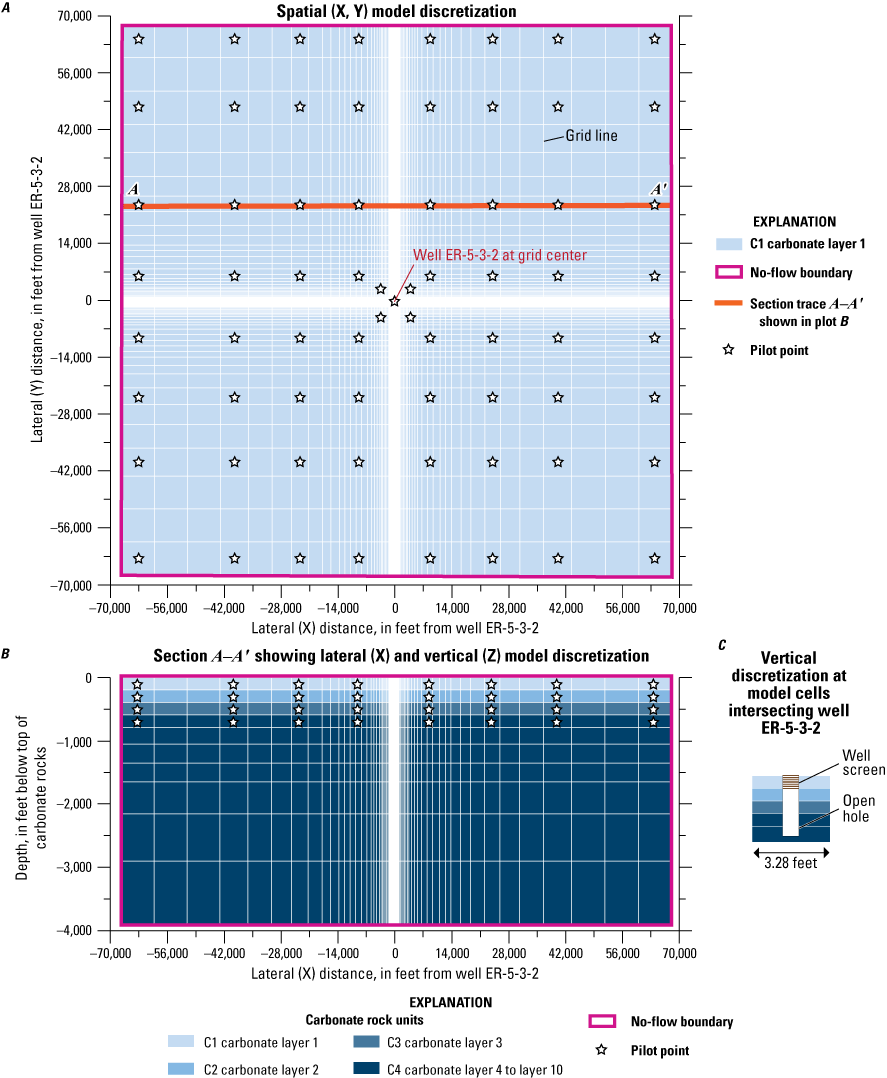
A, Lateral and B, vertical grid discretization of groundwater models, and C, vertical discretization at model cells that intersect well ER-5-3-2, Frenchman Flat, southern Nevada.
Each model was discretized laterally into 87 rows and 87 columns (fig. 5A). Grid refinement of model cells ranged from 3.28 ft (1 meter, m) at well ER-5-3-2 (fig. 5C) to 8,202 ft (2,500 m) at the domain boundaries (fig. 5B). The model grid is oriented north-south in Universal Transverse Mercator (UTM), zone 11, North American Datum of 1983 (NAD 83) projection, and the X and Y coordinates of the northwest corner of the model domain area are 573,309.7 and 4,102,552 m, respectively (fig. 1).
Each model was discretized vertically into 10 layers (fig. 5B). The top of the model is the TCU-carbonate contact, which has an altitude of 4,670 ft in well ER-5-3-2. Top and bottom elevations of model layers are referenced to depth, in feet, below the top of carbonate rocks. The top of model layer 1 is at 0 ft, which is at the TCU-carbonate contact, whereas the bottom of model layer 10 is at −3,950 ft below the top of carbonate rocks (fig. 5B).
The top and bottom of the model domain were specified as no-flow boundaries. The top of model layer 1 occurs at the TCU-carbonate contact because carbonate rocks at well ER-5-3-2 are overlain by more than 1,500 ft of low-permeability TCU that hydraulically isolates carbonate rocks from overlying alluvial volcanics (fig. 2). The bottom of model layer 10 was sufficiently deep (−3,950 ft below the TCU-carbonate contact) to avoid boundary effects from pumping-drawdown in well ER-5-3-2.
Vertical discretization increases from layer 1 to 10 (fig. 5B). Layers 1–4 are 200-ft thick. Layers 5–10 have thicknesses of 250, 300, 350, 500, 750, and 1,000 ft, respectively. Vertical discretization was finer in the shallower part of the model (layers 1–5) because the open hole and well screen of ER-5-3-2 intersected these layers (fig. 5C), and simulated drawdowns to pumping stresses were greatest in these layers. Changes in saturated thickness were not simulated because the water table is more than 3,700 ft above the top of the model domain.
All groundwater models had the same temporal discretization to simulate pumping and non-pumping periods from 2001 to 2021. The constant-rate test was simulated with six stress periods to capture the three pumping and three recovery periods that spanned from April 24, 2001, to July 18, 2001 (table 1). Non-pumping periods from July 18, 2001, to May 19, 2016, were simulated with 16 stress periods, 1 stress period for each year (table 1). Pumping during annual sampling events from May 19, 2016, to December 31, 2020, was simulated with five stress periods, with intervening non-pumping periods simulated between sampling events (table 1). Each stress period was subdivided into 15 timesteps that successively increased by a factor of 1.1. Pumping and non-pumping periods were simulated with the MODFLOW 6 well package (Langevin and others, 2017).
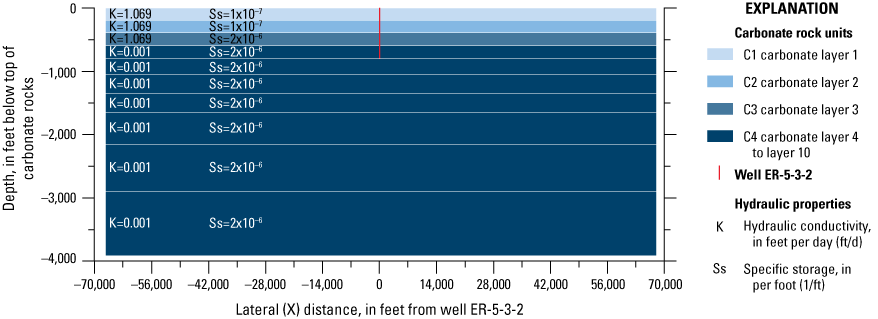
Distributing Hydraulic Properties in Carbonate Rocks
Carbonate rocks have lateral and vertical heterogeneity. Aquifer-test results indicate that carbonate-rock hydraulic conductivity in the study area spans at least six orders of magnitude laterally (Winograd and Thordarson, 1975). The hydraulic conductivity of carbonate rocks also varies with depth (Halford and Jackson, 2020). To account for potential hydraulic-conductivity variations with depth near well ER-5-3-2, carbonate rocks were divided into four units, C1–C4 (fig. 5B). Carbonate units C1–C3 correspond to model layers 1–3, respectively. Carbonate unit C4 is composed of model layers 4–10 (fig. 5B).
Hydraulic properties (hydraulic conductivity and specific storage) were estimated for carbonate units C1–C4. Hydraulic-property distributions were estimated with PEST using pilot points (RamaRao and others, 1995). Pilot points are user-specified locations, which were uniformly distributed across the model domain (fig. 5A). Additional pilot points occurred near well ER-5-3-2 because only data from the well were used to constrain hydraulic-property estimates. Hydraulic-property values were estimated at pilot-point locations with PEST and then interpolated across the model domain to estimate continuous hydraulic-property distributions. Interpolation was done with kriging using variograms (Doherty, 2010b).
Isotropic, exponential variograms defined spatial variability of log-hydraulic properties, where spatial correlation was specified with user-defined ranges (distances). Spatial correlation is assumed non-existent where distances between the interpolated location (cell center) and known value (pilot point) exceed the range. An interpolated hydraulic-property value at a cell functionally was an inverse-distance weighted average of, at most, the eight nearest pilot-point values if all distances between cell center and pilot points were less than the range. A hydraulic-property value at a cell is a simple average if distances between a cell center and the nearest pilot points all exceed the range.
In this study, pilot points were grouped by carbonate unit. For example, for carbonate unit C1, only pilot points that occur within unit C1 (layer 1) were used to interpolate hydraulic-property values at model cells within unit C1. Interpolated hydraulic properties varied laterally but were uniform with depth in multiple-layer carbonate units; for example, carbonate unit C4 spans model layers 4–10. Pilot points in unit C4 (layer 4; fig. 5B) were used to interpolate hydraulic-property values at model cells within model layer 4 of unit C4. Because hydraulic properties are uniform with depth in unit C4, the lateral hydraulic-property distributions are the same in model layers 4–10.
Hydraulic Conductivity
Hydraulic conductivities were assigned with the node-property flow package in MODFLOW 6 (Langevin and others, 2017). Hydraulic conductivities were estimated with 273 pilot points. Isotropic, exponential variograms were used to define spatial variability of log-hydraulic conductivities with a range of 4,500 ft. Hydraulic-conductivity estimates were constrained during parameter estimation between 1×10⁻⁶ and 500 feet per day (ft/d), which is the expected range for carbonate rocks in the study area (Belcher and others, 2002; Halford and Jackson, 2020).
Specific Storage
Specific-storage values were assigned with the storage package in MODFLOW 6 (Langevin and others, 2017). Specific-storage values were estimated with 273 pilot points. Isotropic, exponential variograms were used to define spatial variability of log-specific storages with a range of 4,500 ft.
Specific-storage pilot points were constrained between 1×10⁻⁹ and 2×10⁻⁵ 1/ft during calibration. This range was greater than the expected range of 1×10⁻⁶ to 2×10⁻⁵ 1/ft in fractured carbonate rocks (Batu, 1998), but it was permitted to compensate for thin, undifferentiated transmissive intervals within thick rock sequences. For example, a 200-ft-thick carbonate unit with a specific storage of 2×10⁻⁶ 1/ft could contain a transmissive interval that is only 20-ft thick. To compensate for a permeable interval that is one-tenth the thickness of the carbonate unit, the specific-storage estimate is reduced by a factor of 10 to 2×10⁻⁷ 1/ft. Correction of carbonate unit thicknesses was beyond the scope of this study.
Model Scenarios
Four model scenarios were developed to evaluate potential stresses or hydrologic conditions affecting water levels in well ER-5-3-2. The model scenarios are (1) wellbore leakage without recharge, (2) wellbore leakage with recharge, (3) equilibration to vertical heterogeneities between shallow and deep carbonate zones, and (4) equilibration to lateral heterogeneities in carbonate rocks. Scenarios that included wellbore leakage assumed downward leakage of water through the wellbore into underlying carbonate rocks from the volcanics, TCU, and the alluvium.
For each model scenario, the following are described: (1) the hypothetical stress(es) or hydrologic conditions driving water-level changes in the well ER-5-3-2 hydrograph; and (2) initial conditions, boundary conditions, and hydraulic-property distributions used to simulate the hypothetical stresses or hydrologic conditions. Hydraulic properties in the model scenarios were estimated by matching simulated and measured (1) water-level drawdowns during the 2001 constant-rate test; and (2) water-level changes in the well ER-5-3-2 hydrograph from 2001 to 2021. Model scenarios were evaluated based on the residual differences between simulated and measured water levels and on water-chemistry results.
All groundwater models are superposition models. A superposition model simulates relative water-level changes from an arbitrary datum in response to one or more applied stresses. In this study, the arbitrary datum is the hydraulic head in well ER-5-3-2 of 2,374 ft, which is the lowest measured water level in the well since the initiation of aquifer testing and pumping for sampling in 2001(fig. 4).
Wellbore Leakage without Recharge
The wellbore leakage without recharge scenario simulates the well ER-5-3-2 hydrograph as vertical leakage in the wellbore. Annual wellbore-leakage rates from 2001 to 2021 were simulated using the MODFLOW 6 well package (Langevin and others, 2017). Hydraulic conductivity, specific storage, and wellbore-leakage rates were estimated with PEST. Homogeneous hydraulic-conductivity and specific-storage distributions were estimated for each carbonate unit, C1–C4, and these model-estimated values are shown on figure 6. Initial heads of 0 ft were specified, which correspond to the recovered hydraulic head of 2,374 ft that occurred after the constant-rate test in 2001.
Estimated hydraulic properties for the wellbore leakage without recharge and wellbore leakage with recharge scenarios. Estimated hydraulic properties are the same for the wellbore leakage with and without recharge scenarios.
Wellbore Leakage with Recharge
The wellbore leakage with recharge scenario simulates the well ER-5-3-2 hydrograph (fig. 4) using two stresses: vertical leakage in the wellbore and meteoric recharge. Annual wellbore-leakage rates from 2001 to 2021 were simulated using the MODFLOW 6 well package (Langevin and others, 2017). Hydraulic conductivity, specific storage, and wellbore-leakage rates were estimated with PEST. Initial heads of 0 ft were specified, which correspond to the recovered hydraulic head of 2,374 ft that occurred after the constant-rate test in 2001. Initial conditions and estimated hydraulic properties were the same for the wellbore leakage with and without recharge scenarios (fig. 6).
The component of water-level rise attributed to meteoric recharge in well ER-5-3-2 was estimated analytically using water-level data from another carbonate well only affected by recharge. Water-level hydrographs were constructed for six wells open to carbonate rocks in nearby areas. Water-level rises in these six carbonate wells were solely from recharge (fig. 7A; Elliott and Fenelon, 2018). Maximum magnitudes of water-level rise were less than 3 ft from 2001 to 2021 (fig. 7A), indicating that the maximum water-level rise of 21 ft in well ER-5-3-2 cannot be attributed entirely to recharge. Well UE-25p 1 has a water-level trend similar to the trend observed in well ER-5-3-2 (fig. 7B). Therefore, water-level data in well UE-25p 1 were used to estimate and remove a potential recharge trend in well ER-5-3-2.
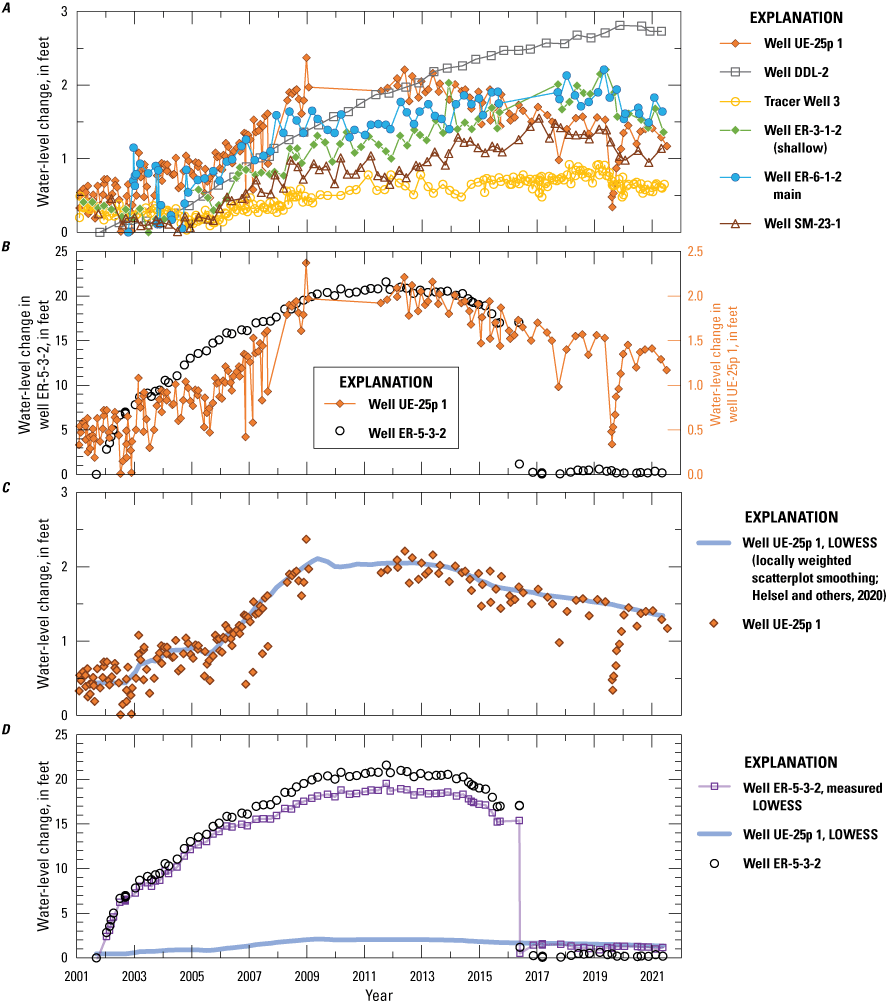
A, Measured water levels in carbonate wells; B, comparison of water-level trends in wells ER-5-3-2 and UE-25p 1; C, well UE-25p 1 measured water levels and locally weighted scatterplot smoothing (LOWESS) curve; and D, well ER-5-3-2 measured water levels with potential recharge effects removed. Measured water-level data are available from U.S Geological Survey (2021).
The water-level rise from wellbore leakage in well ER-5-3-2 was estimated by subtracting measured water levels in well ER-5-3-2 from measured water levels in well UE-25p 1. However, measured water levels in well UE-25p 1 were noisy because of short-term environmental fluctuations caused by barometric pressure, tidal forcing, and earthquakes (fig. 7C; Elliott and Fenelon, 2018). To remove short-term environmental fluctuations, a locally weighted scatterplot smoothing (LOWESS) curve (Helsel and others, 2020) was fit to the measured data in well UE-25p 1 (fig. 7C). Measured water levels in well ER-5-3-2 were subtracted from the well UE-25p 1 LOWESS curve to remove potential recharge effects and to estimate the component of the water-level trend solely from wellbore leakage. Simulated water levels were fit to the estimated wellbore-leakage water-level trend in well ER-5-3-2 (well ER-5-3-2, measured LOWESS, fig. 7D).
Equilibration to Shallow and Deep Carbonate Zones
Equilibration following pumping events in response to interactions between shallow and deep carbonate zones with notably different transmissivities is referred to as the shallow-deep carbonate scenario. The shallow-deep carbonate scenario is based on the assumption that carbonate rocks are divided into a shallow and a deep carbonate zone. The shallow carbonate zone has rocks with low transmissivity (less than 1 ft2/d) and a high-static hydraulic head of 2,395 ft, whereas the deep carbonate zone has rocks with higher transmissivity (530 ft2/d) and a low-static hydraulic head of 2,374 ft (fig. 8A). Shallow, low-transmissivity rocks are conceptualized to occur within the upper 200 ft of the open borehole, which is consistent with water-production and flow-log results (see fig. 2 and the “Flow Logging” section for details). A high head in the shallow carbonate is consistent with high heads in the volcanic rocks overlying the carbonate system. The shallow carbonate zone can be conceptualized as low-transmissivity regolith at the top of the carbonate.
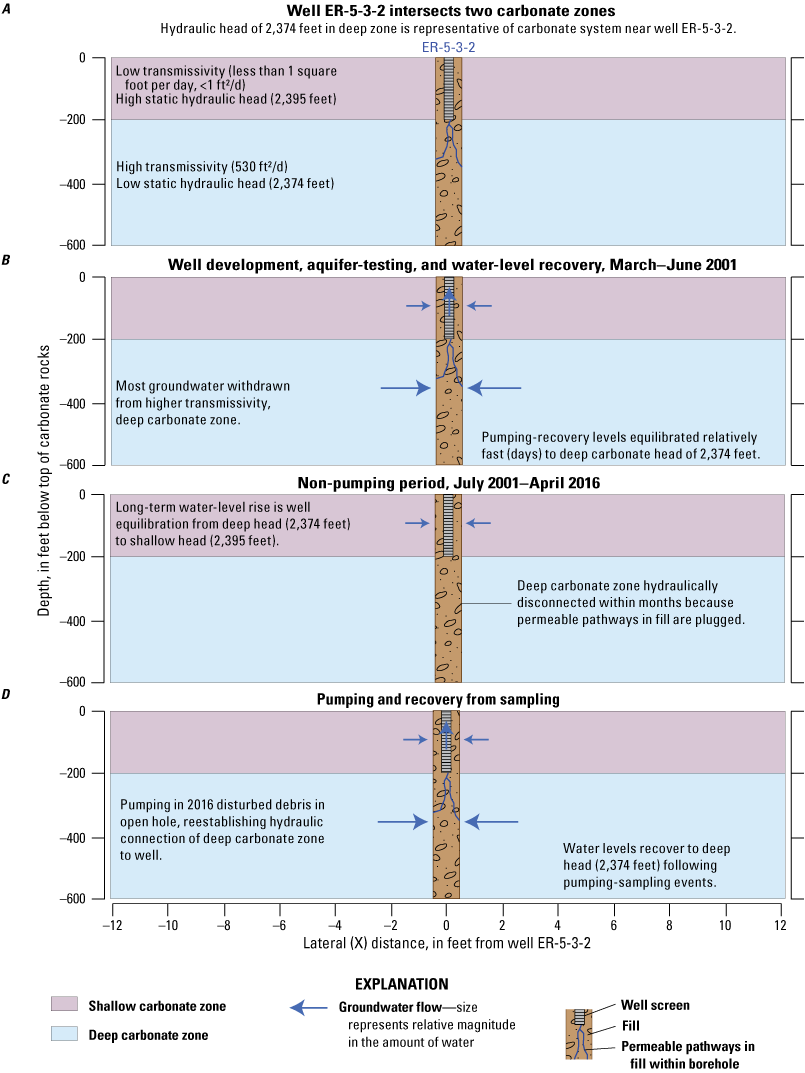
Aquifer conditions at well ER-5-3-2 for the shallow-deep carbonate scenario during A, predevelopment (before drilling well ER-5-3-2) with overlain well completion; B, well development, aquifer testing, and water-level recovery; C, the non-pumping period; and D, pumping and recovery from sampling in well ER-5-3-2, Frenchman Flat, southern Nevada.
For the shallow-deep carbonate scenario, the head of 2,374 ft in the deep carbonate zone is assumed representative of the carbonate system near well ER-5-3-2 before drilling the well (fig. 8A). During well development, aquifer testing, and water-level recovery from March to June 2001, most groundwater is conceptualized to be withdrawn from the higher transmissivity, deep carbonate zone with limited amounts of groundwater withdrawn from the lower transmissivity, shallow carbonate zone (fig. 8B). Because of the high transmissivity, water levels recover relatively fast, within days, to the deep carbonate static head of 2,374 ft.
Several months after pumping ceased in well ER-5-3-2, the deep carbonate zone is conceptualized to have hydraulically disconnect from the well (fig. 8C). One possible explanation is that sloughed fill in the open hole contained a permeable pathway during pumping (fig. 8B). After pumping, this pathway was plugged when fill shifted in the borehole or when carbonate precipitate encrusted the bottom of the well screen (fig. 8C).
When groundwater was pumped from well ER-5-3-2 for sampling in 2016, the permeable pathway in the fill was conceptualized to be reestablished, which allowed a hydraulic connection of rocks from the transmissive, deep carbonate zone to the well (fig. 8D). The reestablished hydraulic connection caused water levels in well ER-5-3-2 to recover to the deep carbonate static head of 2,374 ft. Because consistent water-level measurements of 2,374 ft were measured from 2016 to 2021 (fig. 4), the deep carbonate hydraulic connection is conceptualized to have been maintained (fig. 7D).
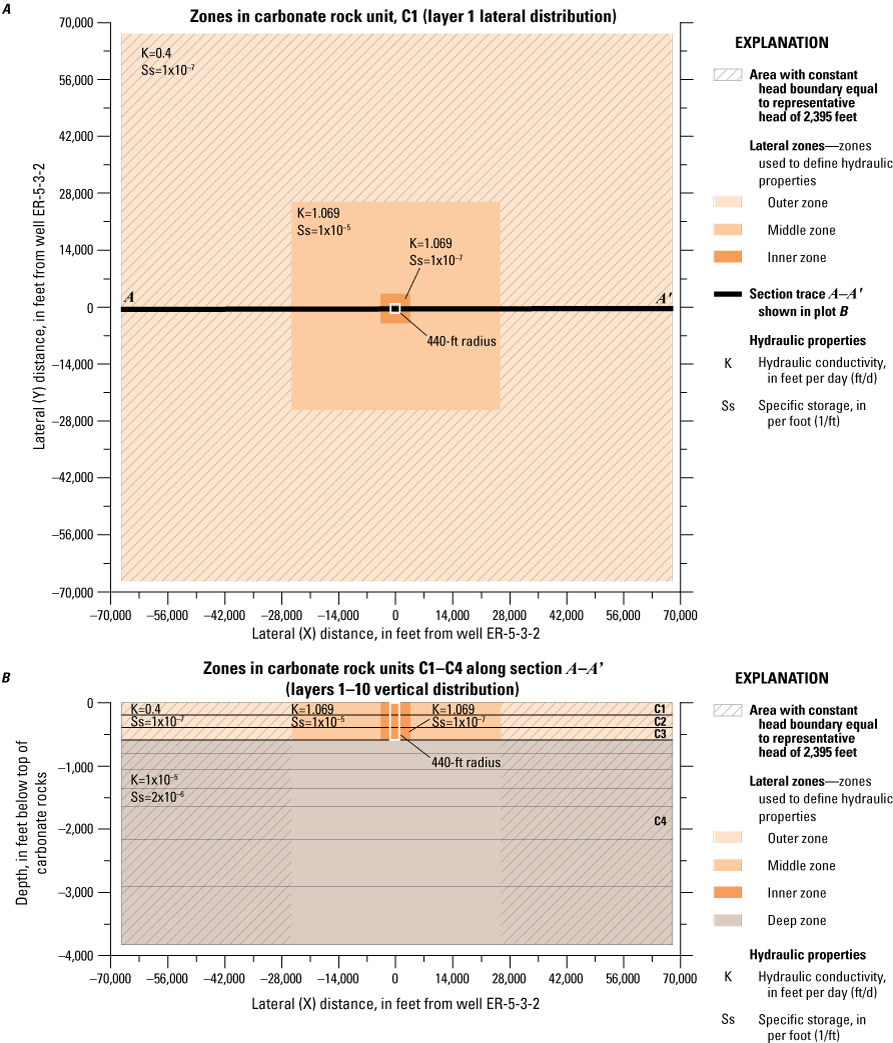
Homogeneous hydraulic-conductivity and specific-storage distributions were estimated with PEST for each carbonate unit, C1–C4 (fig. 9). Initial heads specified in the deep carbonate zone (layers 2–10) equate to the low-static head, whereas initial heads specified in the shallow carbonate zone (layer 1) equate to the high static head (fig. 8A).
Estimated hydraulic properties in A, zones in carbonate rock unit C1 (layer 1 lateral distribution) and B, zones in carbonate rock units C1–C4 along section A–A’ (layers 1–10 vertical distribution) for the shallow-deep carbonate scenario.
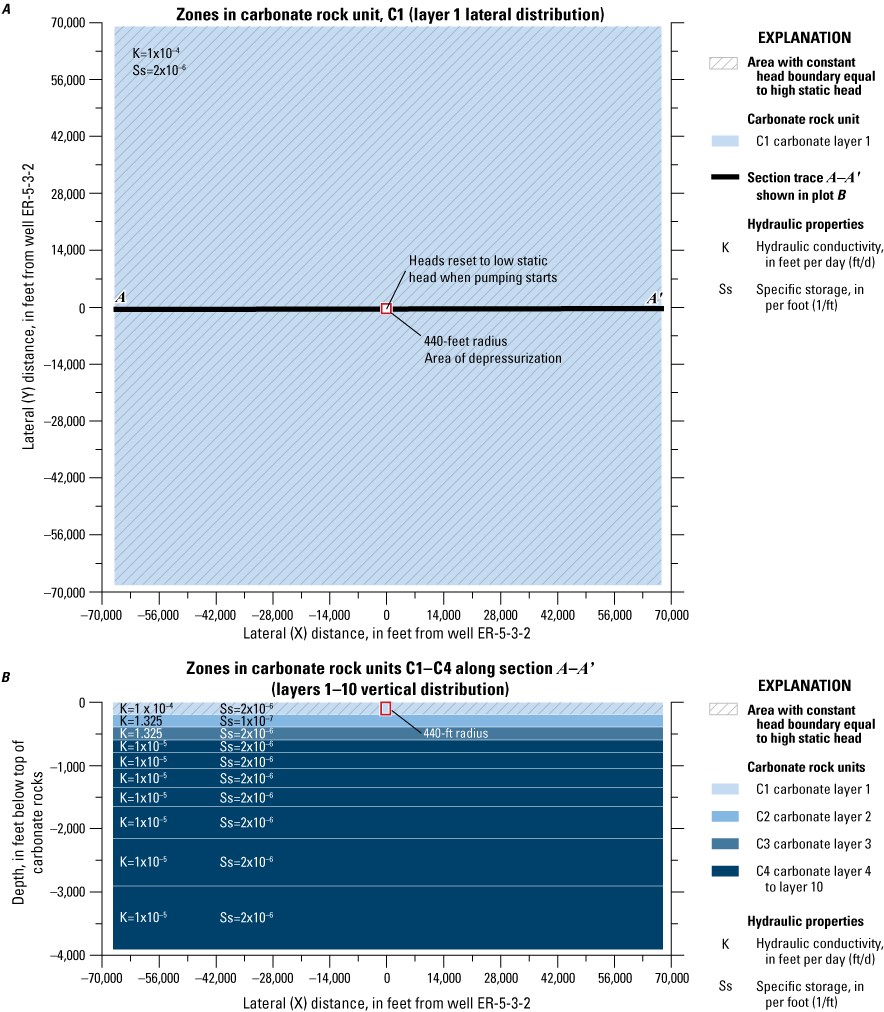
The shallow-deep carbonate scenario is based on the assumption that the low transmissivity, shallow carbonate zone was depressurized during well drilling and development before the constant-rate test. Depressurization was assumed to cause the shallow carbonate high static head (21 ft in this superposition model) to decline and equilibrate to the deep carbonate low static head within a small radial distance from the well. The model scenario begins at the start of the constant-rate test on April 24, 2001. To simulate this depressurization effect, initial heads were assigned the deep carbonate low static head (0 ft) within 440 ft of well ER-5-3-2 and assigned the shallow carbonate high static head outside this radius in the shallow carbonate zone (fig. 9). The 440-ft radius was determined during manual model calibration, as simulated heads were fit to measured heads during the water-level rise from 2001 to 2011.
Depressurization is a localized effect in the shallow carbonate zone (fig. 9A). Outside of the 440-ft radius, heads in the shallow carbonate zone are unaffected by depressurization. Therefore, constant heads equal to the shallow carbonate high head were specified for model cells outside of the 440-ft radius using the constant-head package (Langevin and others, 2017) (fig. 9A). The shallow carbonate high head was specified outside of the 440-ft radius for stress periods spanning from July 18, 2001, to December 31, 2013 (table 1), which occurred during the non-pumping period of water-level rise. The constant-head cells were turned off in stress periods spanning from 2014 to 2016 to simulate the 4-ft water-level decline in well ER-5-3-2. The 4-ft water-level decline is assumed to be from the partial opening of the permeable pathway in the fill, which caused the water level to be partially influenced by the deep carbonate system.
During the first pumping-sampling event in 2016, all heads in the model domain were reset to 0 ft using the MODFLOW 6 time-variant, constant-head package (Langevin and others, 2017). Resetting all heads to 0 ft is a simplistic approach to simulate a reestablished hydraulic connection to the deep carbonate zone.
Equilibration to Lateral Heterogeneities
Equilibration following pumping events in response to lateral heterogeneities in carbonate rocks is referred to as the lateral-heterogeneity scenario. The lateral-heterogeneity scenario is based on the assumption that carbonate rocks surrounding well ER-5-3-2 are divided laterally into three zones: an inner, middle, and outer zone (fig. 10A). These zones have combinations of high (640 ft2/d) or low (240 ft2/d) transmissivity and high (1×10⁻⁵ 1/ft) or low (1×10⁻⁷ 1/ft) specific storage that were estimated with PEST. The inner zone extends radially outward about 4,000 ft from well ER-5-3-2 and has high transmissivity and low storage (figs. 10A, 11). The middle zone extends between 4,000 and 27,000 ft from well ER-5-3-2 and has high transmissivity and high storage (figs. 10A, 11). The outer zone extends from 27,000 ft to the lateral domain boundaries and has low transmissivity and low storage (figs. 10A, 11).
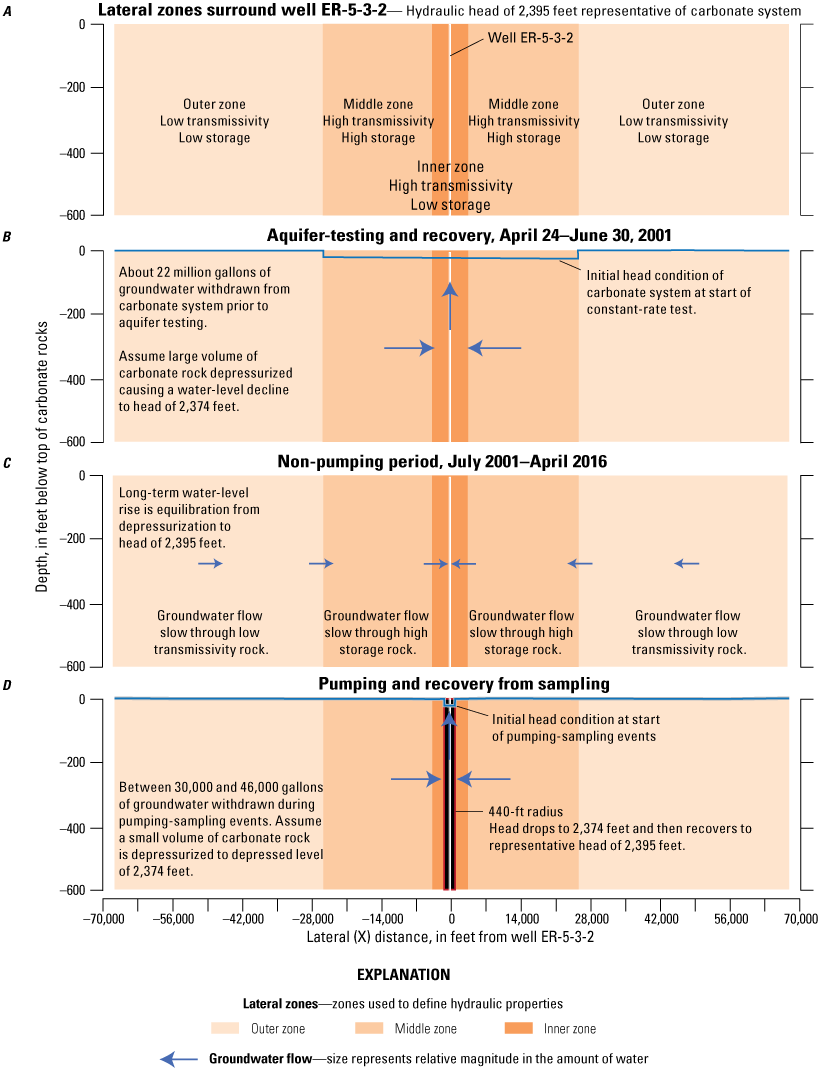
Aquifer conditions in a lateral-heterogeneity scenario during A, predevelopment (before drilling well ER-5-3-2); B, aquifer testing and recovery; C, the non-pumping period; and D, pumping and recovery from sampling in well ER-5-3-2, Frenchman Flat, southern Nevada.
Estimated hydraulic properties in A, zones in carbonate rock unit C1 (layer 1 lateral distribution) and B, zones in carbonate units C1–C10 along section A–A’ (layers 1–10 vertical distribution) for the lateral-heterogeneity scenario.
For the lateral-heterogeneity scenario, the head of 2,395 ft is assumed representative of the carbonate system in Frenchman Flat before drilling the well (fig. 10A). During the drilling of hole ER-5-3-2, about 104 million gallons of groundwater were withdrawn (Bechtel Nevada, 2005b), of which about 20 million gallons were derived from the carbonate system. An additional 1.9 million gallons of groundwater were withdrawn during well development. Removal of a large volume of carbonate groundwater was assumed to depressurize the carbonate system locally around well ER-5-3-2. Depressurization was assumed to cause heads to decline from 2,395 to 2,374 ft within the inner and middle high-transmissivity zones before aquifer testing (fig. 10B). Heads in the low-transmissivity outer zone were assumed unaffected by depressurization from drilling and well-development activities at well ER-5-3-2 (fig. 10B). In this scenario, the high (2,395 ft) and low (2,374 ft) heads are referred to as the representative and depressed heads, respectively.
The model simulating the lateral-heterogeneity scenario begins on April 24, 2001, which is the start of the constant-rate test and is after an estimated 22 million gallons had been withdrawn from the carbonate system. The representative head was specified as the initial head condition in the outer zone, whereas the depressed head was specified as the initial condition in the inner and middle zones. Constant heads equal to the representative head were specified in all model cells within the outer zone (fig. 11A) and included all model cells from layers 1 to 10 (fig. 11). Constant heads equal to the representative head were specified for all stress periods (table 1).
After 1.5 million gallons were withdrawn during the constant-rate test, water levels recovered relatively fast, within days, to the depressed head of 2,374 ft (0 ft datum in model). Depressed heads of 2,374 ft occur in the high-transmissivity inner and middle zones, which are surrounded by a low-transmissivity outer zone (fig. 10A). From 2001 to 2016, water levels in well ER-5-3-2 slowly equilibrated to the head of 2,395 ft as groundwater slowly moved from the low-transmissivity outer zone into the high-storage middle zone and then into the high-transmissivity and low-storage inner zone surrounding the well (fig. 10C).
During each pumping-sampling event from 2016 to 2020, a small volume of carbonate rock was depressurized locally around well ER-5-3-2 (fig. 10D). Pumping-sampling events removed between 30,000 and 46,000 gallons of groundwater from well ER-5-3-2. Removal of these small volumes of groundwater was assumed to depressurize the carbonate unit within 440 ft of well ER-5-3-2 (fig. 11). Therefore, as groundwater was pumped from well ER-5-3-2, water levels within 440 ft of the well were depressurized to a depressed head of 2,374 ft and then simulated water-levels recovered to the head of 2,395 ft after pumping ceased.
Calibration
Hydraulic conductivity, specific storage, and wellbore-leakage rates (when simulated) were estimated for each scenario by minimizing a weighted composite, sum-of-squares objective function. Hydraulic-property distributions were defined with 546 pilot points that were adjusted with PEST (Doherty, 2010a). Wellbore-leakage rates were estimated without the use of pilot points. Instead, leakage rates were estimated with PEST by defining parameters in a MODFLOW 6 well package (Langevin and others, 2017). A total of 27 wellbore-leakage rates were estimated, one each for stress periods 7–33, which span the non-pumping and pumping during sampling periods (table 1). Differences between measured observations and simulated responses formally defined the goodness-of-fit or improvement of calibration.
The objective function was informed by measurement and regularization observations. Data used to inform parameters are measurement observations. Adjustable parameters include hydraulic conductivities, specific storages, and wellbore-leakage rates. Parameters are estimable at pilot points in areas where simulated results are sensitive to parameter changes and data exist to judge goodness-of-fit. However, parameter estimation is not effective at pilot points where no data are available.
Regularization informs the objective function of conceptual models for parameters relatively insensitive to measurement observations. Tikhonov regularization provides information in the form of either preferred values of parameters or preferred relations between parameters (Doherty, 2010a). These preferred values or relations are regularization observations, which are added as prior information to the PEST control file (Doherty, 2010a). During calibration with PEST, measurement and regularization objective functions are minimized simultaneously by allowing measurement observations to inform parameters where data exist and regularization observations (preferred conditions) to inform parameters where measured observations are deficient.
Measurement Observations
Measured water levels served as measurement observations in all four groundwater model scenarios. Measured drawdowns and water-level recovery from the constant-rate test spanned from April 24, 2001, to July 18, 2001. Quarterly water-level measurements in well ER-5-3-2 spanned from September 6, 2001, to November 8, 2021. Measured water levels were converted to water-level change in the superposition groundwater models.
Measured water-level observations were assigned weights equal to 1, with one exception. Initial periods of drawdown and water-level recovery during the constant-rate test were assigned weights equal to 0.01 because a water-temperature increase from 86 to 111 °F in the well substantially affected water levels.
Regularization Observations
Tikhonov regularization informed pilot-point values of hydraulic conductivity and specific storage that were insensitive to measurement observations (Doherty, 2010a). Tikhonov regularization observations were equations that defined a preferred relation between pilot points. Preferred relations between pilot points were specified as ratios of preferred values between pilot points, which guided relative differences rather than absolute values.
Homogeneity was the preferred relation between hydraulic-conductivity and specific-storage pilot points (Doherty, 2010a). Homogeneity is implemented with a preferred ratio of 1 between pilot points within a carbonate unit. By invoking homogeneity, Tikhonov regularization limits differences between pilot points by penalizing sharp differences, thereby ensuring smoothly varying heterogenous distributions (Doherty and Johnston, 2003). Contrasts within carbonate units were penalized minimally in areas where data informed the objective function. A total of 200 regularization observations constrained hydraulic-conductivity estimates with a preferred ratio of 1 between pilot points in each carbonate unit. Likewise, a total of 200 regularization observations constrained specific-storage estimates with a preferred ratio of 1 between pilot points in each carbonate unit.
Tikhonov regularization also informed wellbore-leakage rates. Wellbore-leakage rates are assumed to be relatively similar with time; therefore, homogeneity was the preferred relation. A total of 27 regularization observations constrained wellbore-leakage rates with a preferred ratio of 1.
Regularization observations were weighted so that preferred relations were emphasized where measurement observations were few. Regularization observations were weighted relative to separation distances between pilot points and the nearest measurement sites. Regularization-observation weights between pilot-point pairs were equal to 1 where the distance between the two pilot points was less than the separation between a measured observation location and the nearest pilot point. Weights between pilot-point pairs decreased where the distance between the pilot points was more than the distance between a measured observation location and the nearest of the two pilot points.
Goodness-of-Fit
Goodness-of-fit was limited so that the weighted, sum-of-squares error could not be reduced to less than irreducible measurement and numerical model errors. This expected measurement error is a weighted, sum-of-squares error and is defined by the variable PHIMLIM in a PEST control file (Doherty, 2010a). A PHIMLIM of about 130 square feet (ft2) was specified for the groundwater models, which is equivalent to root-mean-square errors of 0.3 and 1 ft for water-level changes during the constant-rate test and quarterly measurements from 2001 to 2021, respectively. These PHIMLIM and root-mean-square errors approximate the average allowable misfit between simulated and measured water levels.
Simulated and measured drawdowns during the constant-rate aquifer test compared favorably for all four model scenarios (fig. 12). Well-loss effects in well ER-5-3-2 were simulated to fit abrupt water-level declines of 65–75 ft at the start of pumping. Root-mean-square errors ranged from 0.4 to 0.7 ft, which is small relative to drawdowns of 15–20 ft in the carbonate rock. Poorer fits occur immediately after pumping starts and stops because temperature effects strongly affected water levels (fig. 3B). However, pumping was of sufficient duration for temperature effects to dissipate, such that hydraulic properties could be estimated from late-time drawdown data (fig. 12). Hydraulic properties were constrained by comparison to the aquifer-test transmissivity. Simulated transmissivities ranged from 530 to 640 ft2/d, which are within a factor of 1.2 of the best transmissivity estimate (530 ft2/d; Jackson and Frus, 2023, appendix C). Comparison of simulated and measured water levels post-aquifer testing, from 2001 to 2021, are discussed in the section “Evaluation of Potential Stresses and Hydrologic Conditions Affecting ER-5-3-2 Hydrograph.”
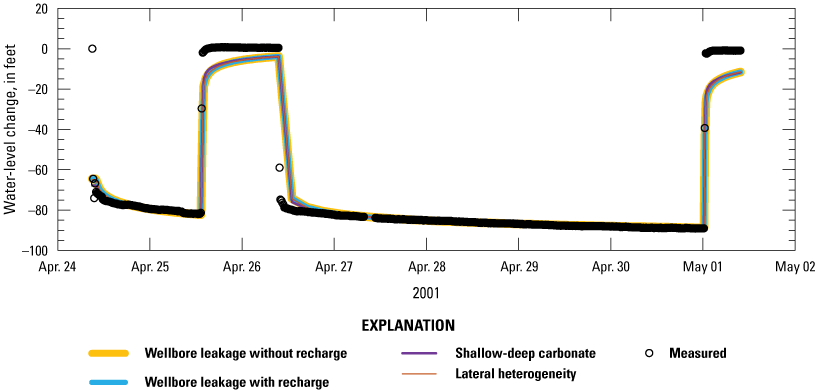
Comparison of simulated and measured water levels in well ER-5-3-2 from the constant-rate test, April 24–May 2, 2001, for all four model scenarios including wellbore leakage without recharge, wellbore leakage with recharge, equilibration to vertical heterogeneities between shallow and deep carbonate zones, and equilibration to lateral heterogeneities in carbonate rocks. Data for measured water levels can be found at IT Corporation (2001) and simulated water levels at Jackson and Frus (2023).
Regional Analysis of Hydraulic Heads
The four model scenarios presented in this report assume a predevelopment, steady-state, hydraulic head in the carbonate system of either 2,395 or 2,374 ft. Two potentiometric maps in the carbonate system were constructed, assuming that either the 2,395-ft or the 2,374-ft head is representative of the predevelopment carbonate head at the ER-5-3-2 well site (figs. 13, 14). Both maps were evaluated relative to the plausibility of these two potential hydraulic heads. Results indicate that the high head of 2,395 ft and low head of 2,374 ft could be representative of the carbonate system, as discussed below.
Hydrologic characteristics of the carbonate system based on a high hydraulic head of 2,395 feet at well ER-5-3-2, Frenchman Flat and surrounding area, southern Nevada. Dashed potentiometric contour of 2,375 ft represents a hydraulic trough, an area of higher transmissivity and lower hydraulic head.
Hydrologic characteristics of the carbonate system based on a low hydraulic head of 2,374 feet at well ER-5-3-2, Frenchman Flat and surrounding area, southern Nevada.
The high head of 2,395 ft in well ER-5-3-2 is consistent with regional carbonate water levels and the transmissivity map from a regional numerical model (fig. 13; Halford and Jackson, 2020). Potentiometric contouring with this high head at well ER-5-3-2 indicates that groundwater diverges around the low-transmissivity area of Frenchman Flat (fig. 13). Regional groundwater in the carbonate system moves in a southwest direction toward the Ash Meadows groundwater basin boundary, which terminates at the Ash Meadows discharge area. This result is consistent with regional studies (Winograd and Thordarson, 1975; Fenelon and others, 2010; Halford and Jackson, 2020). The simulated transmissivity map shown on figure 13 was developed using the high head of 2,395 ft (Halford and Jackson, 2020).
Potentiometric contouring using the 2,374-ft hydraulic head at well ER-5-3-2 requires this well to be within a hydraulic trough. A hydraulic trough occurs because the 2,374 ft head at well ER-5-3-2 is lower, compared to hydraulic heads in all directions, for example heads in wells ER-6-1-2 main, WW-C, TW-F, TW-3, and SM-23-1 (fig. 14). The 2,375-ft potentiometric contour, shown as a dashed line on figure 14, indicates groundwater convergence along a hydraulic trough along the west side of Frenchman Flat. Areas where groundwater-flow paths converge should coincide with areas of high simulated transmissivity (Fetter, 2001). The 2,375-ft potentiometric contour encapsulates areas of high simulated transmissivity, except near well ER-5-3-2, because of the relatively low estimated transmissivity of 530 ft2/d at well ER-5-3-2. The 2,374-ft head at well ER-5-3-2 could be caused by a high-transmissivity zone that is closer to the well than depicted on figure 14. A high-transmissivity zone near well ER-5-3-2 would allow groundwater to easily drain to the low (2,374-ft) head, which would allow this well to be part of the hydraulic trough.
The low head of 2,374-ft at well ER-5-3-2 is a plausible predevelopment carbonate head, based on time-series of water-level data at the well. Water levels have recovered to the 2,374-ft head from the following events: (1) after well recompletion; (2) after well development, step-drawdown testing, and the constant-rate test; and (3) after each pumping-sampling event from 2016 to 2020. Furthermore, the water level has remained at the low 2,374-ft head since pumping-sampling events from 2020 to 2021 (fig. 4). The tendency of water levels to recover to the 2,374-ft head indicates that this head cannot be ruled out as a plausible predevelopment carbonate head.
Recharge
The 21-ft water-level rise in well ER-5-3-2 from 2001 to 2011 and the 4-ft decline from 2012 to 2016 are not attributed entirely to recharge. The maximum magnitude of water-level rise from recharge was expected to be less than 3 ft from 2001 to 2011, and the maximum magnitude of decline was expected to be less than 1 ft from 2012 to 2021. The upper limits on the rise and decline are based on a review of carbonate-well hydrographs affected only by recharge (fig. 7A). Carbonate wells DDL-2 and UE-25p 1 are near the Desert Range and Yucca Mountain, respectively, which are recharge areas (fig. 1; Fenelon and others, 2010). Carbonate wells ER-6-1-2 main, ER-3-1-2 (shallow), SM-23-1, and Tracer Well 3 are on valley floors that are distant from highland recharge areas (fig. 1). Effects from distant recharge have caused maximum water-level rises of 0.5–2 ft in the valley-floor wells since 2001 (fig. 7A). Because the valley-floor wells have a similar hydrologic setting to Frenchman Flat, changes in recharge also could contribute to the water-level rise and decline in well ER-5-3-2. However, recharge cannot explain most of the water-level trend in well ER-5-3-2.
Wellbore Leakage with and without Recharge
Simulated and measured water levels compare favorably for model scenarios simulating wellbore leakage without recharge (fig. 15A) and wellbore leakage with recharge (fig. 15B). If the 21-ft water-level rise and subsequent 4-ft decline from 2001 to 2016 is attributed entirely to wellbore leakage, then about 184 million gallons of water would have leaked from the overlying alluvial-volcanic system to the underlying carbonate system. If recharge partly explains the water-level rise, then wellbore leakage would have totaled about 178 million gallons from 2001 to 2016. The wellbore-leakage volumes are based on the assumption that the water-level rise is sustained from leakage rates required to cause localized mounding in the carbonate system near well ER-5-3-2, where the carbonate transmissivity is 530 ft2/d. Wellbore-leakage scenarios also require a predevelopment head of 2,374 ft in the carbonate system at well ER-5-3-2 (fig. 14).
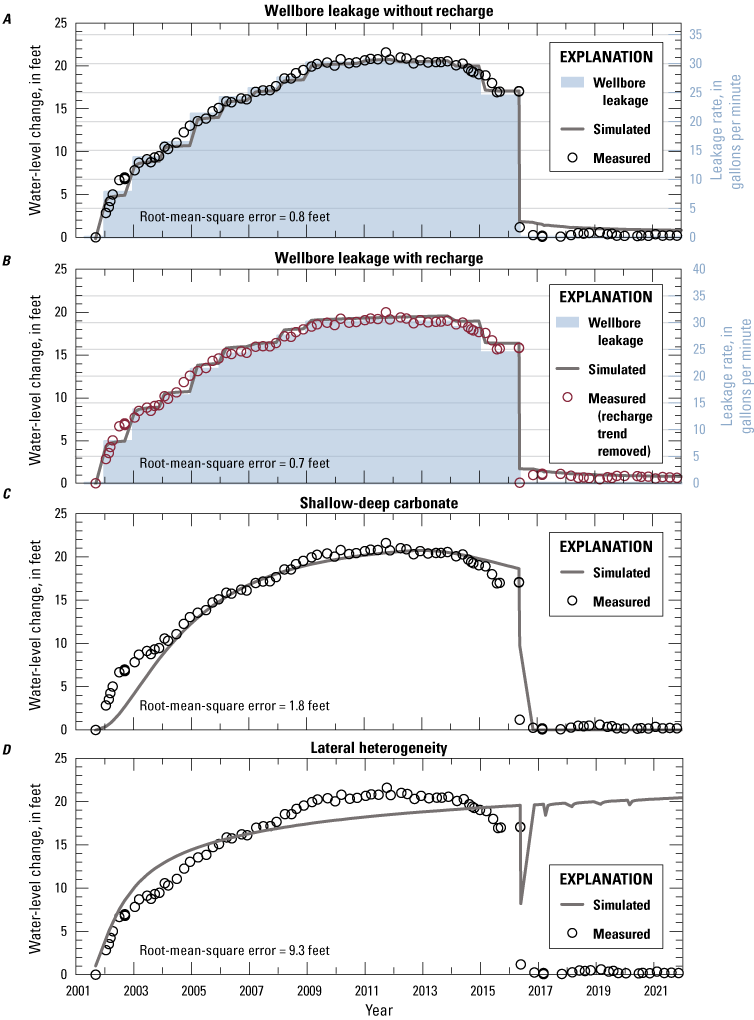
Comparison of simulated and measured water levels in well ER-5-3-2 from September 2001 to December 2021 for model scenarios A, wellbore leakage without recharge, B, wellbore leakage with recharge, C, shallow-deep carbonate, and D, lateral heterogeneity, Frenchman Flat, southern Nevada.
Despite a good fit between simulated and measured water levels, attributing the water-level trend to wellbore leakage (with or without recharge) is not a satisfactory argument. If the wellbore is leaky, then a near constant-leakage rate would be expected to have occurred throughout the entire water-level record from 2001 to 2021. Instead, variable wellbore-leakage rates are necessary to fit the water-level trend from 2001 to 2016 (figs. 15A–B). During this time, an estimated 178–184 million gallons, or an average of 33,000 gallons per day (gal/d), of water would have had to leak into the carbonate system. This sustained period of high leakage would have been followed by no leakage after 2016 to match the stable low-water levels measured in well ER-5-3-2 from 2016 to 2021 (figs. 15A–B). Continued wellbore leakage after 2016 would have been expected and would have caused water levels to rise between pumping-sampling events.
A statistical analysis of major and trace constituents also indicates that the rising water-level trend in well ER-5-3-2 cannot be explained by wellbore leakage. The Wilcoxon matched pairs test (Helsel and others, 2020) was used to determine if there was a statistically significant difference in the compositions of 20 major ions and trace elements in well ER-5-3-2 between the 2001 and 2016 or 2017 sampling events. A calculated Wilcoxon test statistic is not statistically significant when it is greater than the critical value at a threshold (α) of 0.05. Between the 2001 and 2016/2017 sampling events, the Wilcoxon test statistics were 54 (2001–16) and 93 (2001–17), which were larger than the critical values of 40 (2001–16) and 52 (2001–17). The Wilcoxon test statistics indicate that the water-chemistry suite from the 2001 sampling event is not significantly different from either the 2016 or 2017 sampling event (Helsel and others, 2020).
Piper and stiff diagrams (Helsel and others, 2020) provide additional evidence that wellbore leakage is implausible. The piper diagram indicates that well ER-5-3-2 is open to sodium-calcium-magnesium-bicarbonate type groundwater that has been stable with time (fig. 16). This water-chemistry type is typical of carbonate groundwater (Hershey and others, 2005). If 178–184 million gallons of water leaked into the carbonate system from 2001 to 2016, the 2016 sample event data should be dominated by a volcanic water-chemistry signature because only between 31,000 and 40,000 gallons of groundwater were purged during 2016 and 2017 sampling events (table 1). Alternatively, the piper diagram should show a time evolution in the groundwater composition of well ER-5-3-2 toward either an alluvial (well ER-5-3 shallow) or volcanic (well UE-5 PW-3) endmember. Instead, the piper diagram shows that the three samples from well ER-5-3-2 (carbonate) are clearly distinct from sodium-bicarbonate type groundwaters in the alluvial-volcanic system (fig. 16). The stiff diagrams of 2001, 2016, and 2017 samples from well ER-5-3-2 also are consistent (fig. 16) and there is no indication that volcanic water has mixed with the carbonate water. Therefore, well ER-5-3-2 water-quality samples are representative of the carbonate system.
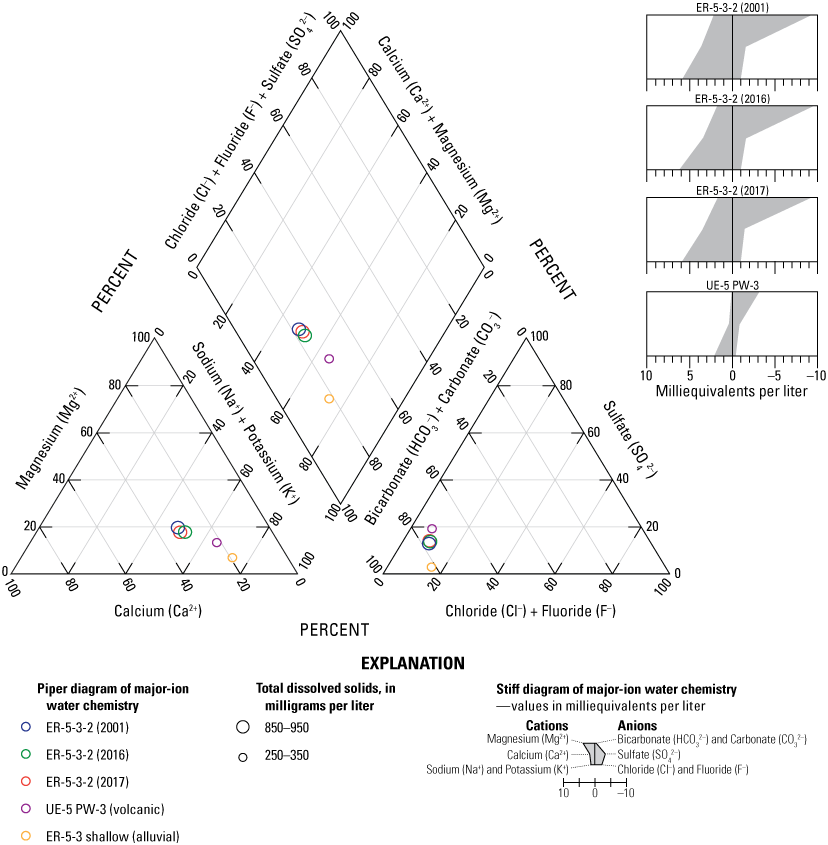
Major-ion chemistry at wells ER-5-3-2, UE-5 PW-3, and ER-5-3 shallow, Frenchman Flat, southern Nevada. Data are available in Jackson and Frus (2023), appendix D.
An alternative conceptualization of wellbore leakage is to assume that the 21-ft water-level rise from 2001 to 2011 is sustained by the hydraulic disconnection of the well from the carbonate system. In this case, several months after the constant-rate test in well ER-5-3-2, carbonate rocks are hydraulically disconnected from the well by either (1) the shifting of sloughed fill in the open hole or (2) the encrusting of carbonate precipitate in the well screen. The hydraulic disconnection effectively seals the well and the 21 ft of water-level rise from 2001 to 2011 is the buildup of head from wellbore leakage. Total wellbore leakage from 2001 to 2011 is about 50 gallons, which was computed based on the construction of well ER-5-3-2 (fig. 2). The 4-ft water-level decline from 2012 to 2016 is conceptualized to occur from the slow reconnection of the well to the carbonate system. This alternative wellbore-leakage scenario is consistent with water-chemistry analyses because the computed wellbore leakage (50 gallons) is small relative to purged volumes (30,000–40,000 gallons) for sampling, and the water chemistry would not be expected to change.
Equilibration to Shallow and Deep Carbonate Zones
Simulated and measured water levels compare favorably in the shallow-deep carbonate scenario (fig. 15C). This scenario is based on the assumption that well-construction effects and vertical heterogeneity of the carbonate system explain the ER-5-3-2 water-level trend (fig. 8). Well-construction effects are attributed to a temporary clogging of the open interval below the well screen that is opened during pumping events, which affects the hydraulic connection of deep transmissive carbonate rocks to the wellbore. Vertical heterogeneity is attributed to the compartmentalization of the carbonate system into a low-transmissivity shallow part and high-transmissivity deep part. The 21-ft water-level rise from 2001 to 2011 is a natural equilibration to shallow, low-transmissivity carbonate rocks during a period when the lower open interval is clogged. The 4-ft decline from 2012 to 2016 represents equilibration between the shallow and deep intervals, because of a partial unclogging of the connection between the two intervals. The low water levels from 2016 to 2021 result from pumping for sampling and an unclogging of the open interval so that the low head in the deep carbonate dominates the water level. The shallow-deep carbonate scenario is based on the assumption that the low head of 2,374 ft is representative of the transmissive part of the carbonate system at well ER-5-3-2. The shallow-deep carbonate scenario provides a possible explanation for the well ER-5-3-2 hydrograph.
Equilibration to Lateral Heterogeneities
The lateral-heterogeneity scenario (fig. 10) is based on the assumption that the 2,395-ft head is representative of the carbonate system at well ER-5-3-2 (fig. 13). However, simulated water levels cannot fully explain the well ER-5-3-2 hydrograph in the lateral-heterogeneity scenario (fig. 15D). An additional assumption for the lateral-heterogeneity scenario is that well ER-5-3-2 is surrounded in the near field by high transmissivity and low-storage carbonate rocks that were depressurized by the removal of 22 million gallons of water during drilling and well development (fig. 10). The outer part of the depressurized zone has high storage and these high storage rocks are surrounded by low-transmissivity rocks. As conceptualized, the 21-ft water-level rise from 2001 to 2011 is a natural reequilibration following the depressurization of a large volume of carbonate rock from groundwater withdrawals. The depressurization cannot account for the 4-ft decline between 2012 and 2016. More problematic, the removal of between 30,000 and 46,000 gallons of water during annual pumping-sampling events can only depressurize a small volume of carbonate rock after each event. Simulated drawdowns and recoveries from the small pumping amounts are insufficient to match measured water levels in the well from 2016 to 2021. Simulated drawdowns were less than measured and simulated water-level recoveries were too fast (less than 1 year) relative to measured recoveries (fig. 15D). Therefore, this scenario cannot explain the well ER-5-3-2 hydrograph from 2001 to 2021.
Nuclear Testing
Effects of nuclear testing on water levels in well ER-5-3-2 were considered and deemed nonexistent. Water levels near a nuclear test potentially can be affected by pressurization and depressurization of pore water and by heating and cooling of groundwater. Large (more than 100 ft) changes in water levels from pressurization and depressurization of tuff confining units have been noted in wells on the NNSS, primarily in Yucca Flat but not in Frenchman Flat (Fenelon, 2005; Elliott and Fenelon, 2018). These multi-year, water-level effects from nuclear tests have been observed only in wells with low hydraulic conductivities (less than 0.003 ft/d; Halford and others, 2005). Water-level measurements made in wells open to permeable alluvium, volcanic rocks, or carbonate rocks show no persistent, large-magnitude responses in water levels (Fenelon, 2005). For reference, the hydraulic conductivity of the carbonate rocks at well ER-5-3-2 estimated using PEST are about 0.5 ft/d. Observable high-temperature effects from nuclear tests have been observed only in nuclear-test cavities.
Seven nuclear tests were detonated from 785 to 970 ft above the water table within 1 mile of well ER-5-3-2 (U.S. Department of Energy, 2015a; Elliott and Fenelon, 2018). All seven tests were detonated in alluvium or volcanic rocks, 3,000–4,000 ft above the carbonate system (Stoller-Navarro Joint Venture, 2005). The shallow tests in relatively permeable rocks and the isolation of the carbonate system by a thick sequence of TCU excludes nuclear testing as a viable cause of the water-level fluctuations in well ER-5-3-2. Furthermore, the water-level trend in well ER-5-3-2 does not exhibit the typical behavior expected when water levels are affected by nuclear testing (Jackson and Fenelon, 2018).
Temperature effects on water levels in well ER-5-3-2 from nuclear testing or other causes were considered and discounted. If the 21-ft water-level rise from 2001 to 2011 was attributed to temperature, then the borehole water temperature would have increased about 44 °F during this period (Jackson and Frus, 2023, appendix E). However, annual temperature measurements at the water table in well ER-5-3-2 were stable at 76 °F from 2002 to 2006 (Reiner, 2007). During this period, water levels rose about 16 ft in the well.
Summary
Well ER-5-3-2 is part of a well network designed to monitor long-term water levels and radionuclide concentrations downgradient from underground nuclear tests that occurred in Frenchman Flat, an area of the U.S. Department of Energy Nevada National Security Site in southern Nevada. Interpretation of monitoring records for well ER-5-3-2 is confounded by previously unexplained water-level fluctuations in the well hydrograph. This study integrated geologic, hydrologic, and water-chemistry data; and hypothetical and numerical models to evaluate potential stresses or hydrologic conditions causing the water-level trend in well ER-5-3-2.
A regional analysis was done to determine a representative hydraulic head for the carbonate system at the ER-5-3-2 well site. The regional analysis evaluated groundwater conditions caused by high (2,395 feet, ft) and low (2,374 ft) heads in well ER-5-3-2, both of which are plausible predevelopment hydraulic heads in the carbonate system. The high 2,395-ft head is consistent with regional heads, based on potentiometric contouring. The low 2,374-ft head is better supported by water-level data for well ER-5-3-2 and based on potentiometric contouring, is reasonable if a hydraulic trough exists near well ER-5-3-2. A hydraulic trough near well ER-5-3-2 would allow groundwater in the low-transmissivity area surrounding the well to drain into a nearby high-transmissivity zone. Water levels have recovered to the 2,374-ft head from the following events: (1) after well recompletion; (2) after well development, step-drawdown testing, and the constant-rate test; and (3) after each pumping-sampling event from 2016 to 2020. Furthermore, the water level has remained at the low 2,374-ft head since pumping-sampling events from 2020 to 2021. The tendency of water levels to recover to the 2,374-ft head indicates that this head cannot be ruled out as a plausible predevelopment carbonate head.
Four model scenarios were developed using three-dimensional, MODFLOW 6 groundwater models. Each scenario simulated the well ER-5-3-2 constant-rate test and pumping during annual sampling events from 2016 to 2020. The model scenarios are (1) wellbore leakage without recharge, (2) wellbore leakage with recharge, (3) equilibration to vertical heterogeneities between shallow and deep carbonate zones, and (4) equilibration to lateral heterogeneities in carbonate rocks. For each model scenario, hydraulic properties were estimated by matching simulated and measured water-level drawdowns during the constant-rate test and water-level changes in the well ER-5-3-2 hydrograph from 2001 to 2021. Model scenarios were evaluated based on residual differences between simulated and measured water levels, as well as evaluated for wellbore-leakage scenarios by comparing water-chemistry results.
Simulated and measured water levels compare favorably for model scenarios simulating wellbore leakage without and with recharge. Wellbore-leakage scenarios are based on the assumption that the water-level rise is sustained from leakage rates required to cause a localized mounding in the carbonate system near well ER-5-3-2, where the carbonate transmissivity is 530 square feet per day (ft2/d). However, results of the wellbore-leakage scenario are not supported by water-chemistry analyses for well ER-5-3-2. To be a plausible explanation of the water-level trend, wellbore leakage (with and without recharge) scenarios require large volumes (178–184 million gallons) of volcanic water to leak into the carbonate system. The carbonate water-chemistry signature for well ER-5-3-2, however, remained stable before and after the hypothesized leakage even though the volume of water-chemistry samples obtained were relatively small (30,000–40,000 gallons). Recharge also cannot explain most of the 21-ft water-level rise in well ER-5-3-2 from 2001 to 2011 or the 4-ft decline from 2012 to 2016, because the water-level rise and decline from recharge for these periods was expected to be less than 3 ft and 1 ft, respectively.
An alternative conceptualization of wellbore leakage is to assume that the 21-ft water-level rise from 2001 to 2011 is sustained by the hydraulic disconnection of the well from the carbonate system. In this case, several months after the constant-rate test in well ER-5-3-2, carbonate rocks are hydraulically disconnected from the well by either (1) the shifting of sloughed fill in the open hole or (2) the encrusting of carbonate precipitate in the well screen. The hydraulic disconnection effectively seals the well and the 21 ft of water-level rise from 2001 to 2011 is the buildup of head in the casing from wellbore leakage. In this case, total wellbore leakage from 2001 to 2011 is about 50 gallons, which was computed based on the construction of well ER-5-3-2. The 4-ft water-level decline from 2012 to 2016 is conceptualized to occur from the slow reconnection of the well to the carbonate system. This alternative wellbore-leakage scenario is consistent with water-chemistry analyses because the computed wellbore leakage (50 gallons) is small relative to purged volumes (30,000–40,000 gallons) for sampling, and the water chemistry would not be expected to change.
The shallow-deep carbonate scenario provides another explanation for the well ER-5-3-2 hydrograph. This scenario is based on the assumption that well-construction effects and vertical heterogeneity of the carbonate system explain the ER-5-3-2 water-level trend. Well-construction effects are attributed to a temporary clogging of the open interval below the well screen that is opened during pumping events, which affects the hydraulic connection of deep transmissive carbonate rocks to the wellbore. Vertical heterogeneity is attributed to the compartmentalization of the carbonate system into a low-transmissivity shallow part and high-transmissivity deep part. The 21-ft water-level rise from 2001 to 2011 was a natural equilibration to shallow, low-transmissivity carbonate rocks during a period when the lower open interval was clogged. The 4-ft decline from 2012 to 2016 represents equilibration between the shallow and deep intervals, because of a partial unclogging of the connection between the two intervals. The low (2,374-ft altitude) water levels from 2016 to 2021 resulted from pumping for sampling and an unclogging of the open interval so that the low head in the deep carbonate dominated the water level. Despite potential well-construction effects, samples collected from well ER-5-3-2 are representative of the carbonate system.
The lateral-heterogeneity scenario is based on the assumption that the 21-ft water-level rise from 2001 to 2011 is a natural water-level reequilibration following the pumping-induced depressurization of a large volume of high transmissivity and low-storage carbonate rock that is surrounded by low transmissivity and high-storage carbonate rock. The lateral-heterogeneity scenario was considered and discounted because simulated water levels cannot match the well ER-5-3-2 hydrograph.
Other factors considered were long-term water-level equilibration, nuclear testing, and temperature effects. Long-term water-level equilibration in response to pumping from low-transmissivity rocks cannot explain the rising trend from 2001 to 2011 or the relatively stable water levels from 2016 to 2021, because the transmissivity at well ER-5-3-2 is too high. Well ER-5-3-2 is open to carbonate rocks with an aquifer-test estimated transmissivity of 530 ft2/d, which allows water levels to recover within days following pumping events. Nuclear testing effects were deemed nonexistent because (1) nuclear tests occurred in relatively permeable alluvial-volcanics, (2) the carbonate system is isolated from overlying alluvial-volcanics by a thick sequence of tuff confining unit, and (3) the water-level trend in well ER-5-3-2 does not exhibit the typical behavior expected when water levels are affected by nuclear testing. Temperature effects on water levels in well ER-5-3-2 from nuclear testing or other causes were discounted because annual temperature measurements at the water table in well ER-5-3-2 were stable at 76 degrees Fahrenheit (°F) from 2002 to 2006, whereas water levels rose about 16 ft in the well during this period.
References Cited
Belcher, W.R., Sweetkind, D.S., and Elliott, P.E., 2002, Probability distributions of hydraulic conductivity for the hydrogeologic units of the Death Valley regional ground-water flow system, Nevada and California: U.S. Geological Survey Water-Resources Investigations Report 02–4212, 24 p. [Available at https://doi.org/10.3133/wri024212.]
Campbell Scientific, Incorporated, 1994, Barometric pressure sensors—Vaisala’s PTA-427 and PTA-427A: Campbell Scientific, Incorporated, 1 p., accessed December 2, 2021, at https://s.campbellsci.com/documents/us/product-brochures/b_pta427-pta427a.pdf.
Chapman, J.B., and Lyles, B.F., 1993, Groundwater chemistry at the Nevada Test Site—Data and preliminary interpretations: Desert Research Institute Publication Number 45100, 56 p. [Available at https://doi.org/10.2172/138650.]
Cooper, H.H., Jr., and Jacob, C.E., 1946, A generalized graphical method for evaluating formation constants and summarizing well field history: Eos, Transactions American Geophysical Union, v. 27, no. 4, p. 526–534. [Available at https://doi.org/10.1029/TR027i004p00526.]
Design Analysis Associates, 2021, WaterLog model H-310 submersible pressure transducer: Design Analysis Associates, 2 p., accessed December 2, 2021, at http://instrumentalia.com.ar/wp-content/uploads/wpallimport/pdf/sensor-sumergible-H-310-waterlog-instrumentalia.pdf.
Doherty, J., and Johnston, J.M., 2003, Methodologies for calibration and predictive analysis of a watershed model: Journal of the American Water Resources Association, v. 39, no. 2, p. 251–265. [Available at https://doi.org/10.1111/j.1752-1688.2003.tb04381.x.]
Elliott, P.E., and Fenelon, J.M., 2018, Database of groundwater levels and hydrograph descriptions for the Nevada Test Site area, Nye County, Nevada (ver. 4.0, February 2021): U.S. Geological Survey data release, available at https://doi.org/10.5066/F75H7FGN.
Fenelon, J.M., 2005, Analysis of ground-water levels and associated trends in Yucca Flat, Nevada Test Site, Nye County, Nevada, 1951–2003: U.S. Geological Survey Scientific Investigations Report 2005–5175, 87 p. [Available at https://doi.org/10.3133/sir20055175.]
Fenelon, J.M., Sweetkind, D.S., and Laczniak, R.J., 2010, Groundwater flow systems at the Nevada Test Site, Nevada—A synthesis of potentiometric contours, hydrostratigraphy, and geologic structures: U.S. Geological Survey Professional Paper 1771, 54 p., 6 pls. [Available at https://doi.org/10.3133/pp1771.]
Fenelon, J.M., Sweetkind, D.S., Elliott, P.E., and Laczniak, R.J., 2012, Conceptualization of the predevelopment groundwater flow system and transient water-level responses in Yucca Flat, Nevada National Security Site, Nevada: U.S. Geological Survey Scientific Investigations Report 2012–5196, 61 p. [Available at https://doi.org/10.3133/sir20125196.]
Fenelon, J.M., Halford, K.J., and Moreo, M.T., 2016, Delineation of the Pahute Mesa–Oasis Valley groundwater basin, Nevada, ver. 1.1, May 2016: U.S. Geological Survey Scientific Investigations Report 2015–5175, 40 p. [Available at https://doi.org/10.3133/sir20155175.]
Fulford, J.M., and Clayton, C.S., 2015, Accuracy testing of steel and electric groundwater-level measuring tapes—Test method and in-service tape accuracy: U.S. Geological Survey Open-File Report 2015–1137, 31 p. [Available at https://doi.org/10.3133/ofr20151137.]
Halford, K.J., and Jackson, T.R., 2020, Groundwater characterization and effects of pumping in the Death Valley regional groundwater flow system, Nevada and California, with special reference to Devils Hole: U.S. Geological Survey Professional Paper 1863, 178 p. [Available at https://doi.org/10.3133/pp1863.]
Halford, K.J., Laczniak, R.J., and Galloway, D.L., 2005, Hydraulic characterization of overpressured tuffs in central Yucca Flat, Nevada Test Site, Nye County, Nevada: U.S. Geological Survey Scientific Investigations Report 2005–5211, 36 p. [Available at https://doi.org/10.2172/859902.]
Harrill, J.R., and Prudic, D.E., 1998, Aquifer systems in the Great Basin region of Nevada, Utah, and adjacent States—Summary report: U.S. Geological Survey Professional Paper 1409–A, 66 p. [Available at https://doi.org/10.3133/pp1409A.]
Helsel, D.R., Hirsch, R.M., Ryberg, K.R., Archfield, S.A., and Gilroy, E.J., 2020, Statistical methods in water resources: U.S. Geological Survey Techniques and Methods, book 4, chapter A3, 458 p. [Available at https://doi.org/10.3133/tm4A3.]
Hershey, R.L., Thomas, J.M., Rose, T.P., Paces, J.B., Farnham, I.M., and Benedict, F.C., Jr., 2005, Evaluation of groundwater movement in the Frenchman Flat CAU using geochemical and isotopic analysis: U.S. Department of Energy Report DOE/NV/13609-36, 75 p. [Available at https://doi.org/10.2172/839138.]
Jackson, T.R., and Fenelon, J.M., 2018, Conceptual framework and trend analysis of water-level responses to hydrologic stresses, Pahute Mesa–Oasis Valley groundwater basin, Nevada, 1966–2016: U.S. Geological Survey Scientific Investigation Report 2018–5064, 89 p. [Available at https://doi.org/10.3133/sir20185064.]
Jackson, T.R., and Frus, R.J., 2023, MODFLOW 6 models used to evaluate potential stresses and hydrologic conditions driving water-level fluctuations in well ER-5-3-2, Frenchman Flat, Southern Nevada: U.S. Geological Survey data release, available at https://doi.org/10.5066/P95C0NG5.
Jackson, T.R., and Halford, K.J., 2020, MODFLOW-2005 model and supplementary data used to characterize groundwater flow and effects of pumping in the Death Valley regional groundwater flow system, Nevada and California, with special reference to Devils Hole: U.S. Geological Survey data release, available at https://doi.org/10.5066/P9HIYVG2.
Laczniak, R.J., Cole, J.C., Sawyer, D.A., and Trudeau, D.A., 1996, Summary of hydrogeologic controls on ground-water flow at the Nevada Test Site, Nye County, Nevada: U.S. Geological Survey Water-Resources Investigations Report 96–4109, 59 p. [Available at https://doi.org/10.2172/257364.]
Langevin, C.D., Hughes, J.D., Banta, E.R., Niswonger, R.G., Panday, S., and Provost, A.M., 2017, Documentation for the MODFLOW 6 groundwater flow model: U.S. Geological Survey Techniques and Methods, book 6, chap. A55, 197 p. [Available at https://doi.org/10.3133/tm6A55.]
Mueller, D.K., Schertz, T.L., Martin, J.D., and Sandstrom, M.W., 2015, Design, analysis, and interpretation of field quality-control data for water-sampling projects: U.S. Geological Survey Techniques and Methods, book 4, chapter C4, 54 p. [Available at https://doi.org/10.3133/tm4C4.]
RamaRao, B.S., LaVenue, A.M., De Marsily, G., and Marietta, M.G., 1995, Pilot point methodology for automated calibration of an ensemble of conditionally simulated transmissivity fields—1. Theory and computational experiments: Water Resources Research, v. 31, no. 3, p. 475–493. [Available at https://doi.org/10.1029/94WR02258.]
Reiner, S.R., 2007, Ground-water temperature data, Nevada Test Site and vicinity, Nye, Clark, and Lincoln Counties, Nevada, 2000–2006: U.S. Geological Survey Data Series 269, 20 p. [Available at https://doi.org/10.3133/ds269.]
Schneider Electric, 2020, Intelligent vortex flowmeters model 84C product specification sheet: Schneider Electric, 64 p., accessed December 2, 2021, at https://www.hitma-instrumentatie.nl/Plugins/Intakt.FileExpansion/Uploads/Datasheet%20Schneider%20Electric%2084C_20305413.pdf.
Slate, J.L., Berry, M.E., Rowley, P.D., Fridrich, C.J., Morgan, K.S., Workman, J.B., Young, O.D., Dixon, G.L., Williams, V.S., McKee, E.H., Ponce, D.A., Hildenbrand, T.G., Swadley, W.C., Lundstrom, S.C., Ekren, E.B., Warren, R.G., Cole, J.C., Fleck, R.J., Lanphere, M.A., Sawyer, D.A., Minor, S.A., Grunwald, D.J., Laczniak, R.J., Menges, C.M., Yount, J.C., and Jayko, A.S., 1999, Digital geologic map of the Nevada Test Site and vicinity, Nye, Lincoln, and Clark Counties, Nevada, and Inyo County, California: U.S. Geological Survey Open-File Report 99-554-A, 54 p., 2 pl., scale 1:120,000, accessed June 2011, at https://doi.org/10.3133/ofr99554A.
Sweetkind, D.S., Belcher, W.R., Faunt, C.C., and Potter, C.J., 2010, Geology and hydrogeology, in Belcher, W.R., and Sweetkind, D.S., eds., chap. B of Death Valley regional ground-water flow system, Nevada and California—Hydrogeologic framework and transient ground-water flow model: U.S. Geological Survey Professional Paper 1711, p. 19–94. [Available at https://doi.org/10.3133/pp1711.]
U.S. Department of Energy, 1999, Corrective action investigation plan for Corrective Action Unit 98—Frenchman Flat, Nevada Test Site, Nevada (Revision 1): Las Vegas, Nev., U.S. Department of Energy, Nevada Operations Office, DOE/NV-478-REV. 1, 219 p. [Available at https://doi.org/10.2172/15033.]
U.S. Department of Energy, 2010, Environmental restoration: U.S. Department of Energy Fact Sheet DOE/NV-537, Rev. 4, 2 p., accessed May 9, 2022, at https://www.nnss.gov/docs/fact_sheets/DOENV_537.pdf.
U.S. Department of Energy, 2015a, United States nuclear tests, July 1945 through September 1992: U.S. Department of Energy Report DOE/NV-209-REV 16, 129 p., accessed May 9, 2022, at https://doi.org/10.2172/1351809.
U.S. Geological Survey, 2021, National water data for the nation: U.S. Geological Survey database, accessed October 2021 at https://nwis.waterdata.usgs.gov/nwis.
Wilcoxon, F., 1945, Individual comparisons by ranking methods: Biometrics Bulletin, v. 1, no. 6, p. 80–83, accessed January 24, 2022, at https://doi.org/10.2307/3001968.
Winograd, I.J., and Thordarson, W., 1975, Hydrogeologic and hydrochemical framework, south-central Great Basin, Nevada–California, with special reference to the Nevada Test Site: U.S. Geological Survey Professional Paper 712–C, 126 p. [Available at https://doi.org/10.3133/pp712C.]
Conversion Factors
U.S. customary units to International System of Units
Temperature in degrees Celsius (°C) may be converted to degrees Fahrenheit (°F) as follows:
°F = (1.8 × °C) + 32.
Temperature in degrees Fahrenheit (°F) may be converted to degrees Celsius (°C) as follows:
°C = (°F − 32) / 1.8.
Datum
Vertical coordinate information is referenced to the National Geodetic Vertical Datum of 1929 (NGVD 29).
Horizontal coordinate information is referenced to the North American Datum of 1983 (NAD 83).
Altitude, as used in this report, refers to distance above the vertical datum.
Supplemental Information
Transmissivity: The standard unit for transmissivity is cubic foot per day per square foot times foot of aquifer thickness ([ft3/d]/ft2)ft. In this report, the mathematically reduced form, foot squared per day (ft2/d), is used for convenience.
Abbreviations
+
plus or minus
bls
below land surface
CV
coefficient of variation
DEM
digital elevation model
DOE
U.S. Department of Energy
LOWESS
locally weighted scatterplot smoothing
NNSS
Nevada National Security Site
PEST
Parameter Estimation
TCU
tuff confining unit
TDS
total dissolved solids
USGS
U.S. Geological Survey
UTM
Universal Transverse Mercator
For more information concerning the research in this report, contact the
U.S. Geological Survey
Nevada Water Science Center
2730 N. Deer Run Road
Carson City, Nevada 89701
https://www.usgs.gov/centers/nv-water
Publishing support provided by the U.S. Geological Survey
Science Publishing Network, Sacramento Publishing Service Center
Suggested Citation
Jackson, T.R., and Frus, R.J., 2023, Evaluation of potential stresses and hydrologic conditions driving water-level fluctuations in well ER-5-3-2, Frenchman Flat, southern Nevada: U.S. Geological Survey Scientific Investigations Report 2022–5132, 35 p., https://doi.org/10.3133/sir20225132.
ISSN: 2328-0328 (online)
Study Area
| Publication type | Report |
|---|---|
| Publication Subtype | USGS Numbered Series |
| Title | Evaluation of potential stresses and hydrologic conditions driving water-level fluctuations in well ER-5-3-2, Frenchman Flat, southern Nevada |
| Series title | Scientific Investigations Report |
| Series number | 2022-5132 |
| DOI | 10.3133/sir20225132 |
| Year Published | 2023 |
| Language | English |
| Publisher | U.S. Geological Survey |
| Publisher location | Reston, VA |
| Contributing office(s) | Nevada Water Science Center |
| Description | Report: viii, 35 p.; Data Release |
| Country | United States |
| State | Nevada |
| Other Geospatial | Frenchman Flat |
| Online Only (Y/N) | Y |
| Google Analytic Metrics | Metrics page |