

Hydrologic Effects of Possible Changes in Water-Supply Withdrawals from, and Effluent Recharge to, the Kirkwood-Cohansey aquifer system, Winslow Township, Camden County, New Jersey
Links
- Document: Report (1.58 MB pdf) , HTML , XML
- Data Release: USGS data release - MODFLOW-2000 model used to evaluate the effects of possible changes in water-supply withdrawals from, and effluent recharge to, the Kirkwood-Cohansey aquifer system, Winslow Township, Camden County, New Jersey
- Download citation as: RIS | Dublin Core
Acknowledgments
The authors gratefully acknowledge the assistance of Stephen Lee and others at the Camden County Municipal Utilities Authority and Lou Bowman and others at the Winslow Township Department of Municipal Utilities in providing information and data for this study. The authors also appreciate input from members of the New Jersey Pinelands Commission.
Carol Luukkonen and Alex Fiore of the U.S. Geological Survey are thanked for their technical reviews of the report, as is Martha Watt for assistance creating the model archive and data releases for the Great Egg Harbor and Mullica River Basins groundwater flow model as well as the simulations described in this report.
Abstract
Winslow Township and the Camden County Municipal Utility Authority (CCMUA) developed a plan to shut down the Winslow sewage-treatment facility and associated effluent infiltration facility and transfer the effluent to the CCMUA sewage-treatment facility on the Delaware River in Camden, New Jersey. Winslow Township reduced groundwater withdrawals from the Kirkwood-Cohansey aquifer system to offset groundwater recharge lost with the cessation of effluent infiltration. The U.S. Geological Survey, in cooperation with Winslow Township and the CCMUA, collected data to evaluate conditions prior to cessation of effluent infiltration and installed two continuous-record streamflow-gaging stations. Streamflow measurements also were made at two low-flow partial-record sites, and groundwater levels were measured in 17 wells at high and low water-level periods (May and September 2010). A groundwater-flow model provides estimated changes in base flow of the Great Egg Harbor River under several groundwater-withdrawal and effluent infiltration scenarios.
Water levels were measured in an observation well 480 feet (ft) from the infiltration lagoons during 1971–2010. A downward trend in water levels in the well prior to 1985 is attributed in part to increased impervious surfaces and groundwater withdrawals associated with development in the area that began in the early 1970s. From late 1985 to 2010, there was an upward trend in water levels in the well that is attributed to the construction of nearby effluent infiltration lagoons in 1985 and the increasing rate of effluent infiltration during the period. Recent and historical measurements made at the four surface-water sites were correlated with same-day discharges measured at three nearby index stations to estimate continuous low-flow record at the sites. Effects on base flow caused by reductions in groundwater withdrawals or the cessation of effluent infiltration in Winslow Township could not be ascertained from the available data with the statistical and analysis methods used.
Groundwater discharge to streams (base flow) was simulated with a groundwater-flow model of the Great Egg Harbor and Mullica River Basins. Simulated monthly base flows using 2008–10 withdrawal rates and effluent recharge (Scenario 1) are generally about 1.5 million gallons per day (Mgal/d) greater than simulated base flows using 2003–07 withdrawal rates (Baseline Scenario) because of the 1.57 Mgal/d reduction in average withdrawals by Winslow Township from the Kirkwood-Cohansey aquifer system from 2003–07 to 2008–10. Simulated monthly base flows using 2008–10 withdrawals but without effluent infiltration (Scenario 2) are very similar to, but typically slightly lower than, Baseline Scenario base flows.
Three hypothetical future distributions of groundwater withdrawals from existing Winslow Township wells are simulated, each without effluent infiltration and using the same groundwater withdrawal rate as Scenario 2, but with different hypothetical distributions of withdrawals among existing Winslow Township wells. The Scenario 3 and 4 base flows are greater than the Baseline Scenario base flows in all months, and the Scenario 5 base flows are less than the Baseline Scenario base flows in all months. The simulation results indicate that a reduction in average withdrawals from the Kirkwood-Cohansey aquifer system by 1.57 Mgal/d offsets the reduction of effluent infiltration by about the same rate, resulting in nearly unchanged base flows in the Great Egg Harbor River near Blue Anchor (01410820).
Introduction
The Camden County Municipal Utilities Authority (CCMUA) infiltrated treated sewage effluent at their infiltration lagoons in Winslow Township, New Jersey (fig. 1) from 1985 to 2014. Increasing effluent volumes strained the capacity of the Winslow Township sewage-treatment facility and infiltration/percolation facility, so the CCMUA closed the infiltration/percolation facility in 2014 and began pumping the effluent from Winslow Township to the main CCMUA treatment facility in the City of Camden, New Jersey, which discharges treated effluent to the Delaware River. Eliminating infiltration of treated effluent in Winslow Township reduced groundwater recharge in the Great Egg Harbor River Basin. Water infiltrated at the CCMUA Winslow facility that reached the water table flowed toward, and discharged to, a nearby stream. Therefore, cessation of infiltration of treated effluent in Winslow Township reduced groundwater discharge (base flow) to the Great Egg Harbor River. Much of Winslow Township (including some production wells, but not the CCMUA effluent infiltration facility) is within the Pinelands National Reserve, a designated ecologically important and sensitive area. In consideration of the effects of reduced groundwater recharge on the ecosystem, Winslow Township agreed to reduce groundwater withdrawals from the unconfined Kirkwood-Cohansey aquifer system by 1.57 million gallons per day (Mgal/d) and use another source of water to meet current and future demand (New Jersey Pinelands Commission, 2009). Therefore, a study was conducted by the U.S. Geological Survey, in cooperation with the Township of Winslow and the CCMUA, to determine the effects of eliminating the infiltration of treated effluent and reducing groundwater withdrawals from wells completed in the Kirkwood-Cohansey aquifer system on groundwater levels and base flow in the Great Egg Harbor River, in Winslow Township, Camden County, New Jersey. The study included the collection of baseline data prior to the elimination of infiltration.
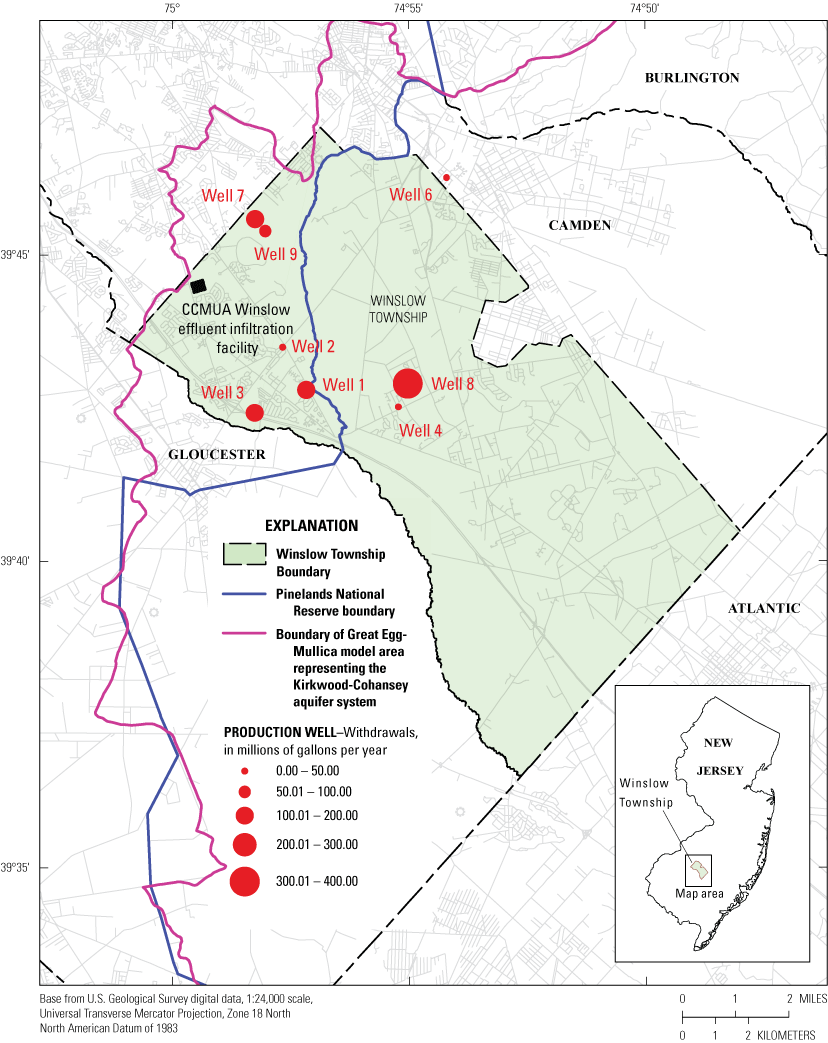
Map showing location of Winslow Township Department of Municipal Utilities public-supply wells and Camden County Municipal Utilities Authority (CCMUA) Winslow effluent infiltration facility, Winslow Township, Camden County, New Jersey.
Purpose and Scope
This report presents groundwater levels measured in 17 wells during spring and early fall 2010 and a comparison of those data with groundwater data from earlier investigations. Streamflow data collected at two partial-record streamflow-gaging stations (partial record stations) and two continuous-record streamflow-gaging stations (continuous-record stations) are also presented. Transient simulations of groundwater flow and base flow done with a previously developed groundwater-flow model of the Great Egg Harbor and Mullica Rivers (Pope and others, 2012) also are discussed. Six groundwater-withdrawal and effluent infiltration scenarios are explained. Groundwater-flow model input and output files for all the simulations described in the report are available in a U.S. Geological Survey data release (Carleton and others, 2023).
Description of Study Area
Winslow Township is in the Coastal Plain of New Jersey. All of Winslow Township lies within the Great Egg Harbor and Mullica River Basins, except for small areas on the northwestern border of the township that are in the Delaware River Basin (fig. 2). Most of the township is within the Pinelands National Reserve (fig. 1), the first National Reserve in the United States, which was created in 1978 to protect the unique ecosystem and hydrology of the Pinelands (New Jersey Pinelands Commission, 2007). The unconfined aquifer is the Kirkwood-Cohansey aquifer system, which ranges in thickness from about 150 to 300 feet (ft) in the township (Zapecza, 1989) and is an important water-supply aquifer tapped by 7 Winslow Township wells. The Piney Point aquifer is a minor confined aquifer less than 60 ft thick that occurs at depths of about 200 to 300 ft below land surface beneath the southeastern two-thirds of the township and is tapped by 2 Winslow Township production wells. The Wenonah-Mount Laurel aquifer is a confined aquifer that is present at a depth of about 350 to 700 ft below land surface, is 80–120 ft thick, and is tapped by 1 Winslow Township production well.

Map showing location of Camden County Municipal Utilities Authority (CCMUA) Winslow effluent infiltration plant, Winslow Township Department of Municipal Utilities public-supply wells, water-level observation wells, and continuous- and partial-record surface-water gaging stations, Winslow Township, Camden County, New Jersey.
The CCMUA Winslow effluent infiltration facility is near the northwestern boundary of the township, close to the basin divide of the Delaware and Great Egg Harbor River Basins. The infiltration facility was constructed in 1985 with 10 infiltration lagoons (each about 400 ft long and 200 ft wide), expanded with the addition of 5 lagoons in 1987, and expanded again with the addition of 3 lagoons in about 2002 (Stephen Lee, CCMUA, oral commun., 2011). The facility is about 1,200 ft by 1,400 ft but could not be expanded because of property constraints. In 2011, the Winslow sewage-treatment system received about 1.5–3 Mgal/d of effluent on a typical day and 3–5 Mgal/d on rainy days. The effluent was treated and then pumped to the infiltration/percolation facility, typically discharging to 1 of the 18 lagoons each day.
Previous Investigations
Fusillo (1981) collected surface-water- and groundwater-quality, streamflow, and groundwater-level data from 1972 to 1979 in Winslow Township to evaluate the effects of suburban residential development. Fusillo (1981) calculated that, in a small basin in which residential development occurred during the study period, the peak discharge for a 60-minute-unit hydrograph increased from 150 cubic feet per second (ft3/s) to 270 ft3/s. The peak discharge decreased to 220 ft3/s after installation of a stormwater detention basin.
Development during the study period was slower than originally projected, and Fusillo (1981) concluded that the effects on groundwater levels, streamflow, and water quality were minor, except for water-quality changes associated with discharges from the Winslow sewage-treatment facility. Prior to the construction of the effluent infiltration facility in 1985, effluent from the facility (which is adjacent to Fourmile Branch) was infiltrated on-site from 1971 to 1985. During 1973–74, nitrate concentrations in water from test wells surrounding the infiltration ponds exceeded 10 milligrams per liter (mg/L), and nitrate concentrations in Fourmile Branch were greater downstream than upstream from the facility. Modifications in 1974 to the sewage-treatment process increased denitrification; subsequently, during 1975–79, nitrate concentrations in Fourmile Branch upstream and downstream from the facility were the same. Phosphorous concentrations, however, were still elevated in Fourmile Branch downstream from the facility in 1978.
Fusillo (1981) measured groundwater levels and attributed a downward trend in water levels in two observation wells northwest of Winslow Township to below-normal precipitation in 1976 and the first 9 months of 1977. Fusillo (1981) also found no trend from 1973 through 1978 in water levels in 2 observation wells located between 2,000 and 3,000 feet from Winslow Well 1 which was the primary production well at that time (fig. 1). Proximity of the two observation wells to surface-water bodies (Great Egg Harbor River and Fourmile Branch) may have prevented changes in water levels large enough to detect.
Analysis of Groundwater Levels and Surface-Water Flow
Groundwater-level and surface-water-flow data were collected for this study to provide baseline data. Future groundwater levels and streamflow can be compared to the baseline data to determine the effects of cessation of effluent infiltration and reduction of groundwater withdrawals on groundwater levels and stream base flow in the study area.
Groundwater levels
Water levels were measured in 17 wells in and near Winslow Township to provide groundwater data prior to cessation of infiltration (table 1). Measurements were made in early May 2010 at the end of a wet spring and late September 2010 at the end of a dry summer (National Oceanic and Atmospheric Administration, 2015); therefore, the measurements exhibit more seasonal variation than would occur in a typical year. Groundwater levels in the wells decreased 0.59–7.52 ft between spring and fall measurements (U.S. Geological Survey, 2017). The least variation (–0.59 ft) was observed at a well (070479) close to a stream where the comparatively narrow range of stream elevations influences the water-level variations in the well. The largest variations (–7.52 ft and –6.21 ft) occurred in two of the four observation wells (071287 and 071285) at the effluent infiltration facility. However, water levels in one well (071286) at the facility changed by only –2.10 feet.
Table 1.
Well construction information and water-level data for 17 observation wells, Winslow Township, Camden County, New Jersey, 2010.[USGS, U.S. Geological Survey; NJDEP, New Jersey Department of Environmental Protection; CKKD, Kirkwood-Cohansey aquifer system; Twp, Township; MUA, Municipal Utility Authority; WC, Water Company; NJ, New Jersey; LSD, land-surface datum; NAVD88, North American Vertical Datum of 1988; NGVD29, National Geodetic Vertical Datum of 1929; —, no data]
Water levels in observation well Winslow 5 Obs (070503; table 1 and fig. 3), located 480 ft north of the infiltration lagoons, were influenced by effluent infiltration during 1985–2010. Water levels in the well were measured in 3 distinct intervals: in the 1970s by Fusillo (1981), as part of the USGS water-level network until 2006, and in 2010 for this study. Water levels in Winslow 5 Obs generally fluctuate in relation to precipitation, but an overall decline during 1971–81 and overall increase during 1986–2010 do not correspond to precipitation during those periods. Instead, the water levels correspond to increased residential construction (Fusillo, 1981) and the onset of infiltration of treated effluent in 1985 at the Winslow Township facility located a few hundred yards south of Winslow 5 Obs (070503). For example, water levels are lower during periods of comparatively high average precipitation in 1978–79 and 1983–84 than during similar periods in 1989–90 and 2003–04. Similarly, water levels are lower during periods of comparatively low average precipitation in 1976–77, 1980–82, and 1985–86 than during similar periods in 1988–89, 1991–92, 1995–96, 1999, and 2001–02 (National Oceanic and Atmospheric Administration, 2015).
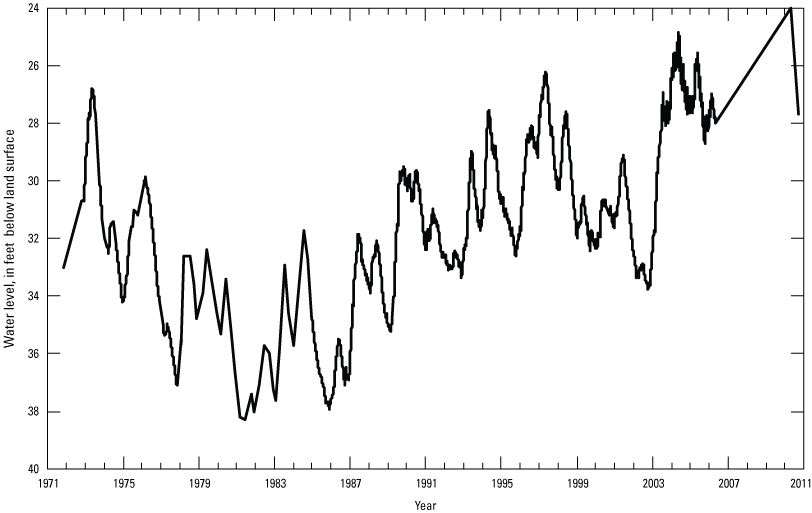
Graph showing water levels in observation well Winslow 5 Obs, Winslow Township, Camden County, New Jersey, 1971–2010. Obs, observation well.
Water levels in other USGS observation wells open to the unconfined Kirkwood-Cohansey aquifer system do not show a similar pattern. For example, during the drought of 2001–02, record-low water levels were recorded in 20 USGS observation wells open to the Kirkwood-Cohansey aquifer system. Water levels in Winslow 5 Obs during the 2001–02 drought were not close to being record lows, although the effects of the drought were apparent in the Winslow 5 Obs record. Water-levels for this period were about 4 ft higher than lows recorded during 1981–83.
Surface-Water Flow
For this study, two continuous-record streamflow gaging stations were installed at Great Egg Harbor River (GEHR) near Sicklerville (01410784) and GEHR near Blue Anchor (01410820). Because there was less than 10 years of record at these continuous-record stations, the data at these two stations were analyzed as partial-record stations. Quarterly measurements also were made at two partial-record stations, GEHR tributary at Sicklerville (01410787) and Fourmile Branch at New Brooklyn (01410810), during 2010–18 (fig. 2 and table 2). The streamflow data collected at the four sites in or near Winslow Township for this study and previous studies establish a streamflow record before and after reduction of groundwater withdrawal rates and cessation of effluent infiltration.
Table 2.
Streamflow correlations between four streamflow-gaging stations on the Great Egg Harbor River, Winslow Township vicinity, and three index stations, New Jesey, 1971–2018.Discrete streamflow measurements made at the four Winslow Township area stations re-established for this study were correlated using the Maintenance of Variance Extension, or MOVE.1 statistical method (Hirsch, 1982) with same-day flows measured at three nearby index stations (stations with long-term continuous data): GEHR at Folsom (01411000) (fig. 2), Oswego River at Harrisville (01410000), and Maurice River at Norma (01411500). Correlations were calculated for the period of 1971–2013 and 1971–2018 (the latter including the cessation of infiltration in early 2014) and results of the correlations are available in the “Ancillary” directory of the data release associated with this report (Carleton and others, 2023). Correlation coefficients and trend of residuals over time for the 1971–2018 correlations also are presented in table 2. (For the period 1971–2018, the correlations with index station Oswego River at Harrisville (01410000) for the four study sites did include one data point in February 2019.) The residuals (difference between the measured flow at the study sites and flow estimated by the correlation) were analyzed for long-term trends using the Kendall Tau method to determine whether the relationship between flows at the study sites and flows at the index-stations changed over time in response to local changes, for example, land-use or water-use changes within either basin. Because the index stations are within 30 miles of Winslow Township and are on rivers with similar geology and topography, the four study sites and the index stations are assumed to have about the same increase in average annual precipitation. If the three index stations and the four surface-water study sites in and near Winslow Township experienced the same increase in average annual precipitation, any trend in MOVE.1 residuals would be the result of changes in other factors (such as land use, groundwater recharge, and withdrawals) which differed between the four study sites and the index station basins.
Identification of trends over time are affected by limited data collection during some periods—base-flow measurements were made during 1971–2018 at GEHR near Sicklerville (01410784) in every decade and at Fourmile Branch at New Brooklyn (01410810) in every decade except the 1980s, but only a limited number of base-flow measurements at GEHR near Blue Anchor (01410820) were made during 1980–2004, so flow conditions during that 25–year period are underrepresented in the statistical calculations. No base-flow measurements were made at GEHR Tributary at Sicklerville (01410787) during 1980–2009. The small number of measurements during 1980-2009 reduces confidence of trend analyses during the period when Winslow Township groundwater withdrawals were increasing, (1971–2008) and effluent infiltration was increasing (1985–2013). These data are available in the “Ancillary” directory of the data release for this report (Carleton and others, 2023).
Winslow Township groundwater withdrawals were generally increasing during 1971–2007, including withdrawals within the basin named for streamflow-gaging station 01410784 on figure 2 from Wells 7 and 9 during 1996–2010 and 2015–18, Well 2 in the small basin named for streamflow-gaging station 01410787 (fig. 2), Well 3 in small basin named for streamflow-gaging station 01410810 (fig. 2), Wells 1, 2, 3, 4, 7 and 9 in basin named for streamflow-gaging station 01410820 (fig. 2), and Well 8 located outside the GEHR Basin but near the basin divide (fig. 2). All four basins are located within the Great Egg Harbor River Basin. Effluent infiltration at the CCMUA Winslow effluent infiltration facility in northern Winslow Township began in 1985, and the rate generally increased until cessation in early 2014.
No statistically significant linear trends in base flow at the four study sites in Winslow Township were identified that could be attributed to groundwater withdrawals or effluent infiltration in the township. In 9 of the 12 correlations among the 3 index stations and 4 study sites, there was no statistically significant (p > 0.05) trend over time for the residuals in the analysis of 1971–2013 or 1971–2018 data. A significant (p < 0.05) positive trend in the residuals for GEHR near Sicklerville (01410784) correlated with Oswego River at Harrisville (01410000) indicated flow at Great Egg Harbor River (GEHR) near Sicklerville (01410784) increased relative to the flow at index station 01410000 for the 1971–2013 and the 1971–2018 analysis. Great Egg Harbor River (GEHR) near Sicklerville (01410784) and index stations 01411500 and 01411000 show no statistically significant trend in residuals for the 1971–2013 and the 1971–2018 analysis. Because groundwater withdrawals from Wells 7 and 9 potentially reduce flow at GEHR near Sicklerville (01410784) rather than increase flow as indicated by the trend and because of the lack of a significant trend in the correlations between station 01410784 and index stations 01411000 and 01411500, the effects of groundwater withdrawals on flow at Great Egg Harbor River (GEHR) near Sicklerville (01410784) were not evident.
There were statistically significant (p < 0.05) trends over time in residuals for base-flow correlations between the GEHR tributary at Sicklerville (01410787), the partial-record station in the small basin near the CCMUA effluent infiltration facility and near Well 2 (fig. 2), with the index stations Oswego River at Harrisville (01410000) and GEHR at Folsom (01411000) for 1971–2013 data and the correlations with GEHR at Folsom (01411000) and Maurice River at Norma (01411500) for 1971–2018 data. The trend of the residuals was negative indicating that flow in the GEHR tributary at Sicklerville (01410787) was less than in the index stations Oswego River at Harrisville (01410000) and GEHR at Folsom (01411000) for 1971–2013 data and was less than in the index stations GEHR at Folsom (01411000) and Maurice River at Norma (01411500) for 1971–2018 data (table 2).
Influence of the cessation of effluent infiltration on flows at GEHR tributary at Sicklerville (01410787) was not apparent in the available data. Monthly effluent infiltration data were not available, but infiltration of effluent occurred at a steadier rate than groundwater withdrawals and daily, perhaps weekly, variability would likely be undetectable at the GEHR tributary at Sicklerville (01410787) gaging station about 1.8 miles away; the rate was assumed for the following discussion to have been about 2.25 ft3/s (1.46 Mgal/d) during 2010–13. Cessation of effluent infiltration may be assumed to reduce base flow at GEHR tributary at Sicklerville (01410787), but the medians and averages of residuals of measurements made during 2010–13 were less than those during 2014–18.
Effects of withdrawals and effluent infiltration on base flow of Fourmile Branch at New Brooklyn (01410810) were not apparent in the correlations with the three index stations for 1971–2013 and 1971–2018. There were no statistically significant trends (table 2). The median of residuals for measurements made during 1971–2008 (excluding measurements during 2002–06 when no withdrawals from Well 3 were reported) indicate less flow in Fourmile Branch at New Brooklyn (01410810) compared to the median of residuals for measurements made in months during 2010–18 when withdrawals from Well 3 were 0 (or less than 0.05 ft3/s). Although the residuals suggest withdrawals from Well 3 reduced flows in partial-record station 01410810, these results were not statistically significant, and no firm conclusion was reached.
Effects of withdrawals and effluent infiltration on base flow of GEHR near Blue Anchor (01410820) were not apparent in the correlations with the 3 index stations for 1971–2013 and 1971–2018. The medians and averages of residuals for measurements made during 1971–2007 compared to those for measurements made after 2007 (when withdrawals from Winslow public-supply wells were reduced) do not show a clear pattern: the median residual for the earlier period was lower than for the later period for the correlations with index stations 01410000 and 01411500. The opposite was true for the correlation with index station 01411000. Similarly, the average residual for the later period was lower than for the earlier period for the correlations with index stations 01411000 and 01411500 but not index station 01410000. The reduction of groundwater withdrawals may be expected to increase the residuals, but the inconclusive results, limited number of data points, and multiple possible external factors mean that the effect of the change in withdrawals on base flow is not evident. The median and average residuals for 2014–18 were greater than those for 2008–13, the opposite of what would be expected with the cessation of effluent infiltration.
Simulation of Hydrologic Changes
The effects on streamflow from the cessation of effluent infiltration and concomitant reduction in groundwater withdrawals in Winslow Township were simulated with a groundwater-flow model developed by Pope and others (2012) to compare baseflow depletion against monthly low-flow thresholds. The model provides quantitative predictions of future conditions that were based on data and assumptions used to construct and calibrate the model to 1998–2006 conditions. All scenarios of groundwater withdrawal and effluent infiltration conditions are transient simulations using monthly stress periods and include monthly recharge estimates for 1998 to 2006. A baseline simulation (Baseline scenario) was completed for this study to provide model results against which additional simulations were compared. This Baseline Scenario is the same as the Pope and others (2012) average scenario, except that WTDMU withdrawals were set to 2003–07 rates instead of the average annual withdrawals for the period 1998–2006. Five scenarios of different withdrawal and effluent infiltration stresses in the model were simulated, and results were compared to the results from the Baseline Scenario and each other to evaluate the effects of changes. Scenario 1 includes 2008–10 WTDMU withdrawals (reflecting the reduction in withdrawals beginning in 2008) and effluent infiltration. Scenario 2 includes 2008–10 WTDMU withdrawals and no effluent infiltration. Scenarios 3–5 include the same magnitude of 2008–10 WTDMU withdrawals and no effluent infiltration as Scenario 2 but test the effect on stream base flow of distributing the withdrawals in different ways among existing wells.
Description of Groundwater-Flow Model
The groundwater-flow model used in this study was developed in cooperation with the New Jersey Department of Environmental Protection (NJDEP) for regional planning purposes. The model is described in detail by Pope and others (2012) and will be described briefly here. Pope and others (2012) calibrated the model to estimated mean monthly base flow at 22 sites and mean monthly water levels in 14 observation wells, as well as spring and early fall water-level-synoptic measurements made in 148 wells. The simulations are transient with monthly time steps.
The groundwater-flow model was developed to evaluate the effects on stream base flow (groundwater discharge to streams) of withdrawals from the unconfined and confined Kirkwood-Cohansey aquifer system in the Great Egg Harbor and Mullica River Basins. In downdip areas, the model has nine layers that represent the surficial unconfined Kirkwood-Cohansey aquifer system, an intermittent clay confining unit, a semi-confined part of the upper Kirkwood-Cohansey aquifer system, a confining unit, the Rio Grande water-bearing zone, a confining unit, the upper Atlantic City 800-foot sand, a confining unit, and the lower Atlantic City 800-foot sand. In Winslow Township and other updip areas, the Kirkwood-Cohansey aquifer system is unconfined. All nine model layers in the Winslow Township area of the model are active but are assigned the same hydraulic conductivity and collectively represent the unconfined Kirkwood-Cohansey aquifer system.
The lateral (northwestern) boundary of the model in Winslow Township (fig. 1) is along the surface-water basin divide separating the Great Egg Harbor River Basin from the Delaware River Basin (fig. 2). The divide is assumed to be the groundwater divide between the basins and is therefore modeled as a no-flow boundary. This model boundary is close to the Winslow Township effluent infiltration lagoons, and recharge from the effluent infiltration facility is simulated as flowing solely towards the Great Egg Harbor River (and tributaries) and to withdrawal wells in the Great Egg Harbor River Basin. If the groundwater divide does not coincide with the surface-water divide (perhaps in part because of the presence of the infiltration lagoons), it is possible that some of the infiltrated effluent from the lagoons discharges to streams in the Delaware River Basin. If some of the effluent actually flows into the Delaware River Basin, then cessation of infiltration will have less of an effect on base flows in the Great Egg Harbor River Basin than calculated by the simulations.
Surface-water features (streams, rivers, ponds, and wetlands) are represented as specified-head boundaries using either the Drain or River Packages of MODFLOW (Harbaugh and others, 2000). Upper reaches of streams often are ephemeral and only act as a discharge point for groundwater, not a source of water to the aquifer. Therefore, the upper reaches of streams are represented with the Drain Package such that groundwater discharges to the boundary when the water table is above the specified head of the boundary; however, if the water table is below the specified head, the drain boundary has no effect on the system. If the aquifer water level is above the specified head of a surface-water boundary represented with the River Package, groundwater discharges to the boundary; if the groundwater level is below the specified head, water flows from the river boundary into the aquifer. Parts of streams and rivers that are perennial are represented with the River Package because it is realistic for them to be a source of water flowing into the aquifer if water levels are lowered by nearby groundwater withdrawals.
The top boundary of the model is a specified-flux boundary for which estimates of recharge were made based on precipitation data, estimated direct runoff, estimated evapotranspiration, and soil-moisture deficit. Groundwater recharge remained the estimated recharge for 1998–2006 from Pope and others (2012). The estimated recharge for each month during 1998–2006 was applied to the surface of the model, thus the recharge varied every month. Daily precipitation data during 1998–2006, estimated percentage of direct runoff, and estimated monthly evapotranspiration (ET) rates were used to calculate a soil-moisture deficit. On days when estimated net infiltration of precipitation (precipitation minus direct runoff minus ET) exceeded the soil-moisture deficit, the excess is assumed to recharge the aquifer. Using this technique, the recharge was estimated for each month during 1998–2006, which included a dry period from 1999 to 2002 when streamflows were comparable with those observed during the 1960s drought.
Model Limitations
Limitations of the groundwater-flow model are discussed in detail in Pope and others (2012). Limitations that are particularly relevant to this study include the regional scale of the model. The regional-scale model was designed primarily to simulate the interaction between the confined Atlantic City 800-foot sand and the unconfined Kirkwood-Cohansey aquifer systems. Model cells are 880 ft by 880 ft in Winslow Township, meaning that about 60 model cells cover the GEHR tributary at Sicklerville (01410787) basin area, and 8 cells have surface-water boundaries representing the tributary, potentially causing errors that would not occur with a finer-scale grid. Also, the assumption that the groundwater divide is coincident with the surface-water divide and is a no-flow boundary is appropriate and sufficiently accurate at a regional scale, but the proximity of the WTDMU wells and CCMUA Winslow effluent infiltration facility to the no-flow boundary may cause errors. For example, the nearby no-flow boundary prevents a modeled production well from receiving water from another surface-water basin; however, that capture may be occurring. Similarly, simulated effluent infiltration near the model boundary cannot leave the GEHR Basin; however, some infiltrated effluent may flow to the Delaware River Basin.
Groundwater Withdrawals and Effluent Infiltration as Model Input
Groundwater withdrawals in the model are the average annual withdrawals during 1998–2006 from Pope and others (2012) except withdrawals from wells in Winslow Township. The average annual groundwater withdrawal during 1998–2006 for each user was determined, and the same annual withdrawal rate was used as model input for each year. The percentage of the average annual withdrawal occurring each month by each user was calculated, and for users with multiple wells, the percentage of withdrawals from each well was calculated. Thus, the rates of withdrawal vary from month to month but were the same for each year of the simulation, allowing the effects of withdrawals during periods of different recharge in dry years and wet years to be compared.
The withdrawals made by the WTMDU were calculated using the same method described in the previous paragraph; however, the simulated monthly withdrawals by the WTDMU were the average annual withdrawals during 2003–07 for the Baseline Scenario and the average annual withdrawals during 2008–10 for Scenarios 1–5. The Baseline Scenario average annual withdrawals from WTDMU Kirkwood-Cohansey aquifer system wells total 931 million gallons per year (Mgal/yr) (2.55 Mgal/d) during 2003–07 (table 3). The Baseline Scenario includes groundwater recharge from the CCMUA Winslow effluent infiltration facility at the 2003–07 rate of 666 Mgal/yr (1.82 Mgal/d). The Scenario 1 and Scenario 2 average annual withdrawals during 2008–10 from Kirkwood-Cohansey aquifer system wells of 358 Mgal/yr (0.98 Mgal/d) reflect the 1.57 Mgal/d (573 Mgal/yr) reduction from 2003-07 rates. The Scenario 1 effluent infiltration rate is the 2008–10 rate of 697 Mgal/yr (1.9 Mgal/d; table 3). For the simulations, it was assumed that all of the effluent infiltrates to the water table (groundwater recharge) and that none is lost to evaporation from the infiltration lagoons. There is no CCMUA Winslow facility effluent infiltration in Scenarios 2–5.
Table 3.
Simulated withdrawal rates for Winslow Township Department of Municipal Utilities wells and recharge rates for the Camden County Municipal Utilities Authority Winslow effluent infiltration facility, Winslow Township, Camden County, New Jersey, 2003–10.[USGS, U.S. Geological Survey; NJDEP, New Jersey Department of Environmental Protection; Mgal/yr, million gallons per year; gal/min, gallons per minute; Mgal/mo, million gallons per month; GEHR, Great Egg Harbor River; CKKD, Kirkwood-Cohansey aquifer system; MLRW, Wenonah-Mount Laurel aquifer; n/a, not applicable]
During 2008–10, WTDMU withdrew water from Wells 1, 2, 3, 4, 6, 7, 8, 9, 10, and 11. Wells 10 and 11 are open to the Piney Point aquifer and supply a section of the township water system that is not connected to the rest of the system, so they are not considered in this study. Well 6 is open to the Wenonah-Mount Laurel aquifer (which is not included in the model), and the remaining wells are open to the unconfined Kirkwood-Cohansey aquifer system. Wells 1, 2, 3, 7, and 9 are in the Great Egg Harbor River (GEHR) Basin and are west of the mainstem. Well 4 is in the GEHR Basin and is east of the mainstem. Well 8 is close to the basin divide of the GEHR Basin and is in the Mullica River Basin.
The effect of withdrawals from each WTDMU well on base flow of the GEHR was estimated by running a set of simulations with the full amount of average 2008–10 withdrawals at each well and comparing simulated base flows to Scenario 2 base flows. Because Well 6 is open to the deep, confined Wenonah-Mount Laurel aquifer, withdrawals from Well 6 are assumed to not reduce base flow of the GEHR. Of wells open to the Kirkwood-Cohansey aquifer system, withdrawals simulated at Wells 1, 2, and 3 result in the greatest reduction in simulated GEHR base flows and simulated withdrawals at Well 8 results in the least reduction of GEHR base flows. Withdrawals simulated at Wells 4, 7, and 9 reduce GEHR base flows more than withdrawals from Well 8 but less than withdrawals from Wells 1, 2, and 3. Simulated withdrawals from Wells 4, 7, 8, and 9 reduce Mullica River base flows more than Wells 1, 2, and 3. Although a simulation with all WTDMU withdrawals from one well provides useful information, it would not be physically possible because of limitations in the maximum withdrawal rate the wells can sustain as a result of aquifer characteristics, well construction, and (or) pump capacity.
Scenarios 3, 4, and 5 include the same total WTDMU withdrawal rate as Scenario 2 (370 Mgal/yr), but with three different hypothetical distributions of withdrawals among the Winslow Township wells, such that no well exceeds its maximum permitted rate (table 3). Scenario 3 was designed to represent a withdrawal scheme that maximizes simulated base flow in the GEHR. Withdrawals from Well 6 (open to the deeper confined Wenonah-Mount Laurel aquifer) are assumed to not reduce base flow in the GEHR, so an average annual withdrawal rate of 106 Mgal/yr was simulated for Well 6 so that no monthly withdrawal exceeds the maximum permitted rate of 22 million gallons per month (Mgal/mo) (500 gallons per minute [gal/min]; table 3). Simulated withdrawals from Well 8 resulted in the second lowest reduction in GEHR base flows, so for Scenario 3, an annual rate of 188 Mgal/yr was simulated so that no monthly withdrawal exceeds the maximum permitted rate for Well 8 of 1,000 gal/min. The withdrawals simulated for Wells 7 and 9 were an annual rate of 38 Mgal/yr each.
Scenario 4 was designed to represent a withdrawal scheme that maximizes base flow of the GEHR without the unrealistic assumption simulated in Scenario 3 which simulated Wells 6 and 8 pumping at their maximum rate for an entire month. Scenario 4 withdrawal rates from Wells 6 and 8 were based on more realistic peak demand rates of 350 and 800 gal/min, respectively, resulting in average annual rates of 79 and 150 Mgal/yr, respectively. Withdrawals from Wells 7 and 9 were at an annual rate of 47 Mgal/yr each. Withdrawals from Well 4 were at the same rates as those for Wells 7 and 9. This was considered a realistic scenario because the withdrawal rates are within the 2011 capacities (assuming planned water-treatment capacity is added to Wells 7 and 9; Lou Bowman, Winslow Township Department of Municipal Utilities, oral commun., 2011).
Scenario 5 was designed to represent a withdrawal scheme that minimizes simulated base flow in the GEHR. Scenario 5 withdrawals are entirely from Wells 2 and 3 because the simulated source of water for those wells is primarily within the GEHR Basin. Withdrawals from Well 2 were simulated at an annual rate of 165 Mgal/yr so that no monthly withdrawal exceeds the permitted rate of 37 Mgal/mo (850 gal/min). Simulated withdrawals from Well 3 were at an annual withdrawal rate of 205 Mgal/yr, so that the simulated maximum monthly withdrawal rate was 1,050 gal/min (less than the permitted 1,300 gal/min).
Simulated Base Flow in the Great Egg Harbor River
The primary concern regarding cessation of infiltration at the CCMUA Winslow effluent infiltration facility is the effect the reduction in aquifer recharge stemming from cessation of infiltration will have on base flow of the Great Egg Harbor River. WTDMU reduced groundwater withdrawals by a rate similar to the effluent infiltration rate with the expectation that the net effect on base flows would be small. In the following section, simulated base flows from the Baseline Scenario were compared to Scenario 1 base flows to estimate the effect of reduced withdrawals and to Scenario 2 base flows to estimate the effect of reduced withdrawals and cessation of effluent infiltration. Similarly, simulated base flows from Scenario 2 were compared to base flows from Scenarios 3, 4, and 5 to observe the effect the different distributions of withdrawals from WTDMU wells have on base flows. These effects are discussed in the section “Simulations with changes in groundwater withdrawal distributions.”
Simulation with Changes in Groundwater Withdrawal Rates and Elimination of Effluent Infiltration
GEHR near Blue Anchor (01410820) is the farthest downstream streamflow-gaging station used for this study and, therefore, includes all changes in simulated base flow in the GEHR resulting from changes in withdrawal rates and elimination of effluent infiltration. Simulated monthly base flows at GEHR near Blue Anchor (01410820) range from 14.2 to 42.5 Mgal/d (22.0 to 65.8 ft3/s) for the Baseline Scenario (fig. 4). Simulated monthly base flows of the GEHR near Blue Anchor (01410820) in Scenario 1 were similar to the Baseline Scenario base flows, but were an average of about 1.5 Mgal/d greater because of a combination of the 1.57 Mgal/d reduction in WTDMU average annual withdrawals from the Kirkwood-Cohansey aquifer system that occurred from 2003–07 to 2008–10, the 0.1 Mgal/d increase in effluent infiltration, and a difference in the distribution of withdrawals among WTDMU wells between the scenarios. The increase in base flow from the Baseline Scenario to Scenario 1 is about 0.2 Mgal/d less than the net change in withdrawals and effluent infiltration because a higher percentage of the Scenario 1 withdrawals is from WTDMU Wells 1, 2, and 3, and a lower percentage is from Well 8 than in the Baseline Scenario, thus increasing the effect of WTDMU withdrawals on GEHR base flows.
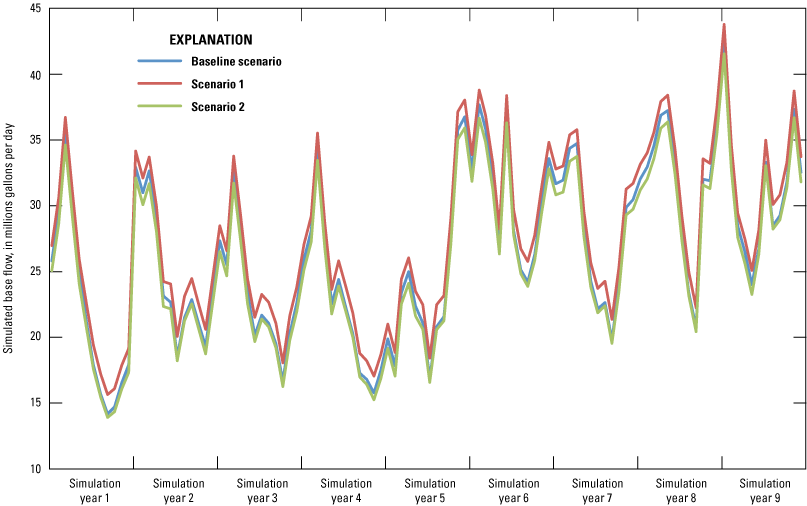
Graph showing simulated base flow at Great Egg Harbor River near Blue Anchor (01410820) for the Baseline Scenario and Scenarios 1 and 2, Winslow Township, Camden County, New Jersey.
Simulated monthly base flows near GEHR near Blue Anchor (01410820) in Scenario 2 were similar to, but lower than, Baseline Scenario base flows (figs. 4 and 5). The Scenario 2 base flow was an average of 0.6 Mgal/d (0.9 ft3/s) lower than that of the Baseline Scenario, about 0.3 Mgal/d of which is the result of the combination of the 1.57 Mgal/d decrease in withdrawals and the elimination of 1.9 Mgal/d of effluent recharge from infiltration. The remaining approximate 0.3 Mgal/d reduction in base flow is caused by the change in the distribution of withdrawals among the WTDMU wells described in the preceding paragraph. Scenario 2 base flows were as much as 1.0 Mgal/d (1.55 ft3/s) less than Baseline Scenario base flows (fig. 5). However, the greatest differences occurred during January to April, a high-flow time of year, and the least differences occurred in August (average 0.3 Mgal/d), a low-flow time of year.
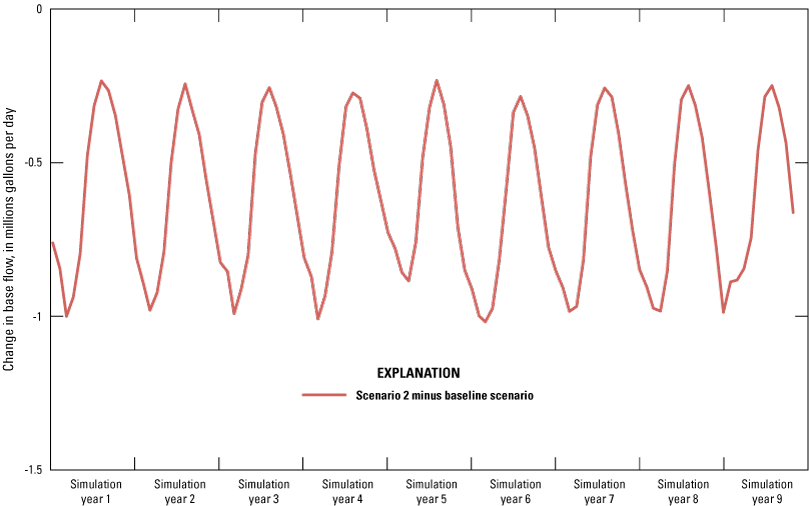
Graph showing difference in simulated base flows at Great Egg Harbor River near Blue Anchor (01410820) between Scenario 2 and the Baseline Scenario, Winslow Township, Camden County, New Jersey.
Scenario 2 base flows represent the expected condition of WTDMU groundwater withdrawals at 2008–10 rates, 1.57 Mgal/d less than 2003–07 rates, and without effluent infiltration at the CCMUA Winslow effluent infiltration facility. Simulated GEHR base flows were lower in Scenario 2 than in the Baseline Scenario partly because the reduction in groundwater withdrawals of 1.57 Mgal/d is less than the simulated reduction of effluent recharge of 1.9 Mgal/d. However, for the simulations, it was assumed that 100 percent of the effluent discharged to the infiltration lagoons reached the water table, when most likely some of it was lost to evaporation. Also, because the infiltration lagoons are so close to the surface-water-basin divide (and, therefore, the presumed water-table divide), it is possible that some of the infiltrated effluent was discharging as base flow to the Delaware River Basin. Because the groundwater-flow model used for this study has a no-flow boundary at the surface-water divide, it is not possible to quantify how much (if any) of the infiltrated effluent was discharging to the Delaware River Basin. The simulated reduction in base flow of the GEHR from the Baseline Scenario to Scenario 2 that is attributed to the different distribution of withdrawals among the WTDMU was quantified in Scenarios 3–5, described in the following section.
Simulations with Changes in Groundwater Withdrawal Distributions
Three hypothetical alternative distributions of groundwater withdrawals at the 2008–10 average annual rate from existing Winslow Township wells (described in the “Groundwater Withdrawals and Effluent Infiltration as Model Input” section earlier in this report) were used: Scenario 3, designed to maximize GEHR base flow by setting withdrawals from Wells 6 and 8 based on their permitted rate; Scenario 4, designed to maximize base flow by setting withdrawals from Wells 6 and 8 at rates considered to be more realistic rates for well performance than their permitted rate; and Scenario 5, designed to minimize GEHR base flow by setting withdrawals from Wells 2 and 3 based on the permitted rates. The differences between simulated base flows at GEHR near Blue Anchor (01410820) with the actual well-by-well distribution of WTDMU withdrawals (Scenario 2) and the hypothetical well-by-well distributions of Scenarios 3–5 are shown in figure 6. The differences in base flows range from –0.2 to 0.6 Mgal/d.
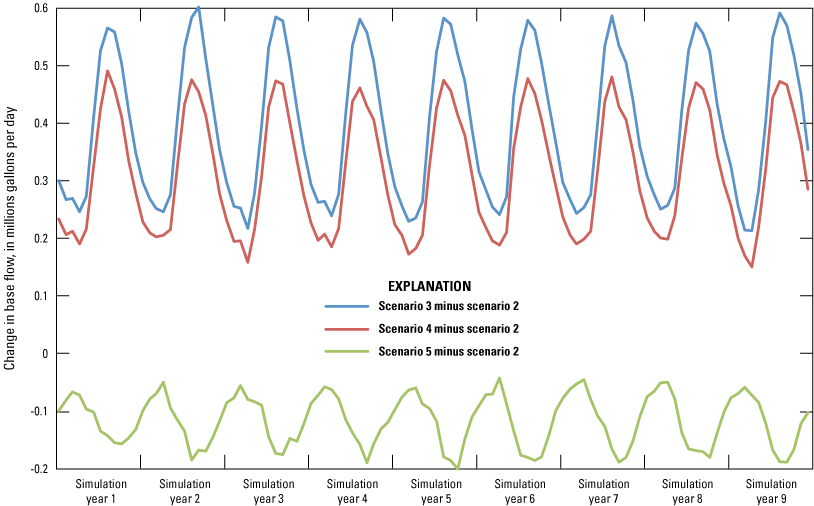
Graph showing differences in simulated base flows at Great Egg Harbor River near Blue Anchor (01410820) between Scenario 2 and Scenarios 3, 4, and 5, Winslow Township, Camden County, New Jersey.
Scenario 3 simulated GEHR base flows range from about 0.2 Mgal/d to 0.6 Mgal/d more than Scenario 2 base flows (fig. 6). Scenario 3 base flows were greater than Scenario 2 base flows because of increased withdrawals from Well 6, which is not hydraulically connected to the GEHR, and Well 8, which withdraws groundwater from the Mullica River Basin, and elimination of withdrawals from Wells 1–4, which withdraw groundwater from the Great Egg Harbor River Basin. The differences between Scenario 3 and Scenario 2 base flows were greatest during the generally low-flow period of August–October, with Scenario 3 base flows about 0.6 Mgal/d more.
Greater withdrawals from Wells 6 and 8 in Scenario 4 than in Scenario 2 and no withdrawals from Wells 1, 2, and 3 in Scenario 4 result in simulated GEHR base flows that were greater than those in Scenario 2, ranging from about 0.15 to 0.5 Mgal/d more. Scenario 5 base flows are less than Scenario 2 base flows, ranging from about 0.04 Mgal/d to 0.2 Mgal/d less, because all withdrawals were from Wells 2 and 3, which withdraw water primarily from the GEHR Basin. The differences between Scenario 5 and Scenario 2 base flows were greatest during August–October, with Scenario 5 base flows about 0.2 Mgal/d less each year. The base flows are the least different during March–April.
Summary and Conclusions
Winslow Township and the Camden County Municipal Utility Authority (CCMUA) ceased the infiltration of treated sewage effluent at the Winslow Township facility, and instead transferred the effluent to the CCMUA facility on the Delaware River in Camden. Most of Winslow Township, New Jersey, is within the boundaries of the Pinelands National Reserve, although the effluent infiltration facility and some of the Winslow Water Department production wells are located west of the Pinelands boundary. Winslow Township agreed to reduce groundwater withdrawals from the Kirkwood-Cohansey aquifer system to offset the recharge that would be lost to the aquifer when the infiltration of effluent ceased. The U.S. Geological Survey (USGS), in cooperation with Winslow Township and the CCMUA, made streamflow measurements at four study sites, installed two continuous-record stations, made groundwater-level measurements in 17 wells during high and low water-level periods in May and September 2010, respectively, and simulated stream base flow using a previously existing groundwater-flow model.
Groundwater-level measurements were made in 17 wells in and near Winslow Township to provide water-level data prior to cessation of infiltration. Measurements were made in early May 2010, at the end of a wet spring, and late September 2010, at the end of a dry summer. Water-level declines from spring to fall ranged from 0.59 feet (ft) to 7.52 ft. The smallest variation was observed at a well close to a stream. The largest variations occurred in 2 of the 4 observation wells at the effluent infiltration facility; water levels in these wells were greatly affected by which of the 18 infiltration lagoons contained water on the day the measurements were made.
Water levels were measured in an observation well 480 ft from the infiltration lagoons from 1971 to 2010. Generally declining water levels occurred from the installation of the observation well in 1971 to 1985. From late 1985 to 2010, water levels in the observation well generally rose, in part, because of the construction of the nearby effluent infiltration lagoons in 1985 and the increasing rate of effluent infiltration during the period.
Continuous-record stations were established in Winslow Township at Great Egg Harbor River (GEHR) near Sicklerville (01410784) and GEHR near Blue Anchor (01410820). Because there was less than 10 years of record at these continuous-record stations, the data stations were analyzed as partial-record stations. Streamflow measurements also were made at two partial-record streamflow-gaging stations, GEHR tributary at Sicklerville (01410787) and Fourmile Branch at New Brooklyn (01410810). Recent and historical measurements made at these four sites were correlated with same-day discharges at three nearby index stations to estimate continuous low-flow record at the sites. The correlations were analyzed for long-term trends. Effects on base flow caused by reductions in groundwater withdrawals or cessation of effluent infiltration in Winslow Township could not be ascertained from the available data with the statistical and analysis methods used.
Groundwater discharge to streams (base flow) was simulated using a previously developed groundwater-flow model of the Great Egg Harbor and Mullica River Basins. The Baseline Scenario includes Winslow Township average groundwater withdrawals and effluent infiltration for 2003–07. Five additional scenarios were simulated: Scenario 1 with average Winslow Township withdrawals for 2008–10 and average effluent infiltration for 2008–10, Scenario 2 with Scenario 1 withdrawals but without effluent recharge, and Scenarios 3–5 without effluent infiltration and with withdrawals at the same rate as Scenario 2 but distributed in three hypothetical ways that are different from the actual distribution during 2008–10. The average withdrawals from Winslow Township Department of Municipal Utilities (WTDMU) wells open to the Kirkwood-Cohansey aquifer system were 2.55 million gallons per day (Mgal/d) (931 Mgal/yr [million gallons per year]) during 2003–07 and 0.98 Mgal/d (358 Mgal/yr) during 2008–10, and average effluent infiltration was 1.82 Mgal/d (666 Mgal/yr) during 2003–07 and 1.9 Mgal/d (697 Mgal/yr) during 2008–10.
Baseline Scenario simulated monthly base flows at GEHR near Blue Anchor (01410820) range from 14.2 to 42.5 Mgal/d. Scenario 1 monthly base flows were similar to Baseline Scenario base flows but are about 1.5 Mgal/d greater because of the combination of the 1.57 Mgal/d reduction in average annual withdrawals from the Kirkwood-Cohansey aquifer system, the 0.1 Mgal/d increase in effluent infiltration, and a decrease in base flow attributed to the different distribution of withdrawals among Winslow Township wells. Scenario 2 monthly base flows are similar to, but an average of 0.6 Mgal/d lower than, Baseline Scenario base flows because of the combination of the 1.57 Mgal/d reduction in groundwater withdrawals, 1.9 Mgal/d elimination in effluent recharge from infiltration, and a decrease in base flow from the different distribution of withdrawals. Scenario 2 base flows had reached the greatest monthly difference (compared to Baseline Scenario) during January–April, a high-flow time of year, and had reached their smallest difference in August, a low-flow time of year.
Three alternative distributions of groundwater withdrawals among Winslow Township wells at the 2008–10 average rate were simulated: Scenario 3 designed to maximize base flow in the GEHR Basin by setting withdrawals from Wells 6 and 8 based on their maximum permitted rates, Scenario 4 in the GEHR Basin designed to maximize base flow while setting withdrawals from Wells 6 and 8 at rates considered to be more realistic than their permitted rate, and Scenario 5 designed to minimize base flow by setting withdrawals from Wells 2 and 3 based on their maximum permitted rates. Scenario 3 and Scenario 4 base flows are 0.15–0.6 Mgal/d greater than Scenario 2 base flows because of increased withdrawals from Well 6 (which is open to the deeper confined Wenonah-Mount Laurel aquifer that is not hydraulically connected to the Great Egg Harbor River) and Well 8 (which captures flow primarily from the Mullica River Basin). Scenario 5 base flows are less than Scenario 2 base flows, ranging from 0.04 to 0.2 Mgal/d less, because all withdrawals were from Wells 2 and 3, which capture flow primarily from the Great Egg Harbor River Basin. The differences between Scenario 5 and Scenario 2 base flows are greatest during the generally low-flow period of August–October.
Simulation results indicate that reduction of withdrawals from the Kirkwood-Cohansey aquifer system by Winslow Township offsets the reduction of effluent infiltration, which were about the same rates, resulting in similar base flows in the GEHR near Blue Anchor (01410820). Small differences occur because, for the simulations, it was assumed that none of the effluent is lost to evaporation and that all of the infiltrated effluent flows to the Great Egg Harbor River Basin. Because the infiltration facility is near the surface-water divide between the Great Egg Harbor River and Delaware River Basins, it is possible that some of the infiltrated effluent is discharging to streams in the Delaware River Basin, thereby reducing the loss of base flow in the Great Egg Harbor River when effluent infiltration ceases. Simulation results also indicate that increasing the percentage of withdrawals from Winslow Township Wells 4, 6, 7, 8, and 9 and reducing the percentage of withdrawals from wells 1, 2, and 3 increases base flow in the Great Egg Harbor River.
References Cited
Carleton, G.B., Pope, D.A., and Sandaogo, B.Y., 2023, MODFLOW-2000 model used to evaluate the effects of possible changes in water-supply withdrawals from, and effluent recharge to, the Kirkwood-Cohansey aquifer system, Winslow Township, Camden County, New Jersey: U.S. Geological Survey data release, https://doi.org/10.5066/F7154G0Z
Fusillo, T.V., 1981, Impact of suburban residential development on water resources in the area of Winslow Township, Camden County, New Jersey: U.S. Geological Survey Water-Resources Investigations Report 81–27, 38 p. [Also available at https://doi.org/10.3133/wri8127.]
Harbaugh, A.W., Banta, E.R., Hill, M.C., and McDonald, M.G., 2000, MODFLOW -2000, The U.S. Geological Survey Modular Ground-Water Model—User guide to modularization concepts and the ground-water flow process: U.S. Geological Survey Open-File Report 00–92, 121 p. [Also available at https://doi.org/10.3133/ofr200092]
Hirsch, R.M., 1982, A comparison of four streamflow record extension techniques: Water Resources Research, v. 18, no. 4, p. 1081–1088. [Also available at https://doi.org/10.1029/WR018i004p01081.]
National Oceanic and Atmospheric Administration, 2015, Climate Data Online: National Centers for Environmental Information, accessed November 30, 2016 at: https://www.ncdc.noaa.gov/cdo-web/.
New Jersey Pinelands Commission, 2007, The Pinelands Nation Reserve: New Jersey Pinelands Commission, accessed September 25, 2014, at https://www.state.nj.us/pinelands/reserve/.
Pope, D.A., Carleton, G.B., Buxton, D.E., Walker, R.L., Shourds, J.L., and Reilly, P.A., 2012, Simulated effects of alternative withdrawal strategies on groundwater flow in the unconfined Kirkwood-Cohansey aquifer system, the Rio Grande water-bearing zone, and the Atlantic City 800-foot sand in the Great Egg Harbor and Mullica River basins, New Jersey: U.S. Geological Survey Scientific Investigations Report 2012–5187, 139 p. [Also available at https://doi.org/10.3133/sir20125187]
U.S. Geological Survey, 2017, USGS water data for the Nation: U.S. Geological Survey National Water Information System database, accessed September 27, 2017 at: https://doi.org/10.5066/F7P55KJN.
Zapecza, O.S., 1989, Hydrogeologic framework of the New Jersey Coastal Plain: U.S. Geological Survey Professional Paper 1404-B, 49 p., 24 pl. [Also available at https://doi.org/10.3133/pp1404B].
Conversion Factors
U.S. customary units to International System of Units
Datum
Vertical coordinate information is referenced to the North American Vertical Datum of 1988 (NAVD 88).
Horizontal coordinate information is referenced to the North American Datum of 1983 (NAD 83).
Altitude, as used in this report, refers to distance above the vertical datum.
Abbreviations
CCMUA
Camden County Municipal Utilities Authority
ET
evapotranspiration
ft3/s
cubic feet per second
GEHR
Great Egg Harbor River
Mgal/d
million gallons per day
Mgal/mo
million gallons per month
Mgal/yr
million gallons per year
MOVE.1
Maintenance of Variance Extension
NAD 83
North American Datum of 1983
NAVD 88
North American Vertical Datum of 1988
NGVD 29
National Geodetic Vertical Datum of 1929
NJDEP
New Jersey Department of Environmental Protection
Obs
observation well
USGS
U.S. Geological Survey
WTDMU
Winslow Township Department of Municipal Utilities
For more information about this publication, contact:
Director, New Jersey Water Science Center
3450 Princeton Pike, Suite 110
Lawrenceville, NJ, 08648
For additional information, visit: https://www.usgs.gov/centers/new-jersey-water-science-center
Publishing support provided by the West Trenton Publishing Service Center
Suggested Citation
Carleton, G.B., and Pope, D.A., 2023, Hydrologic effects of possible changes in water-supply withdrawals from, and effluent recharge to, the Kirkwood-Cohansey aquifer system, Winslow Township, Camden County, New Jersey: U.S. Geological Survey Scientific Investigations Report 2023–5002, 16 p., https://doi.org/10.3133/sir20235002.
ISSN: 2328-0328 (online)
Study Area
| Publication type | Report |
|---|---|
| Publication Subtype | USGS Numbered Series |
| Title | Hydrologic effects of possible changes in water-supply withdrawals from, and effluent recharge to, the Kirkwood-Cohansey aquifer system, Winslow Township, Camden County, New Jersey |
| Series title | Scientific Investigations Report |
| Series number | 2023-5002 |
| DOI | 10.3133/sir20235002 |
| Year Published | 2023 |
| Language | English |
| Publisher | U.S. Geological Survey |
| Publisher location | Reston, VA |
| Contributing office(s) | New Jersey Water Science Center |
| Description | Report: vii, 16 p.; Data Release |
| Country | United States |
| State | New Jersey |
| County | Camden County |
| Other Geospatial | Winslow Township |
| Online Only (Y/N) | Y |
| Additional Online Files (Y/N) | N |
| Google Analytic Metrics | Metrics page |