

Investigation of Potential Factors Controlling Benthic Algae in the Upper White River Basin, Colorado, 2018–21
Links
- Document: Report (6.72 MB pdf) , HTML , XML
- Related Works:
- USGS Fact Sheet 2023-3005— Potential Factors Controlling Benthic Algae in the Upper White River Basin, Colorado, 2018–21
- USGS Scientific Investigations Report 2022-5112— Characterization of Streamflow and Nutrient Occurrence in the Upper White River Basin, Colorado, 1980–2020
- Data Releases:
- USGS data release— Channel Characteristics, benthic algae, and water quality model data for selected sites in the upper White River Basin, Colorado, 2018-21
- USGS data release— USGS water data for the Nation: U.S. Geological Survey National Water Information System database
- Download citation as: RIS | Dublin Core
Acknowledgments
The report was improved by review comments from U.S. Geological Survey staff Rodney J. Richards and Keith Bouma-Gregson. Any use of trade, firm, or product names is for descriptive purposes only and does not imply endorsement by the U.S. Government. Special thanks to the White River Technical Advisory group for their input throughout the study.
Abstract
Nuisance levels of benthic filamentous green algae are becoming increasingly common in surface waters of Colorado and the western United States. In 2018 the U.S. Geological Survey began a study in cooperation with the White River and Douglas Creek Conservation Districts, Colorado River Basin Salinity Control Forum, and the Colorado River Water Conservation District to collect and analyze physical, chemical, and biological information for the upper White River Basin in Colorado and investigate causes of benthic algal blooms in the basin. This report (1) presents site-specific data including water temperature, riparian canopy cover, streambed particle size, and algal biomass and community composition; (2) describes the potential for streambed movement during spring runoff using physical channel characteristics and peak streamflow velocities; and (3) explains the results of a linear mixed-effects model used to test hypotheses about the influence of physical and chemical factors in explaining the occurrence of algal blooms across the basin.
Benthic algal biomass ranged from 0.7 to 309 milligrams per square meter during the summer (July–August) from 2018 through 2021 and exceeded the Colorado Department of Public Health and Environment criteria of 150 milligrams per square meter on four occasions in 2018. Four genera of filamentous green algae were identified in the upper White River Basin, including Cladophora, Stigeoclonium, Ulothrix, and Spirogyra. Many genera of cyanobacteria were present, including some capable of producing toxins and taste and odor compounds. The nuisance diatom Didymosphenia geminata, commonly referred to as didymo, was found at two sites on the South Fork White River and along the main stem White River.
Hypotheses pertaining to the influence of measured variables on algal biomass were tested with a linear mixed-effects model. Median rock size and mean August water temperature had significant positive effects, meaning that greater bed stability and higher mean August water temperatures result in greater algal biomass. Total nitrogen to total phosphorus ratios had a significant negative effect on algal biomass, meaning that more nitrogen-limiting conditions, or greater phosphorus availability, corresponded to greater algal biomass.
Streamflow and water temperature data at White River above Coal Creek near Meeker, Colo., were used to assess possible causes of bloom conditions across years, including when algal blooms were first studied in the basin during 2016 and 2017. Early or low-magnitude peak streamflow conditions were not prerequisites for algal bloom occurrence. Conversely, relatively large, late, and long-lasting peak streamflows, such as those measured in 2019, may limit algal blooms during the same year and into subsequent years, as evidenced by extremely low algal biomass in 2019 and 2020. The broad spatial extent of bloom conditions indicates that the factors contributing to the occurrence of algal blooms are likely basinwide. Findings from this multiyear study indicate that the effects caused by larger peak streamflow, including movement of the streambed, may be the dominant control on the occurrence of an algal bloom. The findings also indicate that in the absence of disturbance other resources, including substrate size, water temperature, and nutrient availability, moderate algal biomass.
Introduction
Bottom-attached (benthic) algae are primary producers found in rivers and include green algae, diatoms, and cyanobacteria. Benthic algae can reach nuisance levels when factors including excess nutrients, changing hydrologic regime, and elevated temperatures stimulate algal growth (Dodds, 1991; Schneider, 2015). Excessive accumulation of benthic algae, or algal blooms, can compromise aesthetic quality of rivers and streams, limit recreational activities, block water infrastructure, and have negative effects on aquatic life, including strong fluctuations in dissolved oxygen levels and toxin production (Dodds and others, 2009). Management of benthic algal blooms requires an understanding of what controls algal growth and proliferation. As benthic algal assemblages are attached to substrate, their biomass and community composition are affected by physical, chemical, and biological factors that occur in the stream.
Streamflow is considered a master variable (Poff and others, 1997) governing ecological characteristics of riverine ecosystems. Several characteristics of the streamflow regime are considered ecologically important, including seasonal timing, magnitude, frequency, and duration of high and low streamflows (Olden and Poff, 2003). High streamflow events, including snowmelt runoff and rain events, can reduce benthic algal abundance by acting as a force of physical disturbance through mass scouring or even streambed reorganization (Power and Stewart, 1987; Biggs, 1996). Low streamflows can also influence algal abundance and composition by reducing the volume, area, and depth of aquatic habitat and by changing the instantaneous velocity of rivers (Biggs and Close, 1989; Rolls and others, 2012).
Streamflow and other factors, including land use and climate change, can mediate water-quality conditions that are ecologically important to benthic algae, such as water temperature, light availability, nutrient loading, and the potential for effluent dilution (Rolls and others, 2012; Piggott and others, 2014; Schneider, 2015). Water temperature and light availability are principal factors that regulate algal metabolism and growth rates (Munn and others, 1989; Bowman and others, 2007) and can control the seasonal succession of algae in freshwater (Reynolds, 1984). Channel morphology or land-use factors that increase temperature and light availability, such as widened stream channels or low riparian canopy cover, can increase algal biomass (Warnaars and others, 2007). Aspects of the hydrologic regime, including the timing of peak streamflows, can also dictate the influence of temperature and light on benthic algae. For example, cold stream conditions during snowmelt runoff have increased turbidity, limiting light availability as sediments are transported into and through water bodies. During years with earlier snowmelt runoff, which is increasingly commonplace in the western United States (Stewart and others, 2005), the growing season for algae can start earlier, leading to higher biomass accrual of benthic algae (Schneider, 2015). Similarly, low streamflow during the summer can result in warmer temperatures favorable to algae, especially filamentous green algae, and cyanobacteria (Stevenson and Rollins, 2017).
Benthic algal growth in stream ecosystems is commonly limited by availability of nitrogen, phosphorus, or both (Elser and others, 2007; Beck and others, 2019). In experimental studies, nutrient enrichment has led to increases in algal biomass in streams (Dodds and others, 1997) and is associated with the growth of specific taxa, including filamentous green algae (Dodds, 1991; Stevenson and others, 2006). Storage of nutrients within algal cells or associated with bed sediments within the channel provide nutrient sources for algae to utilize when nutrients from the water column may be more limited. The influence of nutrients on algal biomass may be more pronounced when limitations caused by physical disturbance are less intense, such as during years with minimal streamflow disturbance or during the period immediately following disturbance, including the receding limb of the snowmelt hydrograph and the summer growing season (Chételat and others, 1999; Biggs, 2000). Thus, nutrient-reduction strategies typically target sources of nutrients that influence concentrations during the algal growing season (Suplee and Watson, 2013).
In 2016, Colorado Parks and Wildlife (CPW) identified filamentous green algae collected from the main stem White River in northwestern Colorado as Cladophora glomerata, a pervasive nuisance aquatic alga (May and Noble, 2017). In 2018, the U.S. Geological Survey (USGS), in cooperation with the White River and Douglas Creek Conservation Districts, the Colorado River Basin Salinity Control Forum, and the Colorado River Water Conservation District, began a study to collect and analyze physical, chemical, and biological information for the upper White River Basin. This study aims to increase understanding of the biology of the upper White River Basin, identify potential factors promoting or limiting nuisance algal abundance, and outline information needs to aid in the understanding and protection of water resources. An accompanying report associated with this study presents seasonal and spatial patterns and describes long-term changes in streamflow and nutrient occurrence in the upper White River Basin (Day, 2023). Table 1 provides information on the water-quality and streamgage sites in the study area.
Table 1.
Summary of U.S. Geological Survey water-quality and streamgage sites in the upper White River Basin, Colorado (U.S. Geological Survey, 2021a).[Site numbers and subbasins are shown on figure 1. no., number; USGS, U.S. Geological Survey; NGVD 29, National Geodetic Vertical Datum of 1929; CO, Colorado; CR, County Road]
Purpose and Scope
The purpose of this report is to describe what potential factors influence benthic algal biomass and community composition across study years and among sites by documenting physical and benthic algal conditions at 20 surface-water sites in the upper White River Basin from 2018 to 2021. Data were collected by the USGS, Trout Unlimited, and CPW. This report (1) presents site-specific data including water temperature, riparian canopy cover, streambed particle size, and algal biomass and community composition; (2) describes the potential for streambed movement during spring runoff using physical channel characteristics and peak streamflow velocities; and (3) explains the results of a linear mixed-effects model used to test hypotheses about the influence of physical and chemical factors in explaining the occurrence of algal blooms across the basin. Hypotheses tested include the following:
-
Streamflow-induced movement of the streambed during snowmelt runoff may change conditions that limit algal biomass.
-
Physical and chemical characteristics associated with streambed particle size, water temperature, light availability, and nutrient availability, will affect algal biomass.
The upper White River Basin, as defined in this report, is the area of land drained by the White River from its headwaters in the Flat Tops, a mountain range in Garfield County, Colo., to just upstream from the confluence with Curtis Creek near Meeker, Colo. (fig. 1).
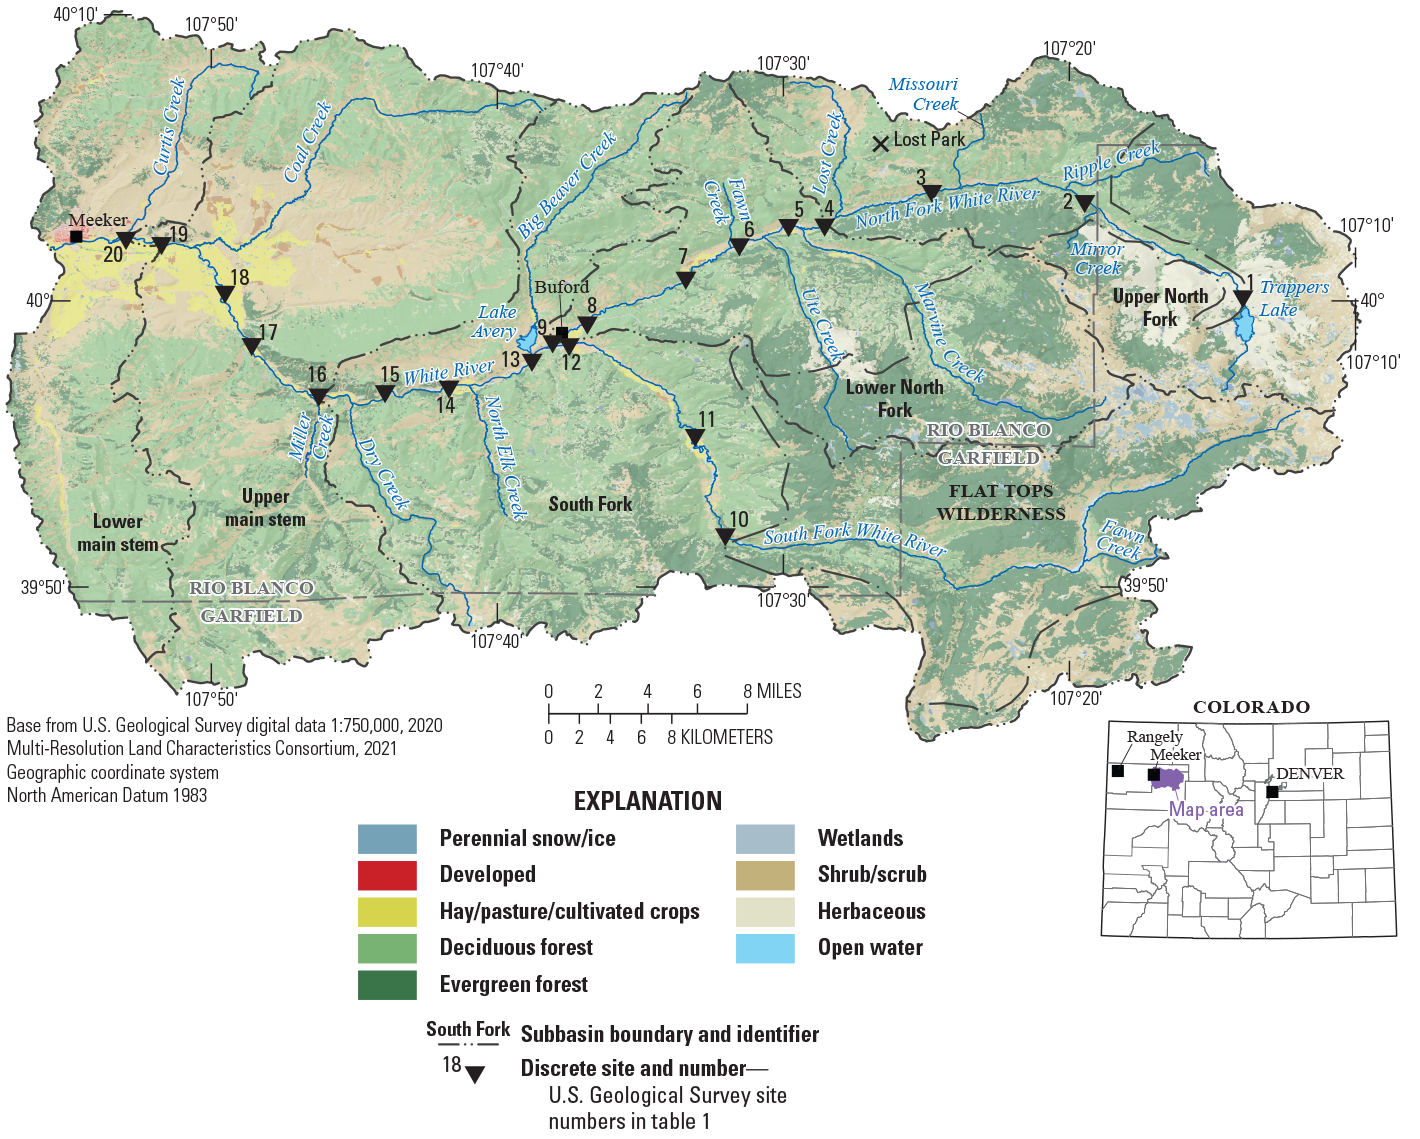
Location of the upper White River Basin, Colorado, with selected U.S. Geological Survey water-quality and streamgage sites (U.S. Geological Survey, 2021a) and land use (from Multi-Resolution Land Characteristics Consortium, 2021).
Description of Study Area
The upper White River Basin drains approximately 1,020 square miles of the White River Basin in northwestern Colorado (fig. 1). More information about the study area is available in Day (2023). The study area was divided into five subbasins for this analysis (fig. 1; table 1): (1) upper North Fork White River; (2) lower North Fork White River; (3) South Fork White River; (4) upper main stem White River; (5) lower main stem White River. Land cover within the upper White River Basin is largely forest, 64 percent; herbaceous (including grassland), 14 percent; and shrubland, 9 percent (fig. 1). Cultivated crops (including hay and pasture) comprise 4.5 percent of the basin and are primarily located along the river and concentrated in the lower main stem White River subbasin. Urban development covers 0.5 percent of the land area and is also concentrated in the lower main stem White River subbasin (Multi-Resolution Land Characteristics Consortium, 2021).
Previous Investigations
The upper White River Basin has been the focus of multiple studies of water quality and biology regarding the onset of benthic algal blooms (May and Noble, 2017; HydroSolutions, 2017; Skibo, 2018; GEI Consultants, Inc., 2021; Hodge and Eyre, 2021; Day, 2023). The USGS has collected continuous streamflow data at the White River above Coal Creek streamgage site since water year (WY) 1962. A WY is the 12-month period from October 1 through September 30 and is designated by the year in which it ends. Discrete water-quality data have been collected quarterly at four sites located on two major tributaries and the main stem of the White River across varying timescales (USGS, 2021a). These data, in addition to supplemental water temperature, water-quality, and macroinvertebrate data, have been used to investigate benthic algal occurrence in the upper White River Basin.
In 2016, water-quality, macroinvertebrate, and benthic algal samples were collected from multiple locations in the White River and Coal Creek Basins (May and Noble, 2017). Algal biomass exceeded the Colorado Department of Public Health and Environment (CDPHE) standard of 150 milligrams per square meter (mg/m2; CDPHE, 2017) at four of five sites sampled, and the filamentous green algae C. glomerata was identified as the most visually abundant species at most sites. A nutrient enrichment study was also conducted at five sites and identified nitrogen availability as the limiting factor in algal growth. The authors also suggested that nutrient availability in the main stem White River was sufficient to support nuisance algal blooms along much of the study area. Reductions of both nitrogen and phosphorus were recommended to reduce algae growth in the river.
Two independent analyses of existing streamflow and water-quality data were performed in the study area (HydroSolutions, 2017; Skibo, 2018). The analysis confirmed that adequate nutrient concentrations exist for algal blooms to occur and that a reduction in spring and summer streamflow, particularly in the North Fork White River, likely contributes to the occurrence of algal blooms (Skibo, 2018). Long-term changes in streamflow-normalized concentrations and loads were identified, including decreases in total nitrogen and increases in total phosphorus (HydroSolutions, 2017). Changes in streamflow, including lack of sustained scouring flows, timing of runoff and length of growing season, and occurrence and frequency of low flows and changes in climate were cited as contributors to nuisance algal blooms.
A macroinvertebrate study conducted from 2017 to 2019 characterized macroinvertebrate communities within the upper White River Basin (GEI Consultants, Inc., 2021). Results of the analysis indicated that macroinvertebrate assemblages were generally healthy and well-balanced. The presence of benthic algae such as Cladophora can have negative and positive effects on macroinvertebrates through changing factors like habitat suitability and food availability. The presence of benthic algae may have caused differences in macroinvertebrate community composition compared to sites without algae, though high variability and other unidentified factors could also have influenced macroinvertebrate populations.
Continuous water temperature data collection at White River above Coal Creek began in WY 1978; however, the continuous water temperature record is limited to WY 1978–84 and 2007–22, and monitoring data from 2007–22 are seasonal (May 1 through September 30) (USGS, 2021a). Continuous water temperature collected during parts of 2019 and 2020 at the same monitoring sites used in this study (fig.1; table 1) were previously used to explore spatial and temporal patterns in stream temperature (Hodge and Eyre, 2021).
Methods
Physical, chemical, and biological data from 20 sites in the upper White River Basin, including 9 sites on the North Fork White River, 3 sites on the South Fork White River, and 8 sites on the main stem White River, were collected and are described in this report (fig. 1; table 1). In addition to describing data at individual sites, data are also described for five subbasins, where delineation was designed to allow for generalizing conditions in the basin while accounting for the influence of major hydrologic features. Select data are used in a linear-mixed effects model to assess variation in algal biomass across sites.
Data Collection
The USGS, Trout Unlimited, and CPW collected data from 2018 through 2021. This section provides details on the methods of channel cross-section surveys, streambed particle size characterization, streamflow velocity measurements, riparian canopy cover estimation, and benthic alga sample collection and analysis. All channel geometry, particle size, streamflow velocity, canopy cover, and algal taxonomy data are in a USGS data release (Day and others, 2023). Water temperature data are from Hodge and Eyre (2021).
Channel Cross-Section Surveys, Streambed Surface Particle Size, and Streamflow Velocity
Stream channel geometry cross sections and streambed surface particle size were measured during the summer of 2018 at most study sites. Stream channel geometry cross sections were surveyed using real-time kinematic global navigation satellite system (RTK-GNSS) methods (Rydlund and Densmore, 2012). Streambed surface particle-size distribution was characterized by measuring the b-axis of 100 streambed clasts along three transects at each site (Wolman, 1954). Particle-size fractions for the 50th and 84th percentiles, herein referred to as the D50 (median particle size) and D84, were calculated from the cumulative frequency distribution function (Wolman, 1954).
Streamflow velocity was measured during May–June (peak runoff) of 2018–20 at selected study sites when conditions allowed. Streamflow velocity was measured with acoustic Doppler current profiler methods (Mueller and others, 2013) and noncontact surface velocity Doppler radar methods (Fulton and others, 2020), as conditions warranted. Limitations of these data collection efforts are discussed in the “Streambed Movement” section of this report.
Riparian Canopy Cover
Riparian canopy cover was characterized during July 2019 at 20 study sites using a spherical densiometer (Lemmon, 1956). Four measurements were taken at each site from the center of the stream channel with the operator facing upstream, downstream, toward the left bank, and toward the right bank. The percentage of obstruction of the densiometer view field was recorded for each measurement, and an average riparian canopy cover was calculated for each site. Based on stream width, lower lying bank vegetation may not always be measured using this method.
Algal Biomass and Community Abundance and Composition
Benthic algal samples were collected each summer from July through August, at 20 study sites between 2018 and 2020, and at 9 study sites in 2021. Algal sampling targeted peak algal conditions each summer as determined by regular site visits and site photographs from volunteers in the basin. Once peak conditions were determined, all 20 sites were sampled as soon as possible. In 2018, samples were collected from July 9 to August 8; in 2019, from August 19 to 30; in 2020, from August 10 to 19; and in 2021, from July 13 to 15.
Algae were collected using a protocol modified from U.S. Environmental Protection Agency National Rivers and Streams Assessment (U.S. Environmental Protection Agency, 2013). Eight rocks, typically less than (<) 0.5 meters in diameter, were randomly collected from three transects per site, making 24 rocks in total. Transects were perpendicular to the river channel and spaced approximately 50 feet to 100 feet apart in wadable areas. The length of transects varied by site because of channel width differences and ranged from approximately 10 feet to 100 feet. Benthic algae were scraped from rocks and combined into a well-mixed composite sample from which aliquots were drawn for algal biomass as chlorophyll a (hereafter referred to as “biomass”). Once a rock was scraped, the area on the rock that was scraped was wrapped in aluminum foil and weighed to determine the surface area that was sampled. In 2020 and 2021, aliquots from composite samples were also drawn for community abundance (number of cells per volume of water) and composition (abundance and biovolume [volume of cells per volume of water]) at 20 sites and 5 sites, respectively. Algal samples were processed in a mobile water-quality laboratory and kept frozen and in the dark until shipment to the USGS National Water Quality Laboratory in Lakewood, Colo., for analysis (Arar and Collins, 1997). Quality-control samples for biomass were used to evaluate sampling and analytical variability (Mueller and others, 2015). All biomass data for this study are stored in the USGS National Water Information System database (USGS, 2021a) and can be retrieved using the USGS site numbers found in table 1.
The quality-control methods and protocols used were in accordance with USGS policies (Mueller and others, 1995). Quality-control samples for biomass were equivalent to 10 percent of total biomass samples collected and consisted of sequential and split replicates. Differences in replicate samples were used to identify variability in analytical methodology or variability in field methods and equipment used prior to analysis. The relative percent difference was calculated to assess variability between the environmental and replicate samples. In 2018, sequential replicates were collected and analyzed for each of the three transects at two sites to quantify variability in all steps of sample collection, processing, and analysis. Relative percent differences in chlorophyll a from sequential replicates ranged from 9 to 73 percent. Differences among sequential replicates likely reflect differences in algal coverage across transects. In 2019–21, split replicates of composite samples were collected at two sites during each summer sampling, and relative percent differences ranged from 2 to 51 percent. Algal samples collected for taxonomic identification were preserved in 2-percent Lugol’s solution and shipped to BSA Environmental Services, Inc. in Beachwood, Ohio, and analyzed for taxonomic identification, enumeration, and biovolume of diatoms and soft algae. The data are in Day (2023).
Algal biomass concentrations were compared to the State of Colorado interim water-quality criteria for chlorophyll a established by the CDPHE to protect the beneficial uses of surface water, which include support of aquatic life and use for domestic water supply, agriculture, and recreation (CDPHE, 2017). The standard concentration of chlorophyll a for cold rivers and streams is 150 mg/m2 and applies from July 1 to September 30.
Data Analysis
Streamflow at White River above Coal Creek during the study period, from October 1, 2018, through September 30, 2021, was compared to below-normal, normal, and above-normal streamflow over the period of record (WYs 1962–2021). Streambed movement was estimated to better understand sediment transport and disturbance regimes across sites. A linear mixed-effects model was used to evaluate the relative concurrent roles of different drivers, including nutrient, hydrologic, and physical habitat conditions, on algal biomass across study sites.
Streamflow Duration Curves
Streamflow conditions were classified using the percentile classes defined on the USGS WaterWatch website (USGS, 2021b); streamflow less than the 10th percentile, or streamflow that is exceeded 90 percent of the time, is much-below-normal, below-normal streamflow is greater than 10th and less than the 25th percentiles (exceeded between 90 percent and 75 percent of the time), normal streamflow is greater than the 25th and less than the 75th percentiles (exceeded between 25 percent and 75 percent of the time), above-normal streamflow is greater than the 75th percentile and less than 90th percentile (exceeded 25 percent of the time), and much-above-normal is greater than the 90th percentile (exceeded 10 percent of the time).
Streambed Movement
Streambed movement was determined using the modified critical shear method to understand sediment transport along cross-section averaged conditions (U.S. Department of Agriculture Forest Service, 2008; Julien, 2010). Critical shear, or the estimated amount of shear stress required to move a given particle size, was determined for each site using the streambed particle-size distribution data from multiple cross sections at each site. Critical shear was estimated for the D50 and D84 at each site. The D50 was selected because it can represent the typical grain size within the cross section. The D84 represents the coarser grains within the size distribution, which determines some characteristics of the shape of the channel boundary and may make up most of the streambed surface where the algae attach and grow. Movement of the D84 would represent widespread transport within the cross section and substantial bed disturbance as the framework is mobilized, and with it much of the finer material sheltered by these larger particles.
Boundary shear was estimated using the surveyed high-water marks, cross-section surveys, depths, and stream slopes (U.S. Department of Agriculture Forest Service, 2008; Julien, 2010). Boundary shear is the actual shear stress streamflow forces exert, and it represents the average sediment-transport condition along the surveyed cross section. Isolated transport may occur within a cross section even when the average sediment-transport condition does not. Comparisons of boundary and critical shear were used to identify if average transport conditions occurred at cross sections and if streambed movement was likely to have occurred during high-flow conditions characterized by surveyed high-water marks.
Streambed movement was likely to have occurred at cross sections when boundary shear stress exceeded critical shear. Determinations were made for 2018, 2019, and 2020 at most sites. RTK-GNSS limitations precluded collection of survey data at South Fork White River near Budges Resort. Other sites had unrecoverable or indeterminate high-water marks or other field conditions that prevented determination, including North Fork White River at Rio Blanco County Road 14 and North Fork White River below Buford during all years and North Fork White River below Trappers Lake in 2018.
Linear Mixed-Effects Model
A linear mixed-effects model was used to evaluate the relative concurrent roles of different drivers, including nutrient, hydrologic, and physical habitat conditions, on algal biomass across study sites. Complete exploration into the causes of variation in algae across sites and years is limited by data availability across years, specifically during 2018, when nutrient and temperature data were not collected. Variation in algal biomass was assessed during 2019–20, when complete data were available. Initial data exploration involved identifying homogeneity of variances, outliers, normality, and collinearity, and exploring relations between predictors and response variables (Zuur and others, 2010).
Within a linear mixed-effects model, fixed effects are the main reproducible factors of interest (in the case of this study, particle size or nutrient concentration), and an effect size is estimated for each fixed effect. The effect size indicates the relative influence, positive or negative and to what degree, on the predicted variable (for this study, algal biomass). Much of the variance associated with fixed effects can be attributed to other factors, such as location in the basin. Thus, including these factors as random effects in the model can help inform properties of the fixed effects and explain much of the variation in the predicted variable. For this study, the model structure included algal biomass as the dependent variable; median streambed particle size (D50), mean August water temperature, riparian canopy cover, and the molar ratio of total nitrogen to total phosphorus (N:P) as the fixed-effect variables; and site number as a random-effect variable. An analysis of variance test was used to test for significance (p-value <0.05) and provide information about levels of variability among fixed effects in the model. Fixed-effect variables were scaled and centered prior to modeling, and algal biomass was logarithm (base 10) transformed prior to analysis to meet assumptions of heteroscedasticity and normality of residuals (Gelman and Hill, 2007). All statistics were performed in R software version 3.6.1 using ImerTest version 3.1-3 (R Core Team, 2021). Algal biomass and N:P are found in NWIS (USGS, 2021a), the D50 and riparian canopy cover are in a USGS data release (Day and others, 2023) and water temperature data are from Hodge and Eyre (2021).
Physical Conditions in the Upper White River Basin
Physical conditions evaluated in the upper White River Basin included streamflow, water temperature, riparian canopy cover, streambed particle size, and streambed movement. Streamflow conditions were assessed at White River above Coal Creek (site no. 18, fig. 1) during October 2018 through September 2021. Riparian canopy cover was assessed at 20 sites during July 2019. Streambed movement was assessed at 20 sites during peak runoff, May or June, during 2018 through 2020.
Description of Hydrograph
Attributes of the annual hydrograph can strongly influence aquatic biota (Poff and others, 1997). Annual fluctuations in precipitation and air temperatures in the winter and spring play an important role in the timing, duration, and magnitude of snowmelt runoff (Woodhouse and others, 2016), the largest input of water to snowmelt-driven systems like the upper White River Basin. Subsequent low-streamflow periods are influenced by groundwater inputs and anthropogenic uses, such as irrigation and other agricultural purposes. Streamflows during spring runoff are generally cold and turbid and can act as a physical disturbance to the aquatic ecosystem. Streamflows during the summer (July–Sept) are relatively stable, can have lesser streamflow volumes that are warmer, have greater light penetration, and have longer residence times.
The following section describes the annual hydrograph at White River above Coal Creek during 2018–21 in relation to short-term climate and average annual runoff dates and is used to support further investigation of annual variation in water temperature, streambed movement, and algal biomass. An assessment of long-term changes in annual streamflows and how they might influence algal blooms are discussed in Day (2023).
During October 2018 through September 2021 the hydrograph at White River above Coal Creek represented a wide range of conditions compared to the long-term record, 1962–2021 (fig. 2; table 2). In 2018, low snowpack and warm spring air temperatures at this site resulted in an early peak streamflow, 17 days earlier than the average peak streamflow date from 1962 to 2021 of May 28 (USGS, 2021a). Streamflow was around 50 percent of average from April through June 2018 (Natural Resources Conservation Service, 2021) and was in the below-normal range for much of the summer months, July, August, and September. In 2019, high snowpack and cool spring air temperatures resulted in an extended duration of streamflow runoff with peak streamflow occurring on June 21, about 23 days later than the May 28 average peak streamflow date (table 2). Streamflow was 135 percent of average from April through June 2019 (Natural Resources Conservation Service, 2021) and remained above the 90th percentile (much above normal) through July (fig. 2). In 2020, peak streamflow occurred closer to the average peak streamflow date. Streamflow was 63 percent of average from April through June (Natural Resources Conservation Service, 2021) and was in the much-below-normal percentile for most of the summer (fig. 2). In 2021, peak streamflow was close to the average peak streamflow date, and streamflow from April through June was 38 percent of normal (Natural Resources Conservation Service, 2021) and remained much below normal through the summer (fig. 2).
Table 2.
Streamflow statistics for White River above Coal Creek near Meeker, Colorado, 2018–21.[Streamflow statistics are based on daily mean values; streamflow data are available from the U.S. Geological Survey National Water Information System (U.S. Geological Survey, 2021a). CO, Colorado; ft3/s, cubic feet per second; min, minimum; max, maximum; --, not applicable]
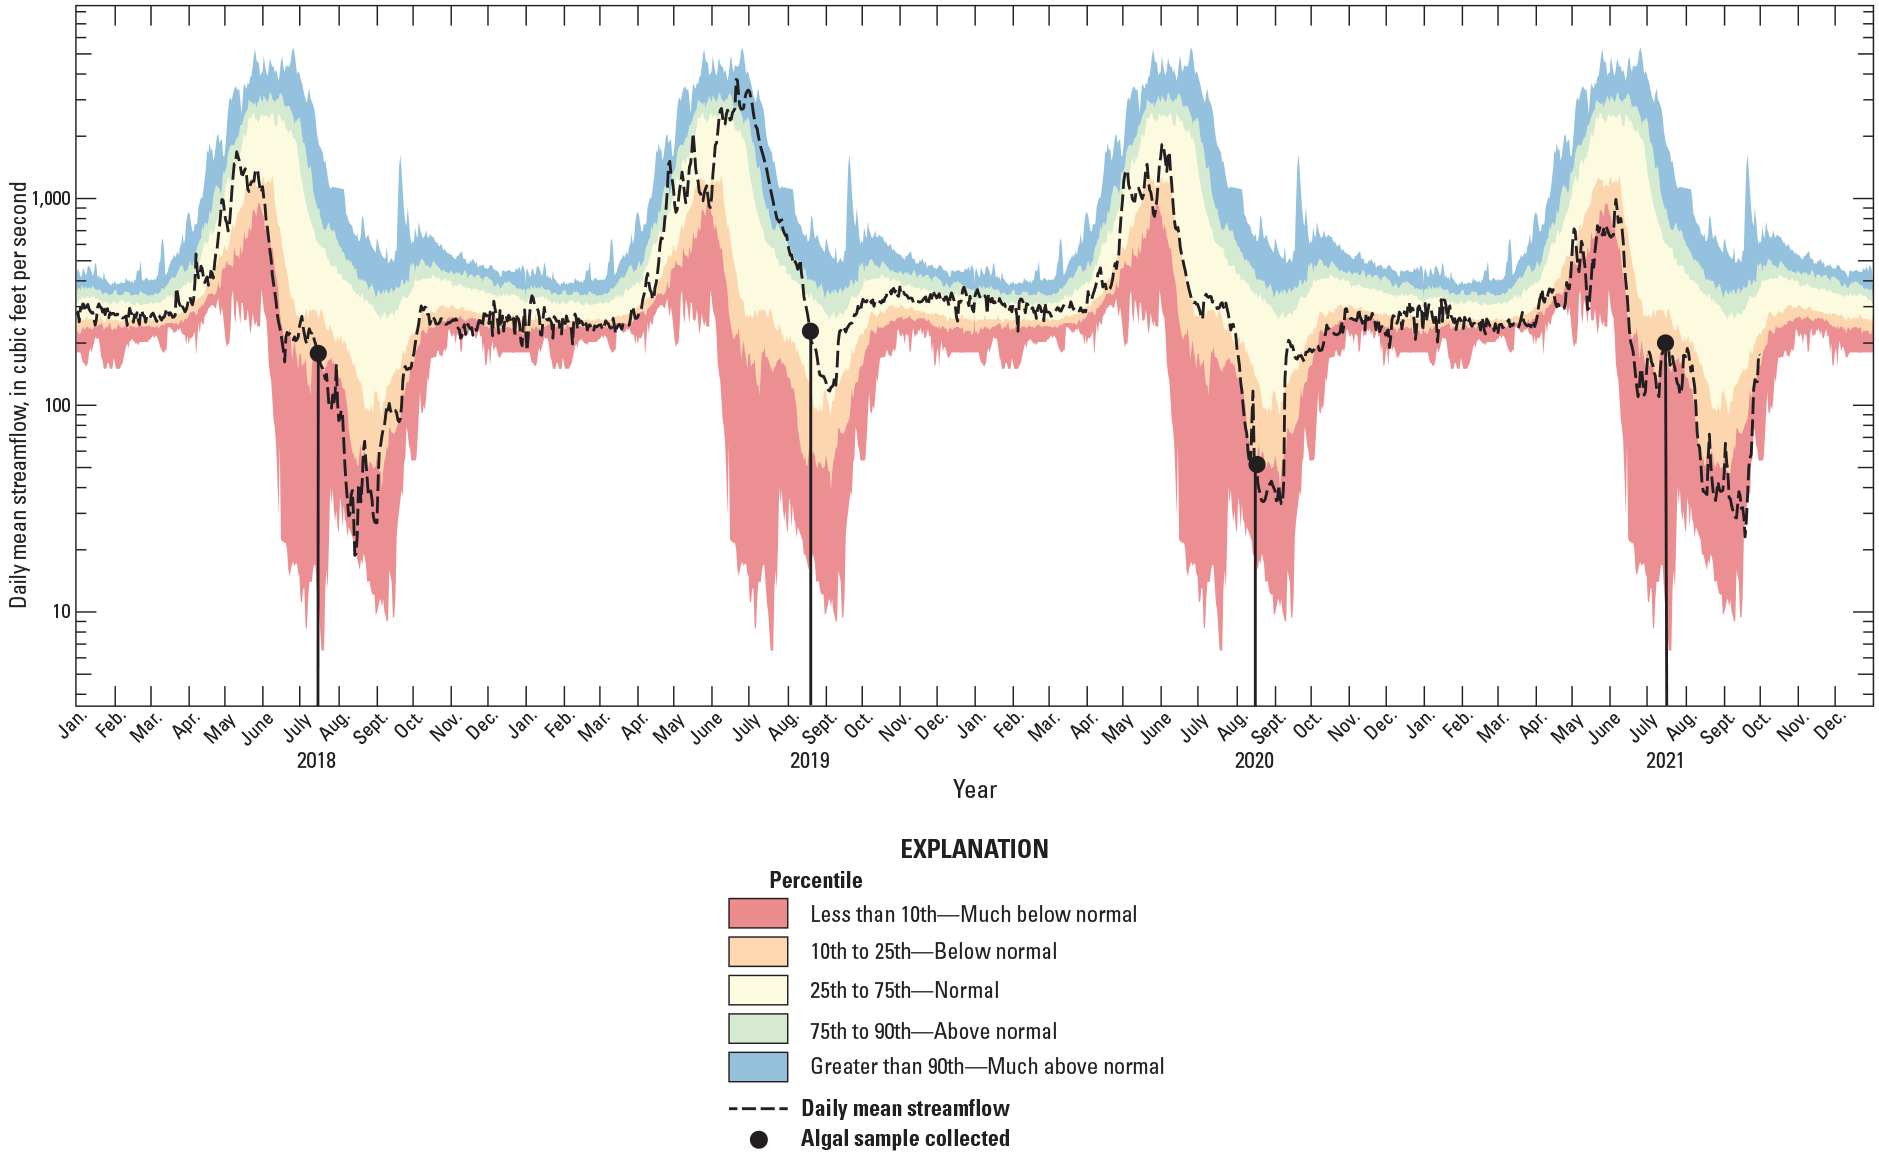
Daily mean streamflow for 2018–21 and daily streamflow percentiles for 1961–2021 at White River above Coal Creek near Meeker, Colorado (U.S. Geological Survey, 2021a).
Water Temperature
Water temperature is an important factor that can control the development of algal biomass because it regulates algal nutrient uptake and growth rate (Munn and others, 1989; Bowman and others, 2007). In general, growth rates increase in the temperature range from 13 to 20 degrees Celsius (°C), with lowered growth rates and stress observed in the range from 25 to 30 °C, and strongly negative growth rates at temperatures greater than 30 °C (Whitton, 1970; Wong and others, 1978; Graham and others, 1982; Lester and others, 1988; Dodds, 1991).
The water temperature record at White River above Coal Creek (site no. 18, fig. 1) is relatively short and discontinuous, from 1978 to 1984 and 2007 to 2022, limiting investigation of water temperature trends over time but allowing the comparison of stream temperature among study years. Water temperatures from May through October at White River above Coal Creek were compared across study years (2018–21) and were compared to a temperature threshold of 13 °C, below which Cladophora growth is very slow. Monthly mean stream temperature data collected by CPW during June, July, and August 2020 (Hodge and Eyre, 2021) are summarized and compared across 20 sites to a temperature threshold of 13 °C to facilitate investigation of site-specific factors promoting algal blooms.
Water Temperature at White River Above Coal Creek Near Meeker, Colorado
Differences in water temperatures among the study years mirrored differences in streamflow. Daily mean water temperatures in May were relatively similar between WYs. In 2019, water temperatures remained low through June, reflecting the extended duration of snowmelt runoff (fig. 3). Water temperatures reached and stayed above the temperature threshold favorable to Cladophora growth (13 °C) in early to mid-June in 2018, 2020, and 2021, whereas temperatures remained below the threshold until July 7 in 2019. During all years, temperatures remained above the temperature threshold until early to mid-September. Data are missing from mid-July to mid-August 2021 due to fouling of the temperature sensor, though the temperature records of a site nearby, Yampa River near Maybell, Colo. (USGS site number 09251000), do not show a substantial change in temperatures during this time period (USGS, 2021a).
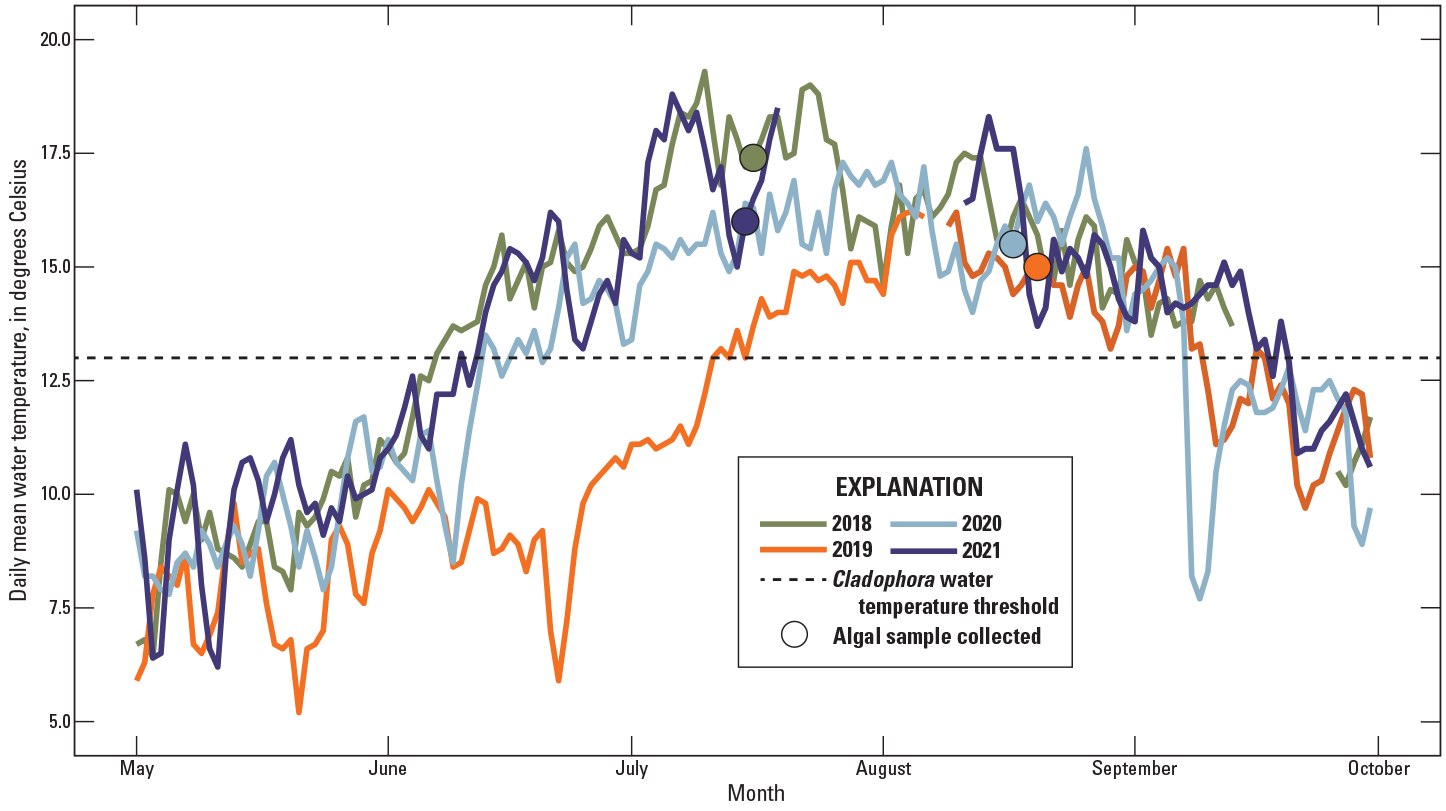
Daily mean water temperature at White River above Coal Creek near Meeker, Colorado, 2018–21 (U.S. Geological Survey, 2021a).
Water Temperature at 20 Sites
In 2019 and 2020, mean August water temperature generally increased as elevations decreased (fig. 3), except at North Fork White River below Mirror Creek and North Fork White River below Marvine Creek, where temperatures were cooler than at the site upstream (fig. 4A; Hodge and Eyre, 2021). On the two main tributaries to the main stem White River, mean August temperatures were above the temperature threshold favorable to Cladophora growth (13 °C) in 2020 starting at North Fork White River at Rio Blanco County Road 14 and South Fork White River near Buford and continued to the lower main stem sites for both years (fig. 4A). Mean August temperature at about 9,000 ft elevation was also above the temperature threshold at North Fork White River below Trappers Lake, likely due to water warming in Trappers Lake before exiting the spillway. August water temperatures were warmer in 2020 at all sites except North Fork White River below Trappers Lake. Spatial and temporal patterns in water temperature are described in more detail in Hodge and Eyre (2021).
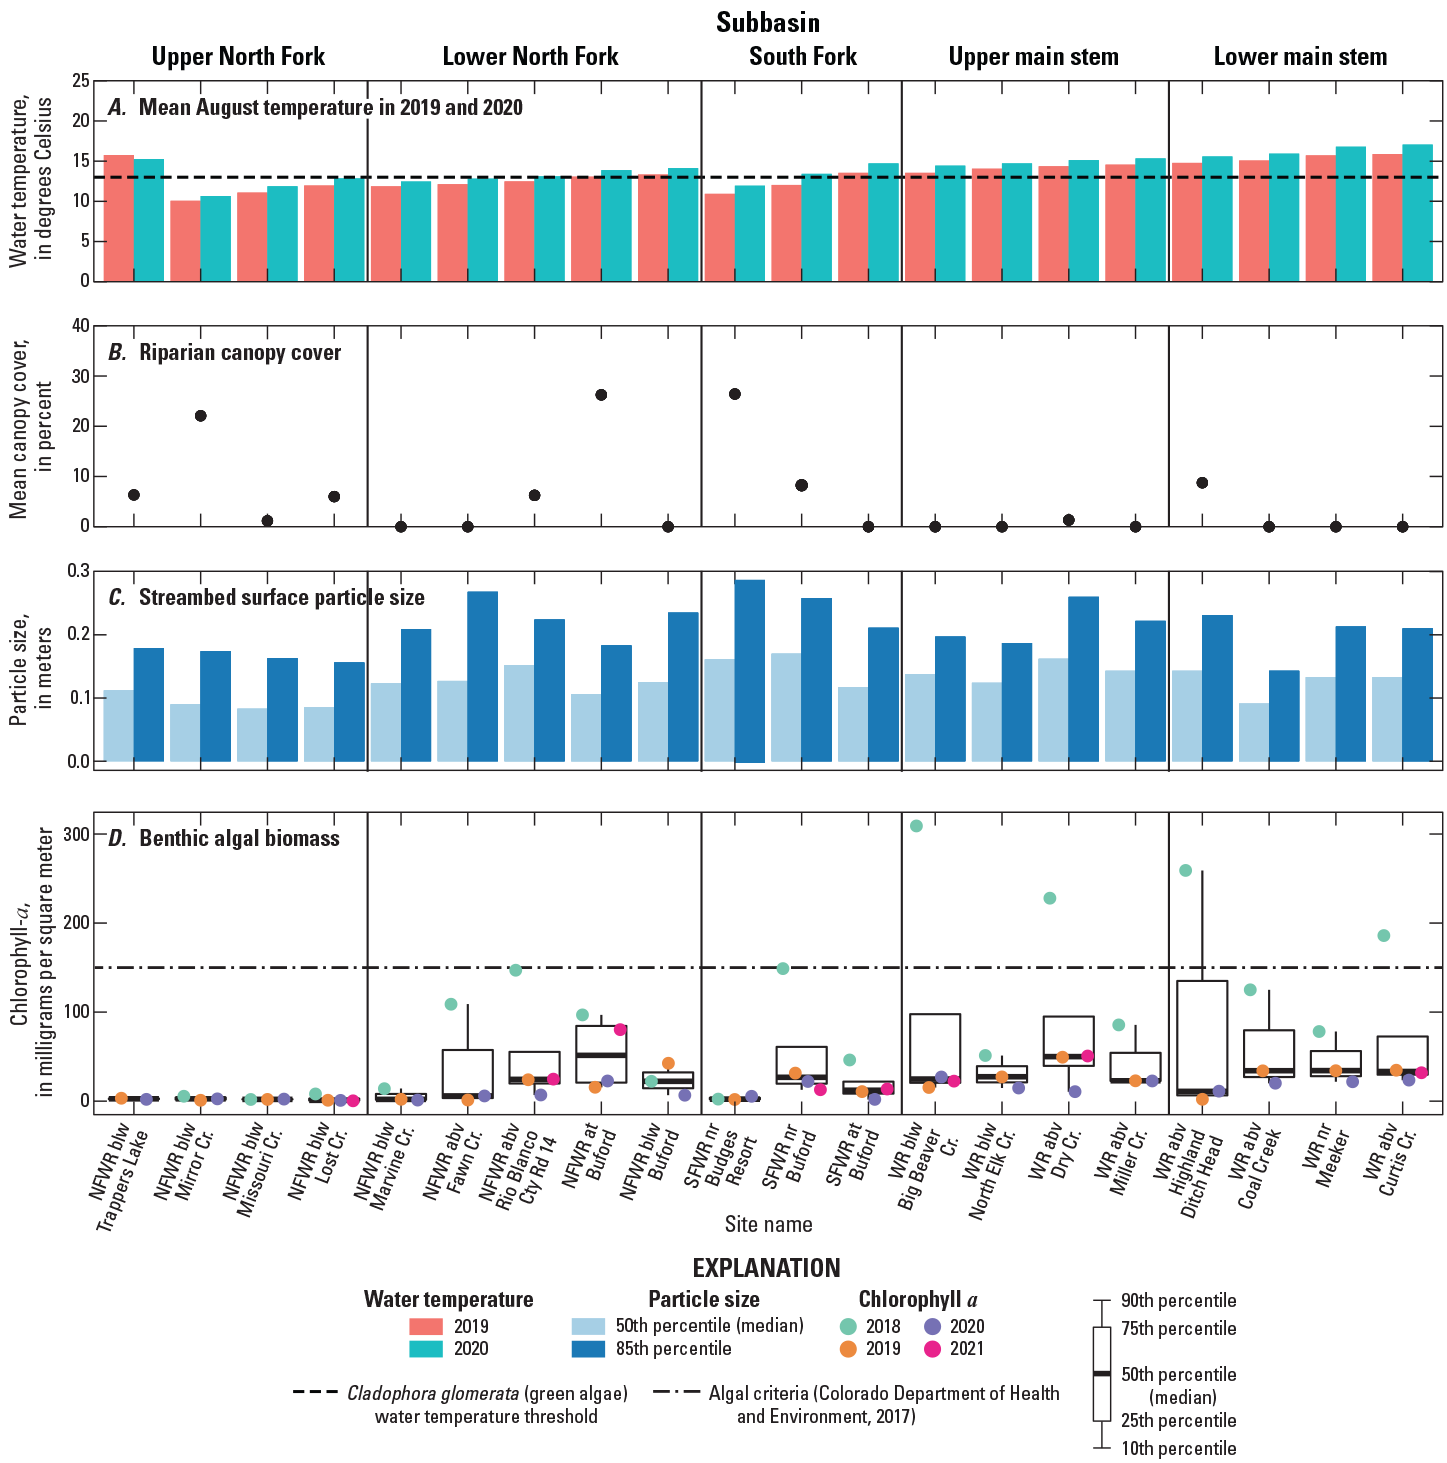
Graph showing A, mean August water temperature in 2019 and 2020 (data from Hodge and Eyre, 2021); B, mean riparian canopy cover; C, streambed surface particle size (data from Day and others, 2023); and D, chlorophyll a (benthic algal biomass) (data from U.S. Geological Survey, 2021a) at 20 sites in 5 subbasins (see table 1) of the upper White River Basin, Colorado. Site names are abbreviated USGS site names from table 1. CDPHE, Colorado Department of Public Health and Environment; NFWR, North Fork White River; SFWR, South Fork White River; WR, White River; blw, below; abv, above; nr, near; Cr, creek; Cty Rd, county road.
Riparian Canopy Cover
Light reaching the stream channel is limited by riparian canopy cover, and lower levels of light can limit primary production of benthic algae (Lowe and others, 1986; Mosisch, 2001). When riparian canopy cover is limited, stream algae are exposed to more light, typically resulting in increased primary production potential. In addition to increasing algal biomass, increased light can also change the composition of algal assemblages by promoting the growth of filamentous green algae (Steinman and others, 1989; Mosisch, 2001). Mean canopy cover was relatively low across sites, ranging from 0 to 26 percent (fig. 4B). North Fork White River below Mirror Creek, North Fork White River at Buford, and South Fork White River near Budges Resort had the highest mean canopy covers of 22, 26, and 26 percent, respectively. All sites on the main stem White River had <2 percent cover except White River above Highland Ditch Head, which had 9 percent cover.
Streambed Particle Size and Streambed Movement Estimates
The annual spring snowmelt pulse can temporarily reduce benthic algal production and abundance directly or indirectly through scour and, in years with streamflows of sufficient magnitude, streambed movement (Power and Stewart, 1987; Biggs, 1996). Variation in particle sizes may affect algae distribution within the basin, as streambed movement is dependent on streambed particle size and the hydraulic characteristics at each site. Streambed surface particle sizes varied across sites in the upper White River Basin and did not appear to correlate strongly with longitudinal position in the basin (fig. 4C). The D50 and D84 often increased and subsequently decreased between the sites, exhibiting modest variability.
Critical shear stress, or the estimated amount of shear stress required to move a given particle size was estimated for the D50 and D84 at 20 sites, based on streambed particle-size distribution (table 3; fig. 5, grey bar). Where possible, boundary shear stress, or the stress of hydrodynamic forces acting on the streambed, was estimated during spring snowmelt (table 3; fig. 5, orange and black dots). When boundary shear stress exceeded critical shear stress in cross-section calculations, streambed movement of either the D50 or D84 was expected to have occurred (table 3; fig. 5, orange dots). Movement of smaller particle size classes (<D50) was not assessed in this study, though the influence of less intense hydrologic events on algal biomass, including rain events during the summer, is discussed in the “Potential Controls in Algal Biomass Among Years” section of this report. During years with low snowpack, snowmelt streamflow velocities did not exceed the critical shear stress required to move the average streambed particle. Boundary shear stress was sufficient to mobilize the D50 at zero sites in 2018, seven sites in 2019, and two sites in 2020. Boundary shear stress was sufficient to mobilize the D84 at zero sites in 2018, five sites in 2019, and one site in 2020 (table 3; fig. 5). Movement of the D84 can indicate that substantial sediment transport and bed disturbance occurred. It is unlikely that streambed movement occurred at sites in the upper North Fork subbasin (table 3). The movement indicated at a site is based on the geometry measured at one cross-section location and the hydraulics represented by high-water marks recovered in the reach. Boundary shear stress determination is strongly influenced by stream slope, which is obtained by high-water marks surveyed in the field. Variability in the quality and spatial distribution of the recovered high-water marks results in a wide variation in boundary shear stress determinations from site to site and year to year.
Table 3.
Shear stress at 20 U.S. Geological Survey water-quality and streamgage sites in the upper White River Basin, Colorado, 2018–20.[Site numbers are shown on figure 1. Data available at (U.S. Geological Survey, 2021a). no., number; USGS, U.S. Geological Survey; D50, 50th percentile particle size; D84, 84th percentile particle size; CO, Colorado; shaded, boundary shear stress was greater than critical shear stress and movement of the D50 likely occurred; --, not available]
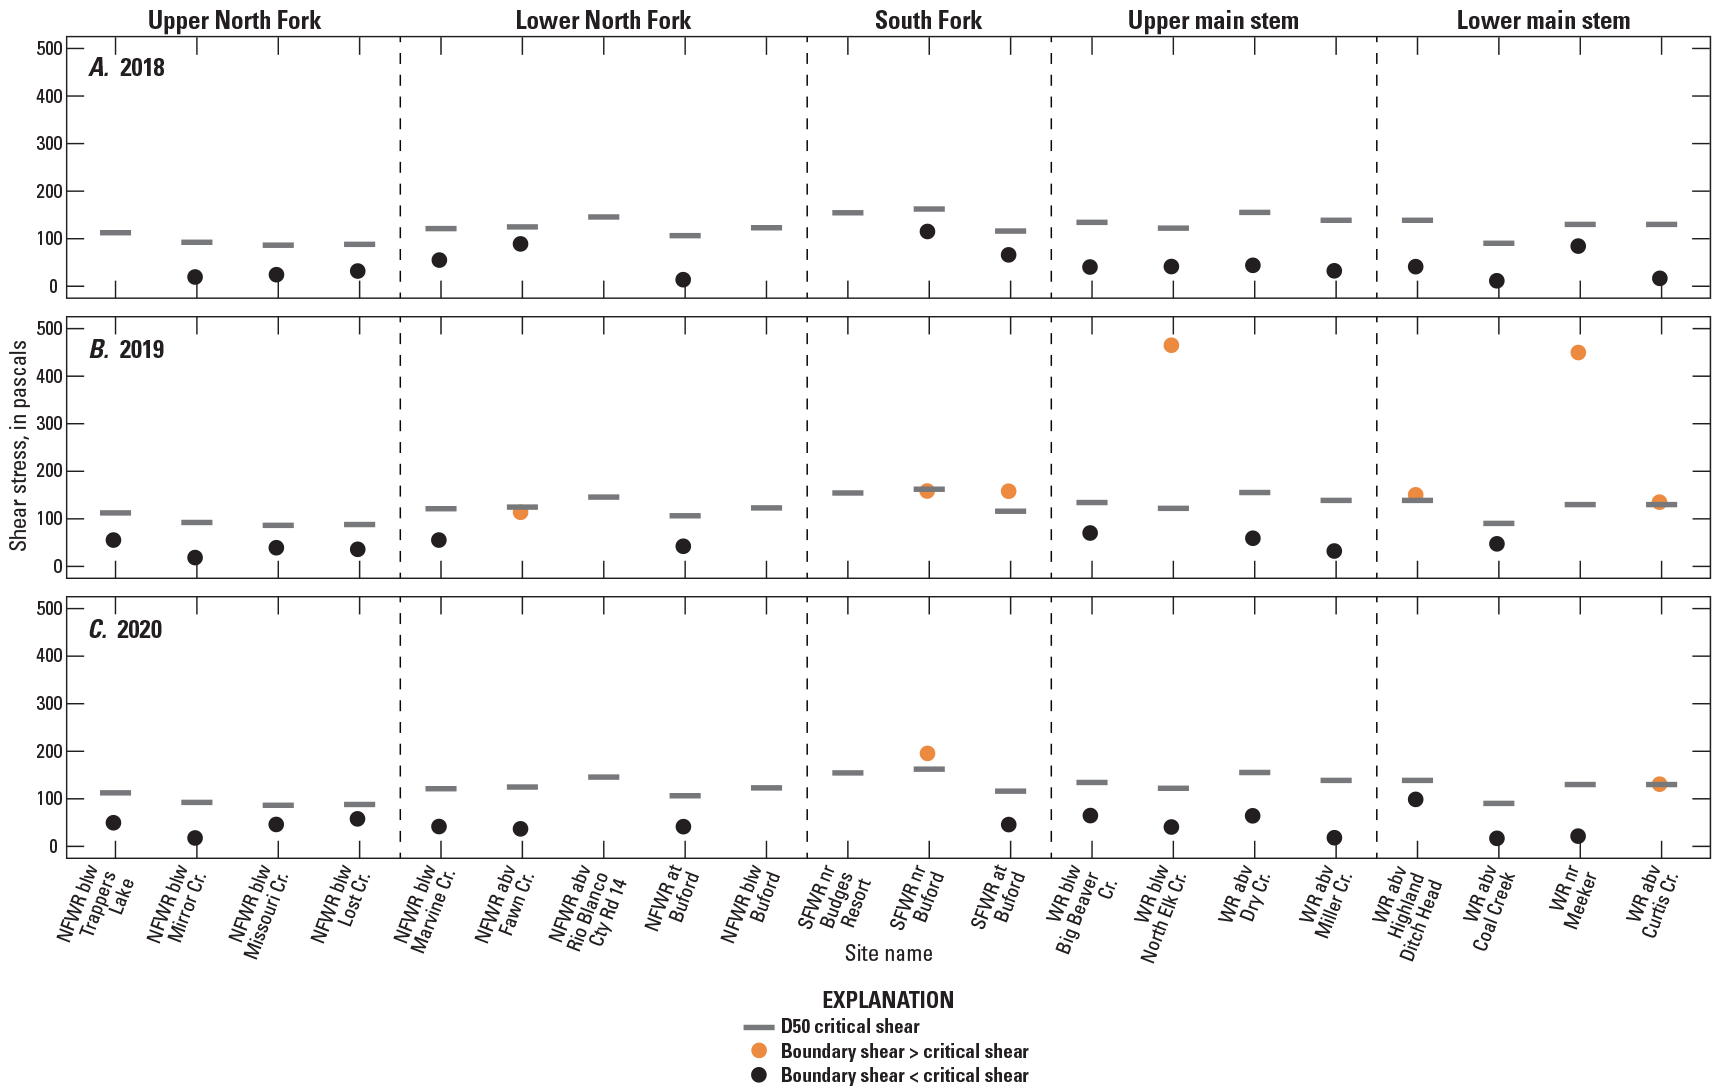
Shear stress at 20 U.S. Geological Survey water-quality and streamgage sites in 5 subbasins (see table 1) of the upper White River Basin, Colorado (U.S. Geological Survey, 2021a), during peak snowmelt runoff in spring A, 2018, B, 2019, and C, 2020. D50, 50th percentile particle size; NFWR, North Fork White River; SFWR, South Fork White River; WR, White River; blw, below; abv, above; nr, near; Cr, creek; Cty Rd, county road; <, less than; >, greater than.
Benthic Algal Conditions in the Upper White River Basin
Benthic algal samples were collected one time each summer, either in July or August, at 20 study sites during 2018–20 and at 9 sites in 2021. The sampling targeted peak algal conditions and was determined by regular site visits and site photographs from volunteers in the basin. Community abundance and composition were assessed at all 20 sites in 2020 and at 5 sites in 2021. Algal biomass (chlorophyll a) was measured at all 20 sites during 2018–20 and at 9 sites in 2021. Algal samples were not collected at North Fork White River below Trappers Lake in 2018 because the site was not established at the time of sampling. Benthic algal blooms at two sites and a subset of benthic algae taxa are shown in figure 6.

Photographs showing A, benthic algal biomass at North Fork White River at Buford, Colorado, in summer of 2018; B, benthic algal biomass at White River above Curtis Creek near Meeker, Colorado, in 2018; and C–G, examples of benthic algae collected in the upper White River Basin. Photographs taken by Natalie Day, USGS.
Benthic Algal Community Composition and Abundance
Algal communities are commonly described using the abundance of algae in a sample and expressed as number of cells per volume of water, while the biovolume of algae is expressed as volume of cells per volume of water. Biovolume is essentially a measure of how much space algae are taking up in a sample and is used as an estimate of biomass. Thus, relatively small taxa like cyanobacteria may have smaller biovolume but greater abundance when compared to large filamentous green algae. Both abundance and biovolume enable discussion of overall community composition, dominant taxa among sites, and potential species of concern. Community composition was assessed at 20 sites in 2020 and at 5 sites in 2021.
From samples collected in 2020 and 2021, 49 genera of algae were identified (Day and others, 2023). The taxon groups Bacillariophyta (diatoms), Chlorophyta (green algae), Cyanobacteria (blue-green algae), and Cryptophyta and Chrysophyta (golden-brown algae) represented 59, 20, 16, and 5 percent of taxa identified, respectively. About 80 percent of genera identified were rare, contributing less than 1 percent to either total algal abundance or biovolume. Twenty-four genera contributed 10 percent or more to total abundance or biovolume.
In 2020, green algae represented more than 50 percent of algal biovolume at 14 of 20 sites, reflective of the large size of green algae (fig. 7A). Diatoms represented more than 50 percent of algal abundance at 17 out of 20 sites and comprised the majority of biovolume at sites with low biovolume of green algae (fig. 7B). Cyanobacterial biovolume was low, less than 5 percent across sites, but abundance was greater than 25 percent at six sites, with greater abundances more common at sites on the main stem White River. In 2021, the relative biovolume of green algae decreased and diatom biovolume increased at four out of the five sites compared to 2020 (fig. 7C). The relative abundance of cyanobacteria was greater in 2021 than in 2020 across the five sites (fig. 7D).
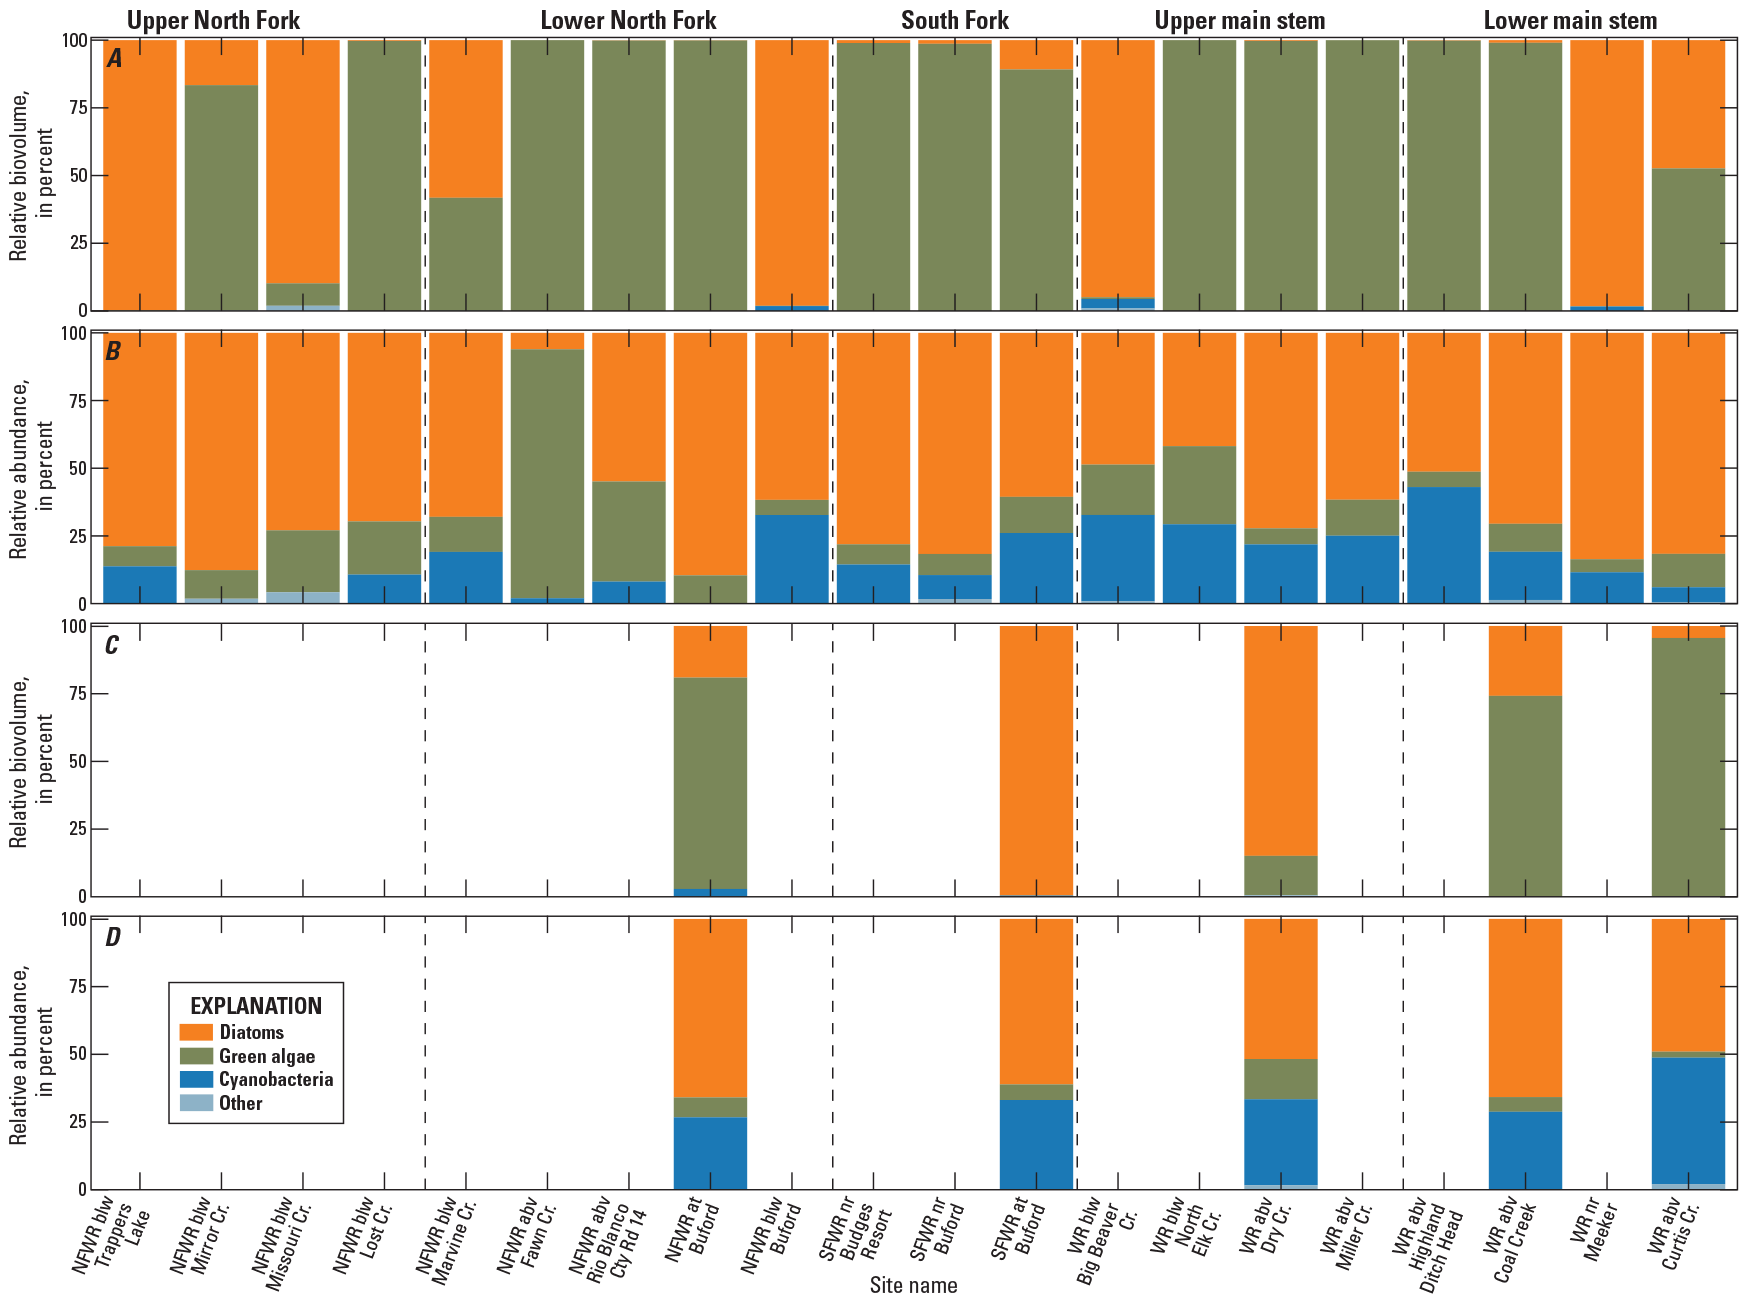
Graphs showing percentages of A, relative biovolume and B, relative abundance of algae genera during 2020 at 20 sites and C, relative biovolume and D, relative abundance of algae genera during 2021 at 5 sites in five subbasins (see table 1) of the upper White River Basin, Colorado (Day and others, 2023). “Other” includes Cryptophyta and Chrysophyta taxons. NFWR, North Fork White River; SFWR, South Fork White River; WR, White River; blw, below; abv, above; nr, near; Cr, creek; Cty Rd, county road.
Green algae and cyanobacteria are likely to dominate when temperatures are warm and when streamflows are at seasonal lows (Stevenson and Rollins, 2017). Four genera of filamentous green algae were identified in the upper White River Basin, including Cladophora, Stigeoclonium, Ulothrix, and Spirogyra (fig. 8A, B). In 2020, filamentous green algae occurred at 14 sites and in all subbasins. The most commonly occurring filamentous green algae in 2020 were Ulothrix and Cladophora, which occurred at seven and six sites, respectively, and seven sites had more than one genus of filamentous green algae identified (fig. 8A). In 2021, filamentous green algae occurred at four of the five sites, with Cladophora and Spirogyra composing the majority of green algal biovolume across sites (fig. 8B). Spirogyra replaced Cladophora at White River above Dry Creek in 2021.
Cyanobacterial blooms frequently occur in eutrophic (nutrient rich, high productivity) lakes and reservoirs but may also occur in oligotrophic (nutrient poor, low productivity) systems (Graham and others, 2008). Cyanobacterial genera identified in the upper White River Basin include Planktothrix, Eucapsis, Dolichospermum, Pseudanabaena, Calothrix, Cuspidothrix, Lyngbya, and Planktolyngbya. Eucapsis was the most common, found at 15 sites in 2020 and 4 sites in 2021, and usually had the greatest relative abundance when present (fig. 8C, D). Planktothrix, Pseudanabaena, and Lyngbya are filamentous cyanobacteria genera that contain toxin-, taste-, and odor-producing strains (Graham and others, 2008). In 2020, Planktothrix was found at North Fork White River at Rio Blanco County Road 14, South Fork White River near Buford, and White River below Big Beaver Creek; Pseudanabaena was found at South Fork White River near Budges Resort. Planktothrix was found at White River above Curtis Creek in 2021. Identification of strains capable of producing these compounds does not necessarily guarantee that toxin production was occurring during the time of sampling. The mat-forming Lyngbya genera was found in 2021 at South Fork White River at Buford and North Fork White River at Buford.
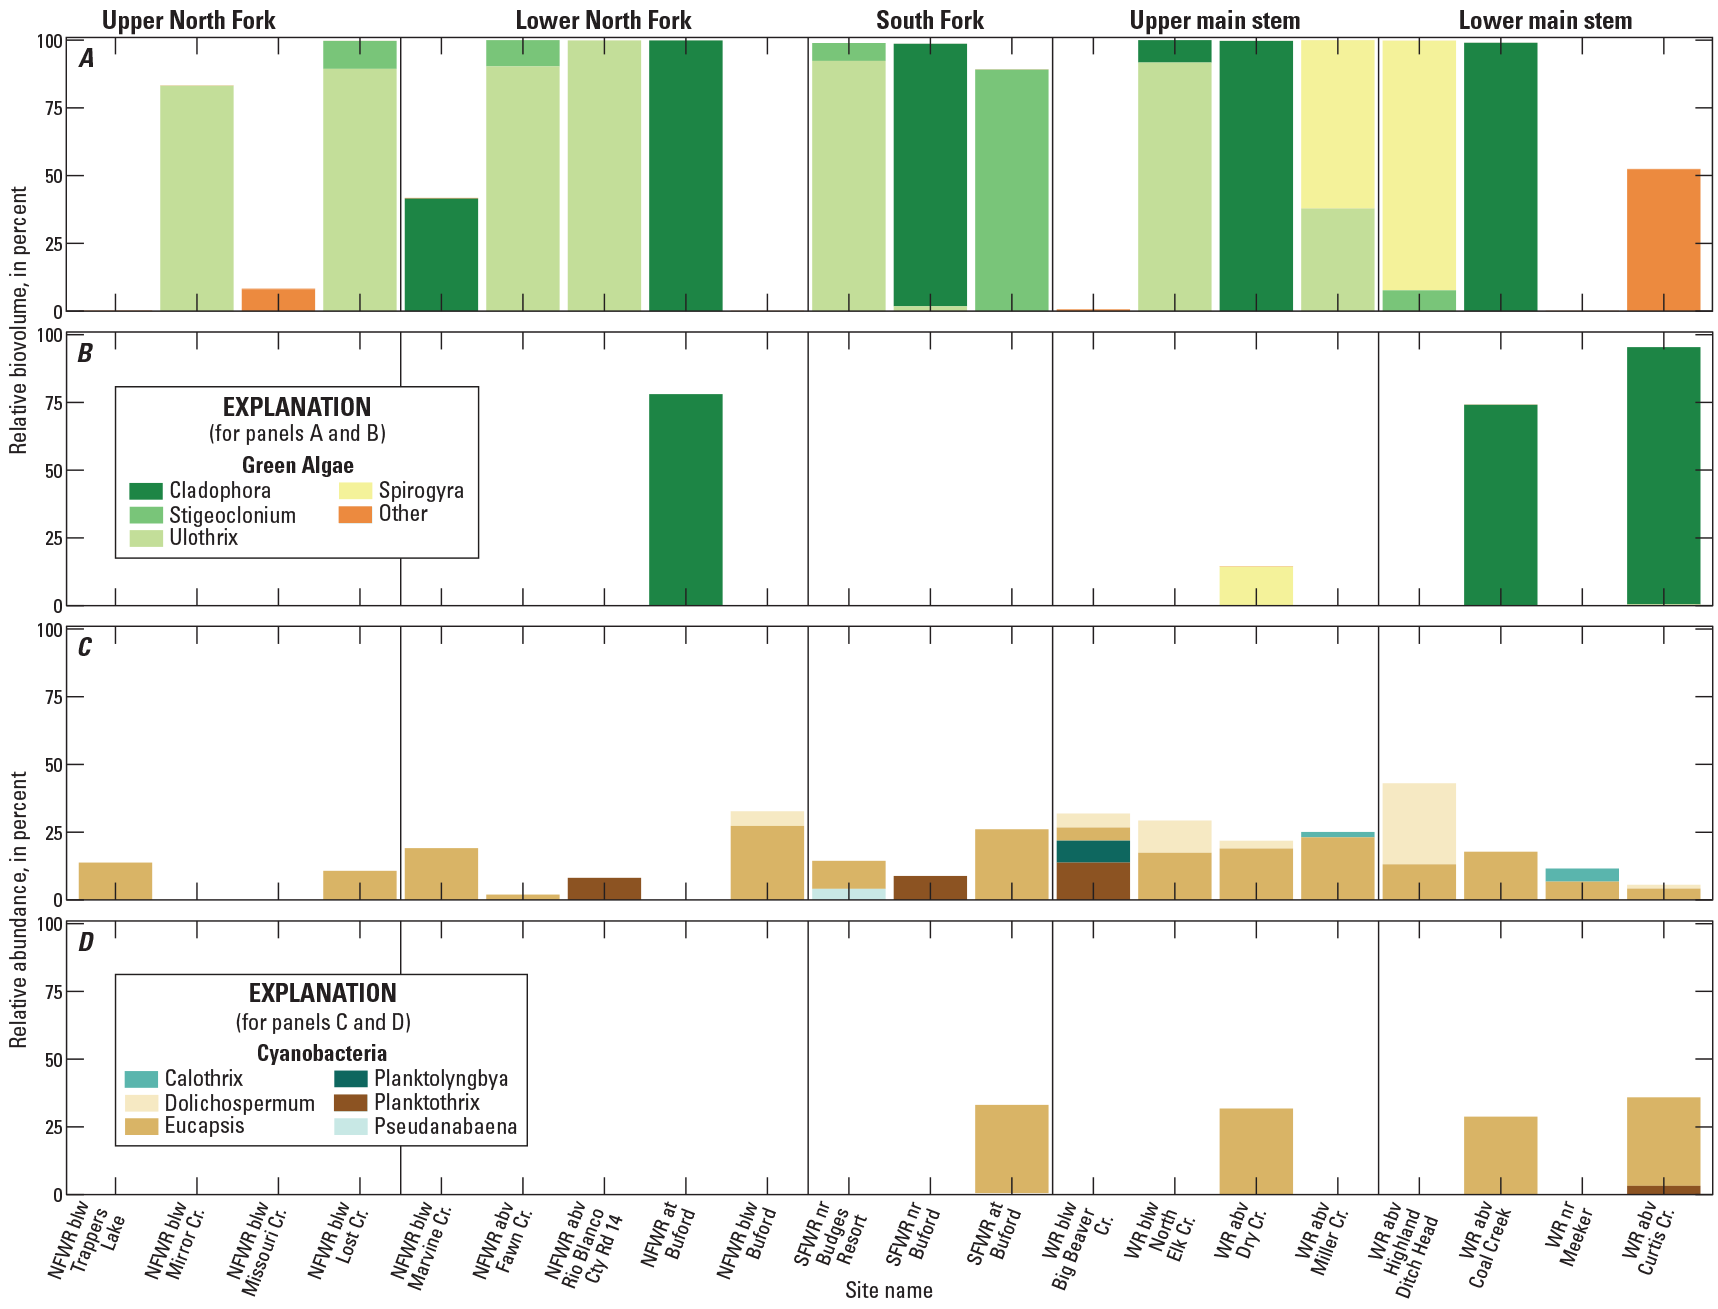
Graphs showing percentages of relative biovolume of green algae genera in A, 2020 and B, 2021 and relative abundance of cyanobacteria genera in C, 2020 and D, 2021 (Day and others, 2023). “Other” in panels A and B includes nonfilamentous green algae Chlorella, Closterium, Dictyosphaerium, Monoraphidium, Scenedesmus, and Tetrastrum. NFWR, North Fork White River; SFWR, South Fork White River; WR, White River; blw, below; abv, above; nr, near; Cr, creek; Cty Rd, county road.
Diatom composition and abundance data are not presented in detail in this report, but the complete dataset is available in a USGS data release (Day and others, 2023). The diatom Didymosphenia geminata, commonly referred to as didymo or “rock snot,” was found at South Fork White River at Buford and White River above Dry Creek in 2020 and 2021. D. geminata is an invasive, bloom-forming species that can affect the diversity, abundance, and productivity of other aquatic organisms (Kumar and others, 2009). Unlike other periphyton growth, which is typically stimulated by the enrichment of nutrients, D. geminata are generally found in oligotrophic streams and rivers.
Benthic Algal Biomass Comparison to Aquatic Standards
Biomass concentrations are compared across sites and years and are also compared to CDPHE interim water-quality criteria for chlorophyll a (figs. 4D, 9) (CDPHE, 2017). Benthic algal biomass ranged from 0.7 to 309 mg/m2 during the summers of 2018 through 2021 and exceeded the CDPHE criteria of 150 mg/m2 on four occasions, all during 2018 (figs. 4D, 9). The highest median algal biomass concentrations at North Fork White River at Buford and White River above Dry Creek were 51 and 50 mg/m2, respectively (fig. 4D). White River above Coal Creek, White River near Meeker, and White River above Curtis Creek are the three most downstream sites in the basin and had median biomass concentrations around 34 mg/m2. Algal biomass concentrations in the South Fork subbasin were consistently highest at South Fork White River near Buford across the sampling period (fig. 4D). Algal biomass was consistently low across the sampling period at six sites in the upper White River Basin, including all sites in the upper North Fork subbasin, North Fork White River below Marvine Creek, and South Fork White River near Budges Resort (fig. 4D).
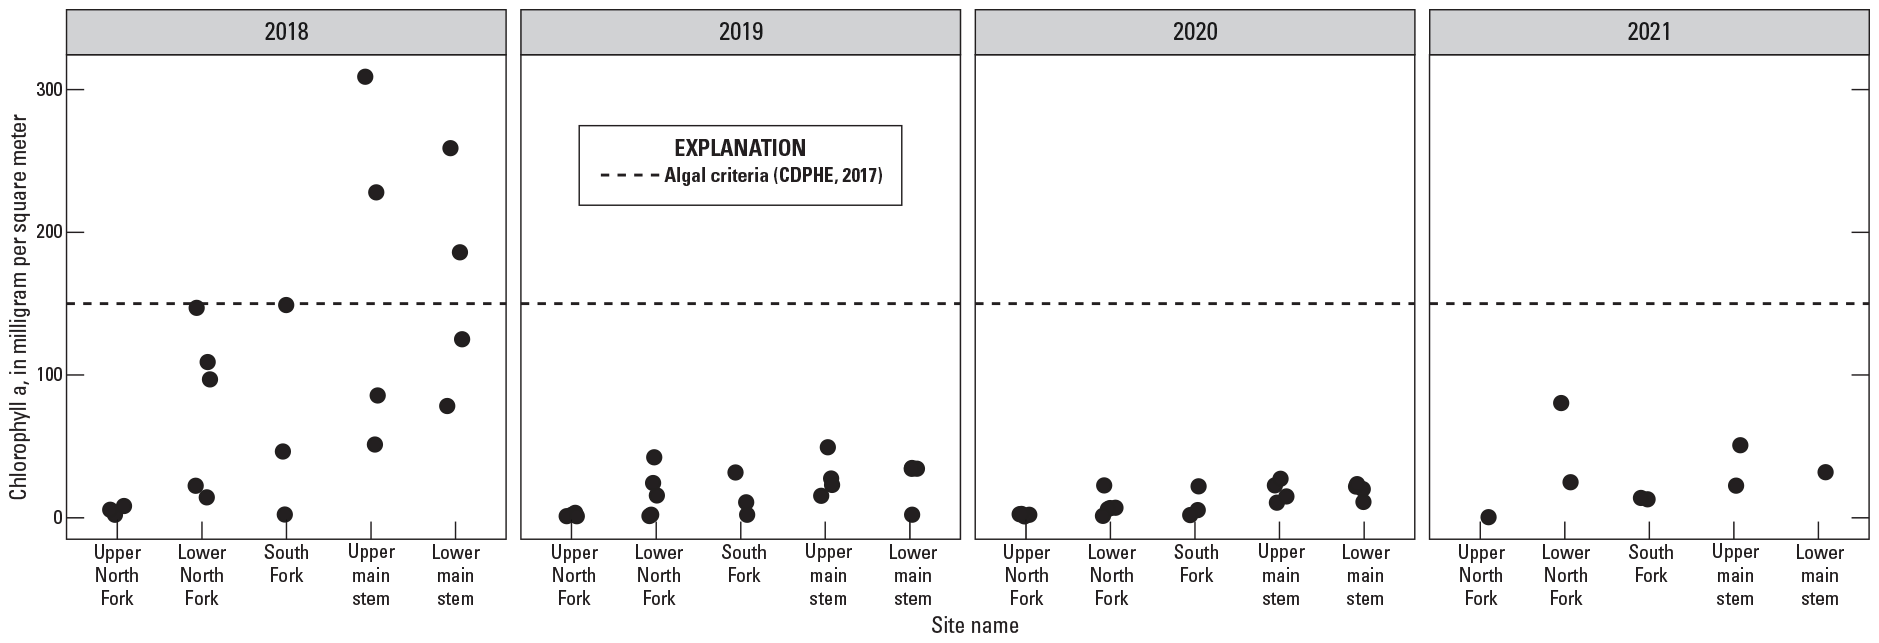
Benthic algal biomass, measured in chlorophyll a, in five subbasins (see table 1) in the upper White River Basin, Colorado, during summers of 2018–21 (U.S. Geological Survey, 2021a). CDPHE, Colorado Department of Public Health and Environment.
Algal biomass was substantially higher in 2018 than in other study years in most subbasins except the upper North Fork, where concentrations were consistently low (figs. 4D, 9). An important limitation associated with targeting one point in time (for example, peak algal conditions) across a large spatial scale is that the timing of peak conditions can vary among sites. For example, at some sites algae may be at peak biomass, while algae at other sites have begun to senesce or die off. Attempts to minimize this error were implemented through sampling all sites as quickly as possible once sampling started. Additionally, this study assessed the effect of boundary shear stress during peak streamflow on algal biomass, though small rain events or other hydrologic disturbances that occur after peak runoff (but prior to sampling) can also reduce algal biomass. Because of these limitations, local volunteers and USGS personnel monitored algal occurrence at established locations using repeat photography and observations to confirm general findings of algal occurrence in the basin. In 2020, a rain event occurred prior to algal sampling, which doubled the streamflow at White River above Coal Creek (fig. 2). It is possible the increase in streamflow velocity or turbidity associated with the rain event decreased algal biomass, though observations from volunteers and USGS personnel support the overall findings of low algal biomass in 2020. In 2021, streamflows following snowmelt runoff exhibited greater variation than in other study years in response to summer rain events, with three flow disturbances occurring during this time (fig. 2). It is possible that these streamflow fluctuations could have detached larger algal filaments or increased turbidity, leading to overall decreases in biomass accrual or growth rates at some sites. Despite relatively low algal biomass values in 2021, observations by volunteers and USGS personnel suggested that the 2021 algal biomass values were likely an underestimate compared to actual conditions.
Potential Factors Controlling Benthic Algae
A linear mixed-effects model was used to evaluate the relative influence of nutrient, hydrologic, and physical habitat conditions on algal biomass across study sites in 2019–20. Streamflow characteristics and water temperature at White River above Coal Creek provide insight into potential causes of annual variation in algal biomass across a longer period, 2016–21.
Potential Controls in Algal Biomass Among Sites
A linear mixed-effects model was created to investigate hypotheses (see “Purpose and Scope”) about how measured variables may explain variation in algal biomass across sites. Assessing the influence of temperature and nutrient concentrations was a main objective of the study and these factors were hypothesized to increase algal biomass. As a result, the modeling assessment was limited to data collected during 2019–20 when temperature and nutrient data were available, though findings from the model are used to discuss algal occurrence across all years.
Hypothesis 1—Streamflow-induced movement of the streambed during snowmelt runoff may change conditions that limit algal biomass
Inconsistent patterns between streambed movement and algal biomass occurred across sites and years. For example, North Fork White River at Buford and White River above Dry Creek had the highest median algal biomass across all sites (fig. 4D), but streambed movement during the study period was unlikely (fig. 5). Conversely, South Fork White River near Buford, the site with greatest median algal biomass on the South Fork, likely had streambed movement in 2019 and 2020. For benthic algal assemblages, increases as well as decreases in biomass have been observed after large floods (Power and others, 2008; Schneider, 2015). Differences in response are likely influenced by additional factors including the life stages of other organisms in the system like grazing invertebrates and fish or the availability of other resources like nutrients, temperature, and light. For example, Power and others (2008) observed that blooms of filamentous green algae in the Eel River in California were larger following streambed-moving floods through the removal of algae-grazing invertebrates by flood scour. The absence of streambed-moving events left grazer populations intact, and grazing suppressed filamentous green algae biomass accrual. Exploring the direct effects of streambed movement on invertebrate and fish populations was beyond the scope of this project, though site-specific relations between these types of variables may help explain the lack of a clear relation between streambed movement and algal biomass. Movement of smaller (<D50) particle size classes during snowmelt runoff or hydrologic events of smaller magnitude, such as summer rain events, may also contribute to variation in algal biomass across sites, but this was beyond the scope of this project’s sampling targets. Although site-specific measures of streambed movement did not perfectly relate to differences in algal biomass across sites, the overarching effect of widespread streambed movement is used in this report to discuss basin scale variation in algal biomass across years.
Hypothesis 2—Physical and chemical characteristics associated with streambed particle size, water temperature, light availability, and nutrient availability will promote algal biomass
The linear mixed-effects model form used to test hypothesis 2 is shown in equation 1:
wherelog
is the common (base 10) logarithm;
algal biomass
is the chlorophyll a concentration from 2019–20, in milligrams per liter;
D50
is the median particle size, in millimeters;
mean August water temperature
is the mean August water temperature from 2019–20, in degrees Celsius;
N:P
is the molar ratio of total nitrogen to total phosphorus in the water from 2019–20;
mean canopy cover
is the mean canopy cover, in percent; and
1|site
is the site number as a random-effect variable.
The fixed effects, model statistics, and diagnostics associated with the model are shown in table 4. As described throughout this report, algal biomass can be influenced by multiple and often interacting chemical, physical, and hydrologic variables. Variables (or fixed effects) included in the model are commonly associated with benthic algal biomass in the literature and were measured during this study, allowing for the evaluation of the relative importance of these variables in the upper White River Basin. The goal of this modeling effort is not to produce the best model in terms of an Akaike information criterion (AIC) value or other statistics commonly used for model comparison; instead, the valuable takeaway from this effort is the relative effect size (or estimate) of each fixed effect and the positive or negative direction of the effect.
Table 4.
Fixed effects, model statistics, and diagnostics from an analysis of variance used to explain algal biomass across sites in 2019–20.[D50, median particle size; std. error, standard error; sum sq., sum of squares; denDF, denominator degrees of freedom; F-value, result of F-test; p-value, significance test; --, not applicable]
Water temperature had the largest significant (p-value <0.05) effect size on algal biomass (table 4) and explained much of the difference in algal biomass across sites, a finding supported by other studies exploring algal biomass across elevational gradients (Lewis and McCutchan, 2010). The effect of water temperature is apparent in figure 4A, where all sites with mean August water temperatures below the optimal temperature range for Cladophora (dashed line) have consistently low algal biomass (fig. 4D). The increasing pattern in temperature downstream corresponds with an increase in algal biomass.
Median streambed particle size (D50) had significant positive effects on algal biomass (table 4), meaning that larger D50 values corresponded to greater algal biomass. Larger particle sizes provide more stable areas for algae to establish and can increase algal settlement rates by slowing the velocity of the oncoming water, whereas faster moving water has been shown to slow early development and accumulation (Burkholder, 1996). Larger D50 values can also reduce flushing of fine sediments, a potential source of additional nutrients available to benthic algae.
N:P ratios had a significant negative effect on algal biomass, meaning that more nitrogen-limiting conditions, or greater phosphorus availability, corresponded to greater algal biomass (table 4). N:P ratios indicate the relative availability of the two primary nutrients that algae require for growth. For benthic algae, nitrogen limitation is indicated at N:P ratios <13, and phosphorus limitation is indicated when N:P ratios are greater than 22 (Hillebrand and Sommer, 1999). Identifying causal relations between nutrients in the water column and algal biomass is complicated, as benthic algae can also access other nutrient sources including sediment or groundwater nutrients at the sediment water interface (Tyler and others, 2003). Nutrients in the water column may be more important during the initial establishment phase rather than at peak biomass, resulting in timing offsets between nutrient concentrations and algal biomass that are not captured during sampling (Vadeboncoeur and others, 2021). Similarly, macroalgae have a large intracellular nutrient storage capacity, which can also allow for temporal offsets in nutrient availability and growth (Wong and Clark, 1976). Established mats of benthic algae can also persist because of internal nutrient recycling within the mat, even when water column or sediment nutrients are depleted (Mulholland and others, 1994). Regardless of these considerations, many studies demonstrate that nitrogen, phosphorus, or both commonly stimulate algal production in surface waters (Lewis and others, 2011). Furthermore, nutrient enrichment has been associated with the growth of filamentous taxa including Cladophora (Biggs and Price, 1987; Dodds, 1991). Site-scale differences in nutrient occurrence and limitation as well as long-term trends in nutrient limitation are discussed and displayed in more detail in Day (2023).
Mean canopy cover was not significant in the model (table 4), indicating either that light availability does not limit algae growth, that canopy cover did not capture variation in available light, or that other variables like temperature have stronger regulating effects on algal biomass. As discussed in the “Riparian Canopy Cover” section of this report, values were low across the basin, with only 3 out of 20 sites having greater than 10 percent canopy cover. Mean canopy cover can also affect water temperatures indirectly, with shaded reaches corresponding to increases in water temperature of a smaller magnitude.
Results of the linear mixed-effects model, which was limited to years with nonbloom conditions (2019–20), can inform patterns of biomass occurrence during bloom years when variation among sites was greater. A downstream increase in biomass was apparent in 2018 and to a lesser degree in 2019–21 (fig. 9), indicating that conditions favorable to algal biomass are more likely to occur in the lower portions of the basin. This observation aligns with the model results, where water temperatures are higher at downstream sites (fig. 4). The results of the model indicate that targeted sampling of algal biomass, factors controlling water temperature, and nutrient concentrations may help clarify which factors are most influential on algal biomass across the basin.
Potential Controls in Algal Biomass Across Years
Reports of algal biomass from 2016 and 2017 (May and Noble, 2017; Kelley, 2017; fig. 9) and streamflow and water temperature conditions from 2015 to 2017 are incorporated into this assessment to better identify causes of variation in algal biomass across years. Observations of benthic algal blooms in the upper White River Basin have been reported since 2012 (Hodge and Eyre, 2021), though biomass samples were not collected until 2016 by CPW. In July of 2016, algal biomass exceeded the CDPHE chlorophyll a standard (150 mg/m2) at five out of six sites sampled, including one site each on the North and South Fork White River (May and Noble, 2017). Elevated algal biomass was also reported by local land managers and volunteers in 2017 (Kelley, 2017). In 2018, as part of this study, bloom conditions or near bloom conditions were measured at multiple sites, including sites on the North and South Forks and main stem White River. No exceedances of the CDPHE chlorophyll a standard were measured in subsequent years through the summer of 2021, though greater algal biomass was observed in 2021 than what was measured during sampling (represented by green algal symbol in fig. 10). The broad spatial extent of bloom conditions in 2016–18 and lack of bloom conditions in 2019–20 indicates that the factors contributing to the occurrence of algal blooms likely operate at a basin scale.
Relatively large, late, and long-lasting peak streamflows, such as those measured in 2019 (fig. 10; table 5), may limit algal blooms during the WY in which they occur and into subsequent years, as evidenced by extremely low algal biomass during the summers of 2019 and 2020 (fig. 9). High streamflows during early spring and summer of 2019 resulted in water temperatures below those favorable to C. glomerata until mid-July (fig. 3) as well as movement of the D50 and D84 at many sites across the basin (fig. 5). In 2020 water temperatures were within the same range as those measured during the previous bloom years of 2016–18 (fig. 11; table 5), indicating that the effects of streambed movement during 2019 was likely a factor limiting algal biomass into 2020. The cause may include multiple processes. Large flood events can immediately reduce algal biomass by physically scouring algae off substrata and can delay recolonization if channel morphology and stability change (Power and Stewart, 1987). Flushing flows that redistribute finer sediments rich in nutrients or changing hyporheic flow paths may also be important. Thus, although streambed movement was not a perfect predictor of algal occurrence at a site scale, the widespread occurrence of streambed movement across the basin during 2019 is likely related to the observation of reduced algae in subsequent years.
Table 5.
Streamflow and water temperature statistics at White River above Coal Creek near Meeker, Colorado, 2015–21.[Streamflow and flow statistics are based on mean daily values for each site; streamflow data are available from the U.S. Geological Survey National Water Information System (U.S. Geological Survey, 2021a). Threshold date is the date when mean daily water temperatures exceeded the lower threshold of 13 degrees Celsius favorable to Cladophora glomerata(Dodds, 1991). °C, degrees Celsius; min, minimum; max, maximum; --, not applicable]
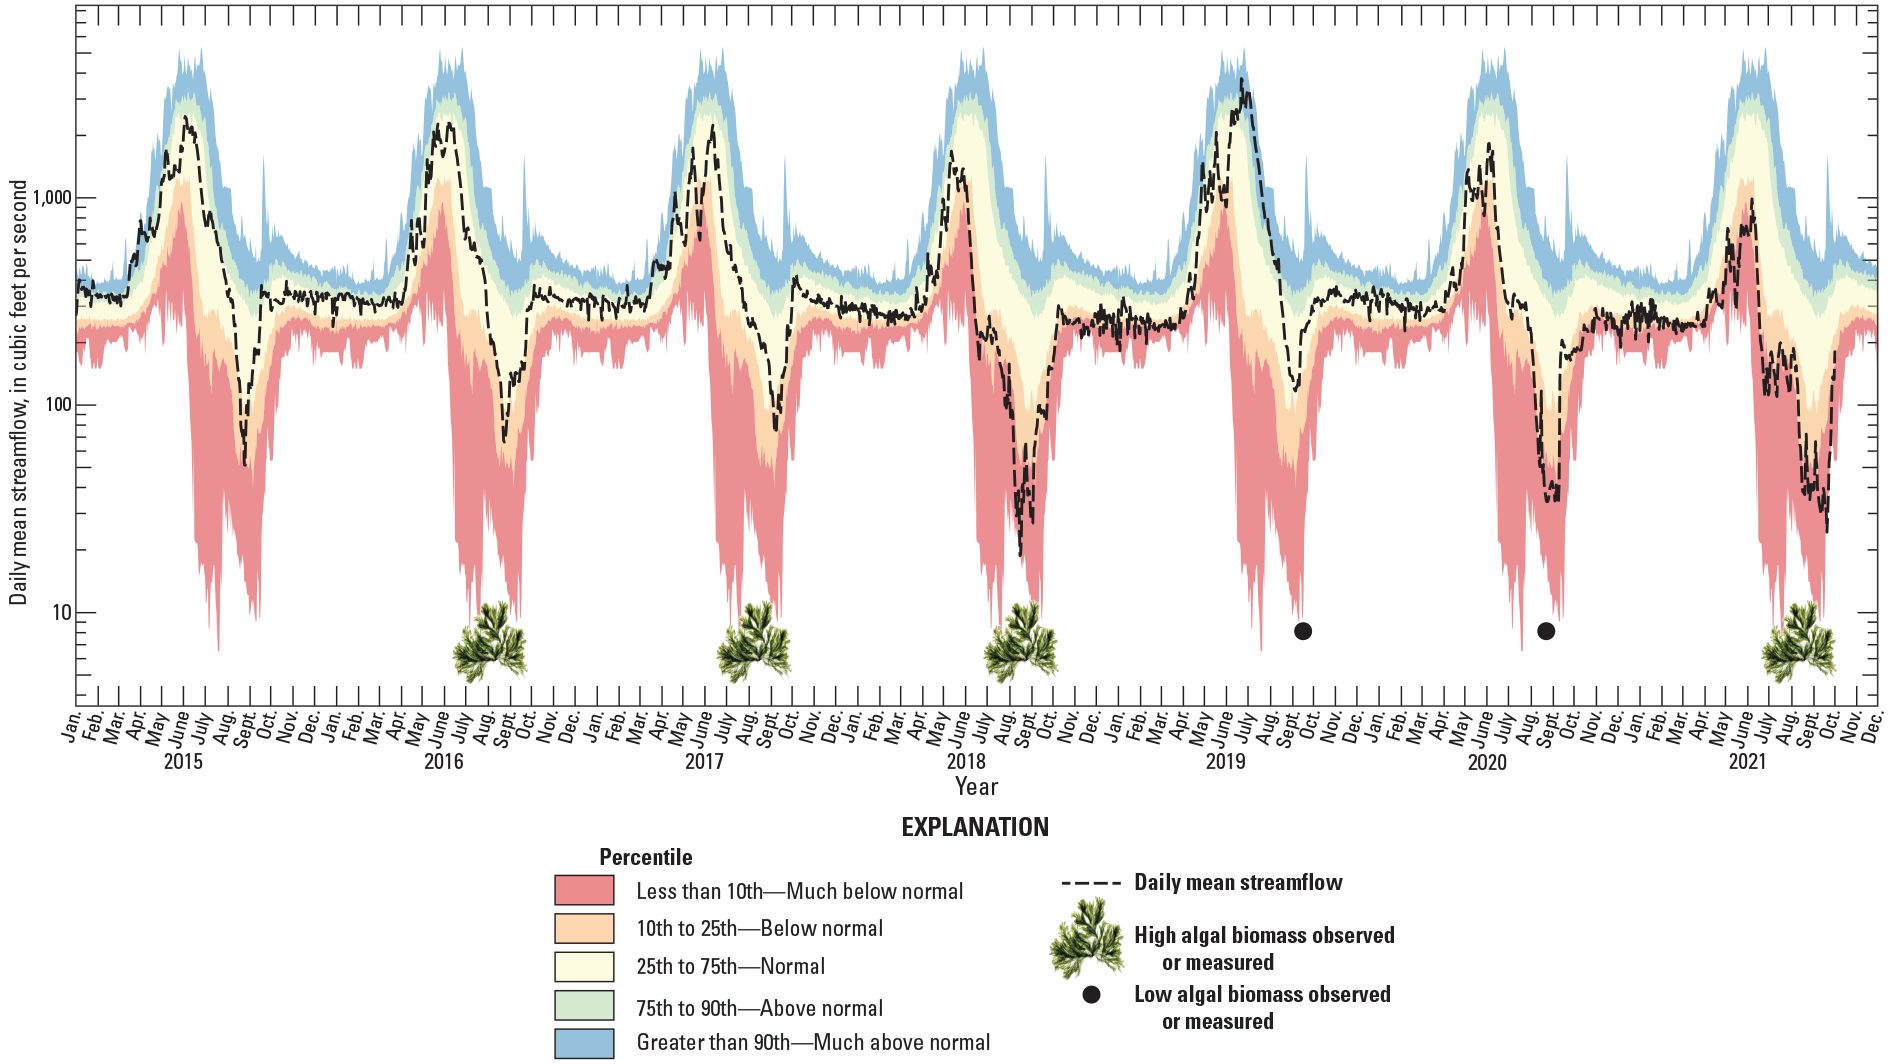
Graph showing streamflow at White River above Coal Creek near Meeker, Colorado, 2015–21 (U.S. Geological Survey, 2021a).
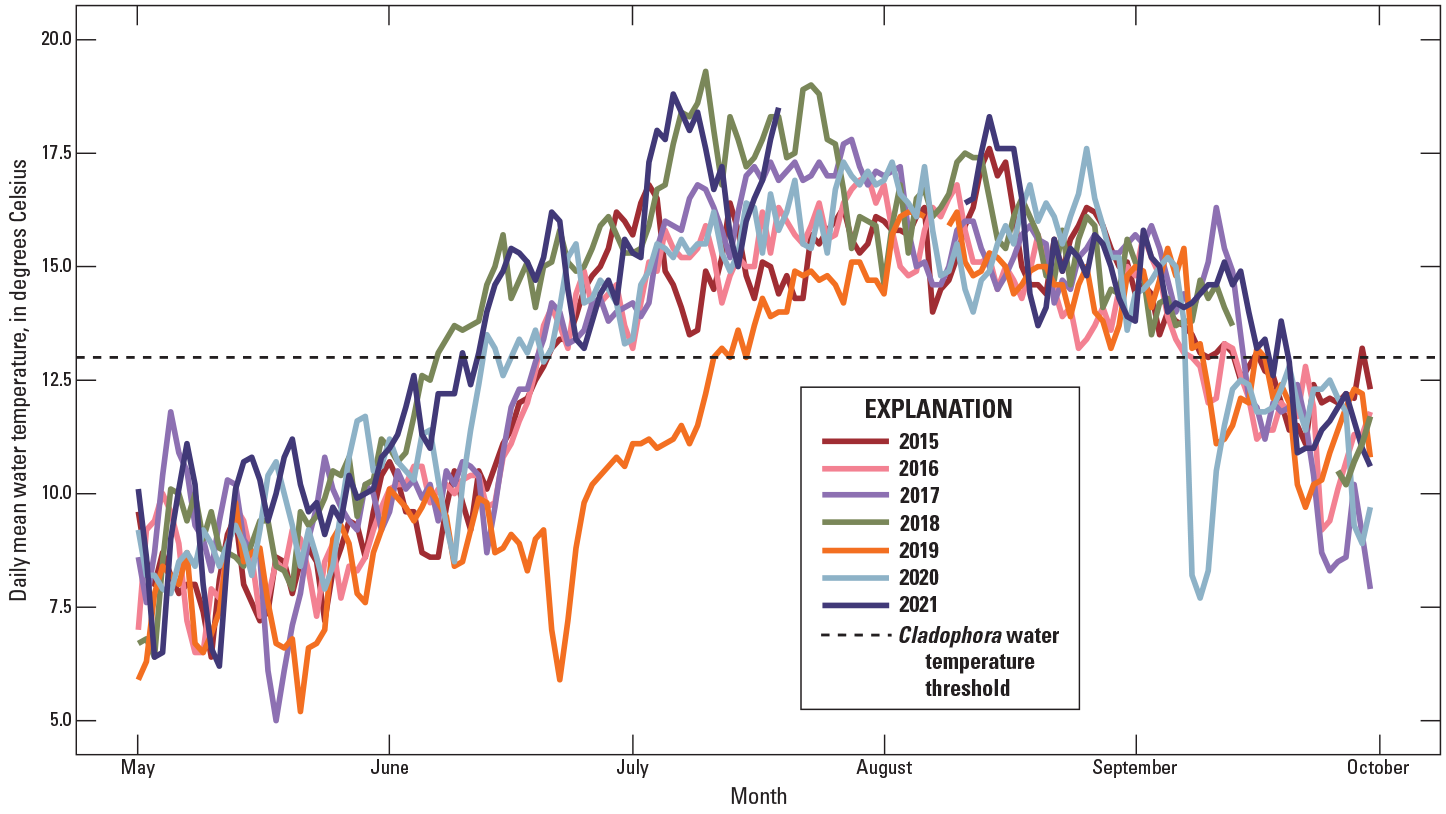
Graph showing daily mean water temperature at White River above Coal Creek near Meeker, Colorado, 2015–21 (U.S. Geological Survey, 2021a).
By incorporating previous accounts of years with nuisance levels of algal biomass in the basin, it is also apparent that early or low-magnitude peak streamflow conditions during the year of interest (or preceding year) are not prerequisites for algal bloom occurrence. In 2015, 2016, and 2017, peak streamflow dates and maximum streamflow values were relatively similar to the values averaged over the period of record (fig. 10; table 5). Likewise, streamflows during spring and summer were all in the normal range compared to the period of record, with the exception of a short decrease in streamflow in 2017 before the peak.
Synthesis
Findings from this multiyear study indicate that the effects caused by larger peak streamflow, including movement of the streambed, may be the dominant control on the occurrence of an algal bloom. In the absence of disturbance, other factors including substrate size, water temperature, and nutrient availability may also moderate algal biomass. Findings from this study, including those published in a companion report (Day, 2023), show that algal occurrence may depend on long-term changes in streamflow and nutrients as well as site-specific factors. Stakeholders or land managers could consider these findings in future strategies to reduce algal occurrence.
The frequency and severity of algal blooms in the upper White River Basin may be influenced by long-term changes in streamflow, specifically changes in high- and low-streamflow statistics. As part of this study, long-term trends in streamflow were estimated at White River above Coal Creek (Day, 2023). Decreasing trends in 1-day maximum and mean streamflows in May and June and corresponding increases in April from 1980 to 2020 may indicate a shift toward earlier and reduced snowmelt runoff, which has been observed across western North America and the Colorado River Basin (Udall and Bates, 2007). As discussed in the “Potential Controls in Algal Biomass Among Years” section, relatively large, late, and long-lasting peak streamflows, such as those measured in 2019 (fig. 10; table 5), may limit algal blooms during the WY in which it occurs and into subsequent WYs. A trend toward lower magnitude high streamflow, especially when it may cause multiyear effects on algal occurrence, could promote more severe and frequent algal blooms in the basin. This study did not investigate the timing of algal occurrence relative to the seasonal hydrograph, though shorter duration of snowmelt runoff can also result in conditions favorable to benthic algae earlier in the season, including warmer water temperatures (fig. 11) and greater light availability.
Significant decreases in mean daily and 7-day low-streamflow statistics were observed at White River above Coal Creek from 1980 to 2020 (Day, 2023). Low streamflows during summer months can have large effects on aquatic habitat variables including temperature, dissolved oxygen, and the potential for nutrients to be diluted (Rolls and others, 2012). Results of the linear mixed-effects model indicated that water temperature is an important influence on algal biomass across sites, where warmer temperatures are associated with greater algal biomass. Maintaining minimum streamflows and improving riparian shading to attain water temperatures below or close to below the optimal range for algal blooms may limit the duration or spatial extent of algal blooms in the future.
The assessment of existing long-term data also indicates that nutrient conditions have become more favorable to benthic algae (Day, 2023). Total phosphorus concentrations have increased across the upper White River Basin from 2000–20, and concentrations measured during the summer months (June–September) of 2019 and 2020 were near or exceeded algal-specific criteria (Suplee and Watson, 2013) at sites on the North Fork White River and main stem White River (Day, 2023). Concomitant decreases in nitrogen concentrations have led to changes in nutrient limitation where the North Fork White River and, to a smaller degree, the South Fork White River are generally nitrogen limited during summer months. Elevated phosphorus concentrations from either atmospheric deposition or soil weathering have been implicated in the shifts toward chlorophyte-dominated algal assemblages in alpine lakes in Colorado (Oleksy and others, 2020).
The relatively uniform increase in total phosphorus concentrations and loads between the North and South Fork White River indicates that the cause may be regional in scope. Similar increases in phosphorus loads of around 40 percent were found across a similar time period (1999–2018) in the Yampa River at Steamboat Springs (USGS site number 09239500), located in a nearby basin (Day, 2021). Potential explanations for the basinwide increases in phosphorus include greater phosphorus-rich dust deposition (Stoddard and others, 2016) and increases in phosphorus release from soils, which result from changes in soil pH owing to reduced acidity of precipitation (Corman and others, 2018) and warming associated with climate change (Conant and others, 2011). Although controlling inputs from these types of external sources may be difficult, implementation of basic best management practices to reduce nutrient inputs into rivers, including riparian buffers, can reduce sediment and nutrient loads (Vought and others, 1995; Mayer and others, 2007). Identifying source areas of phosphorus and establishing nutrient-load-reduction goals to reach target concentrations may help limit algal biomass in the future. Results of a synoptic sampling and load and yield analysis from Day (2023) can be useful for this type of effort. Assessing and monitoring of the relation between nutrients and algal biomass, may support understanding of the success of nutrient-reduction strategies.
Instream nutrient targets were set to reduce total nitrogen and phosphorus loading on the Clark Fork and Madison Rivers in Montana over concerns of widespread benthic algal blooms (Dodds and others, 1997; Suplee and others, 2012). Actions taken to reduce nutrients included upgrading sewer lines, replacing septic systems with central sewer systems, upgrading a wastewater treatment facility, and banning phosphate laundry detergent. Reductions of both nitrogen and phosphorus below algal-specific standards resulted in reductions of algal biomass below nuisance levels in areas below the wastewater treatment plant; however, nutrient and algal biomass levels were not reduced below target levels in the upper basin where nonpoint sources dominated (Suplee and others, 2012).
Exploring how changes in land use, water withdrawals, pesticide application, and other localized anthropogenic activities may affect algal biomass across years was beyond the scope of this study. Continued monitoring of algal biomass, water temperature, and nutrients at a subset of sites in each subbasin may better constrain understanding of the dominant factors controlling algal biomass.
Summary
Nuisance levels of benthic filamentous green algae, including Cladophora glomerata, are increasingly common in surface waters of Colorado, such as the upper White River of northwestern, Colorado. Excessive accumulation of benthic algae, or algal blooms, can compromise aesthetic quality of rivers and streams, limit recreational activities, block water infrastructure, and have negative effects on aquatic life, including strong fluctuations in dissolved oxygen levels and toxin production. In 2018, the U.S. Geological Survey began a study to collect and analyze physical, chemical, and biological information for the upper White River to better understand what controls algal growth and proliferation. This report (1) presents site-specific water temperature, riparian canopy cover, streambed particle size, and algal biomass and community composition data; (2) describes the potential for streambed movement during spring runoff using physical channel characteristics and peak streamflow velocities; and (3) explains the results of a linear mixed-effects model used to test hypotheses about the influence of physical and chemical factors in explaining the occurrence of algal blooms across the basin. Hypotheses tested include (1) streamflow-induced movement of the streambed during snowmelt runoff may change conditions that limit algal biomass, and (2) physical and chemical characteristics associated with streambed particle size, water temperature, light availability, and nutrient availability, will affect algal biomass. From October 2018 to September 2021, the hydrograph at White River above Coal Creek near Meeker, Colo., represented a wide range of conditions compared to the long-term record. Water temperatures reached and stayed above water temperature thresholds favorable to Cladophora growth, 13 degrees Celsius, in early to mid-June of 2018, 2020, and 2021, whereas temperatures remained below the threshold until July 7 in 2019. Comparing water temperatures across all 20 sites in 2019 and 2020, daily mean August water temperature generally increased with distance downstream. Mean canopy cover was relatively low across sites, ranging from 0 to 26 percent.
Streambed surface particle sizes varied across sites in the upper White River Basin and did not appear to correlate with longitudinal position in the basin. The D50 (50th percentile particle size) and D84 (84th percentile particle size) often increased and subsequently decreased between the sites, exhibiting modest variability. Variation in peak streamflow velocities across study years resulted in variability in streambed movement at some sites, but not all. Boundary shear stress was sufficient to mobilize the D50 at zero sites in 2018, seven sites in 2019, and two sites in 2020. Boundary shear stress was sufficient to mobilize the D84 at zero sites in 2018, five sites in 2019, and one site in 2020. It is unlikely that streambed movement occurred at any site in the upper North Fork subbasin.
Four genera of filamentous green algae were identified in the upper White River Basin, including Cladophora, Stigeoclonium, Ulothrix, and Spirogyra. In 2020, filamentous green algae occurred at 14 sites of the 20 sites sampled and in all subbasins. In 2021, filamentous green algae occurred at four of the five sites sampled, with Cladophora and Spirogyra composing the majority of green algal biovolume across sites. Many genera of cyanobacteria were present, including some capable of producing toxins and taste and odor compounds. The diatom Didymosphenia geminata, commonly referred to as didymo or “rock snot,” was found at South Fork White River at Buford, Colo., and White River above Dry Creek near Meeker, Colo., in 2020 and 2021.
Benthic algal biomass (chlorophyll a) ranged from 0.7 to 309 milligrams per square meter (mg/m2) during summer months from 2018 through 2021 and exceeded the Colorado Department of Public Health and Environment criteria of 150 mg/m2 on four occasions, all during 2018. Algal biomass was substantially higher in 2018 than in other study years in all subbasins except the upper North Fork, where biomass concentrations were consistently low. The highest median algal biomass concentrations were measured at North Fork White River at Buford, Colo., and White River above Dry Creek near Meeker, Colo., with biomass concentrations of 51 and 50 mg/m2, respectively. The three most downstream sites in the basin, White River above Coal Creek near Meeker, Colo.; White River near Meeker, Colo.; and White River above Curtis Creek near Meeker, Colo., had the next highest median biomass concentrations, all around 34 mg/m2. Algal biomass was consistently low at six sites in the upper White River Basin, including all sites in the upper North Fork subbasin; North Fork White River below Marvine Creek, Colo.; and South Fork White River near Budges Resort, Colo.Streamflow-induced movement of the streambed during snowmelt runoff was expected to affect patterns of algal biomass; however, inconsistent patterns between streambed movement and algal biomass were observed across sites and years. Differences in response are likely influenced by additional factors, including the life stages of other organisms in the system or the availability of other resources like nutrients, temperature, and light.
A linear mixed-effects model was created based on hypotheses about how measured variables would influence variation in algal biomass. Median rock size (D50) and mean August water temperature had significant positive effects, meaning that greater bed stability and higher mean August water temperatures resulted in greater algal biomass. Total nitrogen to total phosphorus ratios had a significant negative effect on algal biomass, meaning that more nitrogen-limiting conditions, or greater phosphorus availability, corresponded to greater algal biomass. Based on data availability, this assessment of variation in algal biomass across sites is limited to 2019–20 during nonbloom conditions; controls on algal biomass may be different during bloom years.
Streamflow and water temperature data from the White River above Coal Creek near Meeker, Colo., were used to assess possible causes of bloom conditions across years, including 2016 and 2017, when algal blooms were first measured and reported in the basin. Early or low-magnitude peak streamflow conditions are not prerequisites for algal bloom occurrence. Conversely, relatively large, late, and long-lasting peak streamflows, such as those measured in 2019, may limit algal blooms during the same year and into subsequent years, as evidenced by extremely low algal biomass in 2019 and 2020. The broad spatial extent of bloom conditions indicates that the factors contributing to the occurrence of algal blooms are likely of basinwide proportion.
Findings from this multiyear study indicate that the effects caused by larger peak streamflow, such as movement of the streambed, may be the dominant control on the occurrence of an algal bloom, and that in the absence of disturbance other factors, including substrate size, water temperature, and nutrient availability, moderate algal biomass. Synthesis of findings from this investigation, including those published in a companion report, informs how site-specific factors and long-term changes in streamflow and nutrients may affect algal occurrence. Stakeholders or land managers can consider synthesis of the findings of this investigation in future strategies to reduce algal occurrence.
References Cited
Arar, E.J., and Collins, G.B., 1997, U.S. Environmental Protection Agency Method 445.0, In vitro determination of chlorophyll a and pheophytin a in marine and freshwater algae by fluorescence, revision 1.2: Cincinnati, Ohio, U.S., Environmental Protection Agency, National Exposure Research Laboratory, Office of Research and Development, accessed April 2018, at https://cfpub.epa.gov/si/si_public_record_report.cfm?Lab=NERL&dirEntryId=309417.
Beck, W.S., Markman, D.W., Oleksy, I.A., Lafferty, M.H., and Poff, N.L., 2019, Seasonal shifts in the importance of bottom–up and top–down factors on stream periphyton community structure: Oikos, v. 128, no. 5, p. 680–691, accessed September 2021, at https://doi.org/10.1111/oik.05844.
Biggs, B.J.F., 1996, Patterns in benthic algae of streams, chap. 2 of Stevenson, R.J., Bothwell, M.L., and Lowe, R.L., eds., Algal ecology—freshwater benthic ecosystems: San Diego, Calif., Academic Press, p. 31–56, accessed April 2019, at https://doi.org/10.1016/B978-012668450-6/50031-X.
Biggs, B.J.F., 2000, Eutrophication of streams and rivers—dissolved nutrient-chlorophyll relationships for benthic algae: Journal of the North American Benthological Society, v. 19, no. 1, p. 17–31, accessed June 2019, at https://doi.org/10.2307/1468279
Biggs, B.J.F., and Close, M.E., 1989, Periphyton biomass dynamics in gravel bed rivers—The relative effects of flows and nutrients: Freshwater Biology, v. 22, no. 2, p. 209–231, accessed September 2021, at https://doi.org/10.1111/j.1365-2427.1989.tb01096.x.
Biggs, B.J.F., and Price, G.M., 1987, A survey of filamentous algal proliferations in New Zealand rivers: New Zealand Journal of Marine and Freshwater Research, v. 21, no. 2, p. 175–191, accessed July 2022, at https://doi.org/10.1080/00288330.1987.9516214.
Bowman, M.F., Chambers, P.A., and Schindler, D.W., 2007, Constraints on benthic algal response to nutrient addition in oligotrophic mountain rivers: River Research and Applications, v. 23, no. 8, p. 858–876, accessed July 2021, at https://doi.org/10.1002/rra.1025.
Colorado Department of Public Health and Environment [CDPHE], 2017, Water Quality Control Commission Regulation No. 31—The basic standards and methodologies for surface water: Colorado Water Quality Control Commission, 230 p., accessed September 3, 2019, at https://www.coloradosos.gov/CCR/GenerateRulePdf.do?ruleVersionId=9874&fileName=5%20CCR%201002-31.
Conant, R.T., Ryan, M.G., Ågren, G.I., Birge, H.E., Davidson, E.A., Eliasson, P.E., Evans, S.E., Frey, S.D., Giardina, C.P., Hopkins, F.M., and Hyvönen, R., Kirschbaum, M.U.F., Lavallee, J.M., Leifeld, J., Parton, W.J., Steinweg, J.M., Wallenstein, M.D., Wetterstedt, J.Å.M., Bradford, M.A., 2011, Temperature and soil organic matter decomposition rates—Synthesis of current knowledge and a way forward: Global Change Biology, v. 17, no. 11, p. 3392–3404, accessed March 2019, at https://doi.org/10.1111/j.1365-2486.2011.02496.x.
Corman, J.R., Bertolet, B.L., Casson, N.J., Sebestyen, S.D., Kolka, R.K., and Stanley, E.H., 2018, Nitrogen and phosphorus loads to temperate seepage lakes associated with allochthonous dissolved organic carbon loads: Geophysical Research Letters, v. 45, no. 11, p. 5481–5490, accessed June 2020, at https://doi.org/10.1029/2018GL077219.
Chételat, J., Pick, F.R., Morin, A., and Hamilton, P.B., 1999, Periphyton biomass and community composition in rivers of different nutrient status: Canadian Journal of Fisheries and Aquatic Sciences, v. 56, no. 4, p. 560–569, accessed September 2021, at https://doi.org/10.1139/f98-197.
Day, N.K., 2021, Assessment of streamflow and water quality in the Upper Yampa River Basin, Colorado, 1992–2018: U.S. Geological Survey Scientific Investigations Report 2021–5016, 45 p., accessed June 2022, at https://doi.org/10.3133/sir20215016.
Day, N.K., 2023, Characterization of streamflow and nutrient occurrence in the upper White River Basin, Colorado, 1980–2020: U.S. Geological Survey Scientific Investigations Report 2022-5112, 37 p., https://doi.org/10.3133/sir20225112.
Day, N.K., Gidley, R.G., and Henneberg, M.F., 2023, Channel characteristics, benthic algae, and water quality model data for selected sites in the upper White River Basin, Colorado, 2018–21: U.S. Geological Survey data release, https://doi.org/10.5066/P9E82RMQ.
Dodds, W.K., 1991, Factors associated with dominance of the filamentous green alga Cladophora glomerata: Water Research, v. 25, no. 11, p. 1325–1332, accessed June 2021, at https://doi.org/10.1016/0043-1354(91)90110-C.
Dodds, W.K., Smith, V.H., and Zander, B., 1997, Developing nutrient targets to control benthic chlorophyll levels in streams—A case study of the Clark Fork River: Water Research, v. 31, no. 7, p. 1738–1750, accessed June 2018, at https://doi.org/10.1016/S0043-1354(96)00389-2.
Dodds, W.K., Bouska, W.W., Eitzmann, J.L., Pilger, T.J., Pitts, K.L., Riley, A.J., Schloesser, J.T., Thornbrugh, D.J., 2009, Eutrophication of U.S. freshwaters—Analysis of potential economic damages: Environmental Science & Technology, v. 43, no. 1, p. 12–19, accessed June 2020, at https://doi.org/10.1021/es801217q.
Elser, J.J., Bracken, M.E.S., Cleland, E.E., Gruner, D.S., Harpole, W.S., Hillebrand, H., Ngai, J.T., Seabloom, E.W., Shurin, J.B., and Smith, J.E., 2007, Global analysis of nitrogen and phosphorus limitation of primary producers in freshwater, marine and terrestrial ecosystems: Ecology Letters, v. 10, no. 12, p. 1135–1142, accessed September 2021, at https://doi.org/10.1111/j.1461-0248.2007.01113.x
Fulton, J.W., Mason, C.A., Eggleston, J.R., Nicotra, M.J., Chiu, C.-L., Henneberg, M.F., Best, H.R., Cederberg, J.R., Holnbeck, S.R., Lotspeich, R.R., Laveau, C.D., Moramarco, T., Jones, M.E., Gourley, J.J., and Wasielewski, D., 2020, Near-field remote sensing of surface velocity and river discharge using radars and the probability concept at 10 U.S. Geological Survey streamgages: Remote Sensing, v. 12, no. 8, article 1296, 28 p., accessed August 2022, at https://doi.org/10.3390/rs12081296.
GEI Consultants, Inc., 2021, White River macroinvertebrate analysis, 2017–2019: White River & Douglas Creek Conservation Districts website, accessed June 2021, at https://wrcd-dccd.colorado.gov/sites/wrcd-dccd/files/GEI%20White%20River%20Macroinvertebrate%20Presentation.01262021_J.Lynch_.pdf.
Graham, J.L., Loftin, K.A., Ziegler, A.C., and Meyer, M.T., 2008, Guidelines for design and sampling for cyanobacterial toxin and taste-and-odor studies in lakes and reservoirs: U.S. Geological Survey Scientific Investigations Report 2008–5038, 39 p., accessed June 2021, at https://doi.org/10.3133/sir20085038.
Graham, J.M., Auer, M.T., Canale, R.P., and Hoffmann, J.P., 1982, Ecological studies and mathematical modeling of Cladophora in Lake Huron—4. Photosynthesis and respiration as functions of light and temperature: Journal of Great Lakes Research, v. 8, no. 1, p. 100–111, accessed July 2021, at https://doi.org/10.1016/S0380-1330(82)71948-3.
Hillebrand, H., and Sommer, U., 1999, The nutrient stoichiometry of benthic microalgal growth—Redfield proportions are optimal: Limnology and Oceanography, v. 44, no. 2, p. 440–446, accessed June 2021, at https://doi.org/10.4319/lo.1999.44.2.0440.
Hodge, B.W., and Eyre, T., 2021, Stream temperatures in the forks and main stem of the White River in northwest Colorado (2019–2020): White River & Douglas Creek Conservation Districts website, accessed April 1, 2021, at https://wrcd-dccd.colorado.gov/sites/wrcd-dccd/files/documents/stream_temps_in_upper_white_river_-_hodge-eyre.pdf
HydroSolutions, 2017, Upper White River watershed assessment: Elk Creek Ranch, Meeker, Colo., prepared by HydroSolutions, Helena, Mont., 175 p., accessed January 2021, at https://wrcd-dccd.colorado.gov/sites/wrcd-dccd/files/documents/UpperWhiteRiverWatershedAssessment_20171121.pdf.
Julien, P.Y., 2010, Erosion and sedimentation (2d ed.): Cambridge, Cambridge University Press, 371 p., accessed June 2021, at https://doi.org/10.1017/CBO9780511806049.
Kelley, R., 2017, As the White River turns green again, work to seek a solution begins: The Herald Times, August 3, 2017, accessed August 2021, at http://www.theheraldtimes.com/as-the-white-river-turns-green-again-work-to-seek-a-solution-begins/rio-blanco-county/.
Kumar, S., Spaulding, S.A., Stohlgren, T.J., Hermann, K.A., Schmidt, T.S., and Bahls, L.L., 2009, Potential habitat distribution for the freshwater diatom Didymosphenia geminata in the continental US: Frontiers in Ecology and the Environment, v. 7, no. 8, p. 415–420, accessed January 2021, at https://doi.org/10.1890/080054.
Lemmon, P.E., 1956, A spherical densiometer for estimating forest overstory density: Forest Science, v. 2, no. 4, p. 314–320, accessed October 20, 2020, at https://doi.org/10.1093/forestscience/2.4.314.
Lester, W.W., Adams, M.S., and Farmer, A.M., 1988, Effects of light and temperature on photosynthesis of the nuisance alga Cladophora glomerata (L.) Kutz from Green Bay, Lake Michigan: New Phytologist, v. 109, no. 1, p. 53–58, accessed December 2021, at https://doi.org/10.1111/j.1469-8137.1988.tb00218.x.
Lewis, W.M., Jr., and McCutchan, J.H., 2010, Ecological responses to nutrients in streams and rivers of the Colorado mountains and foothills: Freshwater Biology, v. 55, no. 9, p. 1973–1983, accessed June 2021, at https://doi.org/10.1111/j.1365-2427.2010.02431.x.
Lewis, W.M., Jr., Wurtsbaugh, W.A., and Paerl, H.W., 2011, Rationale for control of anthropogenic nitrogen and phosphorus to reduce eutrophication of inland waters: Environmental Science & Technology, v. 45, no. 24, p. 10300–10305, accessed June 2021, at https://doi.org/10.1021/es202401p.
Lowe, R.L., Golladay, S.W., and Webster, J.R., 1986, Periphyton response to nutrient manipulation in streams draining clearcut and forested watersheds: Journal of the North American Benthological Society, v. 5, no. 3, p. 221–229, accessed June 2021, at https://doi.org/10.2307/1467709.
May, M., and Noble, C., 2017, White River algae report on 2016 data, prepared by Colorado Parks and Wildlife, 22 p., accessed July 1, 2021, at https://wrcd-dccd.colorado.gov/sites/wrcd-dccd/files/documents/final_2016_white_river_report_1.pdf.
Mayer, P.M., Reynolds, S.K., Jr., McCutchen, M.D., and Canfield, T.J., 2007, Meta-analysis of nitrogen removal in riparian buffers: Journal of Environmental Quality, v. 36, no. 4, p. 1172–1180, accessed July 2021, at https://doi.org/10.2134/jeq2006.0462.
Mosisch, T.D., 2001, Effects of desiccation on stream epilithic algae: New Zealand Journal of Marine and Freshwater Research, v. 35, no. 1, p. 173–179, accessed July 2021, at https://doi.org/10.1080/00288330.2001.9516987.
Mueller, D.K., Hamilton, P.A., Helsel, D.R., Hitt, K.J., and Ruddy, B.C., 1995, Nutrients in ground water and surface water of the United States—An analysis of data through 1992: U.S. Geological Survey Water-Resources Investigations Report 95–4031, 74 p., accessed August 2021, at https://doi.org/10.3133/wri954031.
Mueller, D.K., Schertz, T.L., Martin, J.D., and Sandstrom, M.W., 2015, Design, analysis, and interpretation of field quality-control data for water-sampling projects: U.S. Geological Survey Techniques and Methods, book 4, chap. C4, 54 p., accessed January 20, 2020, at https://doi.org/10.3133/tm4C4.
Mueller, D.S., Wagner, C.R., Rehmel, M.S., Oberg, K.A., and Rainville, F., 2013, Measuring discharge with acoustic Doppler current profilers from a moving boat (ver. 2.0, December 2013): U.S. Geological Survey Techniques and Methods, book 3, chap. A22, 95 p., accessed August 2021, at https://doi.org/10.3133/tm3A22.
Mulholland, P.J., Steinman, A.D., Marzolf, E.R., Hart, D.R., and DeAngelis, D.L., 1994, Effect of periphyton biomass on hydraulic characteristics and nutrient cycling in streams: Oecologia, v. 98, p. 40–47, accessed September 2021, at https://doi.org/10.1007/BF00326088.
Multi-Resolution Land Characteristics Consortium, 2021, National Land Cover Database (NLCD) 2016: Multi-Resolution Land Characteristics Consortium website, accessed June 3, 2020, at https://www.mrlc.gov/national-land-cover-database-nlcd-2016.
Munn, M.D., Osborne, L.L., and Wiley, M.J., 1989, Factors influencing periphyton growth in agricultural streams of central Illinois: Hydrobiologia, v. 174, p. 89–97, accessed August 2021, at https://doi.org/10.1007/BF00014057.
Natural Resources Conservation Service, 2021, Water Supply Forecast Chart: U.S. Department of Agriculture Natural Resources and Conservation Service website, accessed June 10, 2021, at https://www.nrcs.usda.gov/wps/portal/wcc/home/quicklinks/forecastCharts/.
Olden, J.D., and Poff, N.L., 2003, Redundancy and the choice of hydrologic indices for characterizing streamflow regimes: River Research and Applications, v. 19, no. 2, p. 101–121, accessed September 2021, at https://doi.org/10.1002/rra.700.
Oleksy, I.A., Baron, J.S., Leavitt, P.R., and Spaulding, S.A., 2020, Nutrients and warming interact to force mountain lakes into unprecedented ecological states: Proceedings of the Royal Society B, v. 287, no. 1930, p. 20200304, accessed June 2021, at https://doi.org/10.1098/rspb.2020.0304.
Piggott, J.J., Salis, R.K., Lear, G., Townsend, C.R., and Matthaei, C.D., 2014, Climate warming and agricultural stressors interact to determine stream periphyton community composition: Global Change Biology, v. 21, no. 1, p. 206–222, accessed August 2021, at https://doi.org/10.1111/gcb.12661.
Poff, N.L., Allan, J.D., Bain, M.B., Karr, J.R., Prestegaard, K.L., Richter, B.D., Sparks, R.E., and Stromberg, J.C., 1997, The natural flow regime: BioScience, v. 47, no. 11, p. 769–784, accessed September 2021, at https://doi.org/10.2307/1313099.
Power, M.E., and Stewart, A.J., 1987, Disturbance and recovery of an algal assemblage following flooding in an Oklahoma stream: American Midland Naturalist, v. 117, no. 2, p. 333–345, accessed April 2021, at https://doi.org/10.2307/2425975.
Power, M.E., Parker, M.S., and Dietrich, W.E., 2008, Seasonal reassembly of a river food web—floods, droughts, and impacts of fish: Ecological Monographs, v. 78, no. 2, p. 263–282, accessed April 2021, at https://doi.org/10.1890/06-0902.1.
R Core Team, 2021, R—A language and environment for statistical computing, ver. 3.6.1: R Foundation for Statistical Computing software release, accessed April 2021, at https://www.r-project.org/.
Rolls, R.J., Leigh, C., and Sheldon, F., 2012, Mechanistic effects of low-flow hydrology on riverine ecosystems—Ecological principles and consequences of alteration: Freshwater Science, v. 31, no. 4, p. 1163–1186, accessed April 2020, at https://doi.org/10.1899/12-002.1.
Reynolds, C.S., 1984, Phytoplankton periodicity—The interactions of form, function and environmental variability: Freshwater Biology, v. 14, no. 2, p. 111–142, accessed April 2021, at https://doi.org/10.1111/j.1365-2427.1984.tb00027.x.
Rydlund, P.H., Jr., and Densmore, B.K., 2012, Methods of practice and guidelines for using survey-grade global navigation satellite systems (GNSS) to establish vertical datum in the United States Geological Survey: U.S. Geological Survey Techniques and Methods, book 11, chap. D1, 102 p., accessed November 18, 2020, at https://doi.org/10.3133/tm11D1.
Schneider, S.C., 2015, Greener rivers in a changing climate?—Effects of climate and hydrological regime on benthic algal assemblages in pristine streams: Limnologica, v. 55, p. 21–32, accessed September 2021, at https://doi.org/10.1016/j.limno.2015.10.004.
Skibo, A.Z., 2018, White River headwaters algae dataset evaluation, 2016: Wetlands Ranch Report-AES-2017-0003, prepared by Amaruq Environmental Services, 38 p. [Also available at https://wrcd-dccd.colorado.gov/sites/wrcd-dccd/files/documents/white_river_headwaters_algae_dataset_evaluation-2016_amaruqes_1.pdf]
Steinman, A.D., McIntire, C.D., Gregory, S.V., and Lamberti, G.A., 1989, Effects of irradiance and grazing on lotic algal assemblages: Journal of Phycology, v. 25, no. 3, p. 478–485., accessed June 2021, at https://doi.org/10.1111/j.1529-8817.1989.tb00253.x.
Stewart, I.T., Cayan, D.R., and Dettinger, M.D., 2005, Changes toward earlier streamflow timing across western North America: Journal of Climate, v. 18, no. 8, p. 1136–1155, accessed September 2021, at https://doi.org/10.1175/JCLI3321.1.
Stevenson, R.J., Rier, S.T., Riseng, C.M., Schultz, R.E., and Wiley, M.J., 2006, Comparing effects of nutrients on algal biomass in streams in two regions with different disturbance regimes and with applications for developing nutrient criteria: Hydrobiologia, v. 561, p. 149–165, accessed August 2021, at https://doi.org/10.1007/s10750-005-1611-5.
Stevenson, R.J., and Rollins, S.L., 2017, Ecological assessment with benthic algae, chap. 37 of Lamberti, G.A., and Hauer, F.R., eds., Methods in stream ecology (third edition): Academic Press, p. 277–292, accessed July 2021, at https://doi.org/10.1016/B978-0-12-813047-6.00015-2.
Stoddard, J.L., Van Sickle, J., Herlihy, A.T., Brahney, J., Paulsen, S., Peck, D.V., Mitchell, R., and Pollard, A.I., 2016, Continental-scale increase in lake and stream phosphorus—Are oligotrophic systems disappearing in the United States?: Environmental Science & Technology, v. 50, no. 7, p. 3409–3415, accessed June 2020, at https://doi.org/10.1021/acs.est.5b05950.
Suplee, M.W., and Watson, V., 2013, Scientific and technical basis of the numeric nutrient criteria for Montana’s wadeable streams and rivers—Update 1: Helena, Mont., Montana Department of Environmental Quality, prepared by Water Quality Planning Bureau, Standards Section 125 p., accessed January 2021, at https://www.deq.mt.gov/files/Water/WQPB/Standards/PDF/ScienceTech2013FNLcom.pdf.
Suplee, M.W., Watson, V., Dodds, W.K., and Shirley, C., 2012, Response of algal biomass to large-scale nutrient controls in the Clark Fork River, Montana, United States: Journal of the American Water Resources Association, v. 48, no. 5, p. 1008–1021, accessed August 2020, at https://doi.org/10.1111/j.1752-1688.2012.00666.x.
Tyler, A.C., McGlathery, K.J., and Anderson, I.C., 2003, Benthic algae control sediment—Water column fluxes of organic and inorganic nitrogen compounds in a temperate lagoon: Limnology and Oceanography, v. 48, no. 6, p. 2125–2137, accessed September, 2021, at https://doi.org/10.4319/lo.2003.48.6.2125.
Udall, B., and Bates, G., 2007, Climatic and hydrologic trends in the western U.S.—A review of recent peer reviewed research: Western Water Assessment website, accessed June 2021, at https://wwa.colorado.edu/sites/default/files/2021-09/IWCS_2007_Jan_feature.pdf.
U.S. Department of Agriculture Forest Service, 2008, Stream simulation—An ecological approach to providing passage for aquatic organisms at road-stream crossings: accessed May 2021, at https://www.fs.usda.gov/Internet/FSE_DOCUMENTS/fsm91_054564.pdf.
U.S. Geological Survey [USGS], 2021a, USGS water data for the Nation: U.S. Geological Survey National Water Information System database, accessed March 20, 2021, at https://doi.org/10.5066/F7P55KJN.
U.S. Geological Survey [USGS], 2021b, WaterWatch: Streamflow duration hydrograph builder, accessed November 2021, at https://waterwatch.usgs.gov/.
Vadeboncoeur, Y., Moore, M.V., Stewart, S.D., Chandra, S., Atkins, K.S., Baron, J.S., Bouma-Gregson, K., Brothers, S., Francoeur, S.N., Genzoli, L., Higgins, S.N., Hilt, S., Katona, L.R., Kelly, D., Oleksy, I.A., Ozersky, T., Power, M.E., Roberts, D., Smits, A.P, Timoshkin, O., Tromboni, F., Vander Zanden, M.J., Volkavo, E.A., Waters, S., Wood, S.A., and Yamamuro, M., 2021, Blue waters, green bottoms—Benthic filamentous algal blooms are an emerging threat to clear lakes worldwide: BioScience, v. 71, no. 10, p. 1011–1027, accessed December 2021, at https://doi.org/10.1093/biosci/biab049.
Vought, L.B.-M., Pinay, G., Fuglsang, A., and Ruffinoni, C., 1995, Structure and function of buffer strips from a water quality perspective in agricultural landscapes: Landscape and Urban Planning, v. 31, nos. 1–3, p. 323–331, accessed June 2021, at https://doi.org/10.1016/0169-2046(94)01057-F.
Warnaars, T.A., Hondzo, M., and Power, M.E., 2007, Abiotic controls on periphyton accrual and metabolism in streams—Scaling by dimensionless numbers: Water Resources Research, v. 43, no. 8, article W08425, 13 p., accessed July 2021, at https://doi.org/10.1029/2006WR005002.
Whitton, B.A., 1970, Biology of Cladophora in freshwaters: Water Research, v. 4, no. 7, p. 457–476, accessed August 2020, at https://doi.org/10.1016/0043-1354(70)90061-8.
Wolman, M.G., 1954, A method of sampling coarse river-bed material: Eos, Transactions American Geophysical Union, v. 35, no. 6, p. 951–956, accessed November 18, 2020, at https://doi.org/10.1029/TR035i006p00951.
Wong, S.L., and Clark, B., 1976, Field determination of the critical nutrient concentrations for Cladophora in streams: Journal of the Fisheries Board of Canada, v. 33, no. 1, p. 85–92, accessed July 2021, at https://doi.org/10.1139/f76-010.
Wong, S.L., Clark, B., Kirby, M., and Kosciuw, R.F., 1978, Water temperature fluctuations and seasonal periodicity of Cladophora and Potamogeton in shallow rivers: Journal of the Fisheries Board of Canada, v. 35, no. 6, p. 866–870, accessed July 2020, at https://doi.org/10.1139/f78-138.
Woodhouse, C.A., Pederson, G.T., Morino, K., McAfee, S.A., and McCabe, G.J., 2016, Increasing influence of air temperature on upper Colorado River streamflow: Geophysical Research Letters, v. 43, no. 5, p. 2174–2181, accessed April 4, 2020, at https://doi.org/10.1002/2015GL067613.
Zuur, A.F., Ieno, E.N., and Elphick, C.S., 2010, A protocol for data exploration to avoid common statistical problems: Methods in Ecology and Evolution, v. 1, no. 1, p. 3–14, accessed January 2022, at https://doi.org/10.1111/j.2041-210X.2009.00001.x.
Conversion Factors
International System of Units to U.S. customary units
Temperature in degrees Celsius (°C) may be converted to degrees Fahrenheit (°F) as follows: °F = (1.8 × °C) + 32.
Datum
Vertical coordinate information is referenced to the North American Vertical Datum of 1988 (NAVD 88).
Horizontal coordinate information is referenced to the North American Datum of 1983 (NAD 83).
Elevation, as used in this report, refers to distance above the vertical datum.
Supplemental Information
Concentrations of biomass were given in milligrams per square meter (mg/m2). Streamflow is given in cubic feet per second (ft3/s). Water year is the 12-month period from October 1 through September 30 and is designated by the year in which it ends. Abbreviations used in graphs and captions are those used in the National Water Information System database (Ft, Fort; CO, Colorado; nr, near; ab, above; Res, Reservoir; bl, below). For an explanation of other terms refer to the U.S. Geological Survey website at https://wdr.water.usgs.gov/current/documentation.html.
Abbreviations
AIC
Akaike information criterion
CDPHE
Colorado Department of Public Health and Environment
CPW
Colorado Parks and Wildlife
D50
50th percentile or median particle size
D84
84th percentile particle size
RTK-GNSS
real-time kinematic global navigation satellite system
USGS
U.S. Geological Survey
WY
water year
<
less than
>
greater than
Suggested Citation
Day, N.K., and Henneberg, M.F., 2023, Investigation of potential factors controlling benthic algae in the upper White River Basin, Colorado, 2018–21: U.S. Geological Survey Scientific Investigations Report 2023–5009, 30 p., https://doi.org/10.3133/sir20235009.
ISSN: 2328-0328 (online)
Study Area
| Publication type | Report |
|---|---|
| Publication Subtype | USGS Numbered Series |
| Title | Investigation of potential factors controlling benthic algae in the upper White River Basin, Colorado, 2018–21 |
| Series title | Scientific Investigations Report |
| Series number | 2023-5009 |
| DOI | 10.3133/sir20235009 |
| Year Published | 2023 |
| Language | English |
| Publisher | U.S. Geological Survey |
| Publisher location | Reston, VA |
| Contributing office(s) | Colorado Water Science Center, Southwest Biological Science Center |
| Description | Report: viii, 30 p.; Data Release |
| Country | United States |
| State | Colorado |
| Other Geospatial | Upper White River Basin |
| Online Only (Y/N) | Y |
| Google Analytic Metrics | Metrics page |