

Human Factors Used to Estimate and Forecast Water Supply and Demand in the Upper Colorado River Basin
Links
- Document: Report (23.7 MB pdf) , HTML , XML
- Data Release: USGS data release— Human Factors of Water Availability in the Upper Colorado River Basin
- Download citation as: RIS | Dublin Core
Abstract
Water availability is a result of complex interactions between regional water supply and demand and underlying environmental, institutional, and economic determinants. For this study, water availability is defined as “access to a specific quantity and quality of water at a point in time and space, for a specific use, recognizing the social and economic value of water across uses and institutions that facilitate or hinder its equitable and efficient provisioning.” This report identifies the human factors that influence water supply and demand and summarizes (1) the extensive sets of data available to estimate these factors in the agricultural, municipal, and industrial water-use sectors and (2) factors of recreation and ecosystem services that influence water availability in the Upper Colorado River Basin. Lastly, future research needs are identified that can help prioritize collection and refinement of human factors of water use to improve water availability estimation and forecasting.
Introduction
The United States is facing growing challenges related to the availability of water due to shifting demographics (U.S. Census Bureau, 2021), aging water delivery infrastructure (Sedlak, 2015), and the effects of climate change (Intergovernmental Panel on Climate Change, 2021), which include flood and drought. The recently released results of the 2020 U.S. census reveal a 9-percent increase in the population living in metropolitan areas since the last census in 2010, and much of this urban growth is in the southern and western parts of the country (U.S. Census Bureau, 2021). Shifting demographics place a strain on water systems where populations are growing, where new service lines may need to be built, and where populations are declining (American Water Works Association, 2001). Declining populations place a strain on the remaining population base to fund needed infrastructure upgrades (American Water Works Association, 2001) because in most urban centers throughout the country, current infrastructure is reaching the end of its useful life (Sedlak, 2015), leading to utility price increases.
The latest Intergovernmental Panel on Climate Change report highlights the growing effect climate change is having on water resources through shifting weather patterns and increasing frequency and intensity of extreme events, stating “Continued global warming is projected to further intensify the global water cycle including its variability, global monsoon precipitation and the severity of wet and dry events” (Intergovernmental Panel on Climate Change, 2021, p. 19). Additionally, the global COVID-19 pandemic has highlighted existing inequities in access to water for drinking and sanitation across the United States and the world, with an estimated 40 percent of households globally lacking access to basic handwashing facilities (Hannah and others, 2020). These conditions make it nearly impossible for these households to follow health guidelines to frequently wash one’s hands for 20 seconds to curb the spread of the virus. As the United States grapples with these compounding water challenges, understanding the environmental and human drivers of water supply and demand is important for future management and planning.
The dynamics of water resource issues are made apparent by current challenges in water-resource management. Typical methods used to estimate water use and plan for future demand are becoming obsolete. For example, population, often used as a proxy for estimating water use, is increasing in some locations where total water use is declining (Richter and others, 2020). In 2015, the U.S. Geological Survey (USGS) reported a total of 322 billion gallons per day of water use withdrawals for the entire United States (which included a decrease of 9 percent from 2010 water-use withdrawals), and the downward trend that began in 2005 (Dieter and others, 2018b) has continued (fig. 1). Another example of the decoupling of traditional water-use estimation methods and human water-use drivers is evident in the agricultural sector. During the California drought in the mid-2010s, agricultural total water use, traditionally from surface-water sources, declined; however, total losses in economic returns were tempered by increased groundwater withdrawals for agriculture and increased production of high-value crops (Howitt and others, 2015). The transition in the source of energy generation from coal-fired powerplants, which are associated with high water use, to renewable-energy generation, which is associated with lower water use, in the Upper Colorado River Basin is another example of changing water demand.
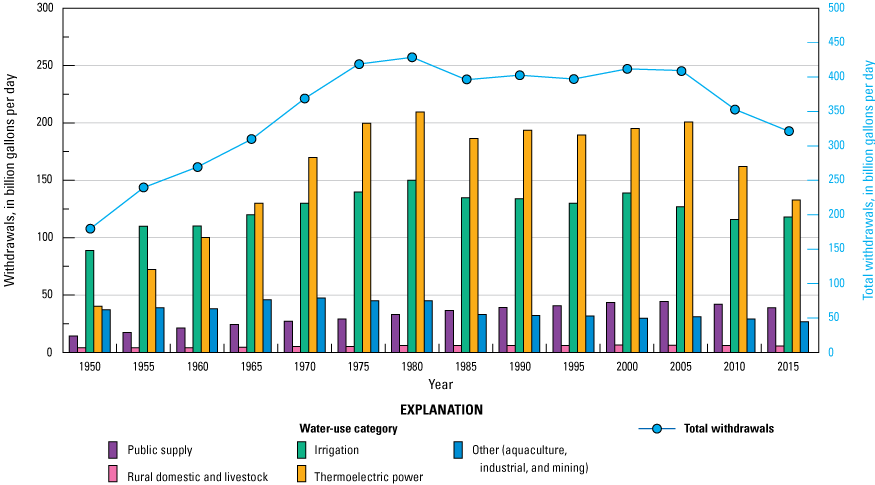
Trends in total water withdrawals by water-use category, 1950–2015 (Dieter and others, 2018b).
These examples of changing technology within water-use sectors create challenges when using traditional estimation techniques to forecast future water use. In addition to changing human water-use dynamics, the effect of climate change on hydrology and ecosystems further complicates the assessment of water availability. To improve the ability to understand water availability within a river basin and to achieve goals associated with water management, a clearer understanding of the human factors that drive water demand, and thus water availability, is needed.
The hydrologic system is increasingly recognized as a socioecological system (Linton and Budds, 2014) composed of interacting socioeconomic and biophysical systems mediated by human manipulation (Clark and others, 2015), interaction, and values. Yet, when the discipline of hydrology was coming of age, the hydrologic sciences explicitly sought to distance themselves from the human system, focusing on the physical hydrologic system in an effort to be recognized as a pure natural science (Linton and Budds, 2014). This exclusion of human dimensions has led to misinformation regarding people’s role in—and influence on—the water cycle that, in some cases, plays out in management decisions (Abbott and others, 2019). A systematic assessment of how each of these constituents (for example, socioeconomic and biophysical systems) and their interactions define the evolving state of the hydrologic system is a fundamental challenge confronting the earth and human-dimensions science communities (Vörösmarty and others, 2004).
Research on the human dimensions of water resources has increased in recent years (Hubbart, 2020). It is often undertaken by scientists using social ecological systems, integrated water resources management, and coupled natural and human systems approaches, as well as the more recently named subfield of sociohydrology. Each of these approaches, or interdisciplinary framings, provides a slightly different lens through which human interactions with the water cycle are understood and through which importance is placed on various aspects of these interactions. For example, social ecological systems, coupled natural and human systems, and sociohydrology approaches are often concerned with understanding the dynamics and interactions between human systems and natural systems (that is, the hydrological system) and do so by engaging social-science disciplines such as anthropology, sociology, and economics. Conversely, Integrated Water Resources Management is concerned with the role of policymaking in water-resources management and engages the discipline of decision science. Even with the application of these integrated frameworks, stakeholder objectives and constraints can still lead to a focus on different aspects of water-resources issues—such as water security, water scarcity, and issues of accessibility—which often take on a lens of environmental justice.
The research presented in this report is part of a larger initiative within the USGS Water Resources Mission Area (WMA) to conduct integrated water science that encompasses the human components as well as the hydrological and ecological components of the water cycle. The USGS WMA has adopted the term “water availability” to describe the key question integrated water science seeks to answer: How much water is available in terms of quantity and quality for humans and the environment? This report will use the term “water availability” to mean “access to a specific quantity and quality of water at a point in time and space, for a specific use, recognizing the social and economic value of water across uses and institutions that facilitate or hinder its equitable and efficient provisioning.” The intent is for the term “water availability” to be as inclusive as possible, encompassing issues related to the sustainable, equitable, and efficient management of water resources. While this definition of water availability presents an inclusive and integrated system, both in time and space, this level of inclusivity is a management challenge in river basins where determinants of water availability (which may be internal or external to the basin) are increasing in variation due to climate-driven changes in the supply of, and demand for, water resources.
Human interactions with the water cycle, including how water supply is managed and the various drivers of demand, are mediated by human institutions. Institutions provide structure to human conduct in political, social, and economic life and have been defined broadly as “stable, valued, and recurring patterns of behavior” (Huntington, 2006, p. 12). According to Jaeger (2015), these “intangible tools” that shape individual and collective human behavior include “any and all rules—both formal and informal institutions—that influence behavior. This classification thus includes the U.S. Constitution, property rights, regulations, and common law, as well as social conventions, codes of conduct, norms and moral rules” (Jaeger, 2015, p. 13). Thus, the informal institutions most of us encounter in our everyday lives include family, religion, peer groups, language, and the educational system. Formal institutions rise from informal institutions as the informal “stable, valued and recurring patterns of behavior” (Huntington, 2006, p. 12) become codified. Water institutions can be formal, such as water management boards, or informal, such as the integrated systems of rules that structure social interactions between such management boards and other governing and social structures of the specific culture (Hodgson, 2017). The cultural norms that surround a society’s relationship with water are also informal institutions. This can include cultural norms about water use and reuse or about how water is valued for recreation or for spiritual and religious purposes, such as the use of holy water in the Catholic Church. Water governance is composed of formal and informal institutions, such as the informal institution of fairness that guides formal policymaking for sharing surface waters in interstate river basins.
The economic system in the United States is composed of various formal and informal institutions that affect water supply and demand. The economic supply of water is a function of the cost associated with the extraction (such as groundwater pumping), storage, conveyance, and treatment of water for use in various sectors. These costs are context specific and may differ based on the quality and quantity of the water required by the intended recipient. For example, the natural variability of the hydrology in a basin may require storage facilities to supply agricultural production during the growing season. Groundwater depth, quality, or the engineering and energy requirements to convey water of a certain quality over short or long distances is dependent on the physical and human geography of a basin and on the end-user requirements. These considerations make the economic supply of water very site specific and dependent on both temporal and spatial scales and on the end user of the water.
Given the inherent complexity of socioecological systems, a stronger integration of the human dimensions of water resources with our hydrologic understanding would improve our ability to assess and forecast water availability. Inherent complexity includes factors such as the values, governance, and norms that underlie water policy and management, including the needs and tradeoffs among important water-use sectors (National Academies of Science, 2018). Improved ability to assess and forecast water availability may lead to improved water-resources management. The Colorado River, the lifeblood of the Southwestern United States, is currently experiencing a megadrought (Williams and others, 2020), bringing into sharp focus the potential that the river cannot continue to provide water for all current users into the future. This highlights the benefits of comprehensive and integrated science to guide management decisions. The upper portion of the Colorado River Basin has been chosen as a focus area for WMA integrated water science. This report describes the results of an extensive review of the most salient human factors and determinants driving water demand, and thus water availability, in the Upper Colorado River Basin, followed by a brief discussion of gaps in our understanding and areas that could be the focus of USGS WMA data-collection efforts in the future.
Study Area
The Colorado River is one of the most important sources of water in the Western United States, characterized by its natural beauty; diverse ecosystems; rigorous and complex management; importance for agricultural, municipal, and industrial water supplies; recreation; fish and wildlife habitat; and hydropower production. Located in the Southwestern United States, the Colorado River Basin covers an area of 246,000 square miles (mi2) and spans approximately 1,450 miles in length. The river originates from a small lake, La Poudre Pass Lake, located in Rocky Mountain National Park along the Continental Divide in Colorado and exits at the Gulf of California in Mexico (fig. 2). Colorado River water serves areas inside and outside the basin including parts of Arizona, California, Colorado, New Mexico, Nevada, Utah, Wyoming, and Mexico. In addition, the Colorado River is near or flows through lands of 22 federally recognized Tribes, 7 national wildlife refuges, 4 national recreation areas, and 11 national parks (Bureau of Reclamation, 2012a). The portions of these lands located in the Upper Colorado River Basin are shown in figure 3.
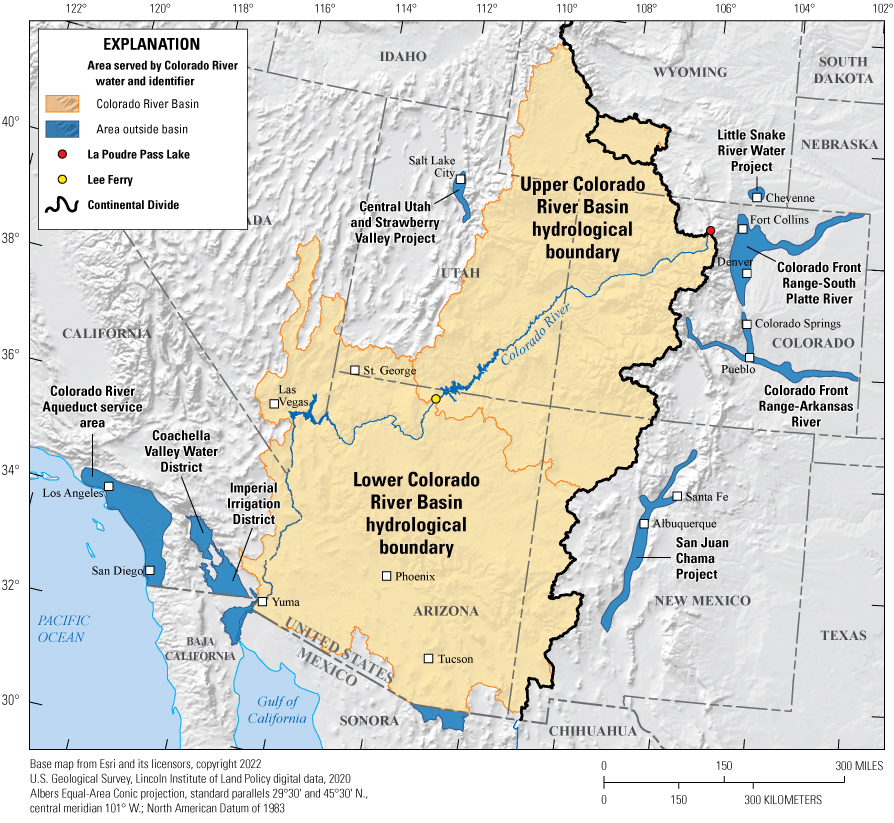
The Colorado River Basin and the areas served by Colorado River water.
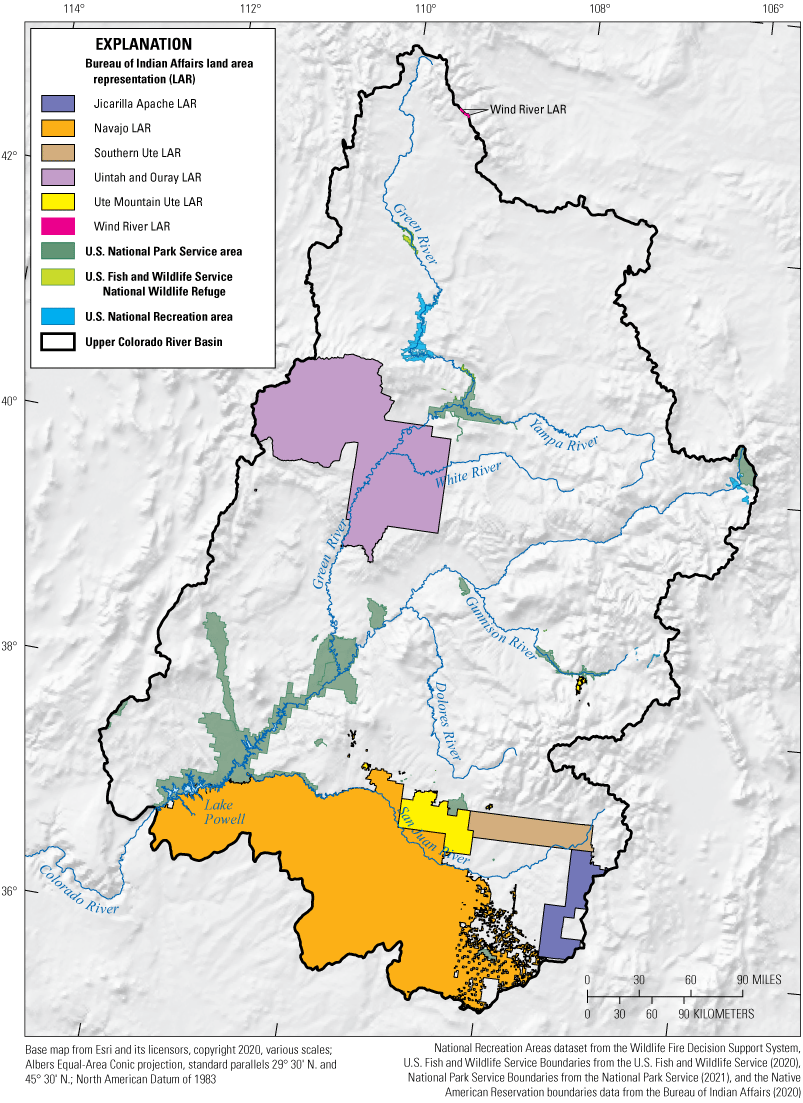
The Colorado River as it flows through a series of Native American Reservations and federally managed recreation lands and lands reserved for wildlife.
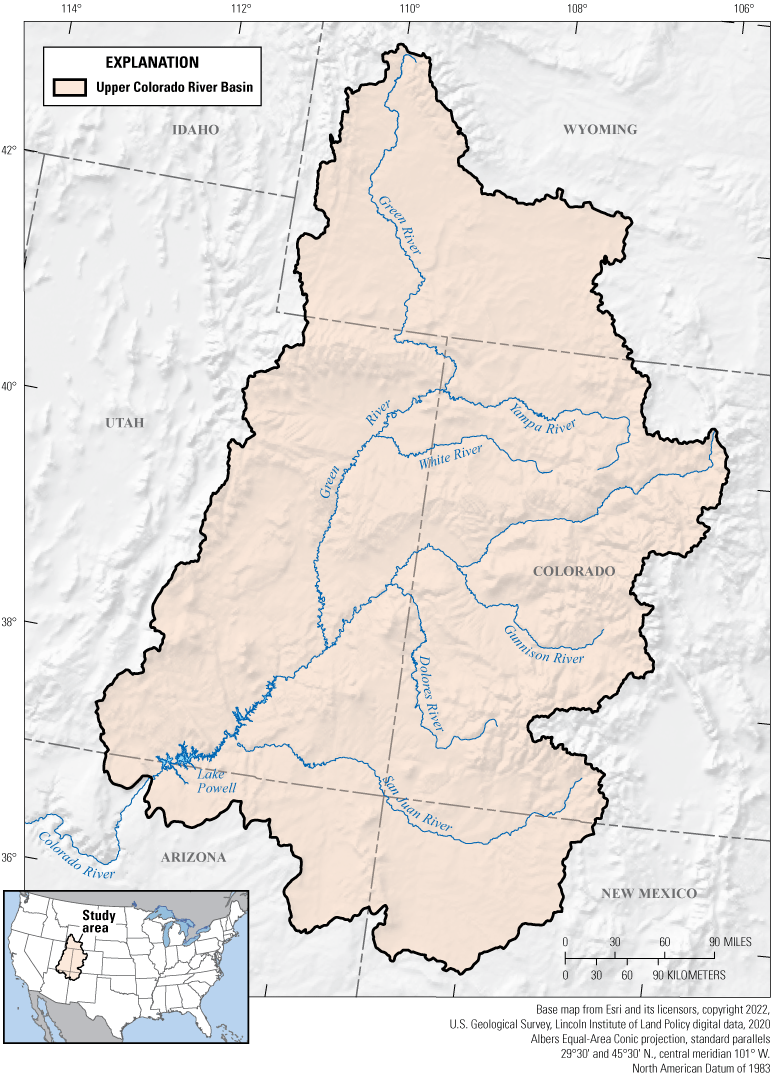
Extent of the Upper Colorado River Basin and selected major rivers.
The Colorado River is fed by numerous tributaries, including the Green River, San Juan River, Yampa River, and Gunnison River, (fig. 4). The Colorado River Basin was divided into the Upper Basin and Lower Basin (fig. 2) by the 1922 Colorado River Compact (hereinafter, 1922 compact), with the dividing line at Lee Ferry just below Glen Canyon Dam near the Arizona-Utah border. The Upper Basin is in parts of Arizona, Colorado, New Mexico, Utah, and Wyoming, and the Lower Basin is in parts of Arizona, California, Nevada, New Mexico, and Utah. The 1922 compact apportioned each basin the exclusive beneficial consumptive use of 7.5 million acre-feet per year (maf/yr), with the Lower Basin able to increase their beneficial consumptive use by 1 maf/yr, and the remaining water surplus left for apportionment to Mexico (Kuhn and Fleck, 2019). The 1922 compact was made while awaiting a treaty with Mexico, which came in 1944. Although the focus of this report is the Upper Colorado River Basin (fig. 4), information is sometimes given for the entire Colorado River Basin because of data constraints.
Climate and Hydrology
The Upper Colorado River Basin features a dynamic, variable, and diverse range of ecosystems, landscapes, vegetation, climates, and wildlife across an elevation range of 3,241–12,205 feet (Miller and others, 2016). The climate of the Upper Colorado River Basin is largely arid and semi-arid and is composed of rangelands, deserts, and grasslands, as well as high-elevation alpine areas. Average annual precipitation in the Upper Colorado River Basin is 14.57 inches (range = 4.84–71.10 inches), and average annual temperature is 7.78 degrees Celsius (range = −3.7–15.86 degrees Celsius; fig. 5; data from PRISM Climate Group, Oregon State University, 2021). The spatial extent of the area with the greatest precipitation is minimal in the Upper Colorado River Basin as shown in figure 5, 85 percent of the overall annual runoff for the entire Colorado River Basin originates in 15 percent of the watershed located in the Upper Basin (Lukas and Harding, 2020).
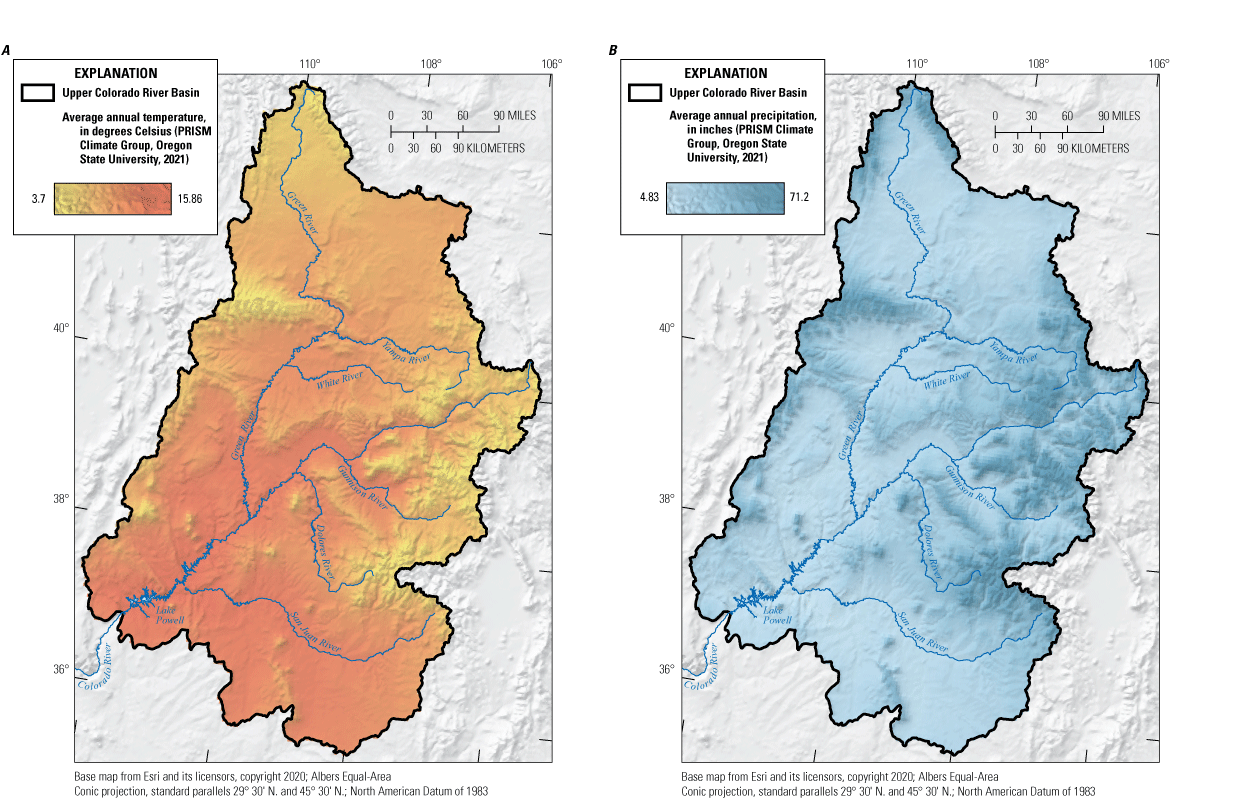
Average annual A, temperature and B, precipitation in the Upper Colorado River Basin, 1981–2010.
Runoff and streamflow in the Colorado River Basin vary considerably each year because of variability in climatic conditions and precipitation. Annual streamflow over the observed record from 1906 to 2007 ranged from a minimum of 5.5 maf to a maximum of 25.5 maf, with an average of 15.0 maf (Bureau of Reclamation, 2012a). Historically, the flow in the Colorado River reaches its maximum during the months of April through July, although climate change and drought are causing a shift to earlier runoff peaks (Bureau of Reclamation, 2021). Furthermore, a persistent warming trend has been observed in the Colorado River Basin. A 2020 report found that “the average [air] temperature since 2000 has been 2.0 [degrees Fahrenheit] °F warmer than the 20th-century average” (Lukas and Payton, 2020, p. 73). These trends indicate that temperatures in the Colorado River Basin will continue to increase, occurring concurrently with more frequent and severe drought, a decline in spring and summer streamflow, and reduced snowpack as precipitation increasingly comes as rain instead of snow. These shifts have potentially extensive implications for water use in the basin as the timing of available water would no longer match the timing of when water is needed for irrigation.
Management of the Colorado River Basin
The Colorado River is regarded as one of the most regulated, controlled, and institutionally encompassed rivers in the world (Bureau of Reclamation, 2002). Governance of the Colorado River is collectively referred to as the “Law of the River”: a combination of interstate compacts, State and Federal laws, international treaties and agreements with Mexico, Supreme Court decrees, contracts, Federal and State administrative agency decisions, and agreements with Tribal Nations (for more information on the Law of the River see Bureau of Reclamation, 2015a). Negotiated by the seven basin States and the Federal government, the Colorado River Compact delineated the Upper Basin and Lower Basin. Each basin was apportioned 7.5 maf of river water annually for beneficial consumptive use, and the Lower Basin was granted the right to increase its beneficial consumptive use by an additional 1 maf /yr (Kuhn and Fleck, 2019). Furthermore, the compact required the Upper Basin to not deplete more than a total of 75 maf over any 10-year period in order to safeguard against periods of low streamflow.
In the Upper Basin, water apportionments among States were established by the 1948 Upper Colorado River Basin Compact, which provided for percentage-based annual allocations of water. As the State where the largest share of runoff originates, Colorado received the largest share at 51.25 percent; 23 percent goes to Utah, 14 percent to Wyoming, 11.25 percent to New Mexico, and, recognizing that a small portion of Arizona is located in the Upper Basin, 50,000 acre-feet are allocated to Arizona as opposed to a percentage (Stern and Sheikh, 2021). Water allocations in the Upper Basin are administered by the Upper Colorado River Commission, an interstate water administrative agency tasked with (1) ensuring the appropriate allocation of water to the Upper Basin States, (2) ensuring compliance with delivery obligations to the Lower Basin States under the 1922 compact, and (3) establishing procedures in the event of a curtailment of water use.
In the Colorado River Basin, most water rights are guided by the Prior Appropriation Doctrine, including rights in Arizona, Colorado, Nevada, New Mexico, Utah, and Wyoming. Appropriative water rights are entitlements to a specific amount of water, for a specified use, at a specific location, and with a definite date of priority. Two principles guide appropriative rights, the first being the principle of “first in time, first in right,” in which the date a water right is established determines who receives water first in times of shortage. The second principle is “use it or lose it,” in which water-rights holders must use the water as prescribed (and for beneficial use) or lose all or part of the right due to abandonment or non-use (Western Governors Association, 2012).
In addition, Tribal Nations and Federal agencies possess Federal reserved water rights that hold senior priority as present perfected rights and Tribal water rights, both of which predate the 1922 compact, making them the most senior water rights. Perfected rights refer to those water rights acquired in accordance with State law and exercised by the actual diversion of a specific quantity of water that has been applied to a defined area of land or to definite municipal or industrial works (Schutz, 2012). Article VIII of the Colorado River Compact states that “Present perfected rights to the beneficial use of water of the Colorado River System are unimpaired by this compact” (Bureau of Reclamation, 1922). Tribal water rights are defined as federally reserved water rights and were established by the case Winters v. United States in 1908. These rights generally operate as present perfected rights as “[present perfected rights] shall include water rights created by reservation of mainstream water for the use of [F]ederal establishments under [F]ederal law whether or not the water has been applied to beneficial use” (Schutz, 2012, p. 382). Thus, under the Colorado River Compact, Tribal water rights have priority either with the establishment of a reservation or since time immemorial.
In the Colorado River Basin, 22 federally recognized Tribes collectively possess rights to 2.9 maf of water per year, with an additional 13 Tribes reserving water rights claims that are unresolved (Stern and Sheikh, 2021). Notably, all these rights have not been fully used and allocated. The development of Tribal water rights will have a significant effect on water allocation in the Colorado River Basin and is an important consideration in the assessment of water availability. Integration of Tribal development and management will require coordination and cooperation among stakeholders within the Colorado River Basin (Bureau of Reclamation, 2018).
The individual States and Tribes of the Upper Colorado River Basin serve as the primary administrators for water resources and are responsible for the resources’ appropriation, allocation, development, conservation, and protection. Although overall governance of the Colorado River is dealt with through interstate compacts and commissions, along with Federal government participation, States and localities regulate most of the water within their borders. Water rights that are allocated to users within each of the States operate under State and Federal law. Generally, water rights granted to users are counted towards the overall compact allocation of the State in which the use occurs.
Most basin States, excluding Colorado, use an administrative State agency permit system. In this system, the State has a water-resources agency that is responsible for the appropriation, distribution, and adjudication of water rights and monitors water supply and use. These agencies are led by the State Engineer, who issues permits and administers the State’s water resources. Colorado uses a unitary administration system for water rights, in which permits are issued through the Water Court rather than by the State Engineer. Colorado’s Water Courts have jurisdiction over water-rights applications, the use and administration of water, and all other water matters within their jurisdiction. The State Engineer performs the actual administration of water rights as determined by the court, conducts technical analysis of water cases, and addresses any issues with water-rights applications or enforcement.
Water transfers are the primary method used to change water allocations among States or basins. A water transfer is the legal transfer of water rights from one user or use to another. In the Colorado River Basin, nearly all water rights have been appropriated; thus, most transfers occur when an existing right is sold or reallocated. Interbasin and interstate changes to water allocations are typically approved by the appropriate State authority, although substantial changes to water allocations among States or major users could require interstate compacts, judicial adjudication, or the formation of new contracts with the Bureau of Reclamation.
Supply
An elaborate system of dams (fig. 6), reservoirs, levees, canals, aqueducts, tunnels, pumping stations, penstocks, pipes, and ditches regulate, manage, and control the flow and operation of the Colorado River. Collectively, the Colorado River Basin’s physical infrastructure can store 60 maf of water and generate up to 4,200 megawatts of hydroelectric power per year (Stern and Sheikh, 2021). The Bureau of Reclamation is the primary manager of water operations and supplies along the Colorado River and is responsible for the construction and operation of most of the larger water-control structures on the Colorado River, notably Hoover Dam and Glen Canyon Dam. In addition, the Bureau of Reclamation manages the Flaming Gorge Dam in Utah, Wayne N. Aspinall Unit in Colorado, Navajo Dam in New Mexico, Davis Dam in Arizona and Nevada, and the Parker and Imperial Diversion Dams in Arizona and California (fig. 6). Other projects and facilities along the Colorado River include the Colorado-Big Thompson Project, Central Utah Project, Central Arizona Project, Salt River Project, All-American Canal, and Morelos Diversion Dam (see appendix 2 for more information on Bureau of Reclamation projects). Many of these facilities and projects provide transbasin diversions (fig. 7) that serve water supplies to areas located outside of the Colorado River Basin (table 1).
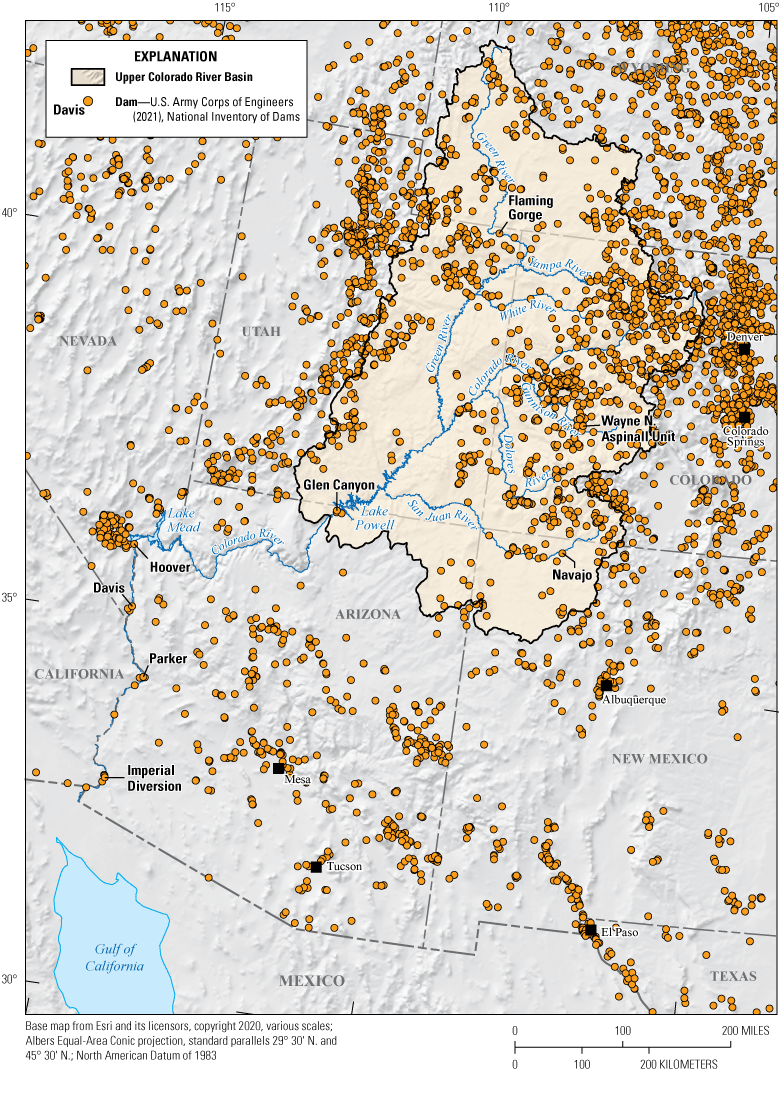
Locations of dams in the Upper Colorado River Basin and surrounding areas (U.S. Army Corps of Engineers, 2021).
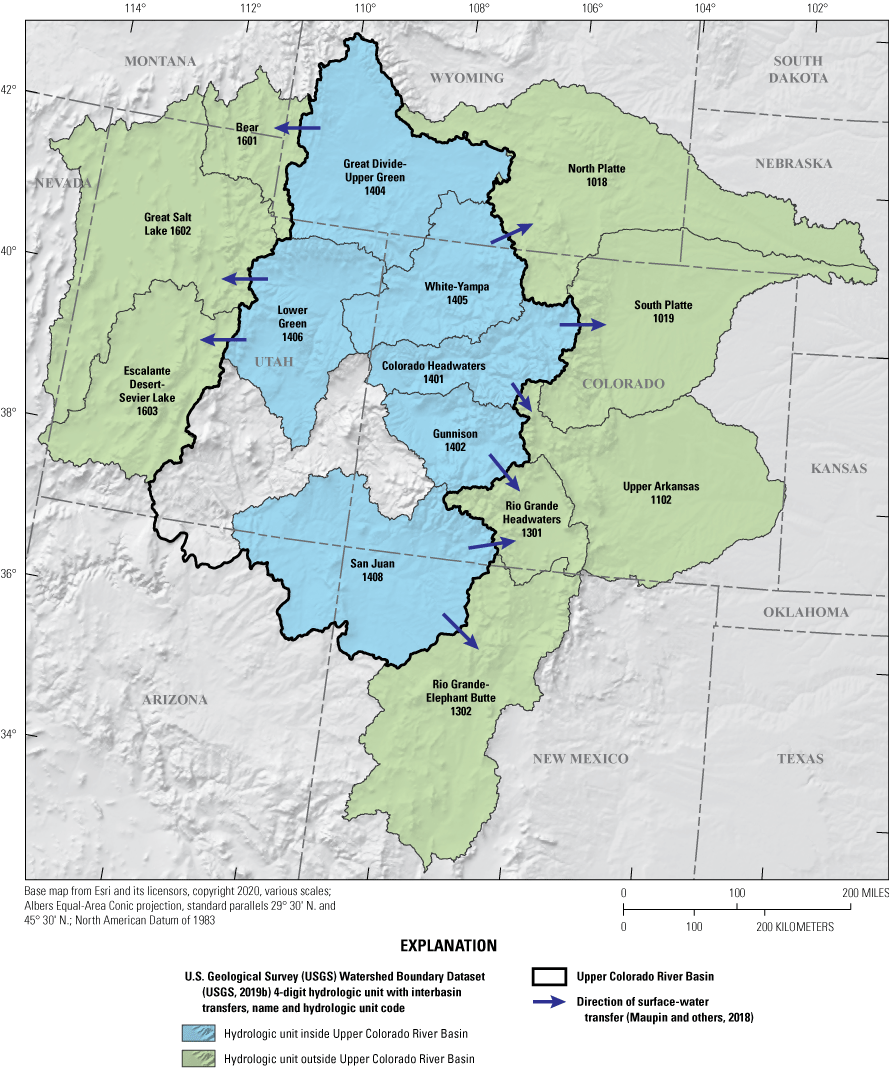
Four-digit hydrologic units (second-level subregions) and interbasin transfers from within the Upper Colorado River Basin to other four-digit hydrologic units outside the basin.
Table 1.
Average water transfer rate in cubic meters per day, summarized by State and grouped by Upper or Lower Basin depending on location of transfer.[Transfers where data are not available shown with – (Siddik and others, 2022)]
Glen Canyon Dam, located in northern Arizona, was completed in 1963. The dam forms Lake Powell, which has a storage capacity of 26.2 maf. Glen Canyon Dam serves as the principal water-storage unit of the Colorado River Storage Project. The dam’s functions are to store and regulate flows from the Upper Basin to the Lower Basin and generate electric power. The dam has the ability to produce more than 4.5 billion kilowatthours annually (Bureau of Reclamation, 2023) that provide electricity to millions of people in the Upper Basin States. Lake Powell is utilized as a “bank account” of water that provides long-term water storage to be drawn upon during dry periods and drought. A variety of groundwater resources and some reclaimed water resources are also used throughout the Upper Colorado River Basin in various sectors; however, these resources are not managed by the Law of the River, which is only concerned with surface water.
Demand
The USGS WMA Water Use Science Program, in cooperation with local, State, and Federal agencies, summarizes human water use in specific water-use categories in the United States every 5 years at the county level and has done so since 1950 (Dieter and others, 2018b). Total withdrawals for agriculture dominate the overall water-use categories of the Upper Colorado River Basin States (figs. 8, 9; table 2).
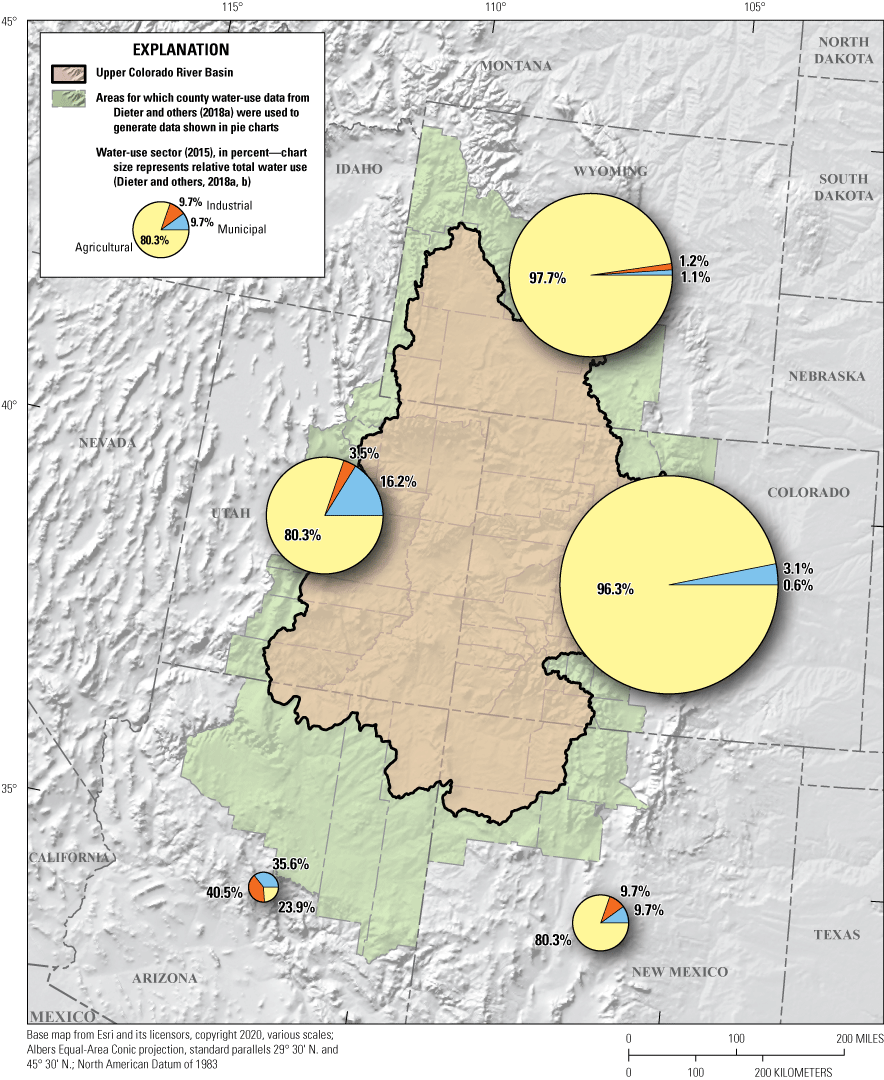
Percentages of water withdrawals by water-use sector for counties intersecting the Upper Colorado River Basin, 2015 (Dieter and others, 2018b).
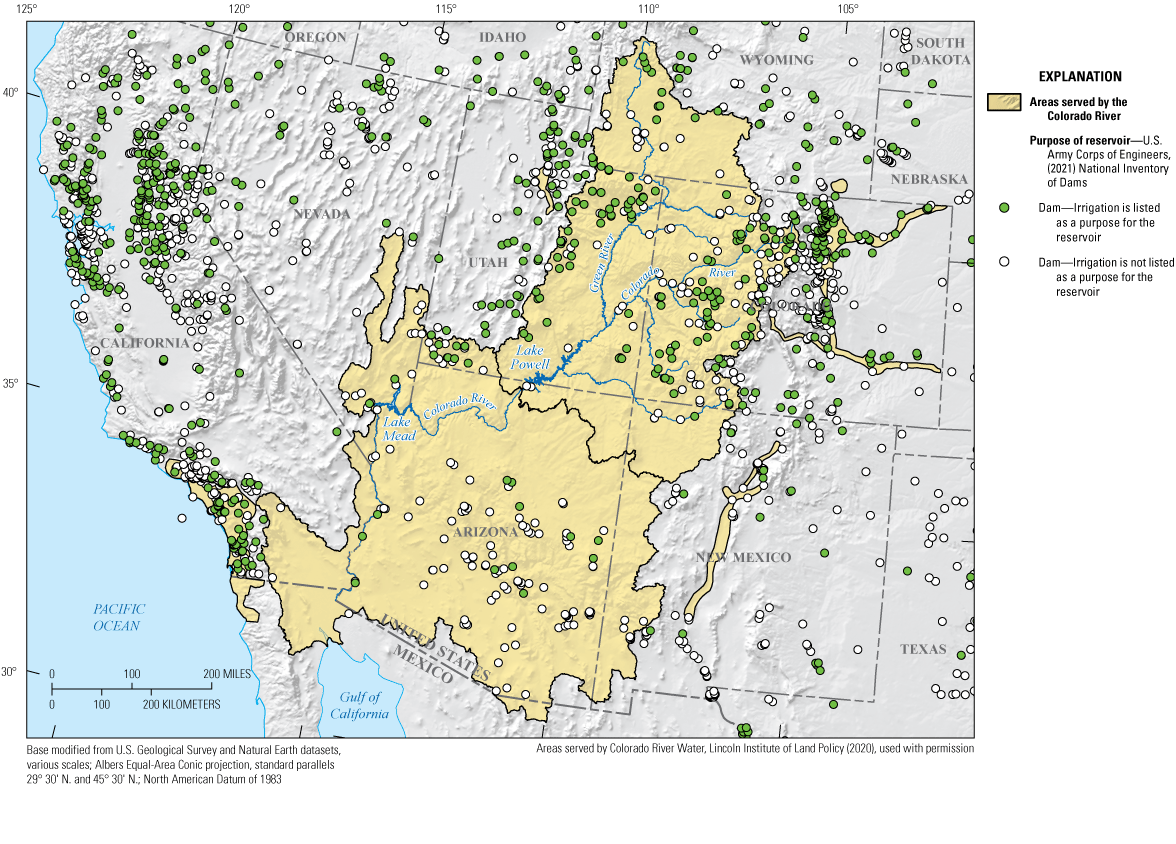
Locations of dams and reservoirs in the Western United States and whether irrigation is one of the purposes for the reservoir.
Table 2.
Water withdrawals aggregated for agricultural, municipal, and industrial sectors, for each State within the Upper Colorado River Basin, 2015 (Dieter and others, 2018b).[All values in million gallons per day; the U.S. Geological Survey (USGS) Water Use Science Program categories of Irrigation, Livestock, and Aquaculture were combined to create the agricultural water-use sector. The USGS Water Use Program categories of Public Supply and Domestic were combined to create the municipal water-use sector. The USGS Water Use Program categories of Industrial, Mining, and Thermoelectric were combined to create the Industrial water-use Sector. Values from appendix 4 may not sum to these totals because of independent rounding]
Agriculture
Agriculture is the primary water-use sector for Colorado River water. Approximately 70 percent of Colorado River water is used to support agriculture, irrigating nearly 4.5 million acres of land in both the Upper and Lower Basins. These lands produce 15 percent of the Nation’s crops and 13 percent of its livestock (Bureau of Reclamation, 2012a). Agricultural production in the Colorado River Basin is vital to local, State, and the national economy, generating upwards of $5 billion in sales annually (Fonseca and Naishadham, 2023). Agriculture in the Upper Basin includes pasture for cattle and alfalfa production, with limited higher value agricultural production in the Grand Valley of Colorado and northern New Mexico. The annual consumptive use of Colorado River water by agriculture is relatively stable, ranging from 7 to 9 maf/yr, with an average of 8 maf/yr since about 1980 (Bureau of Reclamation, 2015b). Likewise, the acreage receiving water has remained relatively constant. Despite the stability of water use and acreage, agricultural productivity has increased by about 25 percent since 1980 as a result of improvements in crop varieties, water management, and cropping patterns (Bureau of Reclamation, 2015b).
Municipal and Industrial Development
Nearly 40 million people in the 7 basin States and Mexico rely on Colorado River water to meet municipal water needs (Bureau of Reclamation, 2012a). Major metropolitan areas, including Albuquerque, Denver, Las Vegas, Los Angeles, Phoenix, Salt Lake City, and San Diego, most of which are located outside of the Colorado River Basin, depend on Colorado River water to sustain and grow their communities and economies (Bureau of Reclamation, 2015b). The rapid and sustained development in the Colorado River Basin and surrounding areas complicates Colorado River management. The West is the fastest growing region in the United States in terms of population, with Nevada, Utah, and Colorado ranking among the top 10 fastest growing States in the country (Henderson, 2021). By 2060, the population of the Colorado River Basin and surrounding areas could range between 49 and 77 million people (Bureau of Reclamation, 2012b).
About 27 percent of Colorado River water is used to meet municipal and industrial demands. Residential water use, including outdoor uses, accounts for the largest percentage of overall municipal and industrial usage, ranging from 55 to 80 percent depending on the population, climate, and geography of the metropolitan area (Bureau of Reclamation, 2015b). Municipal and industrial water use has remained stable or decreased since 2000 due to economic downturns, drought, water-conservation programs, shifts in water efficiency methods and urban planning, and the increase in the price of water. However, municipal and industrial demand is expected to increase to between 33 and 38 percent of total Colorado River demand in 2060 as a result of population growth (Bureau of Reclamation, 2012b).
Additional Water Uses
Colorado River water generates $1.4 trillion in annual economic activity and 16 million jobs in the basin States, including a thriving recreation and tourism industry (James and others, 2014). Outdoor recreation, including hiking, fishing, wildlife viewing, boating, biking, and camping, draws millions of visitors per year to the national and State parks, national forests, national recreation areas, and Federal lands within the Colorado River Basin. In addition, Colorado River water contributes to important environmental uses, such as providing riparian habitat for wildlife and endangered fish species, maintaining water quality and stream flows, and supporting natural landscapes that recreational resources depend upon.
Project Objectives and Scope
The USGS WMA has prioritized integrated water science through core programmatic monitoring, research, assessment, and ultimately prediction initiatives, bringing multiple disciplinary perspectives and tools to bear on the issue of water availability. To contribute to integrated water science, this project seeks to incorporate human interactions with water into WMA research, assessment, and prediction initiatives. The specific objectives of this project are to identify cultural factors and economic determinants of water demand, supply, and access and to locate associated datasets of those factors and determinants. Determinants of water supply and demand occur at various scales inside and outside of a basin. These include institutional frameworks, such as water rights and other government policy, that are aimed at the equitable and efficient allocation of water and individual sector-level decisions related to water use.
This report focuses on the elements of institutional design and sector-level decisions that are directly related to the demand for water resources within a basin. For example, water use in the residential sector is partially determined by household income and other socioeconomic characteristics, but these determinants are also influenced by broader demographic and economic forces. The same is true for institutional determinants of water supply and demand. Some regional-level institutions may limit the allocation of water resources (for example, an irrigation district), but water allocation within a basin may also be governed by basin-wide compacts. Figure 10 illustrates this conceptual model of water availability, including the drivers of water availability and the institutional and sectoral factors that drive supply and demand of water resources. Model systems typically focus on estimating the determinants of demand, while holding institutional factors constant (House-Peters and Chang, 2011). Although climate and its influence on hydrology are important components of water availability, this study focuses only on the components of the human system (fig. 10).
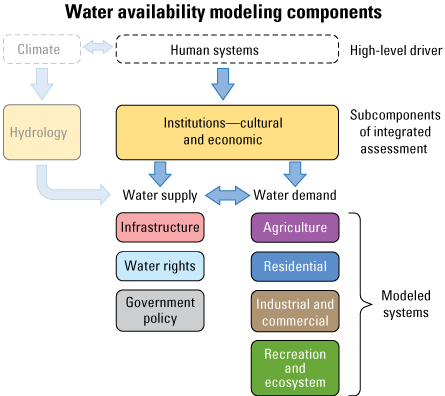
Water availability modeling components. The focus of this study is on the human systems as one of two high-level drivers of water availability. The subcomponents of the human system—cultural and economic institutions—are the general framework for an integrated assessment of water availability. These two components shape factors of supply and demand in the human system.
Although this report focuses on demand for water resources, determinants of water supply warrant mentioning. The determinants of water supply are similar across sectors. The allocations of water in the municipal, agricultural, or industrial sectors face the same environmental, institutional, and economic factors. These human factors are specific to local, regional, State, and basin institutions, such as water rights, the ability to transfer water across sectors, and the capacity to fund and operate water-supply infrastructure. The economic factors of water supply are also specific to local, regional, State, and basin conditions. Organizations delivering water from its source to an end user are confronted with the same engineering and economic factors as any other institution. Therefore, we do not identify a specific data source for information related to the determinants of water supply in this report and do not differentiate between sources of water (that is, groundwater versus surface-water sources) except in relation to the Law of the River, which deals exclusively with surface water.
Within each water-use sector, determinants of water demand are a complex mix of environmental, institutional, and economic factors. A deeper understanding of these factors and determinants would improve the understanding of water availability within a river basin and help water managers reach goals. In the following sections, the fundamental determinants of water demand reported in the literature are described by water-use sector. While environmental determinants are not discussed in detail, primary factors are mentioned.
Methods
The most salient human factors and social and economic determinants of water availability, as well as existing data sources on those factors, were identified through a literature review. First, the project team identified a list of keywords (appendix 1) that were then used to query several online literature citation databases through a software tool called Publish or Perish and a second source of gray literature, a digital library called GeoDeepDive. Up to 1,000 results were saved from each keyword set and source, and the results were merged and imported into an online tool that facilitates sharing citation data among the project team. The initial results were noisy and contained several irrelevant and duplicate articles.
To reduce the noise, a second search was conducted with a reduced number of results allowed per source (for a maximum of 100 results per keyword set and source), after which the results were deduplicated by using the title of the publication across the results from each keyword set using custom R scripts (see appendix 1 for more information and links to the scripts). The script reads all the comma-delimited citation data from each search term and source, removes non-American Standard Code for Information Interchange (ASCII) characters, merges the individual source files into an in-memory data frame, then loops through and removes duplicates from the result files by using the title of the citation. Keywords were also refined to a set of three different combination sets (appendix 1). Even with using these new keyword sets and returning fewer results, many irrelevant articles were still in the output for each set of keywords. To further eliminate irrelevant articles, the results returned for each keyword set were reduced to 10 and only Publish or Perish searching the online literature databases of Google Scholar, Web of Science, and Scopus sources were used for results, eliminating GeoDeepDive.
After limiting the results to 10 and deduplicating the results from the three sources by using the R script, a much more relevant set of articles was obtained for review to identify human factors of water availability. These articles were divided among the research team and were reviewed for salient human factors, social and economic determinants of water availability, and identification of associated data sources. Initially, the research team sought to identify specific types of factors and determinants (for example, sociocultural and governance factors or economic and institutional determinants). However, after a portion of the literature was reviewed, it became clear that existing research on this topic was grouped into societal sectors as opposed to types of factors (that is, economic or social). Thus, results of the literature review were reorganized into sectors with the salient factors and determinants identified for each sector.
The sectors used in this report are different from those used in the USGS WMA Water Use Science Program, which, in cooperation with local, State, and Federal agencies, summarizes human water use in specific water-use categories in the United States every 5 years at the county level and has done so since 1950 (Dieter and others, 2018b). Current USGS water-use categories include public supply, self-supplied, domestic, irrigation, livestock, aquaculture, industrial, mining, and thermoelectric (see Glossary). Cultural or institutional factors of water availability are overarching within a geographic region, and formal or informal institutional factors of water supply and demand may influence multiple water-use categories in similar ways. The water-use categories currently used by the Water Use Science Program are ultimately connected with water source, accounting for groundwater and surface water separately and considering household water use with water from a domestic well separately from household use from a municipal source. For example, the USGS WMA Water Use Science Program municipal water category includes all water supplied by a municipal source, whether the water is used in a household or commercial setting; however, drivers of water use in each of these settings may be very different. Therefore, instead of using water-use categories from the Water Use Science Program, this report divides results into the water-use sectors of agricultural, residential, industrial and commercial, and recreational uses, which include water necessary to support ecosystem function (fig. 11).
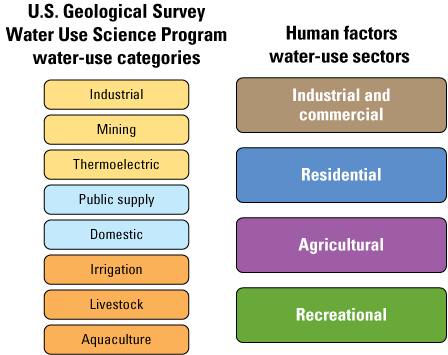
U.S. Geological Survey Water Use Science Program categories in comparison to human factors water-use sectors.
Spatial data were collected to develop the figures presented throughout this report and to identify the geographic dimensions of human factors and determinants of water availability. Geospatial data related to salient human factors and determinants of water availability in each aggregated sector identified through the literature review were located online by searching through open data catalogs and State websites. Detailed methods describing geospatial data analysis used to create each figure can be found in appendix 6.
Results of Determinants Used to Estimate Water Demand
Agricultural Sector
Although environmental factors place the largest constraints on agricultural production in the Upper Colorado River Basin, demand for agricultural water is also determined by institutional and economic factors (table 3). Several limiting environmental factors determine demand for water use in agricultural production, including slope, soil permeability, average temperatures, average precipitation, and average number of frost-free days, all of which can influence the demand for water in the agricultural sector (Schoengold and others, 2006). Climatic environmental determinants such as temperature and precipitation are variable but, over time (for example, decades), are considered fixed; however, the expected values of environmental determinants may shift or increase in variation due to the changing climate. A change in climatic conditions could influence consumptive use by crop type and land-allocation decisions made by agricultural producers, thus altering estimates of total demand for water. Environmental determinants regulate crop type, total consumptive use by crop, and influence hydrology (that is, return flows to surface water and groundwater). Even though this report does not give specific details about environmental determinants of demand, our ability to predict future water availability is directly related to these determinants.
Table 3.
Human determinants used to estimate and forecast agricultural water demand in the Upper Colorado River Basin.Formal institutional determinants of demand at the level of the individual agricultural producer are limited. However, demand may be partially influenced by irrigation-district rules and polices. In the Western United States most agricultural producers receive all or part of their annual irrigation water supply from irrigation districts. Irrigation districts are cooperative, self-governing public corporations set up as a subdivision of a State government and are created under the authority of a State legislature, with the consent of a designated fraction of the landowners or citizens. Irrigation districts have defined geographic boundaries and have taxing power to obtain and distribute water for the irrigation of lands within the district (Hutson and others, 2004). The locations of irrigation districts in the Upper Colorado River Basin are shown on figure 12.
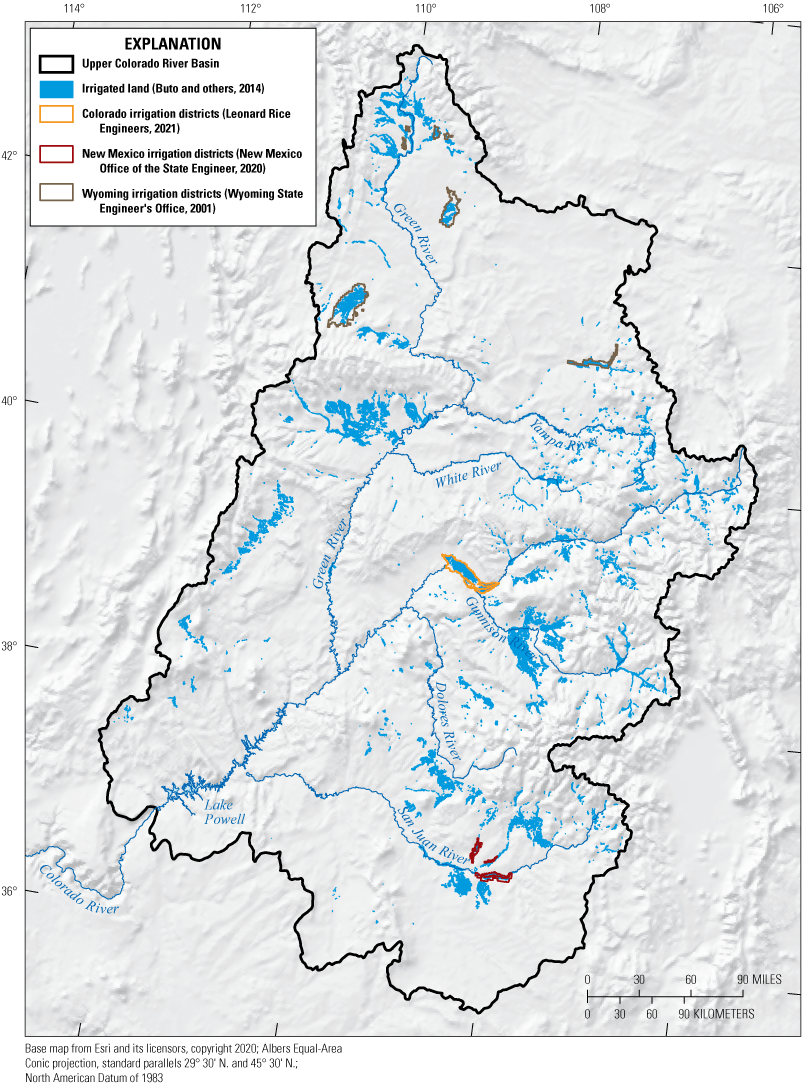
Irrigation districts in the Upper Colorado River Basin.
Irrigation districts often place restrictions on transfers within or out of an irrigation district. These restrictions are intended to maintain stability in the overall agricultural economy, but they also affect the aggregate demand for water use. Additionally, the “use it or lose it” principle of prior appropriation can penalize agricultural producers for engaging in deficit irrigation for a period of time by reducing the transferable yield in any potential future change-of-water-rights case (Colorado Water Conservation Board, 2015), which creates a disincentive to adopting this practice. In Colorado, partial relief to this problem was created in the Colorado Revised Statutes, allowing for consumptive use reductions without affecting historical consumptive use calculations if water use is under a conservation plan (Colorado Water Conservation Board, 2015).
The fundamental economic determinant of agricultural demand for water is the price of water (Scheierling and others, 2006; Schoengold and others, 2006), which is set by the irrigation district. Demand for water in agriculture is derived from its economic value in production (Gibbons, 1986; Scheierling and others, 2006), and this is true for irrigated agriculture as well as livestock and aquaculture operations. Therefore, the quantity of water demanded is profit maximizing, where the marginal cost of an additional quantity of water is equal to the marginal economic benefit of production. The price of water, the price of inputs (such as fuel or labor), and the revenue from production are all important factors in decisions agricultural producers make to maximize their returns from production. This is true of short- and long-term decisions such as changing irrigation schedules or investing in infrastructure to implementing new irrigation technology, respectively.
The price elasticity of water (the change in demand associated with an increase in price) is relatively inelastic in agriculture. Therefore, changes in input costs (labor or fuel), the cost of infrastructure (also referred to as capital or fixed costs) or expected revenues may have a larger effect on agricultural water demand than a change in the price of water. This is especially true in the short run. Depending on the specifics of production practices and crop type, however, agricultural producers may vary the quantity of water used in response to changes in price in the short run. These short-run changes may include deficit irrigation (decreasing yield) or more intensive management of irrigation scheduling. In the long run, price increases may drive agricultural producers to adjust irrigation technologies, crop type, or area of production. For example, relatively low-productivity land may be fallowed if the price of water increases. The increasing price of water may also lead to a shift toward higher value crops, where the demand for water is relatively insensitive to price. These factors all determine the aggregate land allocation in production, crop type, and irrigation technology, and ultimately a basin’s agricultural water use. Price information is available through field-level assessments of groundwater depths and electricity prices, irrigation district planning documents, and, to a limited extent, Federal irrigation projects. Federal irrigation projects require reporting price schedules to recover operation and maintenance costs. However, this requirement is not enforced, and substantial data gaps exist (W. Taylor, Bureau of Reclamation, oral commun., 2021).
Identifying the aggregate acreage by crop type and irrigation technology provides the best assessment of agricultural water demand. In arid regions of the world, such as the Upper Colorado River Basin, natural rainfall is not sufficient to meet the water requirements for growing crops and estimates of water used by agriculture rely on accurate maps of the location and extent of irrigated lands as well as irrigation type (Buto and others, 2014). Between 2007 and 2010, Buto and others (2014) determined that 65.9 percent of agricultural lands in the Upper Colorado River Basin were irrigated during the June through September growing seasons; 59.5 percent of those agricultural lands were flood irrigated, 23 percent were sprinkler irrigated, and 17.5 percent were classified as unknown or not irrigated. Domestic agricultural production on individual parcels is a function of domestic demand but is also driven by broader market trends such as economic growth and exchange rates in export countries and aggregate global production. High-value hay production is an example of an irrigated crop in the Western United States that serves export markets.
An explicit example of domestic production driven by global markets can be found in the substantial increase in almond production in the Central Valley of California to meet increased demand in international markets (Howitt and others, 2015). Production shifts in response to changes in demand may influence water use and irrigation technology (almonds, for example, use drip irrigation) and may affect the flexibility of an agricultural producer to intermittently reduce water use through fallowing or crop rotation. Although these global economic forces are important predictors of trends in agricultural production, macroeconomic determinants of agricultural production are not included in this study’s dataset.
Aggregate crop-type data are provided in the U.S. Department of Agriculture’s National Agricultural Statistics Service (NASS) CropScape program (https://nassgeodata.gmu.edu/CropScape/). The NASS data are primarily supplied by county-level reports and field-level evaluations. Federal irrigation projects historically collected field-level data, but in the last several decades, these projects have relied on existing NASS data (W. Taylor, Bureau of Reclamation, oral commun., 2021). The NASS data and State- and county-level assessments also provide information about irrigation technology by land area. Irrigation technology by land area information is less complete than crop-type information, and primary data may also be found in individual agricultural research studies (D. MacEwan, ERA Economics, written commun., 2021). Agricultural lands and irrigation type can be classified by combining available geospatial data, satellite imagery, and aerial imagery for agricultural lands (Buto and others, 2014). Figure 13 shows the spatial distributions of crop category in the Upper Colorado River Basin (from the U.S. Department of Agriculture NASS [2017] Cropland Data Layer geospatial data). Table 4 provides NASS data for States within the Upper Colorado River Basin.
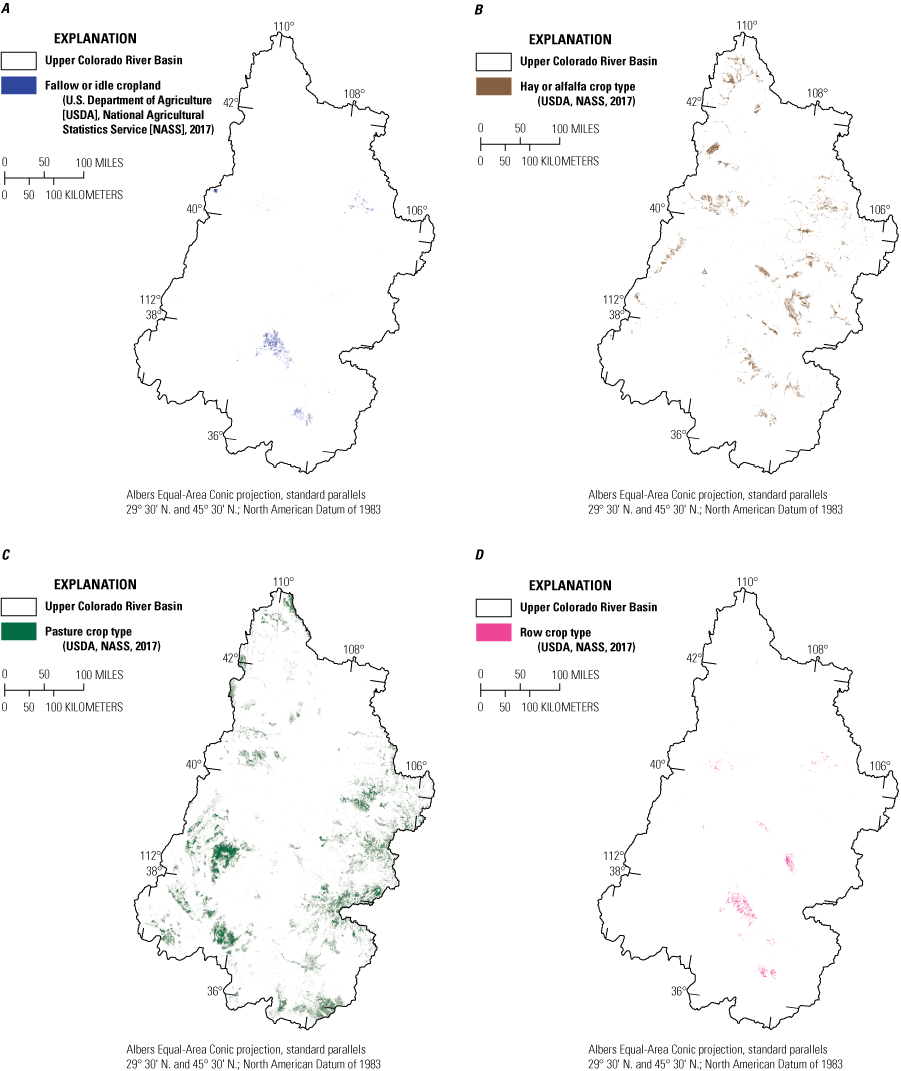
Distribution of generalized crop types in the Upper Colorado River Basin, 2017.
Table 4.
Summary of total acres of agricultural land cover in the Upper Colorado River Basin, including those in crop production, by aggregated land-cover category, 2012 and 2017.[Summary created with data from the Cropland Data Layer for 2012 and 2017 (U.S. Department of Agriculture Cropland Data Layer 2012 and 2017; U.S. Department of Agriculture, National Agricultural Statistics Service, 2012, 2017), extracted by the Upper Colorado River Basin spatial extent, and reclassified from specific crop categories into aggregated project categories for simplification. For detailed information, see appendix 3]
| Aggregated land-cover category |
Acres, 2012 | Acres, 2017 (fig. 13) |
Change in acres, 2012–17 |
|---|---|---|---|
| Fallow or idle | 179,910 | 155,916 | −23,994 |
| Hay or alfalfa | 734,429 | 1,004,331 | 269,908 |
| Pasture | 5,698,494 | 3,667,096 | −2,031,398 |
| Row crops | 239,279 | 221,265 | −18,015 |
| Tree and vine | 0 | 141 | 41 |
| Vegetable, fruit, and other | 31,578 | 14,560 | −17,018 |
Tree and vine data are not depicted in figure 13 because the quantity is not noticeable at the scale of the data.
At the aggregate level, local, regional, State, or Federal institutions may determine the aggregate demand of agricultural production. These land-use outcomes indirectly determine the aggregate demand for water in the agricultural sector. Many land-use decisions are made at the municipal or county level and are reported in general plans. In the Upper Colorado River Basin, specific areas where potential land conversion from agriculture to urban demonstrate the tension between high-value rural agriculture and expanding urban area (for example, Grand County, Colorado). Individual States may also have policies related to land conversion and development. These municipal, county, and State general land-use plans provide information that is necessary to predict future land-use conversion, typically from agricultural to urban use, which is an important aspect of water availability in a basin. It is typical for high-value agricultural production, such as takes place in the Grand Valley of Colorado, to be susceptible to conversion to urban use. This susceptibility to conversion is a result of agricultural and urban land use occurring near each other and of high-value agricultural production occurring on valley floors where soil is favorable, and the weather is conducive to high-value production. A land area for urban use requires substantially less water than the same land area requires for agricultural production. Changing land-use patterns may substantially affect regional hydrologic dynamics (Baker and others, 2014).
The acreage of agricultural production in a region is also an important determinant of water quality (Buto and others, 2014). Agricultural production practices, including groundwater pumping, irrigation type (that is, flood irrigation), and fertilizer inputs, can influence the quality of surface-water return flows and aquifers. Water quality is a regional issue; the geology and hydrology of a basin or subbasin interact with human factors, leading to water-quality outcomes. Salinity, the concentration of dissolved salt in water, has long been a major concern in the Colorado River Basin and is affected by natural processes and anthropogenic activities. The geologic composition of the Colorado River Basin is dominated by prehistoric marine sedimentary rocks such as the Late Cretaceous Mancos Shale, which contain high amounts of salinity and are poorly consolidated (U.S. Department of Energy, 2011). The presence of sedimentary geologic formations contributes to increased rates of erosion, weathering, and transportation of dissolved solids into the river system.
Irrigation accounts for between 32 and 45 percent of human-caused salinity per year in the Upper Colorado River Basin, despite only covering 2–3 percent of the total land area (Rumsey and others, 2021). Irrigation mobilizes the salts found within the soil by consuming water through evapotranspiration and dissolving underlying salts. Several policies and programs were put into place to control salinity in the Colorado River Basin beginning in the mid-1970s. The Colorado River Basin Salinity Control Forum, created in 1973 by the seven Colorado Basin States, provides executive oversight of salinity-control efforts, coordinates with Federal agencies on implementation of the Colorado River Basin Salinity Control Act, works with Congress on program authorization and funding issues, acts to disseminate information on salinity-control efforts, and works to otherwise promote efforts to reduce salt loading to the Colorado River (Colorado River Basin Salinity Control Forum, 2020). Forum members are appointed by the Governors of each State. Water quality is a factor in water availability that can be evaluated at the level of the irrigation district or individual water body.
Other economic and cultural values may be considered in public policy to preserve the use of water in different sectors. For example, a community may value open space and working landscapes. As a result, land-use planning may limit the conversion of agricultural land to urban or other uses and subsidies, or other financial incentives may be provided to support working landscapes. For example, the town of Palisade, Colo., has a goal to, “preserve the rural/agricultural character and the economic viability of orchards and vineyards” (Four Corners Planning and Design, 2007, p. 3-10.). The transfer of water out of the agricultural sector in a region may also be constrained, partly to maintain the viability of the agricultural economy, but also to maintain the public-good value associated with working landscapes and rural lifestyles.
Residential
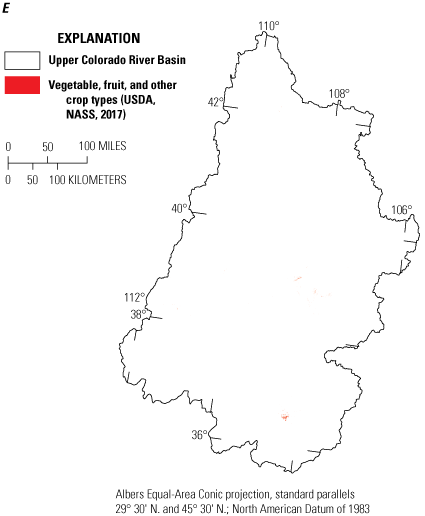
Demand for residential water, like other sectors, is also a combination of institutional, economic, and socioeconomic factors (table 5). Regardless of water source—groundwater well, another onsite system, or through public or private water distribution systems (fig. 14)—the human factors driving water demand at the residential level are similar. Environmental determinants of demand in residential settings include temperature and precipitation (Olmstead and Stavins, 2007; Buck and others, 2020). These environmental determinants can be specific to seasons, and other approximations are sometimes used, such as evapotranspiration or wind speed indices (House-Peters and Chang, 2011). These factors are particularly important to control for if seasonal demand for residential water is being estimated in regions with environmental determinants that exhibit substantial variation.
Table 5.
Human determinants used to estimate and forecast demand in the residential water sector.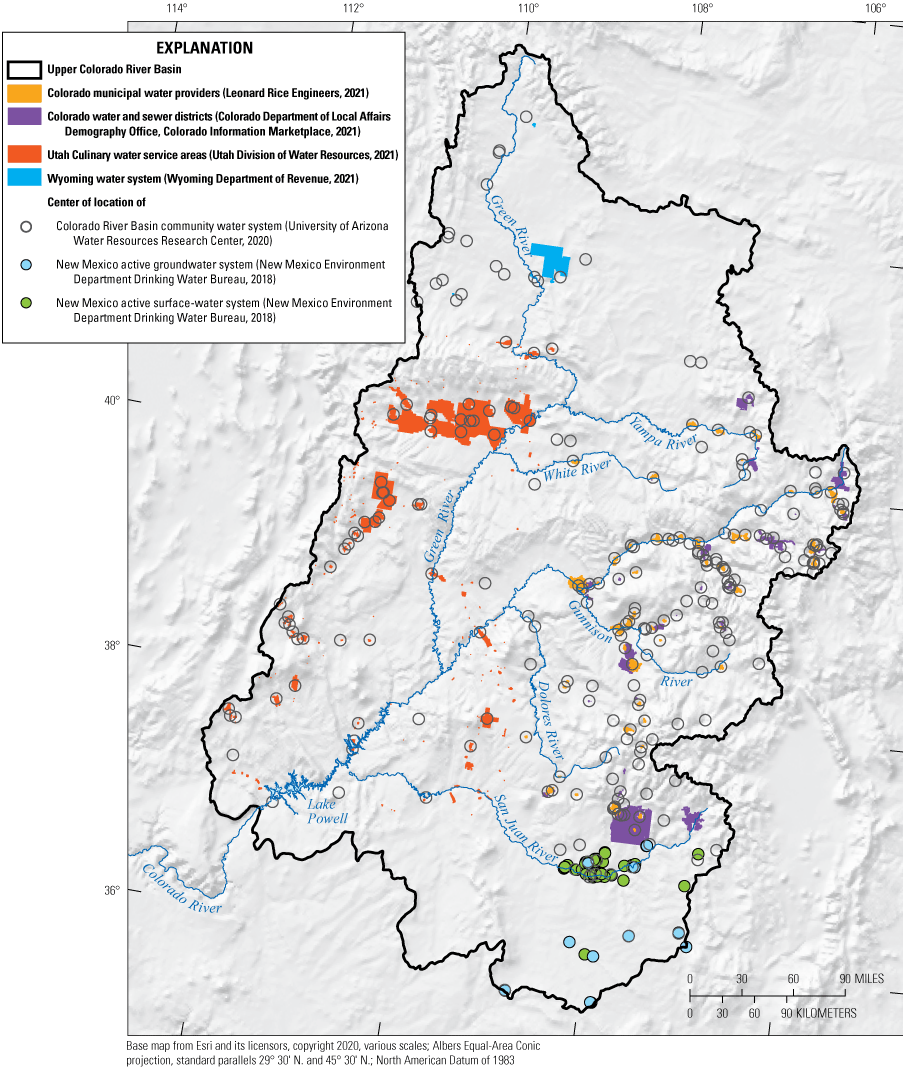
Public-supply water systems and service areas. See appendix 5 for more information on data sources.
The residential water sector is primarily composed of domestic household water use, which consists of indoor and outdoor use. Indoor household water use is largely driven by the number of occupants within a household. Per capita use is determined by the amount of water used in toilets, showers, and washing machines. After the passage of the Energy Policy Act in 1992, the energy and water efficiency of household plumbing and appliances greatly increased as mandates for new buildings were put into effect (Vickers, 1993). Thus, the age of a home can also be a factor in indoor household water use. In order to further estimate indoor water use, the size of a home can be used as a proxy for the number of bathrooms and, thus, of the individuals living in a home. Obtaining data on several housing characteristics from real estate or other online companies may be possible; however, these online platforms (for example, Zillow) have various application requirements to obtain data and do not consistently provide data for outside research (R. Niswonger, U.S. Geological Survey, oral commun., 2021).
Outdoor household water use is primarily determined by the type and size of lawn as well as by irrigation type and environmental factors, such as temperature and precipitation. Across the United States, including in the Upper Colorado River Basin, the turf grass yard is the primary lawn type in urban and suburban areas, covering 63,000 mi2 across the country (D’Costa, 2017). Despite the mostly inhospitable climate for turf grass in the Upper Colorado River Basin, which necessitates irrigation and fertilizer inputs to maintain a healthy lawn, the cultural value associated with this type of lawn is entrenched. Homeowners may attribute a lush, well-manicured lawn with socioeconomic class and may associate turf grass with a family friendly lawn (Mustafa and others, 2010). This cultural norm is often enforced through homeowners’ association rules that dictate the amount of a home’s yard that must be turf grass, citing the maintenance of property values. Although movement towards xeriscaping, or more environmentally friendly, less water intensive lawn types, may be considered part of a larger green consumerism movement associated with wealthier, more educated segments of society, income does not seem to be related to adoption of xeriscaping; however, xeriscaping does appear to be related to education levels (Mustafa and others, 2010).
Despite the cultural norm of turf grass, the recent and prolonged drought in the Colorado River Basin as a whole has prompted calls for the removal of turf grass lawns. In Nevada, a Lower Basin State, the Southern Nevada Water Authority pays homeowners $3 per square foot of lawn converted from grass to water-smart landscaping (Southern Nevada Water Authority, 2021). In 2021, Nevada went further to keep water from being used for the irrigation of turf grass, passing a mandate to remove grass that exists for purely aesthetic purposes. Under this new mandate, homeowners can keep their lawns; however, businesses and cities with grass on medians or around their buildings will be forced to replace it.
The primary economic determinants of residential demand are the price of water and household income (Arbués and others, 2003; House-Peters and Chang, 2011; Olmstead and Stavins, 2007; Buck and others, 2020). Note that the price of water and income interact with other cultural determinants of residential water demand. For example, the price elasticity of water in residential settings can vary substantially among seasons, uses, regions, and various social and economic conditions and varies further with the existence of demand-management strategies (Kenney and others, 2008). Water pricing has been used as a demand-management strategy to attempt to curb household outdoor water use in arid and semi-arid regions such as the Upper Colorado River Basin. Water utilities generally use three types of water pricing schemes: (1) flat rates: a fixed charge per unit of water; (2) progressive rates, also called increasing block pricing: water prices increase with the amount of water used; and (3) regressive rates: cost percentage applied equally to all users regardless of water use. Progressive rates or increasing block pricing, which charges higher water users higher water rates, have been used to discourage using large amounts of water with mixed success (Sedlak, 2015).
One reason for the mixed success of progressive rates is that consumers may not always understand their water utility bill and thus may not act to maximize utility as expected by utility-maximization theory, which states that a consumer faced with an increasing block price payment schedule is expected to respond to the changes in the marginal price of the block in which they consume (Nataraj and Hanemann, 2011). Another reason for uneven success in managing demand with pricing is that some households who use large amounts of water can afford the increased water rates for the water needed to maintain their lawn and are thus insensitive to price (Sedlak, 2015). Understanding the influences of pricing on water use is complicated because pricing is often used in combination with other demand-management strategies, making it difficult to isolate the effects of any one strategy on water use (Kenney and others, 2008).
Demand-management strategies unrelated to pricing include public education, technological improvements, and water restrictions. Public education includes both public information programs and education programs in schools. Public information consists of a wide variety of strategies such as printed material inside water bills, news articles, radio announcements, conservation hotlines that provide advice, and advertisements using media such as billboards (Michelsen and others, 1999). An example of a public information program is Denver Water’s “Use Only What You Need” campaign (Denver Water, 2022) that ran from 2006 to 2016 and encouraged water users to conserve water through a variety of public outreach mechanisms including billboards. As the efficiency of household plumbing and appliances determines indoor household water use, incentives for retrofitting appliances in older homes is another demand-management strategy that public water utilities often employ. Finally, water restrictions, such as restrictions on the hours of the day or number of days a week that watering is allowed (or both), were put into place by water utilities across the Upper Colorado River Basin beginning in the early 2000s as the current megadrought began to take hold. Some of these restrictions have become permanent measures. Research has shown that mandatory outdoor water restrictions can result in substantial reductions of water use, sometimes up to 30 percent or more (Kenney and others, 2008).
The researcher ideally would determine the importance of institutional and economic determinants in a specific geographic region and assess what interactions may be important when estimating residential demand. Aggregate demand in a residential area composed of economically homogenous households and served by a single water utility may be estimated by using indoor and outdoor household characteristics and controlling for environmental factors. The price of water is a location-specific variable derived from supply costs, although demand-management objectives may also be reflected in the design of the end-user price as previously described. Thus, the collection of water-pricing information ideally would be accomplished on a case-by-case basis and obtained from public suppliers or through surveys or engineering estimates of those who self-supply.
Although indoor and outdoor household characteristics may be obtained from a third-party provider (for example, real estate websites), the primary source for household characteristics and household income information is the U.S. Census. Household income is provided by the U.S. Census at the census tract level as opposed to individual household level. However, census tracts often do not correspond to the boundaries of a single public water utility or represent homogenous household economic characteristics, thus making it difficult to get an accurate estimate of household water use based on U.S. Census data. Other determinants of outdoor water use that are used with—or as a substitute for—lot size and turf grass are the presence of gardens, pools, and irrigation systems (Arbués and others, 2003; House-Peters and Chang, 2011).
Industrial and Commercial
In the industrial sector, total water demand is typically based on level and type of production. For this report, the industrial and commercial sector includes self-supplied industrial, mining, and thermoelectric power generation uses as well as all water use outside of residential or agricultural regardless of source (that is, municipal supply, self-supplied). Macro-level economic considerations and regional, State, and Federal institutional decisions determine the level and type of production in a basin (table 6). The top industries in the Upper Colorado River Basin States, other than agriculture, are manufacturing, which includes aerospace and defense; mining/energy, which includes coal, oil, and gas, as well as mining of other minerals; service, including tourism and hospitality; and education and health care, which are especially prominent in Utah. The various types of industrial production make it challenging to quantify water needed for industrial processes. Estimating water use in this sector requires identifying the forecasted industrial production that uses water in a basin (for example, annual energy generation forecasts from the U.S. Energy Information Administration [EIA]) and the water used per unit of production or economic output (Marston and others, 2018; Bagstad and others, 2020). This method allows for aggregate estimates of water use without the need to estimate specific determinants unique to a production process.
Table 6.
Human determinants used to estimate and forecast water demand in the industrial and commercial sector.Demand for water is typically a secondary consideration in the industrial sector. The price of water is relatively low compared to other inputs, and the value (willingness to pay) of an additional unit of water is bounded by the ability to self-supply or by recycling technology (Gibbons, 1986). However, demand for water is affected by the price of water for certain industrial processes. For example, pulp and paper manufacturing is the most sensitive sector to the price of water, with rubber and plastics manufacturing being the least sensitive (Renzetti, 1992). Increasing the price of water may lead a producer to substitute other inputs for water, or a change in price of another input may influence the demand for water in the overall industrial process. These context-specific cases are typically modeled on a case-by-case basis, using site-based surveys or engineering and economic models. General changes in water price, input prices, and technology that influence the demand for water are used by researchers to model water use by sector on an aggregate basis, using input prices or industrial output to estimate water use.
Environmental determinants of industrial and commercial water demand are similar to those of other sectors. Temperature and precipitation are important factors when estimating water demand; however, industrial processes are more isolated from environmental factors, primarily because the water use occurs under controlled environmental conditions as opposed to water use in other sectors, such as agriculture. Similar to the agricultural sector, there are also local, regional, and State policies that either promote or detract from the development of the industrial and commercial sector. Although a variety of historical factors can influence the type of industrial development that occurs in a region’s land-use planning, tax incentives and other institutional factors may influence development decisions that drive specific industries and may affect the existing hydrology and future use of water in a region. For example, States may offer tax incentives for relocating specific types of industry to a State or for starting a business in a rural or underserved area where a boost to economic growth is desired. Tax incentives are typically found on State websites and may illuminate the drivers behind specific types of economic growth in a region and where water-intensive industries are concentrated.
Energy generation, specifically in the form of thermoelectric powerplants and hydroelectric dams, is a major category of water use in the industrial sector (Dieter and others, 2018a). The level and type of energy generation in a region is a function of supply and demand for energy. The Western Electricity Coordinating Council also has rules and regulations for capacity, State and Federal mandates for renewables, and existing and planned transmission infrastructure, among other factors that affect type of energy generation and thus water use. As an example, best practices for modeling water demand in the power sector include a combination of Federal data and engineering reports (R. Niswonger, U.S. Geological Survey, oral commun., 2021). The EIA reports annual net power generation by generation type (fig. 15). Figure 15 shows the locations of powerplants with thermoelectric and hydroelectric capabilities and their net summer generation capacity in the Upper Colorado River Basin. The EIA provides data on water use reported by individual facilities; however, the water-use information varies widely depending on the data outlet. Review of individual generating facilities is recommended prior to use of the data (Harris and Diehl, 2017). Therefore, engineering estimates of water use are combined with the EIA generation information to provide estimates of the water used in the production of energy via thermoelectric plants (Harris and Diehl, 2017).
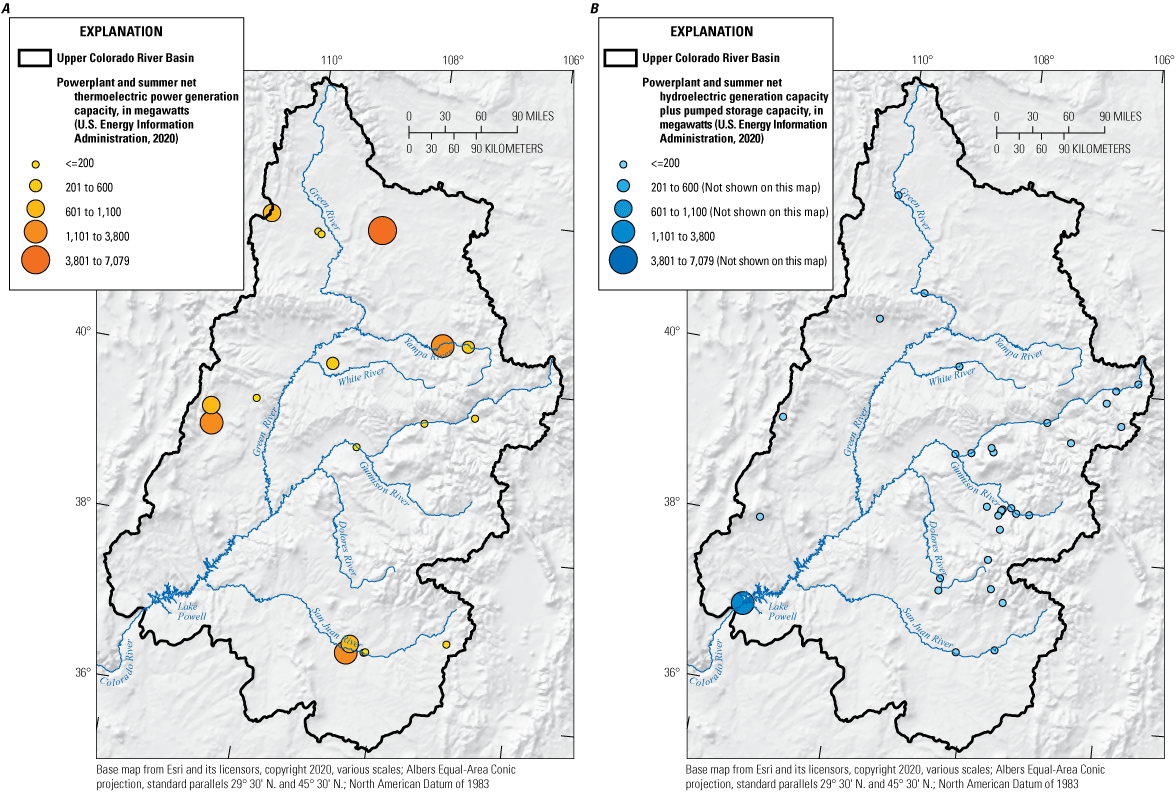
Locations of powerplants with thermoelectric power and hydroelectric and pumped storage power capabilities and their summer net generation capacity in the Upper Colorado River Basin. Powerplant data layer from U.S. Energy Information Administration (2020), filtered by those powerplants where hydroelectric total megawatts plus pumped storage megawatts are greater than 0. To calculate the thermoelectric total megawatts, the coal megawatts, natural gas megawatts, and crude megawatts were summed, and values greater than 0 were filtered by size according to summer net (period of peak demand June 1 through September 30) capacity in each category.
A combination of production information, water-use coefficients (Marston and others, 2018), and other proxies such as employment or financial metrics by North American Industry Classification System sectors (Rao and others, 2017; Bagstad and others, 2020) are used to estimate water demand in the industrial and commercial sector outside of energy generation. Employment data are readily available and may be used specifically when estimating demand in the institutional (for example, schools, medical, and government) and commercial sectors. Review of a broad range of methods to estimate water use by sector (energy, mining, commercial, industrial, and institutional) can be found in Marston and others (2018). The aggregation of individual commercial, industrial and institutional facilities, mining operations, and thermoelectric generating units in a basin determines total demand.
Additional Uses: Recreation and Ecosystem Services
In addition to the agricultural, residential, and industrial and commercial sectors, human factors and determinants such as cultural norms and economics also drive demand for water for the environment. Specific datasets for this category of water use are more difficult to identify; however, some of the primary factors and determinants driving demand for water for recreation, tourism, and ecosystem services are outlined in this section. To maintain ecosystem function and habitat requirements for threatened or endangered species, an understanding of the frequency, duration, timing, and volume of water is needed. Ecosystem service and function may not only directly provide goods and services to human communities but also maintain other values of various cultures. The cultural or relational values specific to water resources are place based; therefore, individual studies would be beneficial to identify the complex interconnection between communities in the Upper Colorado River Basin and water resources.
Excluding Alaska, the list of the top 10 States with the most land owned by the Federal government includes all upper basin States (Stern and Sheikh, 2021; table 7). In some Western States, the large amount of land owned by the Federal government has led to backlash (Plumer, 2016), but the Southwest has embraced it, marketing the recreation opportunities provided by national parks in their States (for example, “The Mighty 5” in Utah) to boost tourism, and voting in favor of policies and funding that protect and conserve open space (for example, Great Outdoors Colorado). The cultural norms in the Upper Colorado River Basin around conservation and recreation create a demand for water for the environment that provides goods and services to humans outside of the sectors previously discussed and may prevent water from being used in other sectors.
Table 7.
Selected managed land areas in the Upper Colorado River Basin.[BLM, Bureau of Land Management; NLCS, National Landscape Conservation System; see figure 16]
These goods and services may include outdoor water-based recreation, habitat for threatened or endangered species, or ecosystem goods and services (for example, improved water quality) including for cultural or spiritual reasons (Bureau of Reclamation, 2018). Demands for these goods and services are derived from a complex interaction of economic and cultural determinants. Water demand in this context is not related to withdrawing a specific amount of water for a specific use, instead characteristics of water resources (for example, volume of discharge in a river) are important to activities such as whitewater boating, angling, and other water-based recreation or for the maintenance of ecosystem function and service.
Water-based recreation is a substantial segment of outdoor recreation in the Upper Colorado River Basin. Aggregate demand for specific water-based recreational attributes depends on the taste and preferences of individual recreators and the total number of participants. The region is home to several State and Federal parks and protected areas (fig. 16). Figure 16 displays selected managed areas of the Upper Colorado River Basin from data largely provided by Federal agencies. Additional metadata and statistics about these managed areas (such as governance, protected area category, and other natural, recreation, historical, and cultural uses) can be found in the Protected Areas Database of the United States, an aggregation of these individual management layers (U.S. Geological Survey, 2021b). Information related to the economic impact (regional spending) and economic value (individual willingness to pay) of water-based recreation in these locations and others can be found in various agency, academic, and nonprofit reports (Bair and others, 2016; Neher and others, 2017; Thomas and Koontz, 2021). Regional economic-impact estimates are based on input-output models (for example, IMPLAN) and primary data collected from visitors (annual trips, zip code) or from surveys of individual recreators (Thomas and Koontz, 2021). These primary surveys are expensive and time consuming; therefore, methods have been developed to estimate the economic value of recreation using survey data from different recreation sites having similar qualities.
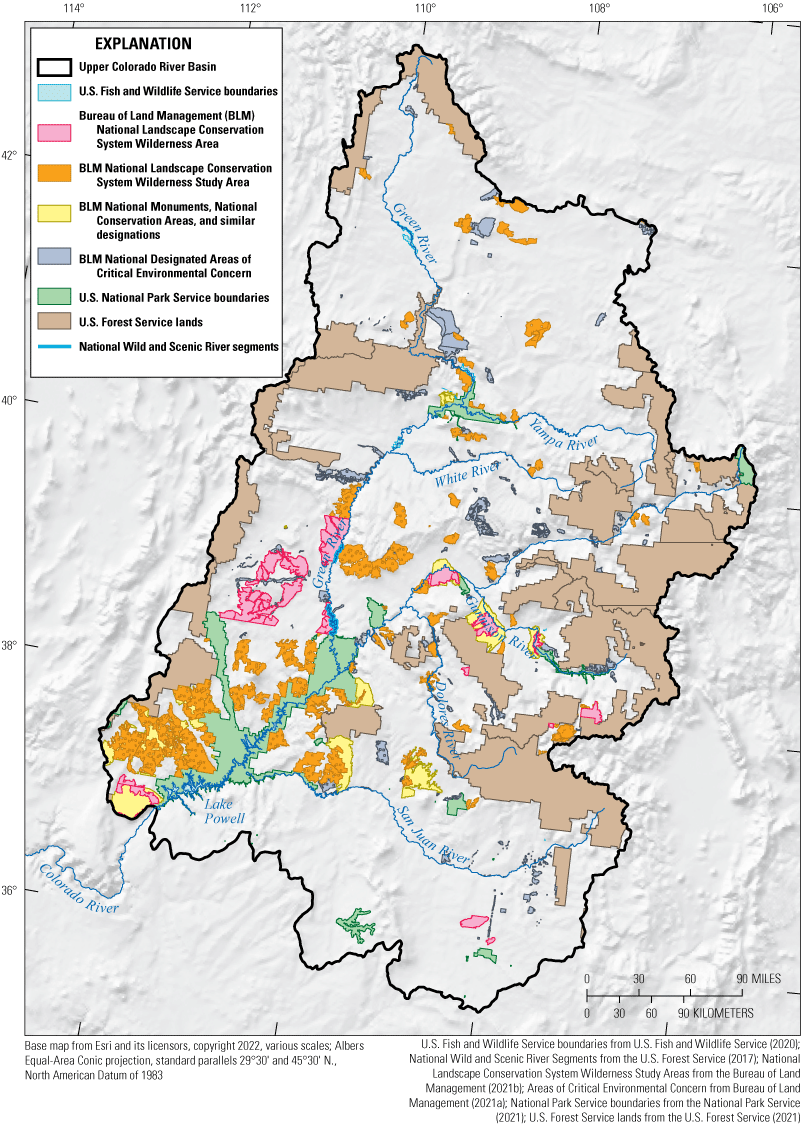
Selected managed land areas in the Upper Colorado River Basin.
Ecosystem function and service are important aspects of water demand in relation to the environment. The quantity of water demanded for ecosystem function and services is specific to each region. There are environmental determinants but also human factors, such as development, that influence timing, quantity, and quality (thermal regime, turbidity) of water that, in turn, influence the amount of water necessary to maintain ecosystem function and service. Although the environmental determinants of water demand for the maintenance of ecosystem integrity are not discussed in detail in this report, one example is the responsibility of the U.S. Fish and Wildlife Service to maintain and enforce rules to support habitat for endangered species under their jurisdiction. The Endangered Species Act was landmark legislation passed by the United States Congress in 1973 that has spurred conservation of species at risk of extinction not only in the United States but across the globe as other countries followed suit by passing laws of their own. In the Upper Colorado River Basin, four species of native fish are considered endangered (National Park Service, Glen Canyon, 2021): Gila cypha (humpback chub), Gila elegans (bonytail), Ptychocheilus lucius (Colorado pikeminnow), and Xyrauchen texanus (razorback sucker). In addition to the management of flows in the Upper Colorado River Basin to meet requirements of the Law of the River, flows are managed in the Upper Colorado River Basin to provide adequate instream flows for all four of these endangered fish. Additional water-management measures include floodplain habitat restoration for the bonytail and the development of backwaters for the early life stages for the razorback sucker. More detail can be found in various publications that discuss the importance of instream flow and water quality (including temperature) to achieve environmental management objectives (Laub and others, 2018; Dibble and others, 2021) and implementation of adaptive management (Melis and others, 2015; U.S. Department of the Interior, 2016).
Cultural norms associated with conservation also determine the water made available for the environment in the Upper Colorado River Basin and shifts from water used for one sector to water used for another. For example, conservation easements are voluntary legal agreements between a landowner and another entity (typically a land trust or government) that place restrictions on the uses of a piece of property. Conservation easements restrict those uses forever, permanently conserving the property although the landowner remains the owner of the property. States often provide tax incentives for transferring property into a conservation easement. The goal of a conservation easement can be to maintain or improve water quality, a specific landscape, or wildlife habitat; to protect scenic areas; or to ensure that lands are managed in such a way that they remain available for agriculture. Thus, conservation easements can alter water availability through the permanent protection of a specific type of land use.
Discussion: Limitations and Challenges
Water availability defined as, “access to a specific quantity and quality of water at a point in time and space, for a specific use, recognizing the social and economic value of water across uses and institutions that facilitate or hinder its equitable and efficient provisioning,” is a result of complex interactions between regional supply and demand and underlying environmental, institutional, and economic determinants. This report has provided an overview of human factors that influence water supply, described human factors that influence water demand, and summarized the extensive set of data available to estimate these factors in the Upper Colorado River Basin. These datasets are the basic information products to consider when including human interactions with water in an assessment of water availability. More information would be beneficial, however, to gain a full picture of human-water interactions and to understand how these interactions influence water availability. Gaps were found in best practices for prioritization of human factors within a water-availability assessment and in consistent data collection across both temporal and spatial scales. A central location would be beneficial for the data from individual sectors (that is, municipalities, irrigation districts, and industrial facilities) so it will be easily accessible to researchers. Additionally, this study found that data on cultural norms and values around water that may influence water availability are lacking, and the USGS WMA could add data related to this topic through future research.
The identification of determinants of supply and demand is important to reach the objectives of integrated water science and to incorporate human interactions with water into research, assessment, and prediction activities. It is also important to recognize the time step and geographic extent of the data necessary to adequately undertake an integrated water-availability assessment. Hydrologic research is often conducted by using hydrologic boundaries at the scale of the watershed or other hydrologic unit of interest, such as the Upper Colorado River Basin. Human institutions, however, operate at a variety of scales that typically do not correspond to the area drained by a stream. This is particularly true in the federalist system of water management in the United States in which the management of resources is left to the States, with minimal Federal oversight. In the case of the Colorado River Basin, the Federal government is a signatory to the 1922 compact and manages, through the Bureau of Reclamation, a portion of the waters within the basin. Nevertheless, water within each State’s boundaries and within the limits apportioned to each state through the 1948 Upper Colorado River Basin Compact is managed by the State. Thus, water management within each State is unique and is influenced by local culture, values, demographics, and economics.
Within each State in the Upper Colorado River Basin, water management is typically divided further as local municipalities are responsible for delivering water to households and irrigation districts for delivering water to both households and agricultural producers. The institutional nesting of water management, culture, and economics means that human-water interactions are best understood and studied at the scale of institutions (for example, irrigation districts in the Upper Colorado River Basin) as opposed to the hydrologic scale (for example, the Upper Colorado River Basin). The institution of interest, and therefore the scale of interest, may be different depending on the goal of the assessment. The datasets identified in this report substantially vary by temporal and spatial detail, with some data collected by Federal agencies and provided for the entire country and other datasets collected by States or researchers with a specific interest and for limited spatial extent. In order to conduct an integrated assessment of water availability in the Upper Colorado River Basin, data ideally would be compiled, and where absent, collected at the scale of the institution that is most salient for the sector of interest. Data then could be scaled up to the subbasin scale.
For each sector identified in this report, the basic determinants of demand are listed (see table 8 for a summary of determinants). However, the relative importance of determinants or the resolution needed to achieve the objectives of a water-availability assessment have not been identified. For example, although the primary factors that influence residential demand (such as price of water and household income) have been identified, how to prioritize those factors in an assessment of water availability has not. This prioritization, as well as the spatial and temporal scale of data needed, would depend on a project’s objectives and scope. As is evident in recent analyses of water availability, using more than just population projections and historical per capita water use would be important for estimating demand (Richter and others, 2020). Identifying the highest priority human factors and determinants to consider when initiating an assessment of water availability is a research need. Although not all determinants may be important in an assessment of water availability, identifying the most important determinants and the ideal level of detail is a challenge in water-resource management.
Table 8.
Summary of determinants identified for the agricultural, residential, and industrial and commercial sectors.Water is vital to human life and almost every sector of economic activity; culture and water have been intimately intertwined throughout human history. Cultural perspectives come from one’s family or local community, and cultural perspectives about water can be driven by how much or how little water is present in one’s community and the uses for which the water is prioritized. Professional experiences (for example, academia, government), geopolitical structures (for example, nationalities), and personal backgrounds can also foster distinct cultural framings around water. Culture constitutes distinct systems of knowledge and behavior that inform our values and drive decisions about water management. Culture is also often very local, making it difficult to generalize about cultural norms surrounding water. This study located information regarding cultural norms in the Upper Colorado River Basin related to large-scale water management (prior appropriation doctrine), household outdoor water use (cultural norm of turf grass lawns), and conservation in support of recreational opportunities and protection of species. However, more information would be beneficial to fully understand how human interactions with the water cycle may evolve as communities are faced with aging water infrastructure, changing demographics (with the potential to not only put pressure on existing water supplies, but change local culture), and a changing climate that sometimes brings too much and sometimes too little water. Surveys on local attitudes about conservation, recreation, and governance, although potentially time intensive, could shed more light on how cultural norms influence water availability.
Finally, data on human determinants of water availability are dispersed and housed on State and Federal agency websites, local municipal water-provider platforms, and within journal articles and are often collected at varying geographic scales and time steps. Consolidation of these data would be beneficial and could improve water-availability assessments conducted by State, Tribal, and Federal water-resource managers. Additionally, these data are foundational for identifying how changes in water management affect equity. A data clearinghouse could increase transparency in the reporting of how water is conveyed to communities and could help to identify specific research needs.
Conclusions
The supply and demand of water in the agricultural, municipal, and industrial water-use sectors are a function of price and other institutional, economic, and environmental factors in the Upper Colorado River Basin. Demand for water in the municipal sector includes indoor and outdoor use and is often influenced by the complex interaction of economic determinants (such as price and household income), with institutional and environmental factors. Demand of water in economic production, such as agriculture or industry, is a derived demand. In other words, water is only one input into the production process. Demand for water in production in agricultural and industrial sectors is still a complex combination of economic determinants but also involves institutional and environmental factors, similar to the demand for water in the municipal sector.
Forecasts of water use in the agricultural, municipal, and industrial sectors are often underestimated. Predictions, for example, may use approximations for changes in demand, such as population or economic activity, but water use also may be influenced by political or other strategic behavior. With substantial structural changes in social and economic aspects of various sectors and increased variation in environmental determinants due to a changing climate, these approximations and other assumptions about water supply and demand are inadequate for predicting water availability. Therefore, a better understanding and use of the fundamental human determinants of water supply and demand at the appropriate scales would be helpful in predicting future water availability under a changing climate.
References
Abbott, B.W., Bishop, K., Zarnetske, J.P., Minaudo, C., Chapin, F.S., III, Krause, S., Hannah, D.M., Conner, L., Ellison, D., Godsey, S.E., Plont, S., Marçais, J., Kolbe, T., Huebner, A., Frei, R.J., Hampton, T., Gu, S., Buhman, M., Sayedi, S.S., Ursache, O., Chapin, M., Henderson, K.D., and Pinay, G., 2019, Human domination of the global water cycle absent from depictions and perceptions: Nature Geoscience, v. 12, no. 7, p. 533–540.
Arizona Department of Water Resources, 2021, Community Water System Service Area GIS data—CWS_ServiceArea: ArcGIS REST Services Directory, accessed May 14, 2021, at https://services.arcgis.com/C34zQ7veRS0V1t04/arcgis/rest/services/CWS_Service_Area/FeatureServer/0/.
Buck, S., Auffhammer, M., Soldati, H., and Sunding, D., 2020, Forecasting residential water consumption in California—Rethinking model selection: Water Resources Research, v. 56, no. 1. [Also available at https://doi.org/10.1029/2018WR023965.]
Bureau of Indian Affairs, Native American Land Area Representations, 2020, GIS data BIA AIAN National LAR: ArcGIS REST Services Directory, accessed January 12, 2022, at https://biamaps.doi.gov/server/rest/services/DivLTR/BIA_AIAN_National_LAR/MapServer.
Bureau of Land Management, 2021a, Areas of Critical Environmental Concern, GIS data: BLM National Designated Areas of Critical Environmental Concern Polygons, accessed September 16, 2021, at https://gis.blm.gov/EGISDownload/LayerPackages/BLM_National_ACEC.zip.
Bureau of Land Management, 2021b, National Landscape Conservation System Wilderness and Study Areas, GIS data: BLM National NLCS Wilderness Areas and Wilderness Study Areas, accessed September 16, 2021, at https://gis.blm.gov/EGISDownload/LayerPackages/BLM_National_NLCS_Wilderness_and_WildernessStudyAreas_poly.zip.
Bureau of Reclamation, 1922, Colorado River Compact, accessed February 22, 2022, at https://www.usbr.gov/lc/region/pao/pdfiles/crcompct.pdf.
Bureau of Reclamation, 2012a, Colorado River Basin water supply and demand study report, accessed February 4, 2022, at https://www.usbr.gov/lc/region/programs/crbstudy/finalreport/Study%20Report/CRBS_Study_Report_FINAL.pdf.
Bureau of Reclamation, 2012b, Colorado River Basin water supply and demand study—Technical report C—Water demand assessment, accessed February 5, 2022, at https://www.usbr.gov/lc/region/programs/crbstudy/finalreport/techrptC.html.
Bureau of Reclamation, 2015a, Law of the River, accessed February 22, 2022, at https://www.usbr.gov/lc/region/pao/lawofrvr.html.
Bureau of Reclamation, 2018, Colorado River Basin Ten Tribes Partnership Tribal water study, accessed February 4, 2022, at https://www.usbr.gov/lc/region/programs/crbstudy/tws/finalreport.html.
Bureau of Reclamation, 2021, SECURE Water Act section 9503(c)—Reclamation climate change and water 2021: Denver, Colo., Water Resources and Planning Office, Report to Congress, accessed February 6, 2022, at https://www.usbr.gov/climate/secure/.
Bureau of Reclamation, 2023, Glen Canyon Unit, accessed February 25, 2023, at https://www.usbr.gov/uc/rm/crsp/gc/.
Buto, S.G., Gold, B.L., and Jones, K.A., 2014, Geospatial dataset of agricultural lands in the Upper Colorado River Basin, 2007–10: U.S. Geological Survey dataset, accessed July 12, 2021, at https://water.usgs.gov/GIS/metadata/usgswrd/XML/sir2014_5039_UPPER COLORADO RIVER BASINAgriculture.xml.
Clark, M.P., Fan, Y., Lawrence, D.M., Adam, J.C., Bolster, D., Gochis, D.J., Hooper, R.P., Kumar, M., Leung, L.R., Mackay, D.S., Maxwell, R.M., Shen, C., Swenson, S.C., and Zeng, X., 2015, Improving the representation of hydrologic processes in Earth System Models: Water Resources Research, v. 51, no. 8, p. 5929–5956.
Colorado Department of Local Affairs Demography Office, 2021, Colorado Information Marketplace, Water and sanitation districts in Colorado, GIS data, accessed October 5, 2021, at https://data.colorado.gov/Local-Aggregation/Water-and-Sanitation-Districts-in-Colorado/d6bs-3kgu.
Colorado River Basin Salinity Control Forum, 2020], Organization: Colorado River Basin Salinity Control Forum web page, accessed August 15, 2022, at https://www.coloradoriversalinity.org/organization.php.
Colorado Water Conservation Board, 2015, Colorado water plan, accessed February 6, 2022, at https://cwcb.colorado.gov/read-plan.
D’Costa, K., 2017, The American obsession with lawns: Scientific American, accessed February 6, 2022, at https://blogs.scientificamerican.com/anthropology-in-practice/the-american-obsession-with-lawns/.
Denver Water, 2022, About us: Denver Water web page, accessed July 22, 2022, at https://www.denverwater.org/about-us/history/use-only-what-you-need/use-only-what-you-need-photo-gallery.
Dieter, C.A., Linsey, K.S., Caldwell, R.R., Harris, M.A., Ivahnenko, T.I., Lovelace, J.K., Maupin, M.A., and Barber, N.L., 2018a, Estimated use of water in the United States county-level data for 2015 (ver. 2.0, June 2018): U.S. Geological Survey data release, accessed September 15, 2021, at https://doi.org/10.5066/F7TB15V5.
Dieter, C.A., Maupin, M.A., Caldwell, R.R., Harris, M.A., Ivahnenko, T.I., Lovelace, J.K., Barber, N.L., and Linsey, K.S., 2018b, Estimated use of water in the United States in 2015: U.S. Geological Survey Circular 1441, 76 p., accessed September 15, 2021, at https://doi.org/10.3133/cir1441.
Fonseca, F., and Naishadham, S., 2023, California is lone holdout in Colorado River cuts proposal: Associated Press, January 30, 2023, accessed March 2, 2023, at https://apnews.com/article/politics-colorado-river-california-climate-and-environment-2ef8db8071dd911e84e7f345583206ed.
Four Corners Planning and Design, 2007, Palisade, Colorado—Comprehensive plan, accessed February 5, 2022, at http://www.townofpalisade.org/departments/community-development/palisade-comprehensive-plan.
Henderson, T., 2021, Census estimates show population decline in 16 States: Pew Trust, accessed February 5, 2022, at https://www.pewtrusts.org/en/research-and-analysis/blogs/stateline/2021/01/21/census-estimates-show-population-decline-in-16-states.
Hines, M.K., Herman-Mercer, N.M., Bair, L.S., Restrepo-Osorio, D.L., Romero, V.Y., and Lyde, A., 2022, Human factors of water availability in the Upper Colorado River Basin: U.S. Geological Survey data release, https://doi.org/10.5066/P99PAIVH.
Hubbart, J.A., 2020, Integrated water resources research—Advancements in understanding to improve future sustainability: Water, v. 12, no. 8. [Also available at https://doi.org/10.3390/w12082208.]
Intergovernmental Panel on Climate Change, 2021, Headline statements from the summary for policymakers—Sixth Assessment Report, Working Group I – The Physical Science Basis: Intergovernmental Panel on Climate Change, 2 p., accessed February 4, 2022, at https://www.ipcc.ch/report/ar6/wg1/downloads/report/IPCC_AR6_WGI_Headline_Statements.pdf.
Leonard Rice Engineers, 2021 Colorado Irrigation Districts, Colorado Municipalities, GIS data, accessed July 12, 2021, at http://lre-projects.com/ColoradoWaterEntities/ColoradoWaterEntitiesSHP.zip.
Lincoln Institute of Land Policy, 2020,Colorado River Basin outline with areas served and Mexico GIS data, accessed August 4, 2021, at https://coloradoriverbasin-lincolninstitute.hub.arcgis.com/datasets/lincolninstitute::colorado-river-basin-outline-with-areas-served-and-mexico.
Maupin, M.A., Ivahnenko, T.I., and Bruce, B., 2018, Estimates of water use and trends in the Colorado River Basin, Southwestern United States, 1985–2010: U.S. Geological Survey Scientific Investigations Report 2018–5049, 61 p., accessed August 4, 2021, at https://doi.org/10.3133/sir20185049.
Melis, T.S., Walters, C.J., and Korman, J., 2015, Surprise and opportunity for learning in Grand Canyon—The Glen Canyon Dam Adaptive Management Program: Ecology and Society, v. 20, no. 3, article 22. [Also available at https://doi.org/10.5751/ES-07621-200322.]
National Atlas of the United States, 2002, Continental Divide of the United States GIS layer, accessed January 6, 2022, at https://purl.stanford.edu/pw312bv3382.
National Park Service, 2021, National Park Service tract and boundary data, accessed September 15, 2021, at https://nps.maps.arcgis.com/home/item.html?id=a2848257cf5541338bab9b656440bd0c&sublayer=2.
National Park Service, Glen Canyon, [2021], Endangered Fish: National Park Service web page, accessed June 4, 2022, at https://www.nps.gov/glca/learn/nature/endangeredfish.htm#:~:text=The%20Colorado%20River%20Basin&text=They%20are%20home%20to%2014,exist%20nowhere%20else%20on%20earth.
New Mexico Environment Department, Drinking Water Bureau, 2018, New Mexico active ground and surface water systems GIS data, accessed July 8, 2021, at https://x-23.env.nm.gov/arcgis/rest/services/dwb/drinking_water_sources/MapServer.
New Mexico Office of the State Engineer, 2020, NM irrigation districts GIS data, accessed July 14, 2021, at https://services2.arcgis.com/qXZbWTdPDbTjl7Dy/ArcGIS/rest/services/NM_Irrigation_Districts/FeatureServer/0.
Plumer, B., 2016, It’s not just the Oregon militia—Why many Westerners get angry about federal land rights: Vox, January 5, 2016, accessed December 27, 2022, at https://www.vox.com/2016/1/5/10718128/federal-land-west-oregon-militia.
PRISM Climate Group, Oregon State University, 2021, 30-year normal precipitation (annual) and 30-year normal mean temperature data (period 1981–2010) GIS data, accessed July 2, 2021, at http://prism.oregonstate.edu.
Rumsey, C.A., Miller, O., Hirsch, R.M., Marston, T.M., and Susong, D.D., 2021, Substantial declines in salinity observed across the Upper Colorado River Basin during the 20th century, 1929–2019: Water Resources Research, v. 57, no. 5. [Also available at https://doi.org/10.1029/2020WR028581.]
Schoengold, K., Sunding, D.L., and Moreno, G., 2006, Price elasticity reconsidered—Panel estimation of an agricultural water demand function: Water Resources Research, v. 42, no. 9. [Also available at https://doi.org/10.1029/2005WR004096.]
Siddik, M.A.B., Dickson, K.E., Rising, J., Ruddell, B.R., Marston, L.T.,2022, Interbasin water transfers in the United States and Canada: HydroShare, accessed December 27, 2022, at https://doi.org/10.4211/hs.1160b46d62f1488693a4dd2447793410.
Southern Nevada Water Authority, 2021, Restricting outdoor water use, accessed February 6, 2022, at https://www.snwa.com/importance-of-conservation/understand-laws-ordinances/index.html#useless.
Thomas, C., and Koontz, L., 2021, 2020 national park visitor spending effects—Economic contributions to local communities, States, and the Nation: National Park Service, accessed September 22, 2021, at https://doi.org/10.36967/nrr-2286547.
University of Arizona Water Resources Research Center, 2020, Snapshot of Community Water System (CWS) ownership in the Colorado River Basin and adjacent areas reliant on Colorado River water, accessed July 23, 2021, at https://www.arcgis.com/apps/dashboards/8502820c41374e6eb35fd90a2ffb656a.
U.S. Army Corps of Engineers, 2021, National Inventory of Dams GIS data, available online as a Web GIS Service and API at https://nid.usace.army.mil/.
U.S. Census Bureau, 2021, 2020 Census statistics highlight local population changes and Nation’s racial and ethnic diversity: U.S. Census Bureau, Release no. CB21–CN.55, accessed February 4, 2022, at https://www.census.gov/newsroom/press-releases/2021/population-changes-nations-diversity.html.
U.S. Department of Agriculture, National Agricultural Statistics Service, 2012, Cropland Data Layer, accessed September 20, 2021, at https://nassgeodata.gmu.edu/CropScape/.
U.S. Department of Agriculture, National Agricultural Statistics Service, 2017, Cropland Data Layer, accessed September 20, 2021, at https://nassgeodata.gmu.edu/CropScape/.
U.S. Department of Energy, 2011, Natural contamination from the Mancos Shale: U.S. Department of Energy, Office of Legacy Management, accessed February 4, 2022, at https://www.energy.gov/sites/prod/files/S07480_NatContRpt.pdf.
U.S. Department of the Interior, 2016, Glen Canyon Dam Long-Term Experimental and Management Plan Final Environmental Impact Statement (LTEMP FEIS): U.S. Department of the Interior, Bureau of Reclamation, Upper Colorado Region and National Park Service, Intermountain Region. [Also available at https://ltempeis.anl.gov/documents/final-eis/.]
U.S. Energy Information Administration, 2020, Power Plants GIS data, accessed July 9, 2020, at https://www.eia.gov/maps/map_data/PowerPlants_US_EIA.zip.
U.S. Fish and Wildlife Service, 2020, National Wildlife Service Boundaries GIS data, accessed September 15, 2021, at https://ecos.fws.gov/ServCat/Reference/Profile/135271.
U.S. Forest Service, 2017, Wild and Scenic River Segments Line Feature GIS data, accessed September 15, 2021, at https://data-usfs.hub.arcgis.com/datasets/usfs::national-wild-and-scenic-river-lines-feature-layer/about.
U.S. Forest Service, 2021, FS National Forests Dataset GIS data, accessed September 15, 2021, at https://data-usfs.hub.arcgis.com/datasets/usfs::fs-national-forests-dataset-us-forest-service-proclaimed-forests/about.
U.S. Geological Survey, 2005, National Hydrography Dataset Plus, Waterbody GIS data, accessed July 12, 2021, at https://prd-tnm.s3.amazonaws.com/index.html?prefix=StagedProducts/Hydrography/NHDPlusHR/Beta/GDB/.
U.S. Geological Survey, 2007, Major rivers falling within UCRB and Little Colorado River basin GIS data, accessed July 28, 2021, at https://www.sciencebase.gov/catalog/item/4f4e49f3e4b07f02db5ef396.
U.S. Geological Survey, 2019a, Watershed Boundary Dataset GIS data, accessed January 17, 2021, at https://www.usgs.gov/core-science-systems/ngp/national-hydrography/access-national-hydrography-products.
U.S. Geological Survey, 2019b, Water-use terminology, accessed February 2, 2022, at https://www.usgs.gov/mission-areas/water-resources/science/water-use-terminology.
U.S. Geological Survey, 2021a, Shaded Relief GIS data, accessed July 28, 2021, at https://basemap.nationalmap.gov/arcgis/rest/services/USGSShadedReliefOnly/MapServer.
U.S. Geological Survey, 2021b, Protected Areas Database of the United States (PAD-US) 2.1 GIS data, accessed July 28, 2021, at https://www.sciencebase.gov/catalog/item/602ffe50d34eb1203115c7ab.
Utah Division of Water Resources, 2021, Utah Culinary Water Service Areas, GIS data, accessed May 14, 2021, at https://services.arcgis.com/ZzrwjTRez6FJiOq4/ArcGIS/rest/services/CulinaryWaterServiceAreas/FeatureServer.
Vörösmarty, C., Lettenmaier, D., Leveque, C., Meybeck, M., Pahl-Wostl, C., Alcamo, J., Cosgrove, W., Grassl, H., Hoff, H., Kabat, P., Lansigan, F., Lawford, R., and Naiman, R., 2004, Humans transforming the global water system: Eos, Transactions, American Geophysical Union, v. 85, no. 48, p. 509–514.
Wyoming Department of Revenue, 2021, Wyoming Water and Sewer Districts GIS data, accessed January 27, 2021, at https://wyo-prop-div.wyo.gov/tax-districts/maps-gis-data.
Wyoming State Engineer’s Office, 2001, Green River Basin Wyoming Irrigation Districts GIS data, accessed September 17, 2021, at https://waterplan.state.wy.us/plan/green/2001/gis/irrdist.html.
Glossary
Terminology and definitions have been modified from the U.S. Geological Survey (2019b) Water-Use Terminology web page.
Aquaculturewater use
Water use associated with the farming of organisms that live in water (such as finfish and shellfish) and off stream water use associated with fish hatcheries.
Consumptive use
The part of water withdrawn that is evaporated, transpired, incorporated into products or crops, consumed by humans or livestock, or otherwise not available for immediate use.
Domestic water use
Water used for indoor household purposes such as drinking, food preparation, bathing, washing clothes and dishes, flushing toilets, and outdoor purposes, such as watering lawns and gardens.
Industrial water use
Water used for fabrication, processing, washing, and cooling.
Irrigation water use
Water that is applied by an irrigation system to assist crop and pasture growth or to maintain vegetation on recreational lands such as parks and golf courses.
Livestock water use
Water used for livestock watering, feedlots, dairy operations, and other on-farm needs.
Mining water use
Water used for the extraction of naturally occurring minerals including solids (such as coal, sand, gravel, and other ores), liquids (such as crude petroleum), and gases (such as natural gas).
Public-supply water use
Water withdrawn by public and private water suppliers that furnish water to at least 25 people or have a minimum of 15 connections.
Self-supplied water use
Water withdrawn from a groundwater or surface-water source by a user rather than being obtained from a public-supply source.
Thermoelectric water use
Water used in the process of generating electricity with steam-driven turbine generators.
Appendix 1. Keywords Used in Literature Searches
Table 1.1.
Keywords used in R scripts to conduct literature searches related to human factors used to estimate and forecast water demand in the Upper Colorado River Basin.[—, no keyword]
Appendix 2. Geospatial Boundaries for Bureau of Reclamation Projects
-
Central Arizona Project:
-
Northern Colorado Water Conservancy District, Colorado-Big Thompson Project:
-
Central Utah Project:
-
Salt River Project:
-
All-American Canal:
-
Morelos Diversion Dam:
Appendix 3. Cropland Data Layer
Table 3.1.
Summary of land-cover types within the existing Cropland Data Layer (U.S. Department of Agriculture, National Agricultural Statistics Service, 2012, 2017).[Veg., vegetable; Dbl, double; Wht, wheat; WinWht, winter wheat; Misc, miscellaneous; Pop or Orn Corn, typo of “Popcorn” in original dataset]
Appendix 4. Total Water Withdrawals in 2015
Table 4.1.
Total water withdrawals, by category, in 2015.[All values are in million gallons per day. Values for public supply, aquaculture, industrial, mining, and thermoelectric include combined freshwater and saline-water withdrawals. Values for irrigation and thermoelectric include withdrawals and reclaimed wastewater. Data were summarized for each category from the county-level data release (Dieter and others, 2018b) by using an R Script. See the companion data release (Hines and others, 2022) to view the script]
Appendix 5. Publicly Available Water Service Provider/Service Area Map Information
Appendix 6. Methods for Developing Spatial Data
Conversion Factors
U.S. customary units to International System of Units
Temperature in degrees Celsius (°C) may be converted to degrees Fahrenheit (°F) as follows:
°F = (1.8 × °C) + 32.
Datum
Vertical coordinate information is referenced to the North American Vertical Datum of 1988 (NAVD 88).
Horizontal coordinate information is referenced to the North American Datum of 1983 (NAD 83).
Elevation, as used in this report, refers to distance above the vertical datum.
For more information about this publication, contact
Director, Integrated Information Dissemination Division
U.S. Geological Survey Water Resources Mission Area
1 Gifford Pinchot Drive
Madison, WI 53726
For additional information, visit
https://www.usgs.gov/mission-areas/water-resources
Publishing support provided by
Denver and Lafayette Publishing Service Centers
Suggested Citation
Herman-Mercer, N., Bair, L., Hines, M., Restrepo-Osorio, D., Romero, V., and Lyde, A., 2023, Human factors used to estimate and forecast water supply and demand in the Upper Colorado River Basin: U.S. Geological Survey Scientific Investigations Report 2023–5015, 46 p., https://doi.org/10.3133/sir20235015.
ISSN: 2328-0328 (online)
Study Area
| Publication type | Report |
|---|---|
| Publication Subtype | USGS Numbered Series |
| Title | Human factors used to estimate and forecast water supply and demand in the Upper Colorado River Basin |
| Series title | Scientific Investigations Report |
| Series number | 2023-5015 |
| DOI | 10.3133/sir20235015 |
| Year Published | 2023 |
| Language | English |
| Publisher | U.S. Geological Survey |
| Publisher location | Reston, VA |
| Contributing office(s) | Southwest Biological Science Center, WMA - Integrated Information Dissemination Division, Oklahoma-Texas Water Science Center |
| Description | Report: v, 46 p.; Data Release |
| Country | United States |
| State | Arizona, Colorado, Nevada, New Mexico, Utah, Wyoming |
| Online Only (Y/N) | Y |
| Google Analytic Metrics | Metrics page |