

Bed-Material Transport in the Upper Esopus Creek Watershed, Ulster and Greene Counties, New York, 2017–20
Links
- Document: Report (3.84 MB pdf) , HTML , XML
- Data Release: USGS data release - Bed material transport data in the upper Esopus Creek watershed, Ulster and Greene Counties, NY, 2017-2020
- Download citation as: RIS | Dublin Core
Acknowledgments
Wae D. Davis of the New York City Department of Environmental Protection provided valuable geologic and geomorphic insights and inspired the use of active- and passive-tracer technology. This project would not have been possible without the field assistance of Noel Deyette, Heather Dormady, and Luis Rodriguez, all of the U.S. Geological Survey.
Abstract
The U.S. Geological Survey, in cooperation with the Ashokan Watershed Stream Management Program, investigated the feasibility of bedload monitoring in the upper Esopus Creek watershed, Ulster and Greene Counties, New York, from 2017 to 2020. Traditional bedload samples were collected at two locations: Birch Creek at Big Indian, New York (station 013621955), and Stony Clove Creek at Jansen Road at Lanesville, New York (station 01362336), during two storms. Measured bedload-transport rates ranged from less than 1 to 37.2 short tons per day during the study period. Active and passive tracers were deployed in Stony Clove Creek at Jansen Road to measure bed-material displacement during storms. Accelerometers in the active tracers provided data on the initiation and duration of motion of bed material in the 128- to 190-millimeter size class (B-axis measurement of 175 millimeters). The active tracers were loosely placed on the streambed and were generally mobilized at streamflows of 130–375 cubic feet per second. Displacement of the passive tracers was measured five times and provided data on the variability of displacement of multiple-size classes of bed material by different streamflows. Passive-tracer data also indicated that particles larger than the opening of the Elwha sampler deployed for traditional sampling may have been in transport during sampling. Sediment-generated noise was not distinguishable from background stream noise in hydrophone recordings.
Introduction
The upper Esopus Creek is located in the Catskill Mountains of New York State and is the primary tributary to the Ashokan Reservoir, with a 192 square mile (mi2) watershed from the source, Winnisook Lake, to the Ashokan Reservoir near Boiceville, New York (Smith and others, 2008; fig. 1). The area of the Ashokan Reservoir watershed is 255 mi2, and it is one of six reservoirs in the West-of-Hudson Catskill-Delaware system. Suspended-sediment and turbidity are water-quality concerns in New York City’s water-supply system (NYSDOH, 2017) and have been the subject of extensive monitoring studies in the upper Esopus Creek watershed (McHale and Siemion, 2014; Siemion and others, 2016; NYCDEP, 2017). Numerous stream-management projects have been implemented in the upper Esopus Creek watershed in recent years (Catskill Streams, 2020), and more are planned through at least 2026 to increase stream stability and decrease suspended-sediment and turbidity transport (NYCDEP, 2019).
Suspended sediment is an important component of sediment transport, and turbidity is the constituent of regulation for the New York City drinking-water supply; however, sediment transport also includes the material transported as bedload. Measurements of bedload were not included in previous sediment-monitoring projects in the upper Esopus Creek watershed. Bedload transport, however, is an important design component of stream-channel stabilization projects. Stream-project designs in the upper Esopus Creek watershed have generally used bedload estimates from published sediment-transport equations. The use of bedload-transport equations, however, can be problematic (Gray and others, 2010) and can yield results that are inaccurate (Hinton and others, 2018) because they are often based on data collected in gravel or sand-bed systems. Although there is no evidence to suggest that inaccurate bedload measurements have adversely influenced previous stream projects, the use of inaccurate estimates, particularly if large, may influence project design, cost, and success. Calibration of bedload-transport equations with physical measurements can greatly improve the accuracy of predictive results (Hinton and others, 2018); however, physical measurements of bedload are often difficult and expensive, and may be subject to large temporal and spatial variability (Gray and others, 2010, Itoh and others, 2018).
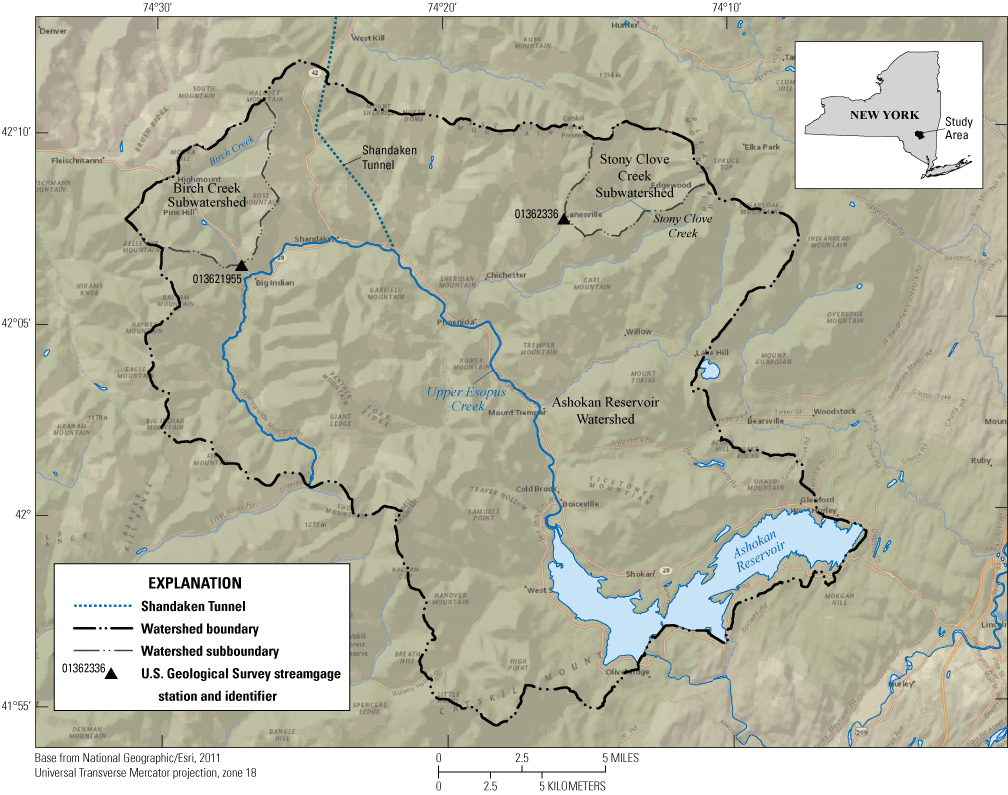
Overview map of the Ashokan Reservoir watershed showing sampling points collected from 2017 to 2020 within the Stony Clove Creek at Jansen Road at Lanesville, New York (station 01362336) and Birch Creek at Big Indian, New York (station 013621955) subwatersheds.
The U.S. Geological Survey, in cooperation with the Ashokan Watershed Stream Management Program in July 1, 2017–September 30, 2020, conducted a pilot study to determine the feasibility of measuring bedload in the upper Esopus Creek watershed at two existing streamgages on watersheds that include differing geomorphic conditions. The two sampling locations were at Stony Clove Creek at Jansen Road at Lanesville (station 01362336) and at the Lasher Road bridge downstream from Birch Creek at Big Indian (station 013621955). Multiple bedload-measuring techniques were tested. These techniques included the use of traditional bedload samplers, active and passive tracers, and hydrophones to measure the transport of bed material through a range of streamflow conditions.
Objectives
The objectives of this report are to describe the field-data collection methods used during the study and to summarize the resulting data. Supporting data are available in Siemion and others (2021).
Methods
The distribution of bed-sediment particle sizes was estimated by Wolman pebble counts (Wolman, 1954). Two 30-meter longitudinal transects were measured at each monitoring site at the initiation of the project, one immediately upstream and one downstream from the two bedload-sampling locations. Particle sizes were measured by using a gravelometer along ten evenly spaced stream cross sections in each longitudinal transect.
Bedloads were sampled by using the equal-width increment method and a pressure-difference bedload sampler (Edwards and Glysson, 1999). An Elwha bedload sampler with a 203-millimeter (mm) by 102-mm opening was deployed from a type-E truck and crane with a power-adapted B-56 reel. Sampling times, depending on streamflow conditions, ranged from 30 seconds to one minute. Four passes were made across the stream, and 10 equally spaced locations were sampled during each pass. Samples from each pass were combined. The sample from each pass was analyzed individually at the Cascade Volcano Observatory Sediment Laboratory for total-mass and particle-size distribution. With this method, the results from the four passes could be averaged if streamflow conditions were steady or could be used individually if conditions were rapidly changing. Bedload-transport rates were calculated by following methods in Edwards and Glysson (1999).
Passive tracers of bed-material movement were constructed by using radio-frequency identification (RFID) technology that uniquely identified each rock (Olinde and Johnson, 2015; Phillips and Jerolmack, 2014). Rocks from the study reach that were representative of the size distribution found in the channel, but greater than the opening of the Elwha sampler deployed for traditional sampling, were selected. Each rock had a ¼-inch hole drilled in it, a passive RFID tag inserted, and the hole sealed with epoxy. The rocks were then placed in a 1-meter-wide swath across the stream channel at Stony Clove Creek at Jansen Road, and the coordinates of the location were recorded by using a real-time kinematic (RTK) Global Positioning System (GPS). Rocks that were too large to be transported were prepared in place. Following the occurrence of potential bedload-transporting streamflows, a backpack RFID detector was used to locate and identify the tagged rocks, and the coordinates of the new location were recorded again with the RTK GPS. The passive tracers were left in place and relocated after subsequent events.
Ten active tracers of bedload movement were constructed, deployed, and recovered by using methods established in Olinde and Johnson (2015). The tracer containers were produced by injection molding that used a copper-filled alloy at 3.3 grams per cubic centimeter with a B-axis measurement of 175 mm. The containers duplicated the density of sandstone when the hollow interior that housed the electronics was considered. An accelerometer (Onset, 2013) and RFID tag were placed in the center of the tracer container. The accelerometer measured the static acceleration of gravity along three axes, even when the tracer was sitting motionless. After each of the first three surveys, the active tracers were excavated, their data were downloaded, and they were replaced in their observed positions in the streambed. After the fourth survey, the active tracers were excavated, their data were downloaded, and they were replaced in the initial transect. The rationale for the change in the replacement method was that a minimal quantity of useful data was gathered by leaving the active tracers buried in the streambed.
The distance traveled for each active and passive tracer was determined by using the Near and the Locate Feature Along Routes tools in ArcGIS, a geographic information system (Esri, 2019). The tracers were represented as a scattered-point dataset after obtaining the latitudes and longitudes of the tracers locations, all within the stream channel. All tracers were snapped to the center line of the stream by using the Near tool for standardizing the measurement process. The tool had several methods by which to assign a new coordinate pair. The preferred method was geodesic, which relocated the tracers along the shortest possible distance between their original locations and the streamline center. The streamline was converted to a route feature and the Locate Feature Along Routes tool was then used to compute the distances along the streamline once all tracers were snapped to the streamline center. The Locate Feature Along Routes tool calculated the distance along the line on which the tracer was located from the starting point of the streamline. Comparisons of the calculated distances of the tracers for each survey indicated how far the tracers traveled between each survey period.
Four hydrophone-based underwater sound-recording systems (Marineau and others, 2016) were constructed and programmed, and two systems were installed at each monitoring site (one system on each bank). Each system comprised two hydrophones, one liquid-detection sensor, and one recorder. At each study site, two systems were installed to monitor spatial variability in transport and to provide redundancy in data collection in case equipment was damaged by flood debris. The hydrophones were mounted on bridge abutments or boulders on the stream bank. The recorders were programmed to periodically check the sensor to determine if the water level had risen. When water levels were low, the recorders remained in standby mode to preserve power. Once activated, the recorders recorded 1 minute of audio data at 15-minute intervals. The data were stored on a removable memory card. The recorders were serviced periodically to replace batteries and the memory cards.
The data stored on the removable memory card were postprocessed following procedures described in Marineau and others (2019) with a fast-Fourier transform to calculate sound level at various frequency ranges. The sound levels over specific frequency ranges that correlated well with coarse-bedload transport were intended to be averaged together. The acoustic data and physical bedload samples were intended to be used to develop an acoustic-based sediment-rating curve and, if possible, a time series of estimated bedload-transport rates for one or more size ranges.
Results
The results of bed-sediment measurements, traditional bedload measurements, and active and passive tracer surveys are given in the following sections. The hydrophone data are not presented because rock-generated noise was not distinguishable from background streamflow noise at the monitoring sites; instead, the hydrophone results are discussed in context of other recent studies.
Hydrophones
Audio recordings from the study period revealed that the hydrophones detected very little sediment- generated noise. Listening to the raw audio files, however, indicated a substantial amount of noise, likely from water turbulence due to air entrainment around the large immobile cobbles and small boulders. Previous work has found that bed roughness (which is often directly related to bed-material size), and channel slope both affect sound propagation (Geay and others, 2019). Increased bed roughness is thought to scatter sound waves resulting in an increase in sound attenuation (Wren and others, 2015). Attenuation in this context is a reduction in the intensity of sound-pressure waves. Channel gradient is also correlated with increased attenuation, but that may be due to coarser material, and perhaps shallower water, in steeper channels. Steep channels with rough beds also tend to generate more noise from turbulence, which appears to dominate the soundscape. This result is consistent with findings from another recent study at Glacier Creek, Washington (M. Marineau, U.S. Geological Survey, written communication, 2021). The study site was a steep channel with a coarse (cobble-boulder) bed. In that study, sediment could be heard by ear, but water-turbulence noise dominated the soundscape.
The findings from Stony Clove Creek and Birch Creek were compiled with other recent studies to determine how channel characteristics qualitatively relate to the ability to collect reliable acoustic data for bedloads (Marineau and others 2019). In general, the method has worked best in channels with a slope of 1 percent or less and with gravel- or cobble-size material (with few if any boulders). The slopes of the creeks in this study were about 1.5–1.6 percent, and although bedload-transport rates were generally low during the time when the hydrophones were deployed, it is unlikely that a higher flow and transport rate would have produced enough sediment-generated noise to dominate the soundscape in these two channels.
Bed-Sediment Measurements
Bed-material pebbles were counted by the Wolman method at Birch Creek (station 013621955) and Stony Clove Creek (station 01362336) during August 2017. The particle sizes measured at Birch Creek ranged from sand (less than 2 mm) to very large boulders (2,048–4,096 mm). The particle sizes measured at Stony Clove Creek at Jansen Road ranged from very fine gravel (2–2.8 mm) to large boulders (1,024–2,048 mm). Cobbles (75–250 mm) were the most frequent types of particles measured at both sites. The cumulative particle-size distribution, defined as the percentage of the sample with a size equal to or smaller than a given measurement, of the bed material upstream and downstream from each sampling site is shown in figure 2.
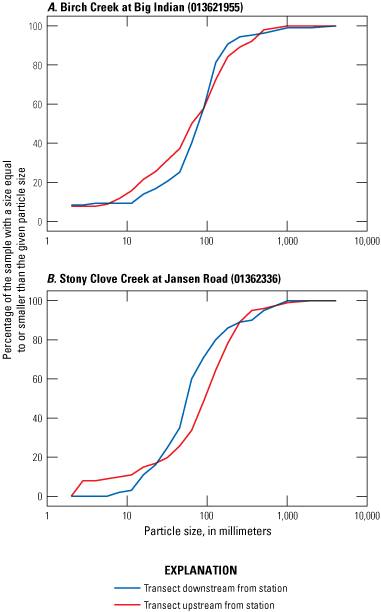
Graphs showing cumulative percent particle-size distributions of bed material from Wolman-method pebble counts upstream from and downstream from sampling sites at A, Birch Creek at Big Indian, New York (station 013621955); and B, Stony Clove Creek at Jansen Road at Lanesville, New York (station 01362336).
Bedload Sampling
During the July 1, 2017 to September 30, 2020 study period, bedload samples from Birch Creek were collected during spring-runoff events on April 4 and April 16, 2018. Peak streamflows during the April 4 sampling were equaled or exceeded 4.9 percent of the time, and during the April 16 event, 0.7 percent of the time. Both samples were collected at less than the estimated 360-cubic feet per second (ft3/s) bankfull streamflow (U.S. Geological Survey, 2016) and less than the 407-ft3/s 80-percent annual exceedance probability streamflow (1.25-year recurrence interval; Wall and others, 2014). Bedload-transport rates ranged from 0.03 to 0.28 short tons per day during the April 4 event and 1.07 to 1.73 tons per day during the April 16 event (fig. 3). Sampled particles ranged in size from less than 1 mm to less than 16 mm in size during the April 4 event and from less than 1 mm to less than 32 mm during the April 16 event (fig. 4).
Bedload samples were collected for one summer runoff event on July 24 and 25, 2018, at Stony Clove Creek at Jansen Road. Peak streamflows during the sampling were equaled or exceeded less than 0.1 percent of the time during the July 1, 2017 to September 30, 2020 study period. The July 24 event exceeded the 665-ft3/s bankfull streamflow (U.S. Geological Survey, 2016) and approximated the 50-percent annual exceedance probability discharge (2-year recurrence interval; U.S. Geological Survey, 2016). Bedload-transport rates ranged from 7.48 to 37.2 tons per day during the July 24 sampling and from 1.72 to 11.0 short tons per day during the July 25 sampling (fig. 3). Sampled particles ranged in size from less than 1 mm to less than 64 mm in size during July 24 and 25. (fig. 4). The passive-tracer results indicate that it was possible that material larger than the opening of the Elwha sampler might have been in transport during the sampled events at Stony Clove Creek at Jansen Road (fig. 5).
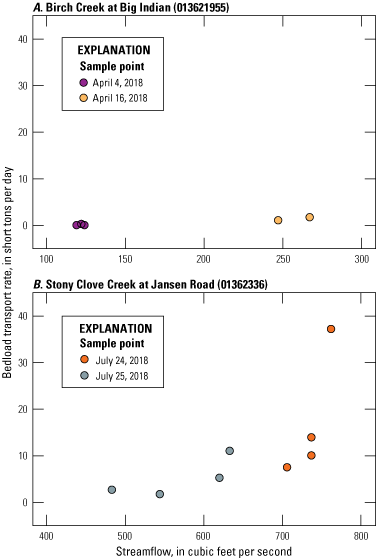
Bedload-transport rates as a function of streamflow in A, Birch Creek at Big Indian, New York (station 013621955) during April 4 and April 16, 2018; and in B, Stony Clove Creek at Jansen Road at Lanesville, New York (station 01362336) during July 24 and July 25, 2018.
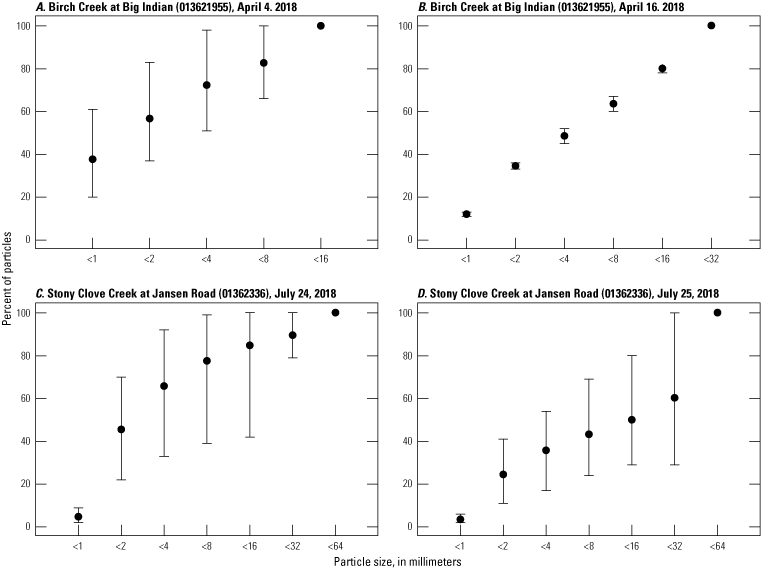
Cumulative percent bed load particle-size distributions sampled on A, April 4, 2018, at Birch Creek at Big Indian, New York (station 013621955); B, on April 16, 2018, at Birch Creek at Big Indian, N.Y. (station 013621955); C, on July 24, 2018, at Stony Clove Creek at Jansen Road, Lanesville, New York (station 01362336); and D, on July 25, 2018, at Stony Clove Creek at Jansen Road, Lanesville, N.Y. (station 01362336). Black dots represent the mean values of all samples for the event, and the whiskers represent the minimum and maximum percentage values for particles.
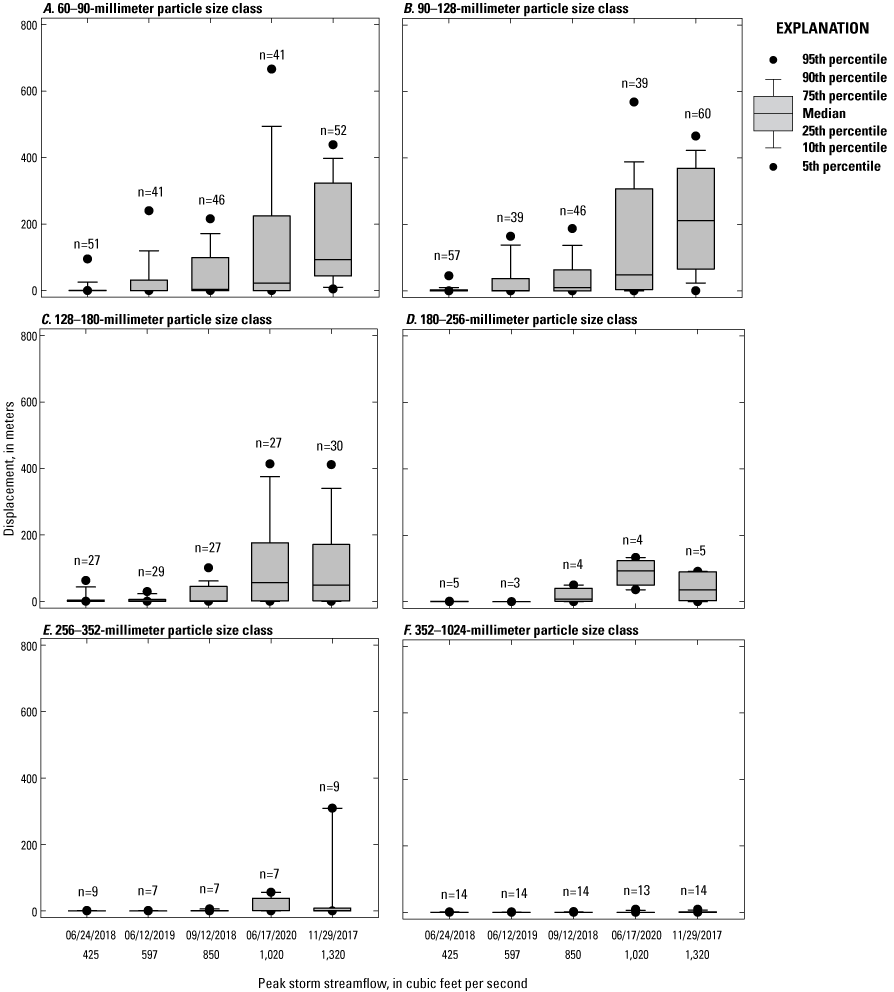
Box plots of passive-tracer displacement plotted by peak-storm streamflow between surveys conducted on November 29, 2017, June 24, 2018, September 12, 2018, June 12, 2019, and June 17, 2020, grouped by particle-size class. A, 60–90 millimeters (mm); B, 90–100 mm; C, 128–180 mm; D, 180–256 mm; E, 256–352 mm; and F, 352–1,024 mm.
Passive Tracers
Passive tracers were deployed in Stony Clove Creek during the first week of October 2017. Five surveys were conducted to locate the passive tracers during the study: November 29, 2017; June 24, 2018; September 12, 2018; June 12, 2019; and June 17, 2020. Maps of the initial locations and the survey results produced by the passive tracers are provided in appendix 1. Ideally, the locations of the passive tracers would have been resurveyed after each potential transport event; however, this was not possible. Surveys could be conducted only during relatively low-flow conditions when it was safe to wade across the channel. In some cases, there were multiple high-streamflow events between surveys. Two potentially bed-mobilizing streamflow events occurred between the June 2018 and September 2018 surveys and three between the June 2019 and June 2020 surveys. It is not possible to determine which of the events caused the displacement of the passive tracers, or if the displacement was a cumulative effect.
Passive-tracer displacement generally increased with increasing peak streamflow between surveys for each size class (fig. 5). The relatively large increases in displacement associated with the 1,020 and 1,320 ft3/s peak streamflows may have been the result of multiple bed-mobilizing storm events and the initial loose positioning of the tracers, respectively. Nonetheless, the passive-tracer data provided a range of the peak streamflows that mobilized specific size classes.
Active Tracers
Deployment and survey dates of the active tracers were the same as for those of the passive tracers. Movements of the active tracers were inferred from changes in acceleration measured by the accelerometers. Figure 6 shows the streamflow and acceleration recorded by one of the active tracers during the two largest storms during the study. The active tracers were placed loosely on the streambed before each of these storms. The movement of active tracer 3 began at about 370 ft3/s streamflow during the October 29–30, 2017 storm and at about 140 ft3/s streamflow during the October 31–November 1, 2019 storm. Figure 6 and figure 7 were used to determine at what streamflow that accelerometer movement began in the X, Y, and Z directions. The variability in the movement of all ten active tracers during the October 2017 storm is shown on figure 7. Initial movement of the active tracers occurred within a one-hour period between streamflows of 130 and 500 ft3/s. Incipient motion of bed material is generally controlled by local hydrodynamic conditions, physical characteristics of the particles, and interactions between particles (Badoux and others, 2012) in addition to streamflow magnitude.
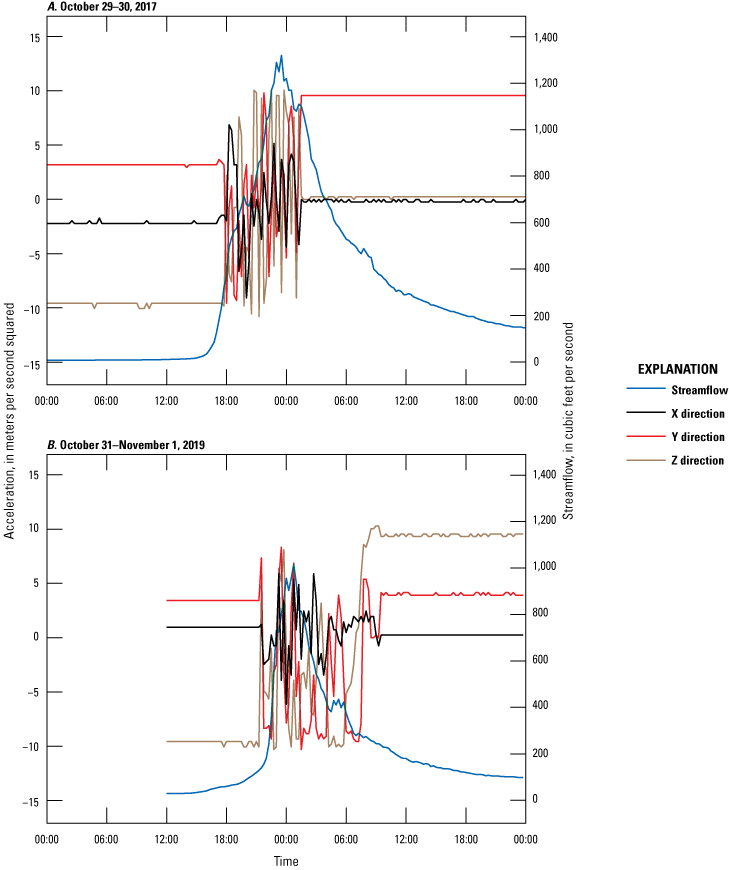
Streamflow and acceleration measured by active tracer 3 in three dimensions during two storms in Stony Clove Creek with the movement of active tracer 3 initiated at A, about 370 cubic feet per second flow rate during the October 29–30, 2017 storm; and B, at about 140 cubic feet per second flow rate during the October 31–November 1, 2019 storm.
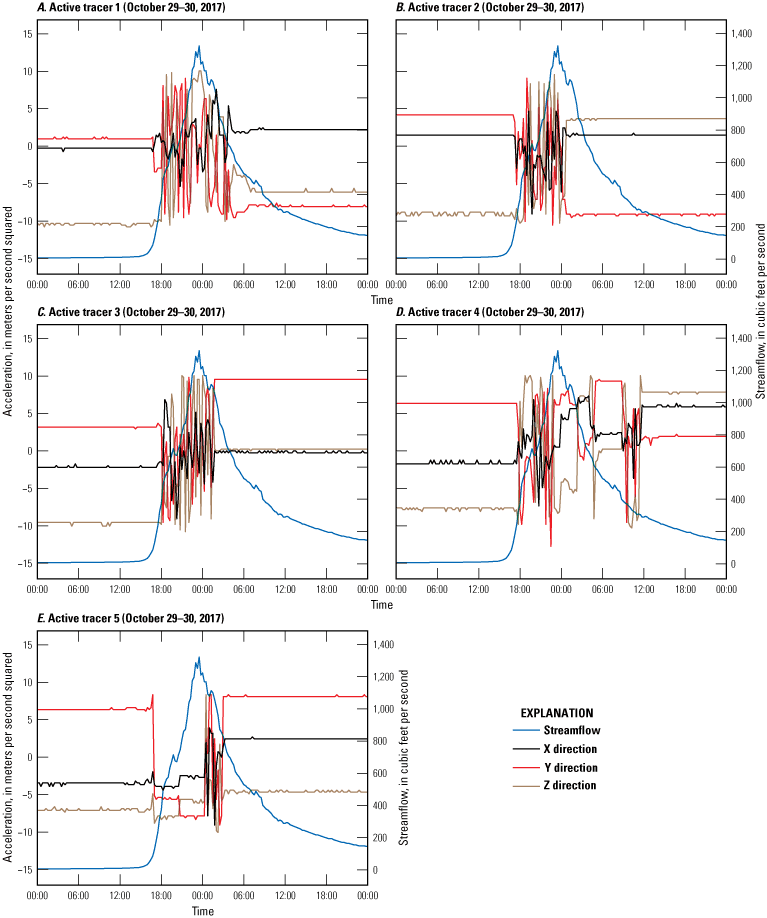
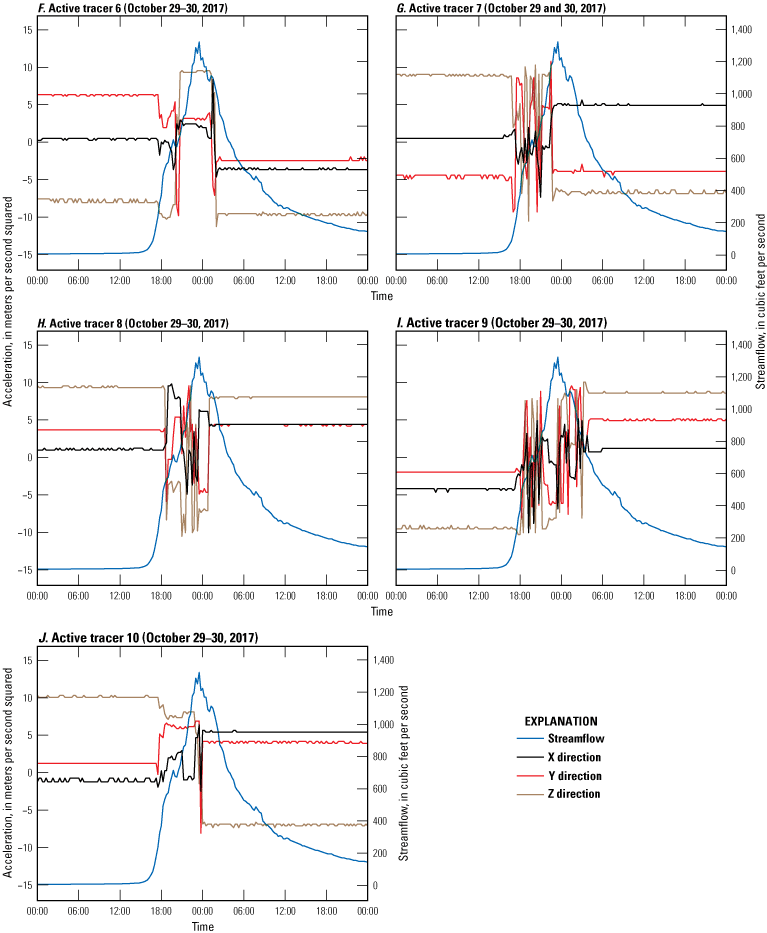
Streamflow and acceleration in three dimensions from 10 active tracers in Stony Clove Creek during the storm on October 29–30, 2017, from A, active tracer 1; B, active tracer 2; C, active tracer 3; D, active tracer 4;E, active tracer 5; F, active tracer 6; G, active tracer 7; H, active tracer 8; I, active tracer 9; and J; active tracer 10. Movement of the active tracers began at about 130 to 500 cubic feet per second flow rate during the storm.
Summary
Two sets of bedload samples were collected at Birch Creek at Big Indian, New York (station 013621955), and Stony Clove Creek at Jansen Road at Lanesville, New York (station 01362336), during the 2018 water year. One of the sample sets from Stony Clove Creek at Jansen Road was collected during bankfull-streamflow conditions. Measured bedload-transport rates ranged from less than 1 to 37.2 tons per day during the study. Active tracers with a B-axis measurement of 175 millimeter were loosely placed on the streambed and were generally mobilized at streamflows of 130 to 375 cubic feet per second. Passive-tracer data provided a range of peak streamflows that mobilized specific size classes and indicated that particles larger than the opening of the Elwha sampler may have been in motion during sampling. Sediment-generated noise collected in water year 2017 was not distinguishable from background stream noise in hydrophone recordings.
References Cited
Badoux, A., Turowski, J.M., Mao, L., Mathys, N., and Rickenmann, D., 2012, Rainfall intensity–duration thresholds for bedload transport initiation in small Alpine watersheds: Natural Hazards and Earth System Sciences, v. 12, p. 3091–3108, accessed February 12, 2022, at https://doi.org/10.5194/nhess-12-3091-2012.
Catskill Streams, 2020, Stream management projects: Catskill Streams web page, accessed February 23, 2021, at https://catskillstreams.org/stream-management-program/project-maps/.
Edwards, T.K., and Glysson, G.D., 1999, Field methods for measurement of fluvial sediment: U.S. Geological Survey Techniques of Water-Resources Investigations, book 3, chap. C2, 89 p., accessed April 1, 2021, at https://doi.org/10.3133/twri03C2. [Supersedes the previous version, released in 1998.]
Esri, 2019, ArcGIS Desktop Arcmap 10.7.1: Esri software release, accessed February 14, 2022, at https://support.esri.com/en/Products/Desktop/arcgis-desktop/arcmap/10-7-1.
Geay, T., Michel, L., Zanker, S., and Rigby, J., 2019, Acoustic wave propagation in rivers—An experimental study: Earth Surface Dynamics, v. 7, no. 2, p. 537–548, accessed April 1, 2021, at https://doi.org/10.5194/esurf-7-537-2019.
Gray, J.R., Laronne, J.B., Marr, J.D.G., 2010, Bedload-surrogate monitoring technologies: U.S. Geological Survey Scientific Investigations Report 2010–5091, 37 p., accessed April 1, 2021, at https://doi.org/10.3133/sir20105091.
Hinton, D., Hotchkiss, R.H., and Cope, M., 2018, Comparison of calibrated empirical and semi-empirical methods for bedload transport rate prediction in gravel bed streams: Journal of Hydraulic Engineering (New York, N.Y.), v. 144, no. 7, article 04018038, 17 p., accessed April 1, 2021, at https://doi.org/10.1061/(ASCE)HY.1943-7900.0001474.
Itoh, T., Nagayama, T., Utsunomiya, R., Fujita, M., Tsutsumi, D., Miyata, S., and Mizuyama, T., 2018, Development of new sensor systems for continuous bedload monitoring using a submerged load‐cell system (SLS): Earth Surface Processes and Landforms, v. 43, no. 8, p. 1689–1700, accessed April 1, 2021, at https://doi.org/10.1002/esp.4329.
Marineau, M., Wright, S., and Gaeuman, D., 2016, Calibration of sediment-generated noise measured using hydrophones to bedload transport in the Trinity River, in Special session—Applications of hydro-acoustics to river morphodynamics, in Sediment transport and river morphodyamics, chap. B of Constantinescu, G., Garcia, M., and Hanes, D., eds., 2016, River flow 2016—International Conference on Fluvial Hydraulics, 8th, St. Louis, Mo., July 11–14, 2016, Proceedings: Leiden, Netherlands, CRC Press/Balkema, p. 1519–1526. [Also available at https://doi.org/10.1201/9781315644479.]
Marineau, M.D., Wright, S.A., Gaeuman, D., Curran, C.A., Stark, K., Siemion, J., and Schenk, E.R., 2019, Overview of five recent acoustic bedload monitoring field experiments using hydrophones, in Sediment surrogate measurements, sediment yield and fingerprinting, stream restoration, water quality, watershed management, v. 4 of Proceedings of SEDHYD 2019—Conferences on sedimentation and hydrologic modeling—Improving resiliency and sustainability of watershed resources and infrastructure, 1st, [4th Joint Federal Interagency Conference on Sedimentation and Hydrologic Modeling, a joint meeting of the 6th Federal Interagency Hydrologic Modeling Conference and the 11th Federal Interagency Sedimentation Conference], Reno, Nev., June 24–28, 2019: SEDHYD, Inc., 14 p. [Also available at http://sedhyd.org/past/SEDHYD_Proceedings_2019_ALL.pdf.]
McHale, M.R., and Siemion, J., 2014, Turbidity and suspended sediment in the upper Esopus Creek watershed, Ulster County, New York: U.S. Geological Survey Scientific Investigations Report 2014–5200, 42 p., accessed April 1, 2021, at https://doi.org/10.3133/sir20145200.
New York City Department of Environmental Protection [NYCDEP], 2017, Upper Esopus Creek watershed turbidity/suspended sediment monitoring study—Project design report: New York City Department of Environmental Protection, variously paginated, accessed April 1, 2021, at https://catskillstreams.org/wp-content/uploads/2020/01/EsopusTSRv2.pdf.
New York City Department of Environmental Protection [NYCDEP], 2019, Stream management program—Stony Clove watershed suspended sediment and turbidity study—Turbidity production project nomination report: New York City Department of Environmental Protection, 33 p., accessed April 1, 2021, at https://catskillstreams.org/wp-content/uploads/2020/01/FAD-4.6-SMP-Stony-Clove-STRP-Nomination-Report.pdf.
New York State Department of Health [NYSDOH], 2017, New York City’s filtration avoidance determination (FAD): New York State web page, accessed September 17, 2020, at https://health.ny.gov/environmental/water/drinking/nycfad/.
Olinde, L., and Johnson, J.P., 2015, Using RFID and accelerometer‐embedded tracers to measure probabilities of bed load transport, step lengths, and rest times in a mountain stream: Water Resources Research, v. 51, no. 9, p. 7572–7589, accessed April 1, 2021. https://doi.org/10.1002/2014WR016120.
Onset, 2013, HOBO Pendant G data logger (UA-004-64) white paper: Onset, accessed September 17, 2020, at https://www.onsetcomp.com/files/manual_pdfs/16920-A%20Pendant%20G%20White%20Paper.pdf.
Phillips, C., and Jerolmack, D., 2014, Dynamics and mechanics of bed-load tracer particles: Earth Surface Dynamics, v. 2, no. 2, p. 513–530, accessed April 1, 2021, at https://doi.org/10.5194/esurf-2-513-2014.
Siemion, J., Antidormi, M.R., Bonville, D.B., and Finkelstein, J., 2021, Bed material transport data in the upper Esopus Creek watershed, Ulster and Greene Counties, NY, 2017-2020: U.S. Geological Survey data release, https://doi.org/10.5066/P9KDJIPO.
Siemion, J., McHale, M.R., and Davis, W.D., 2016, Suspended-sediment and turbidity responses to sediment and turbidity reduction projects in the Beaver Kill, Stony Clove Creek, and Warner Creek watersheds, New York, 2010–14: U.S. Geological Survey Scientific Investigations Report 2016–5157, 28 p., accessed April 1, 2021, at https://doi.org/10.3133/sir20165157.
Smith, A.J., Bode, R.W., Novak, M.A., Abele, L.E., Heitzman, D.L., and Duffy, B.T., 2008, Biological stream assessment—Upper Esopus Creek—Ulster County, New York—Lower Hudson River Basin: New York State Department of Environmental Conservation, 48 p., accessed February 14, 2022, at https://nysl.ptfs.com/data/Library1/108728.PDF.
U.S. Geological Survey, 2016, StreamStats (ver. 4.4.0, 2020): U.S. Geological Survey database, accessed February 9, 2021, at http://streamstats.usgs.gov/ss.
Wall, G.R., Murray, P.M., Lumia, R., and Suro, T.P., 2014, Maximum known stages and discharges of New York streams and their annual exceedance probabilities through September 2011: U.S. Geological Survey Scientific Investigations Report 2014–5084, 16 p., accessed February 14, 2022, at https://doi.org/10.3133/sir20145084.
Wolman, M.G., 1954, A method of sampling coarse river-bed material: Transactions - American Geophysical Union, v. 35, no. 6, p. 951–956. [Also available at https://doi.org/10.1029/TR035i006p00951.]
Wren, D.G., Goodwiller, B.T., Rigby, J.R., Carpenter, W.O., Kuhnle, R.A., and Chambers, J.P., 2015, Sediment-generated noise (SGN)—Laboratory determination of measurement volume, in Proceedings of the Joint Federal Interagency Conference, 2015—Sustainable water resources in a changing environment, [joint meeting of the 5th Federal Interagency Hydrologic Modeling Conference and the 10th Federal Interagency Sedimentation Conference], 3d, Reno, Nev., April 19–23: [U.S. Geological Survey], p. 408–413, accessed February 16, 2022, at https://acwi.gov/sos/pubs/3rdJFIC/Proceedings.pdf.
Appendix 1. Passive Tracer Location Maps
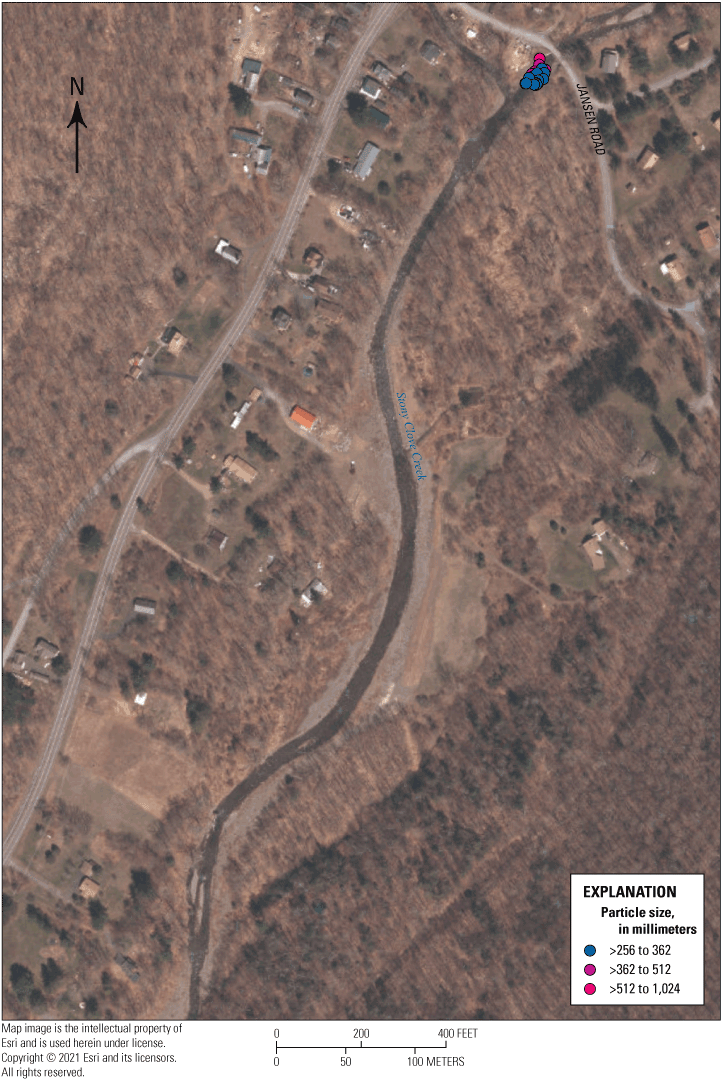
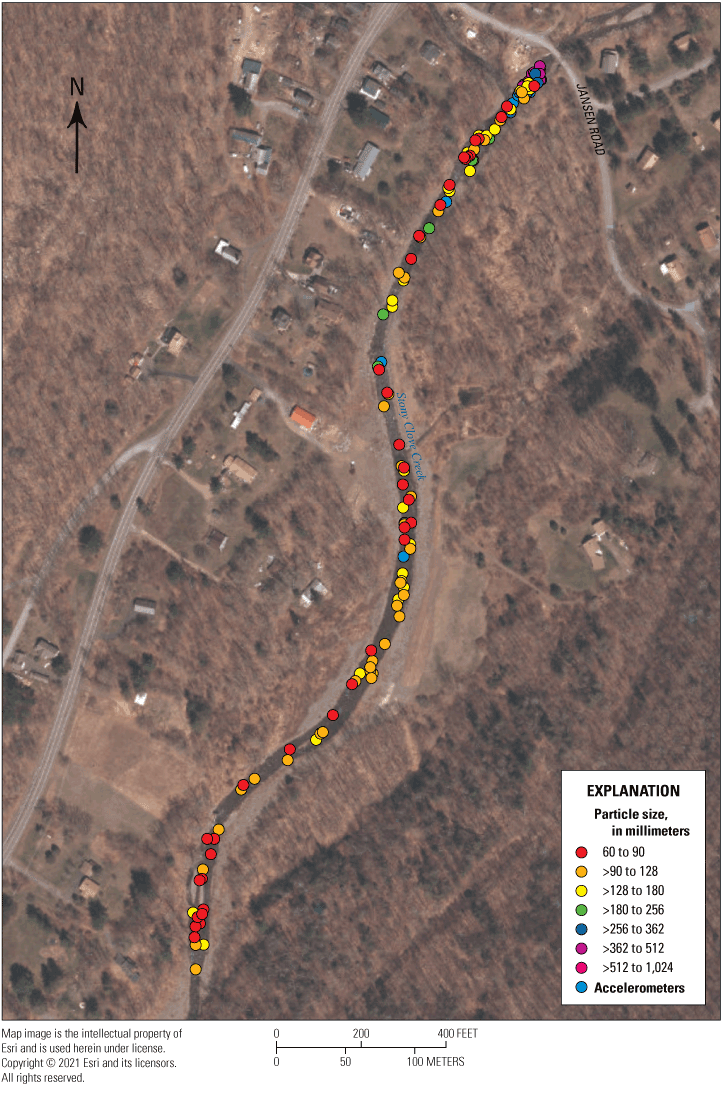
Initial locations of the accelerometers and active and passive tracers by particle-size class in Stony Clove Creek, New York, on October 19, 2017. Passive tracer sizes were 60 to 90 millimeters (mm), >90 to 128 mm, >128 to 180 mm, >180 to 256 mm, >256 to 362 mm, >362 to 512 mm, and >512 to 1,024 mm. Only the >256 to 362 mm, >362 to 512 mm, and >512 to 1,024 mm tracers are plotted on the figure, which were too large to transport. Smaller tracers and the accelerometers were placed in a 1-meter wide transect at Jansen Road.
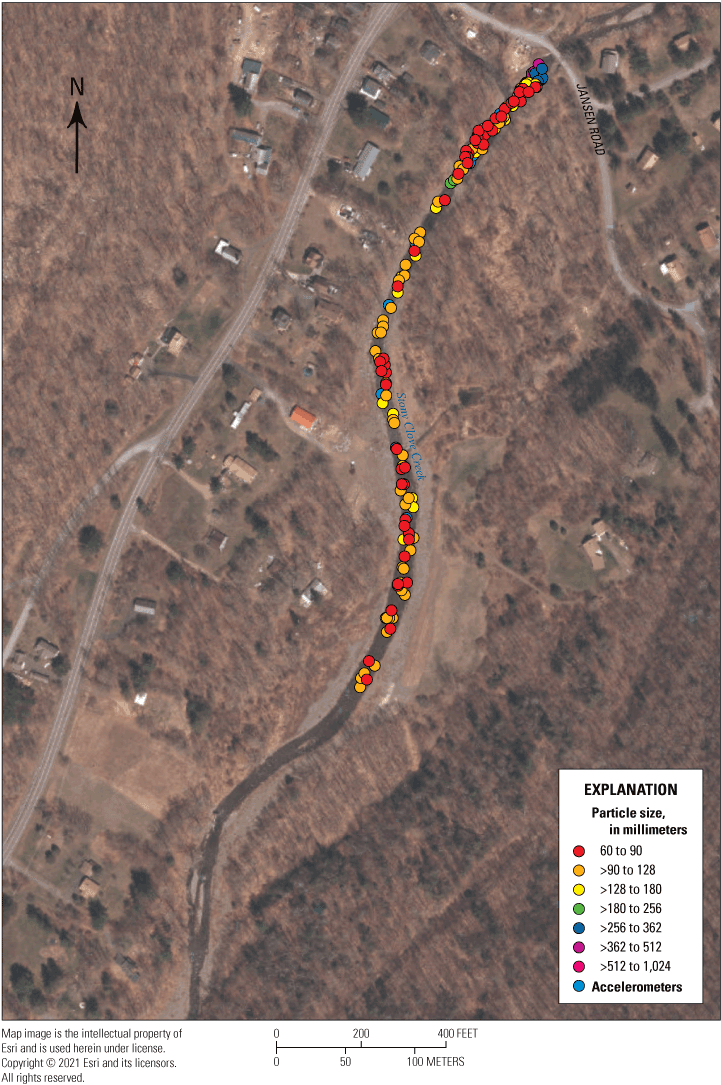
Locations of accelerometers and active and passive tracers by particle-size class in Stony Clove Creek, New York, on November 29, 2017.
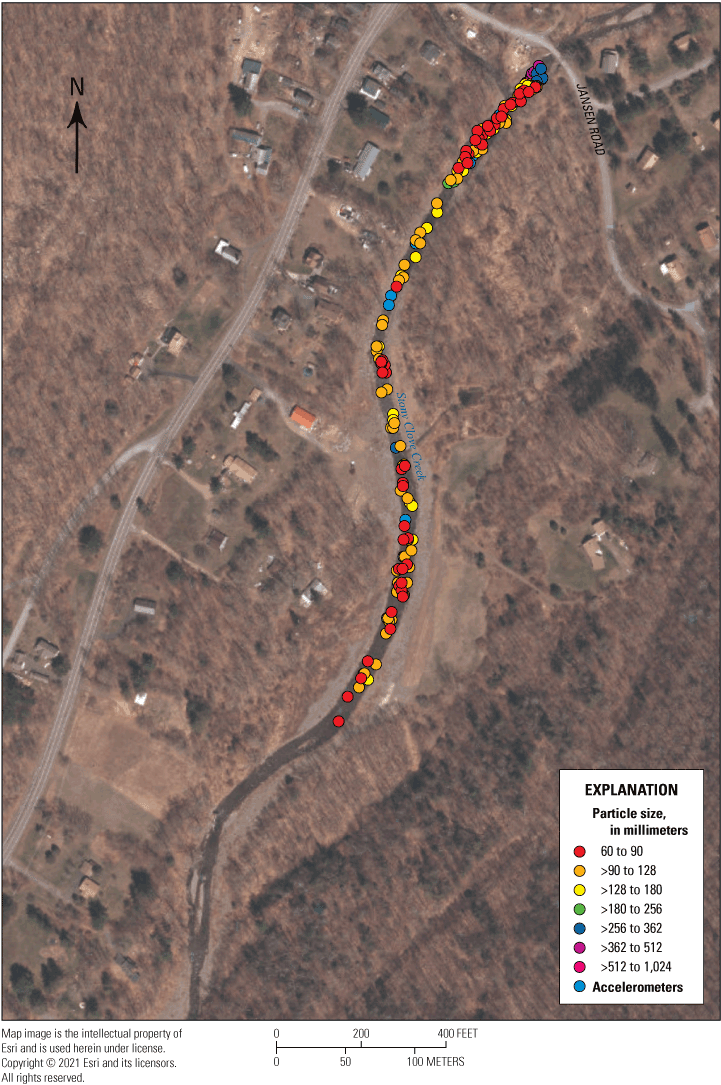
Locations of accelerometers and active and passive tracers by particle-size class in Stony Clove Creek, New York, on June 24, 2018.

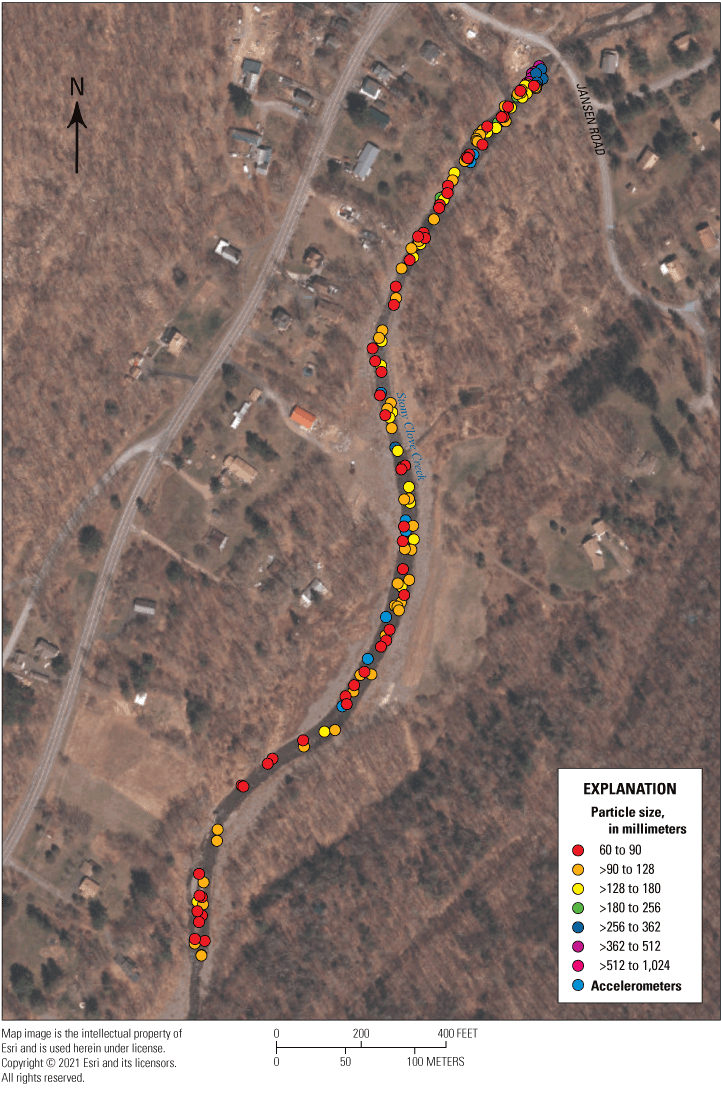
Locations of accelerometers and active and passive tracers by particle-size class in Stony Clove Creek, New York, on September 12, 2018 survey.
Locations of accelerometers and active and passive tracers in Stony Clove Creek, New York, on June 12, 2019.
Locations of accelerometers and passive tracers in Stony Clove Creek, New York, on June 17, 2020.
Reference Cited
Siemion, J., Antidormi, M.R., Bonville, D.B., and Finkelstein, J., 2021, Bed material transport data in the upper Esopus Creek watershed, Ulster and Greene Counties, NY, 2017-2020: U.S. Geological Survey data release, https://doi.org/10.5066/P9KDJIPO.
Conversion Factors
Datums
Vertical coordinate information is referenced to the North American Vertical Datum of 1988 (NAVD 88).
Horizontal coordinate information is referenced to the North American Datum of 1983 (NAD 83).
For more information about this report, contact:
Director, New York Water Science Center
U.S. Geological Survey
425 Jordan Road
Troy, NY 12180–8349
dc_ny@usgs.gov
or visit our website at
https://www.usgs.gov/centers/ny-water
Publishing support provided by the Pembroke Publishing Service Center
Suggested Citation
Siemion, J., Antidormi, M.R., Bonville, D.B., Finkelstein, J., and Marineau, M., 2022, Bed-material transport in the upper Esopus Creek watershed, Ulster and Greene Counties, New York, 2017–20: U.S. Geological Survey Data Report 1151, 20 p., https://doi.org/10.3133/dr1151.
ISSN: 2771-9448 (online)
Study Area
| Publication type | Report |
|---|---|
| Publication Subtype | USGS Numbered Series |
| Title | Bed-material transport in the upper Esopus Creek watershed, Ulster and Greene Counties, New York, 2017–20 |
| Series title | Data Report |
| Series number | 1151 |
| DOI | 10.3133/dr1151 |
| Year Published | 2022 |
| Language | English |
| Publisher | U.S. Geological Survey |
| Publisher location | Reston, VA |
| Contributing office(s) | New York Water Science Center |
| Description | Report: vi, 20 p.; Data Release |
| Country | United States |
| State | New York |
| County | Greene County, Ulster County |
| Online Only (Y/N) | Y |
| Additional Online Files (Y/N) | N |
| Google Analytic Metrics | Metrics page |