

Links
- Document: Report (4.81 MB pdf) , HTML , XML
- Version History: Version History (3.44 kB txt)
- Download citation as: RIS | Dublin Core
Abstract
In Ohio, remote-sensing systems such as Landsat play an important role in monitoring natural resources and informing management decisions on everything from dangerous freshwater algal blooms to Lymantria dispar (Linnaeus, 1758) (spongy moth) defoliation and more.
Landsat imagery underpins public and private sector decisions in Ohio and across the Nation for effective adaptation to changing landscapes. Those decisions lead to enhanced agricultural productivity, smart urban development, sustainable forest management, and inland lake water-quality monitoring.
Here are some examples of how Landsat benefits Ohio.
Flooding Events
The resolution of Landsat imagery and the size of Landsat’s database enable critical insight for scalable, high-resolution flood detection along the Ohio River and other Ohio waterways. Preflooding Landsat images show waterways during normal times; Landsat imagery during an event helps emergency response officials estimate flooded areas, particularly in urban areas where flooding can be very concentrated; and Landsat data are integrated with flood models, supporting floodplain topography assessments for more efficient disaster management (Patel, 2014).
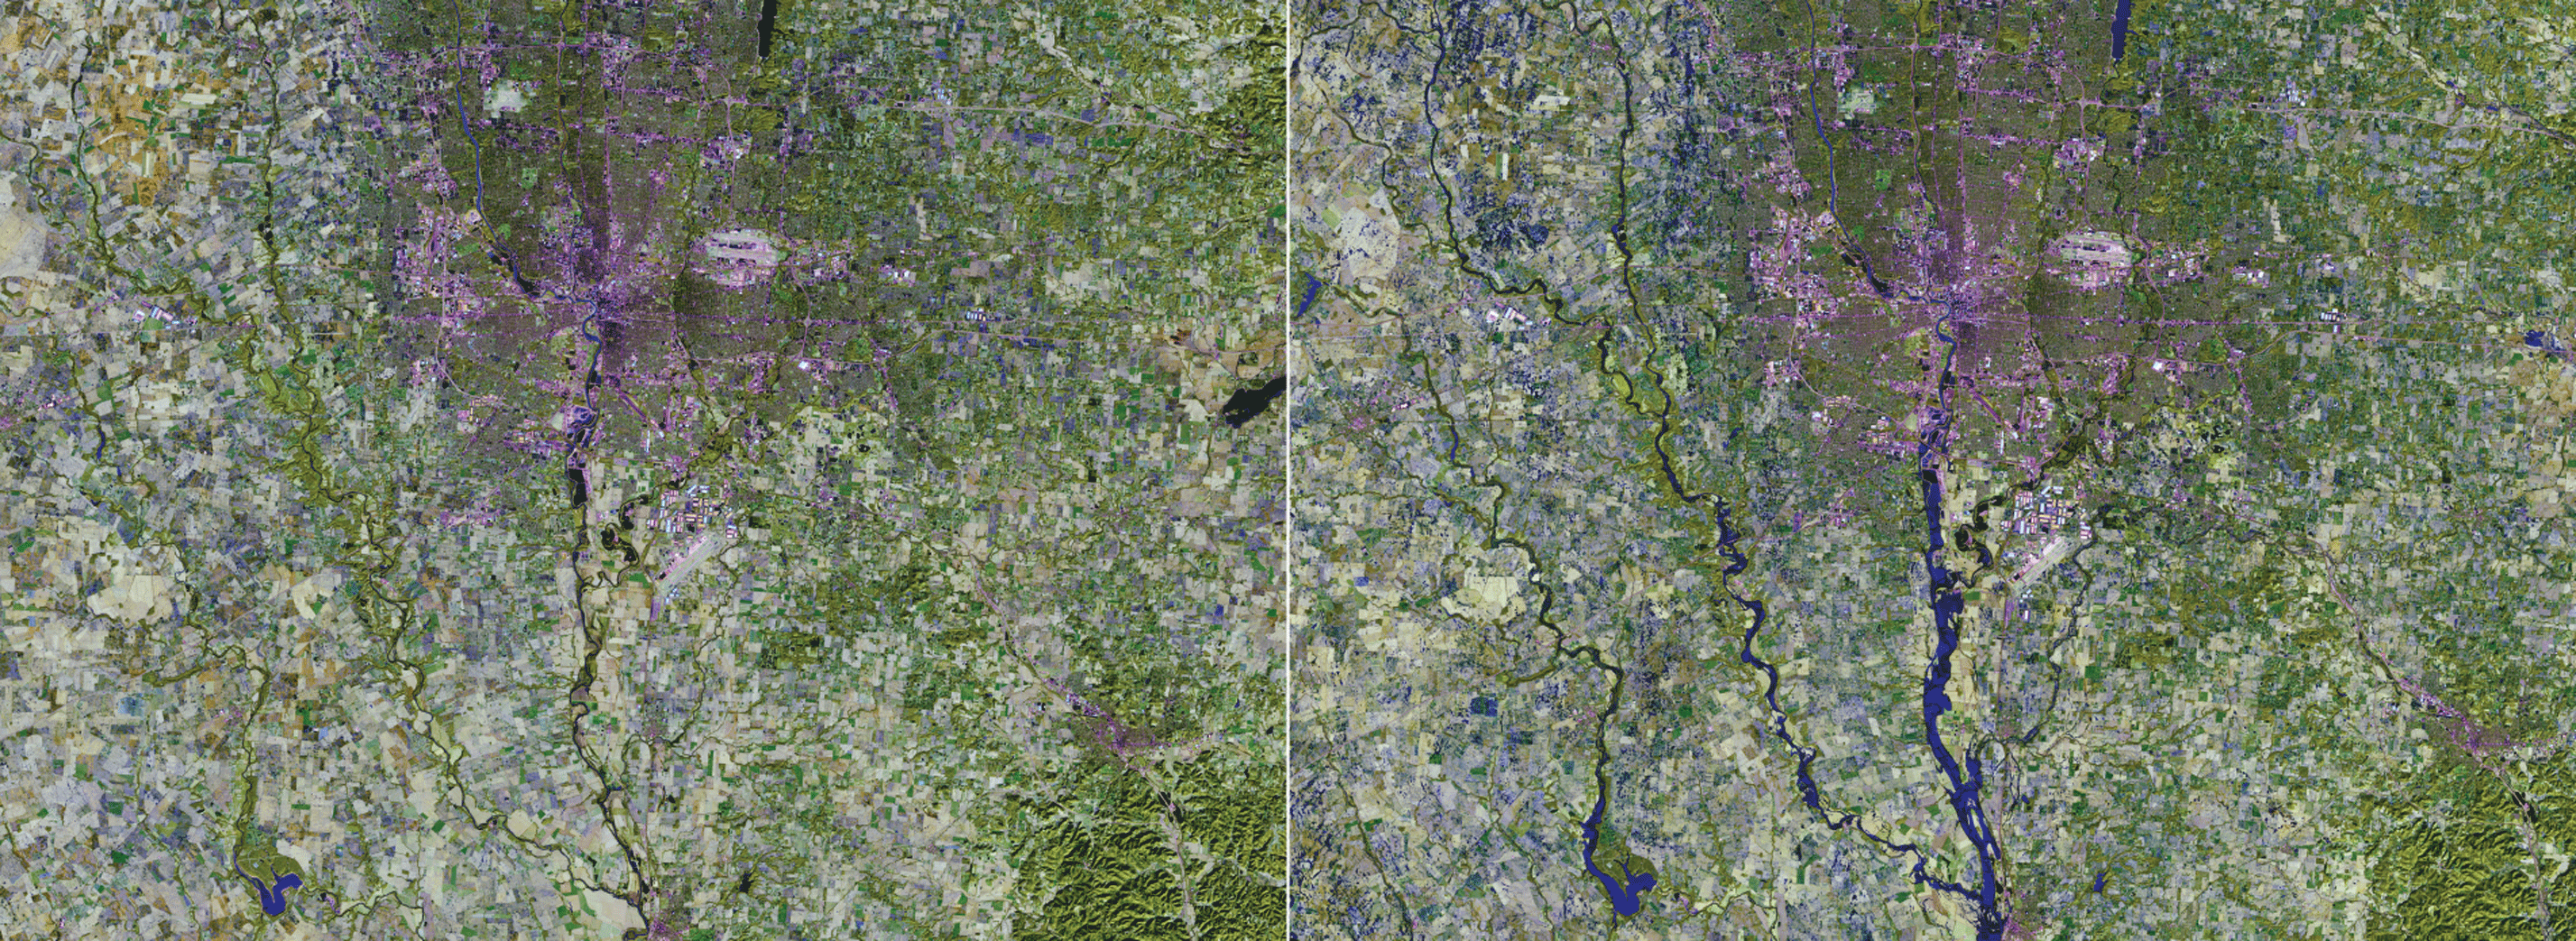
At right, Landsat 8 captured the flooded Scioto River south of Columbus on February 26, 2018. At left, for comparison, Landsat 8 shows the river 2 years earlier when it was at normal levels.
Monitoring Dangerous Algal Blooms
Harmful algal blooms are an annual problem around western Lake Erie near Toledo because calm winds, sunshine, hot weather, and spring fertilizer runoff from farm fields in southeast Michigan, southern Ontario, and northwest Ohio provide ideal conditions for the blooms to occur. Such was the case in the image captured in September 2017 by Landsat 8. Three years earlier, in 2014, Toledo became the first large U.S. city where tap water was rendered unsafe by cyanobacteria when Lake Erie—Toledo’s water source—was choked by a huge, harmful algal bloom triggered by agricultural phosphorous runoff. Landsat was harnessed to track these algal blooms, so Ohio water managers knew when and where they were occurring (Carnegie Institution for Science, 2017).
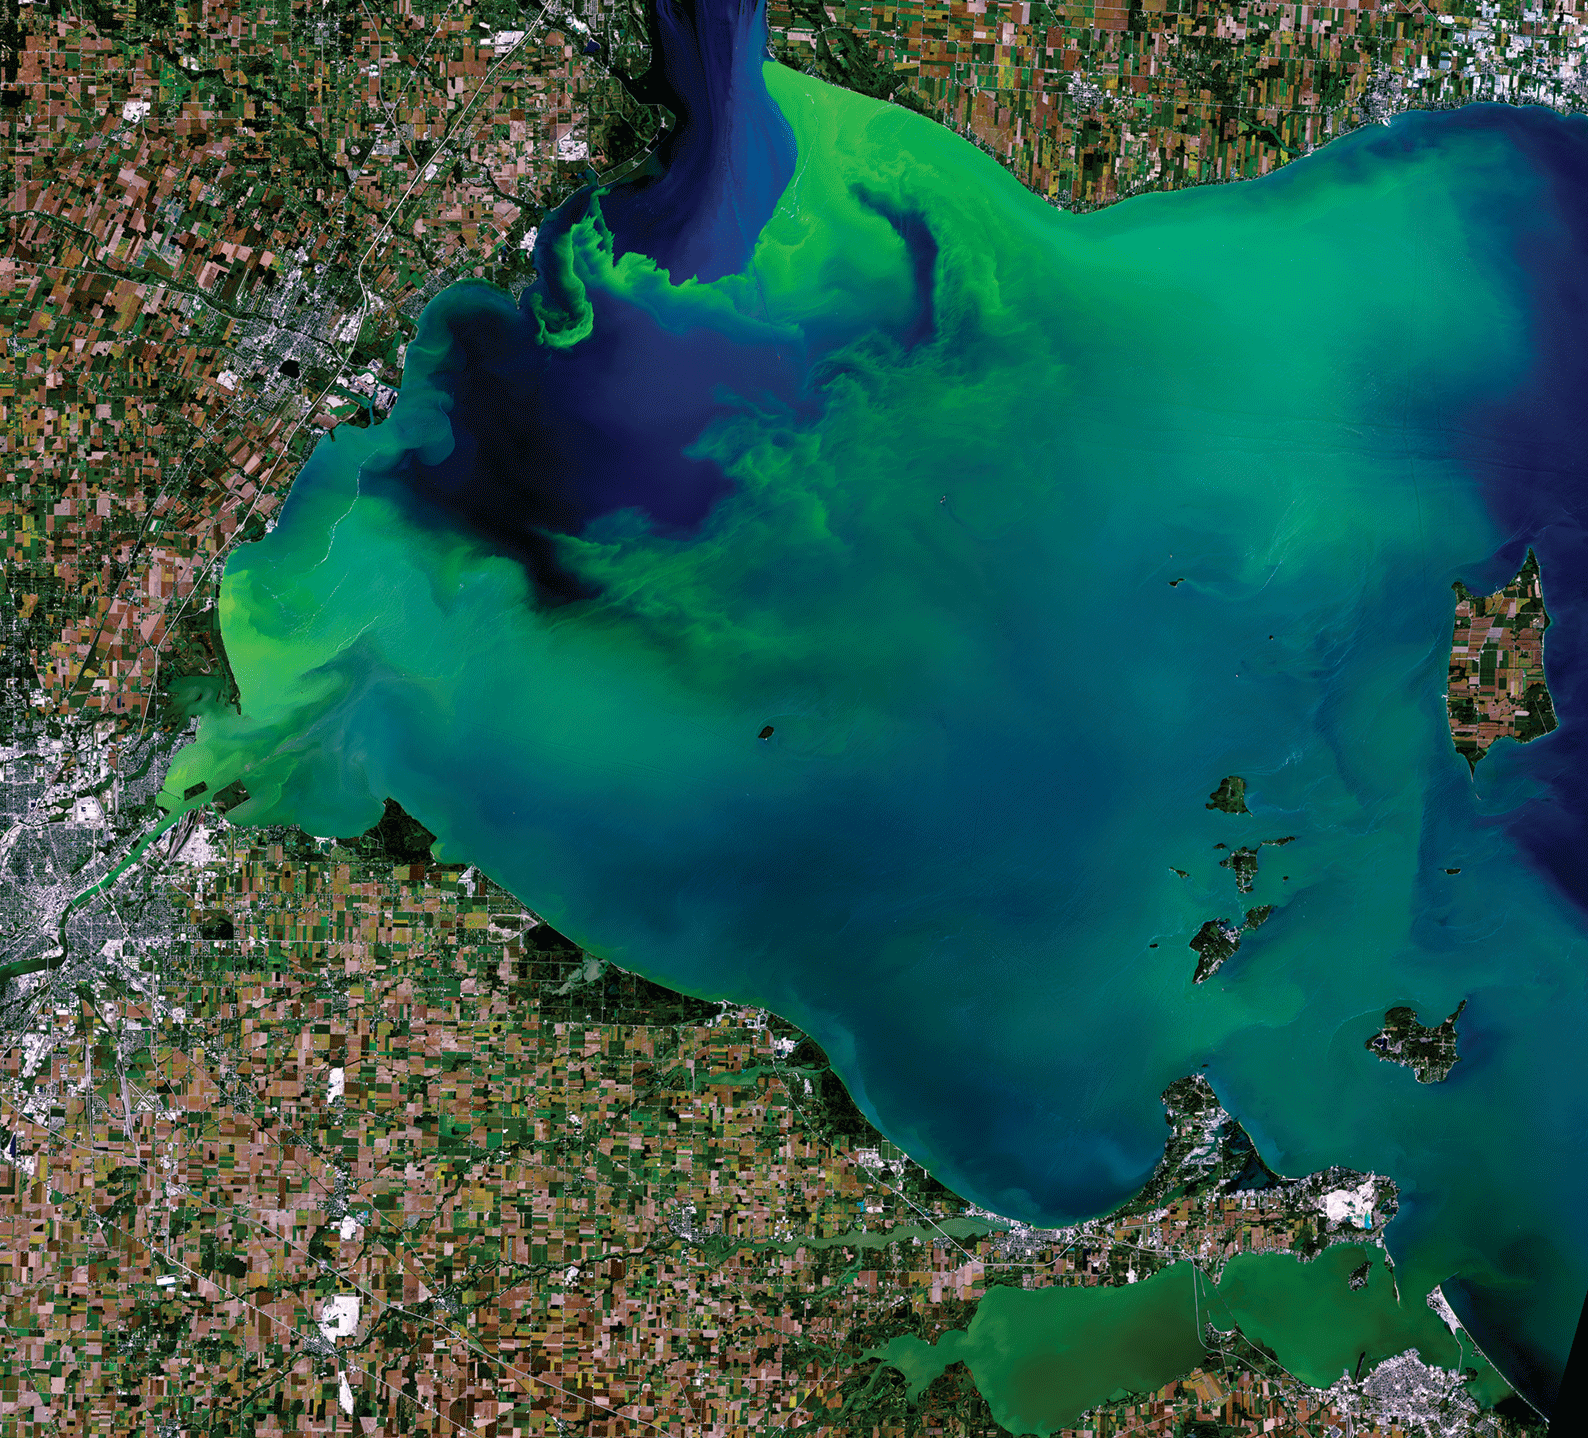
Landsat 8 image of a large phytoplankton bloom in western Lake Erie, near Toledo, in September 2017.
Spongy Moth Defoliation
Satellite-based remote sensing has long been used to detect wide-scale defoliation by the spongy moth caterpillar. Spongy moths can drastically affect forest health, ecosystem services, and carbon dynamics. Ohio developed a plan in 1998 to stem the moths’ movement westward, and researchers demonstrated Landsat’s ability to locate areas of defoliation across the State for targeted treatment (Hurley and others, 2004).
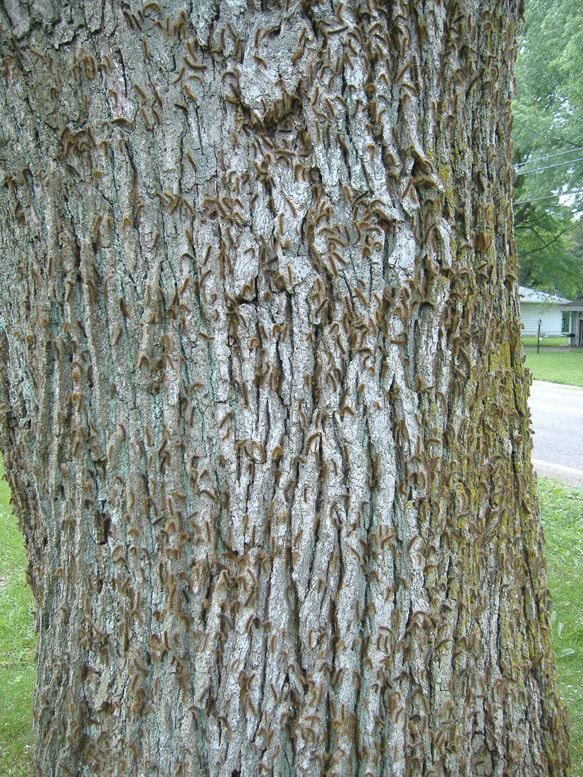
Satellite-based remote sensing has long been used to detect defoliation by spongy moth caterpillars on deciduous broadleaf forests in Ohio. Photograph credit: Ohio Department of Agriculture; used with permission.
National Land Imaging Program Benefits—Ohio
The U.S. Geological Survey (USGS) National Land Imaging Program provides a wide range of satellite imagery and other remotely sensed and geospatial data to Government, commercial, academic, and public users. Those users can get worldwide access to Landsat satellite data through the National Land Imaging Program-funded USGS Earth Resources Observation and Science (EROS) Center.
Landsat—Critical Information Infrastructure for the Nation
Landsat is the most widely used land remote sensing data source within Federal civilian agencies. Local, State, Tribal, and Federal agencies use Landsat to monitor and forecast a wide range of land surface phenomena. Information from Landsat contributes to day-to-day decisions on land, water, and resource use that protect life and property; safeguard the environment; advance science, technology, and education; support climate resiliency; and grow the U.S. economy. Landsat’s imagery provides a landscape-level view of land surface, inland lake, and coastal processes, both natural and human-induced. Landsat enables us to better understand the scope, nature, and speed of change to the natural and built environment.
Businesses draw upon Landsat data to provide customer-specific applications to improve logistics, resource allocation, and investment decisions. Commercial space imaging firms leverage Landsat data to refine product offerings and support new information services. A 2017 USGS study determined the total annual economic benefit of Landsat data in the United States. to be $2.06 billion, far surpassing its development and operating costs (Straub and others, 2019).
Landsat 8 and Landsat 9 provide 8-day repeat coverage of the Earth’s land surfaces. The National Aeronautics and Space Administration (NASA) and the USGS are currently reviewing the findings from a joint Architecture Study Team, which will inform the design and implementation approach for Landsat Next, the follow-on mission to Landsat 9. Landsat 9 and its successors are planned to provide a sustainable, space-based system to extend the 50-year Landsat series of high-quality global land imaging measurements—the world’s longest time series of the Earth’s land surface.
The long-term availability of consistent and accurate Landsat data, combined with a no-cost data policy, allows users to analyze extensive geographic areas and better understand and manage long-term trends in land surface change. New cloud computing and data analytics technologies use Landsat data in a wide range of decision-support tools for Government and industry. Much like global positioning systems and weather data, Landsat data are used every day to help us better understand our dynamic planet.
References Cited
Carnegie Institution for Science, 2017, How satellite data led to a breakthrough for Lake Erie toxic algal blooms: Carnegie Science web page, accessed June 8, 2022, at https://carnegiescience.edu/news/how-satellite-data-led-breakthrough-lake-erie-toxic-algal-blooms.
Hurley, A., Watts, D., Burke, B., and Richards, C., 2004, Identifying gypsy moth defoliation in Ohio using Landsat data: Environmental & Engineering Geoscience, v. 10, no. 4, p. 321–328, accessed June 8, 2022, at https://doi.org/10.2113/10.4.321.
Patel, K., 2014, When waters rise—NASA improves flood safety: National Aeronautics and Space Administration web page, accessed June 8, 2022, at https://www.nasa.gov/content/goddard/when-waters-rise-nasa-improves-flood-safety/.
Straub, C.L., Koontz, S.R., and Loomis, J.B., 2019, Economic valuation of Landsat imagery: U.S. Geological Survey Open-File Report 2019–1112, 13 p., accessed June 8, 2022, at https://doi.org/10.3133/ofr20191112.
For additional information on Landsat, please contact:
Program Coordinator
USGS National Land Imaging Program
12201 Sunrise Valley Drive
Reston, VA 20192
703–648–4567
The Landsat series is a joint effort of USGS and NASA. NASA develops and launches the spacecraft; USGS manages satellite operations, ground reception, data archiving, product generation, and data distribution. Funding for the National Land Imaging Program’s Landsat operations and data management is provided through the USGS.
Suggested Citation
U.S. Geological Survey, 2020, Ohio and Landsat (ver. 1.1, September 2022): U.S. Geological Survey Fact Sheet 2020–3065, 2 p., https://doi.org/10.3133/fs20203065.
ISSN: 2327-6932 (online)
ISSN: 2327-6916 (print)
Study Area
| Publication type | Report |
|---|---|
| Publication Subtype | USGS Numbered Series |
| Title | Ohio and Landsat |
| Series title | Fact Sheet |
| Series number | 2020-3065 |
| DOI | 10.3133/fs20203065 |
| Edition | Version 1.1: September 2022; Version 1.0: December 2022 |
| Year Published | 2020 |
| Language | English |
| Publisher | U.S. Geological Survey |
| Publisher location | Reston, VA |
| Contributing office(s) | Earth Resources Observation and Science (EROS) Center |
| Description | 2 p. |
| Country | United States |
| State | Ohio |
| Online Only (Y/N) | N |
| Google Analytic Metrics | Metrics page |