Texas and Landsat
Links
- Document: Report (6.84 MB pdf) , HTML , XML
- Version History: Version History (5 kB txt)
- Download citation as: RIS | Dublin Core
Abstract
The State of Texas has the largest land area of any in the contiguous United States, and its sprawling landscapes show rich geographic diversity. The Lone Star State has cactus flats in the high plains of its far western panhandle, rolling hills in its western Trans-Pecos region, farms and ranchlands stretching across central Texas, thick forests and swamplands spread through the east, and 3,359 miles of Gulf of Mexico coastline.
Texas supports some of the Nation’s largest agricultural operations and bolsters U.S. energy infrastructure with oil and gas development and wind energy. Texas has more cattle than any other State, with 12 million head, and is one of the world’s largest producers of cotton.
Texas is home to 29 million people, serves as a tourist destination for 275 million annual visitors, and provides habitat for a dizzying array of unique flora and fauna. Balancing these varied interests results in challenges as large as the State itself.
The consistent, reliable, and historically unique USGS Landsat data archive provides an important tool for Texans to track landscape changes and enhance their economy and environment. Here are just some of the examples of how Landsat benefits the State.
Mapping Change to Texas Coastlines
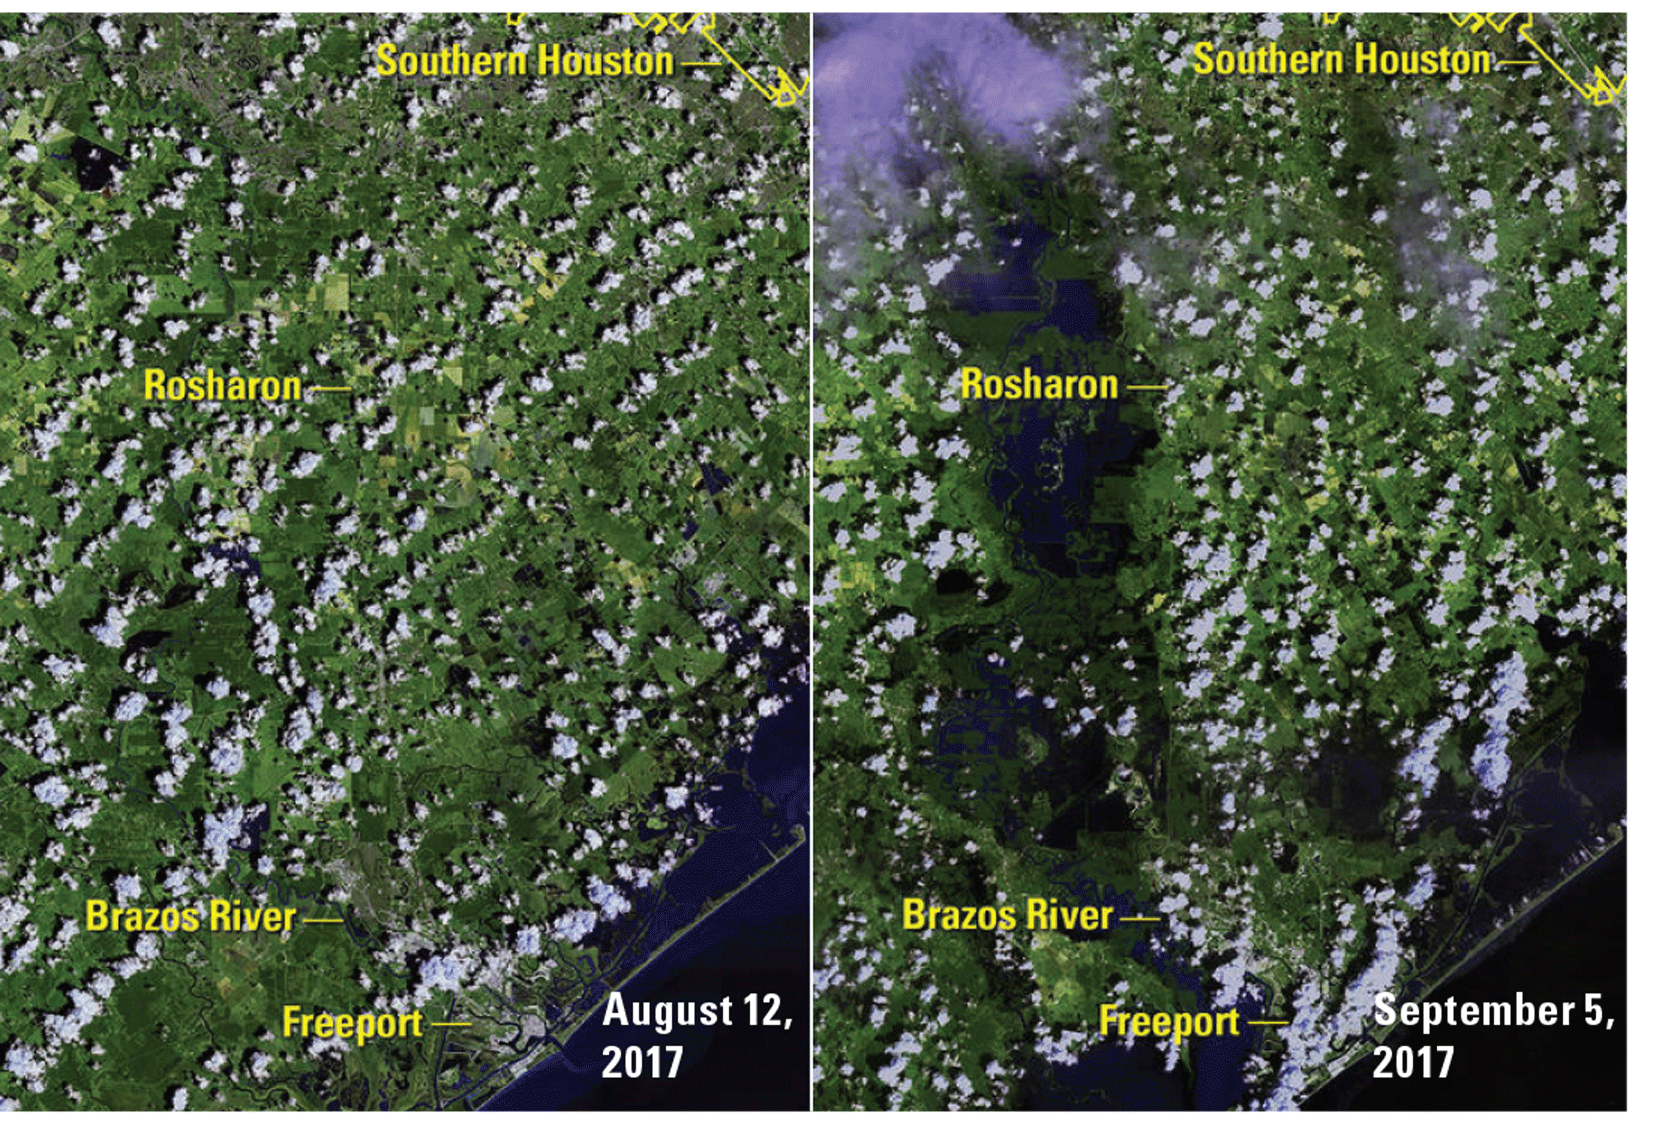
The Texas coastline is a draw for residents and a hub for tourism and trade, but it is also the frequent target of hurricanes and faces risk from rising seas. Landsat data can be used to document damage from disasters such as hurricanes by mapping the extent of disturbance in the immediate aftermath and by improving pre-event models of impact and post-event models for recovery. Landsat also offers insights into broader long-term trends in coastal change. One study from 2017 mined the Landsat archive from 1986 to 2015 to detect changes and determined that nearly 53 percent of the Texas coastline had retreated (Xu, 2018).

Extensive flooding inundated the gulf coast of Texas after Hurricane Harvey made landfall as a category 4 hurricane on August 25, 2017. Even with scattered clouds in these Landsat images, the extent of flooding on the landscape just south of Houston is evident. Image credits: U.S. Geological Survey.
Tracking Urban Heat from Above
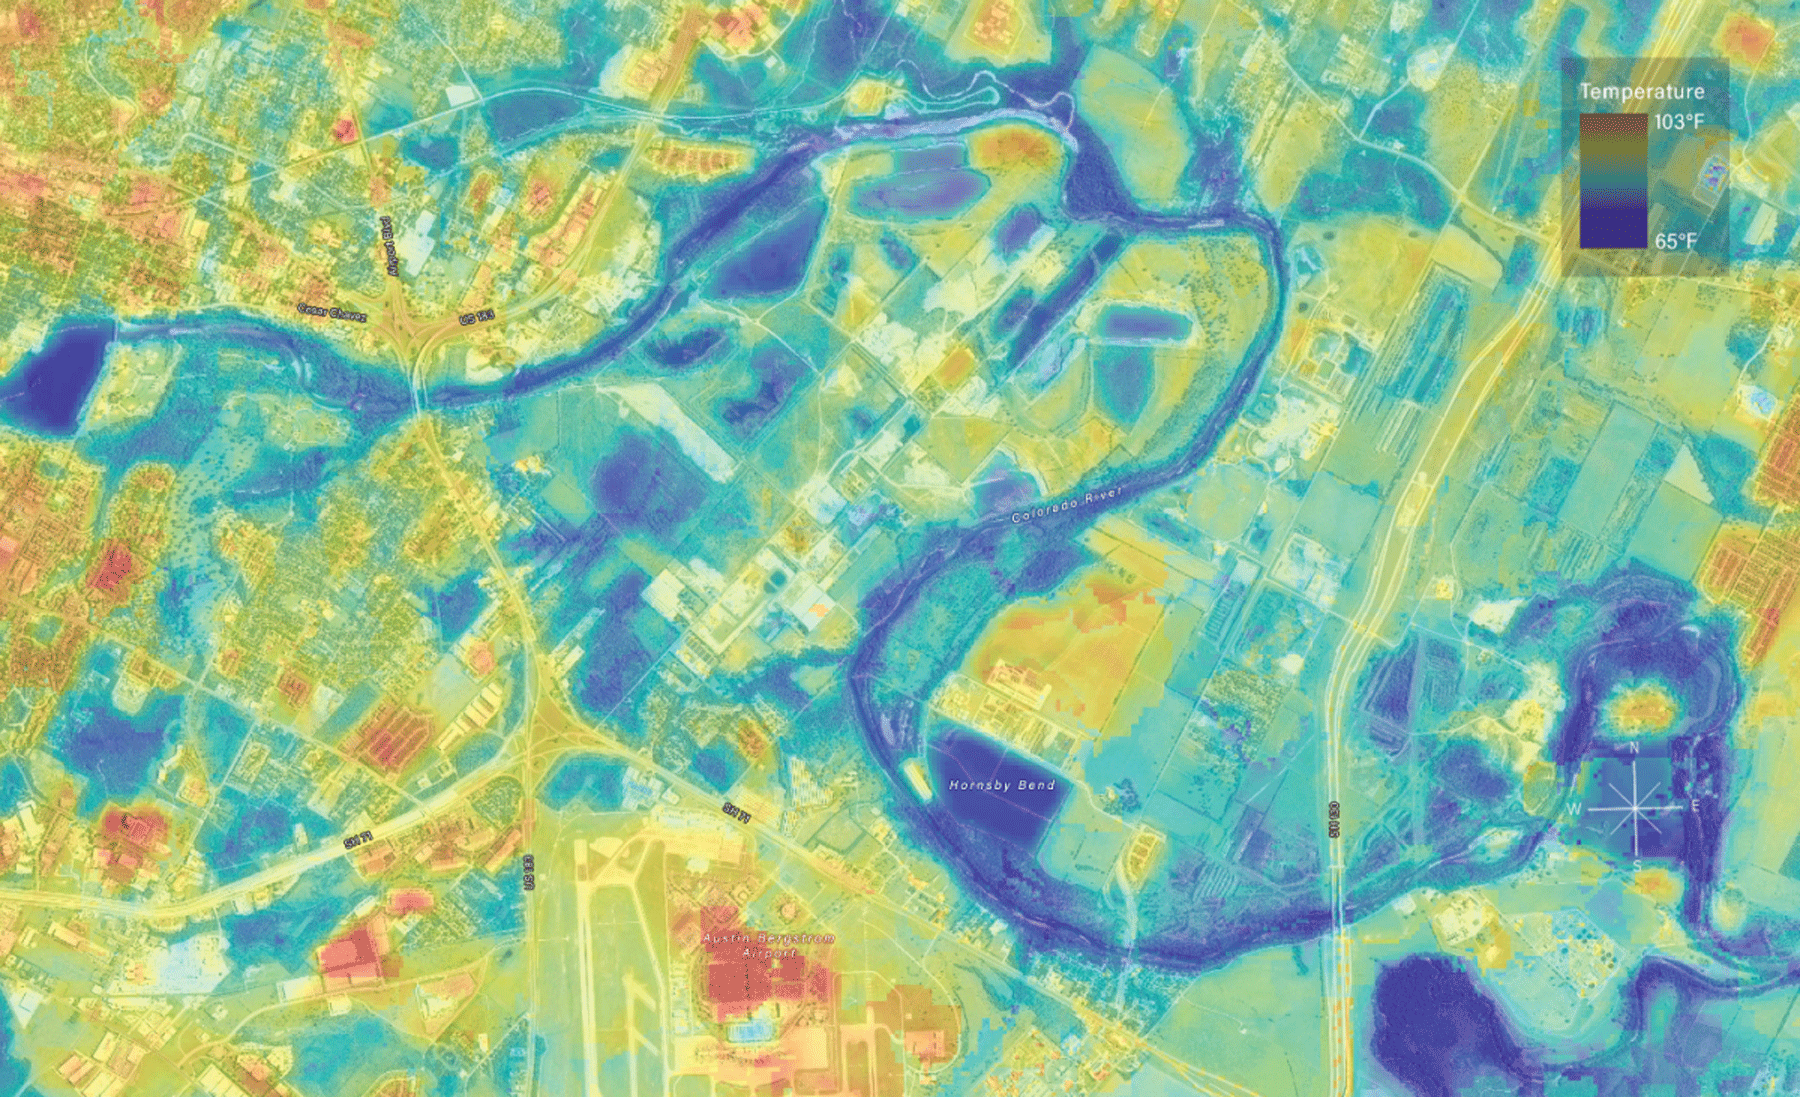
The punishing summer heat of Texas is baked into American folklore, but its expanding cityscapes tend to bear the brunt of the mercury’s fury. Landsat’s thermal imaging capabilities can help scientists and city planners more efficiently study the urban heat island effect, whereby heat-trapping concrete and asphalt boost city temperatures by several degrees and sustain higher temperatures through the night. Tracking urban heat without satellite data can be costly, requiring hundreds of weather stations for an accurate accounting of block-by-block variations. Researchers at Texas Christian University recognized Landsat as a tool for tracking urban heat as early as 1995 while surveying Dallas (Aniello and others, 1995). Fast-forward to 2020, when researchers analyzed temperatures within local climate zones in the Austin, San Antonio, and Dallas-Fort Worth metropolitan areas (Zhao and others, 2020). Such studies support metropolitan authorities’ mitigation efforts that can save energy and protect human health.

Land surface temperature along the Colorado River in east Austin, Texas, based on Landsat 8 satellite data. Photograph credit: Alan Halter, City of Austin; used with permission.
Measuring and Managing Water Use
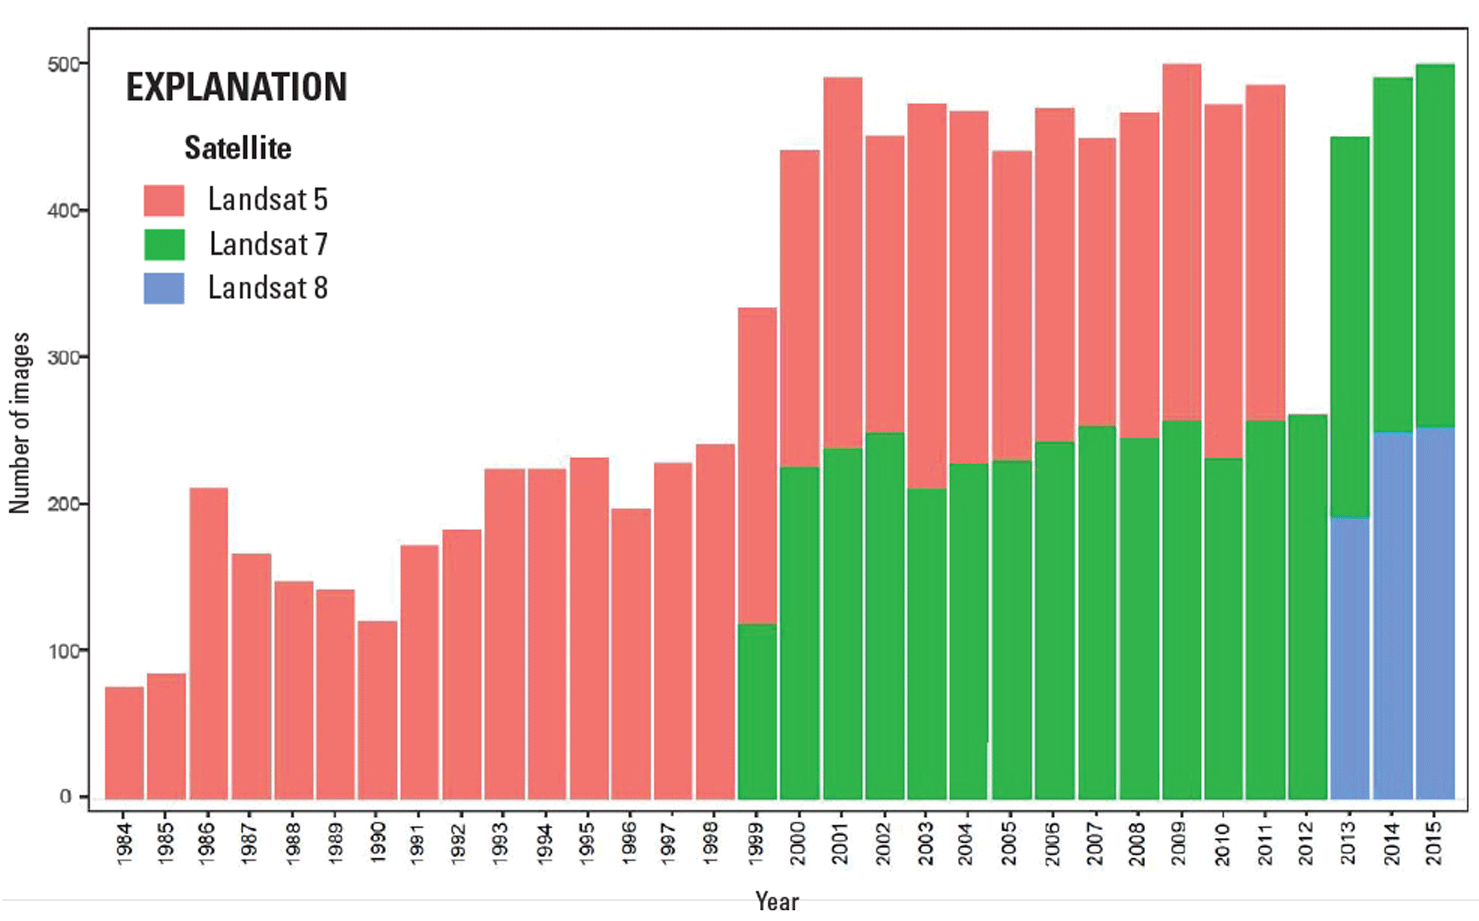
One in seven working Texans is employed in agriculture. Because more than one-half of the State’s water is used by the industry, wise water decisions are especially important. Landsat data can be used to estimate the largest and hardest-to-measure part of the water budget: the water lost through surface evaporation and transpiration from plant leaves and stems. The combined rate, called evapotranspiration (ET), amounts to a measure of water use efficiency that can guide water-use decisions and water allocations for irrigated croplands. A 2019 study on the Upper Rio Grande River Basin, which includes parts of west Texas, measured ET rates from 1986 through 2015 using the long time series of Landsat data to reveal long-term regional crop water-use patterns (Senay and others, 2019).

Number of Landsat images available for use by authors of the paper “Long-Term (1986–2015) Crop Water Use Characterization over the Upper Rio Grande Basin of United States and Mexico Using Landsat-Based Evapotranspiration” (Senay and others, 2019). The historical depth of the Landsat archive makes it a powerful tool for mapping trends in water use and managing water supplies in States like Texas that rely heavily on irrigation.
National Land Imaging Program Benefits—Texas
The U.S. Geological Survey (USGS) National Land Imaging Program provides a wide range of satellite imagery and other remotely sensed and geospatial data to Government, commercial, academic, and public users. Those users can get worldwide access to Landsat satellite data through the National Land Imaging Program-funded USGS Earth Resources Observation and Science (EROS) Center.
Landsat—Critical Information Infrastructure for the Nation
Landsat is the most widely used land remote sensing data source within Federal civilian agencies. Local, State, Tribal, and Federal agencies use Landsat to monitor and forecast a wide range of land surface phenomena. Information from Landsat contributes to day-to-day decisions on land, water, and resource use that protect life and property; safeguard the environment; advance science, technology, and education; support climate change resiliency; and grow the U.S. economy. Landsat’s imagery provides a landscape-level view of land surface, inland lake, and coastal processes, both natural and human-induced. Landsat enables us to better understand the scope, nature, and speed of change to the natural and built environment.
Businesses draw upon Landsat data to provide customer-specific applications to improve logistics, resource allocation, and investment decisions. Commercial space imaging firms leverage Landsat data to refine product offerings and support new information services. A 2017 USGS study determined the total annual economic benefit of Landsat data in the United States. to be $2.06 billion, far surpassing its development and operating costs (Straub and others, 2019).
Landsat 8 and Landsat 9 provide 8-day repeat coverage of the Earth’s land surfaces. The National Aeronautics and Space Administration (NASA) and the USGS are currently reviewing the findings from a joint Architecture Study Team, which will inform the design and implementation approach for Landsat Next, the follow-on mission to Landsat 9. Landsat 9 and its successors are planned to provide a sustainable, space-based system to extend the 50-year Landsat series of high-quality global land imaging measurements—the world’s longest time series of the Earth’s land surface.
The long-term availability of consistent and accurate Landsat data, combined with a no-cost data policy, allows users to analyze extensive geographic areas and better understand and manage long-term trends in land surface change. New cloud computing and data analytics technologies use Landsat data in a wide range of decision-support tools for Government and industry. Much like global positioning systems and weather data, Landsat data are used every day to help us better understand our dynamic planet.
References Cited
Aniello, C., Morgan, K., Busbey, A., and Newland, L., 1995, Mapping micro-urban heat islands using Landsat TM and a GIS: Computers & Geosciences, v. 21, no. 8, p. 965–967, accessed September 13, 2022, at https://doi.org/10.1016/0098-3004(95)00033-5.
Senay, G.B., Schauer, M., Velpuri, N.M., Singh, R.K., Kagone, S., Friedrichs, M., Litvak, M.E., and Douglas-Mankin, K.R., 2019, Long-Term (1986–2015) Crop Water Use Characterization over the Upper Rio Grande Basin of United States and Mexico Using Landsat-Based Evapotranspiration: Remote Sensing (Basel), v. 11, no. 13, p. 1587, accessed September 14, 2022, at https://doi.org/10.3390/rs11131587.
Straub, C.L., Koontz, S.R., and Loomis, J.B., 2019, Economic valuation of Landsat imagery: U.S. Geological Survey Open-File Report 2019–1112, 13 p., accessed September 14, 2022, at https://doi.org/10.3133/ofr20191112.
Xu, N., 2018, Detecting Coastline Change with All Available Landsat Data over 1986–2015—A Case Study for the State of Texas, USA: Atmosphere (Basel), v. 9, no. 3, p. 107, accessed September 13, 2022, at https://doi.org/10.3390/atmos9030107.
Zhao, C., Jensen, J.L.R., Weng, Q., Currit, N., and Weaver, R., 2020, Use of local climate zones to investigate surface urban heat islands in Texas: GIScience & Remote Sensing, v. 57, no. 8, p. 1083–1101, accessed September 13, 2022, at https://doi.org/10.1080/15481603.2020.1843869.
For additional information on Landsat please contact:
Program Coordinator
USGS National Land Imaging Program
12201 Sunrise Valley Drive
Reston, VA 20192
703–648–5953
The Landsat series is a joint effort of the USGS and NASA. NASA develops and launches the spacecraft; the USGS manages satellite operations, ground reception, data archiving, product generation, and data distribution. Funding for the National Land Imaging Program’s Landsat operations and data management is provided through the USGS.
Suggested Citation
U.S. Geological Survey, 2021, Texas and Landsat (ver. 1.1, October 2022): U.S. Geological Survey Fact Sheet 2021–3017, 2 p., https://doi.org/10.3133/fs20213017.
ISSN: 2327-6932 (online)
ISSN: 2327-6916 (print)
Study Area
| Publication type | Report |
|---|---|
| Publication Subtype | USGS Numbered Series |
| Title | Texas and Landsat |
| Series title | Fact Sheet |
| Series number | 2021-3017 |
| DOI | 10.3133/fs20213017 |
| Edition | Version 1.0: March 30, 2021: Version 1.1: October 17, 2022 |
| Year Published | 2021 |
| Language | English |
| Publisher | U.S. Geological Survey |
| Publisher location | Reston, VA |
| Contributing office(s) | Earth Resources Observation and Science (EROS) Center |
| Description | 2 p. |
| Country | United States |
| State | Texas |
| Online Only (Y/N) | N |
| Google Analytic Metrics | Metrics page |


