

Pennsylvania and Landsat
Links
- Document: Report (2.97 MB pdf) , HTML , XML
- Download citation as: RIS | Dublin Core
Abstract
The Commonwealth of Pennsylvania straddles an array of landscapes. From east to west, its 46,055 square miles connect the sea-level lowlands of the Atlantic seaboard with the rolling hills of the Midwest. It also acts as a bridge between regions from north to south, with the Appalachian Mountains swooping through its center from its northern border with New York to its southern borders with Maryland and West Virginia.
The Declaration of Independence and U.S. Constitution were signed in the Commonwealth’s largest city, Philadelphia, and it was the second of the original 13 colonies to ratify the Constitution. The pivotal Civil War battle of Gettysburg took place in the southern part of Pennsylvania. Western Pennsylvania was an early hub for the coal, oil, and steel industries that fueled the Nation’s growth in the 20th century and still factor into Pennsylvania’s economy. The varied natural features of Pennsylvania have been an important proving ground for the value of satellite imagery from the USGS Landsat Program. Scientists began to lean on Landsat observations early in the program’s history to map the effect of invasive moths on Commonwealth forests (Williams, 1975). That activity continues to this day. Space-based imagery has also contributed to the study and management of land change from energy development, urban growth, and shifting land use patterns.
The Landsat Program’s unparalleled 50-year archive of repeat Earth observations remains a critical public resource for Pennsylvania as climate change and land use patterns present new challenges to land managers and urban planners in the Keystone State.
Here are just a few examples of how Landsat has benefited Pennsylvania.
Watching Over the Forests
Pennsylvania is home to 10 National Forests and 20 State Forests, providing space for both human recreation and the preservation of natural habitat. Invasive insect species are a serious concern in these areas as well as in privately owned woodlands. Landsat satellite imagery can be invaluable for invasive species damage assessments, as the satellites offer new Earth surface imagery every 8 days that can peer beyond visible light to “see” insect-related damage to the forest canopy. The Pennsylvania Department of Conservation and Natural Resources has worked with partners from Rutgers University on how to map damage from the invasive hemlock woolly adelgid (Adelges tsugae) by monitoring the Landsat archive (Pennsylvania DCNR, [undated]). Landsat data have also been cited in numerous studies on the damage caused by the spongy moth (Lymantria dispar) in places like the Allegheny National Forest (Huebner and others, 2009).
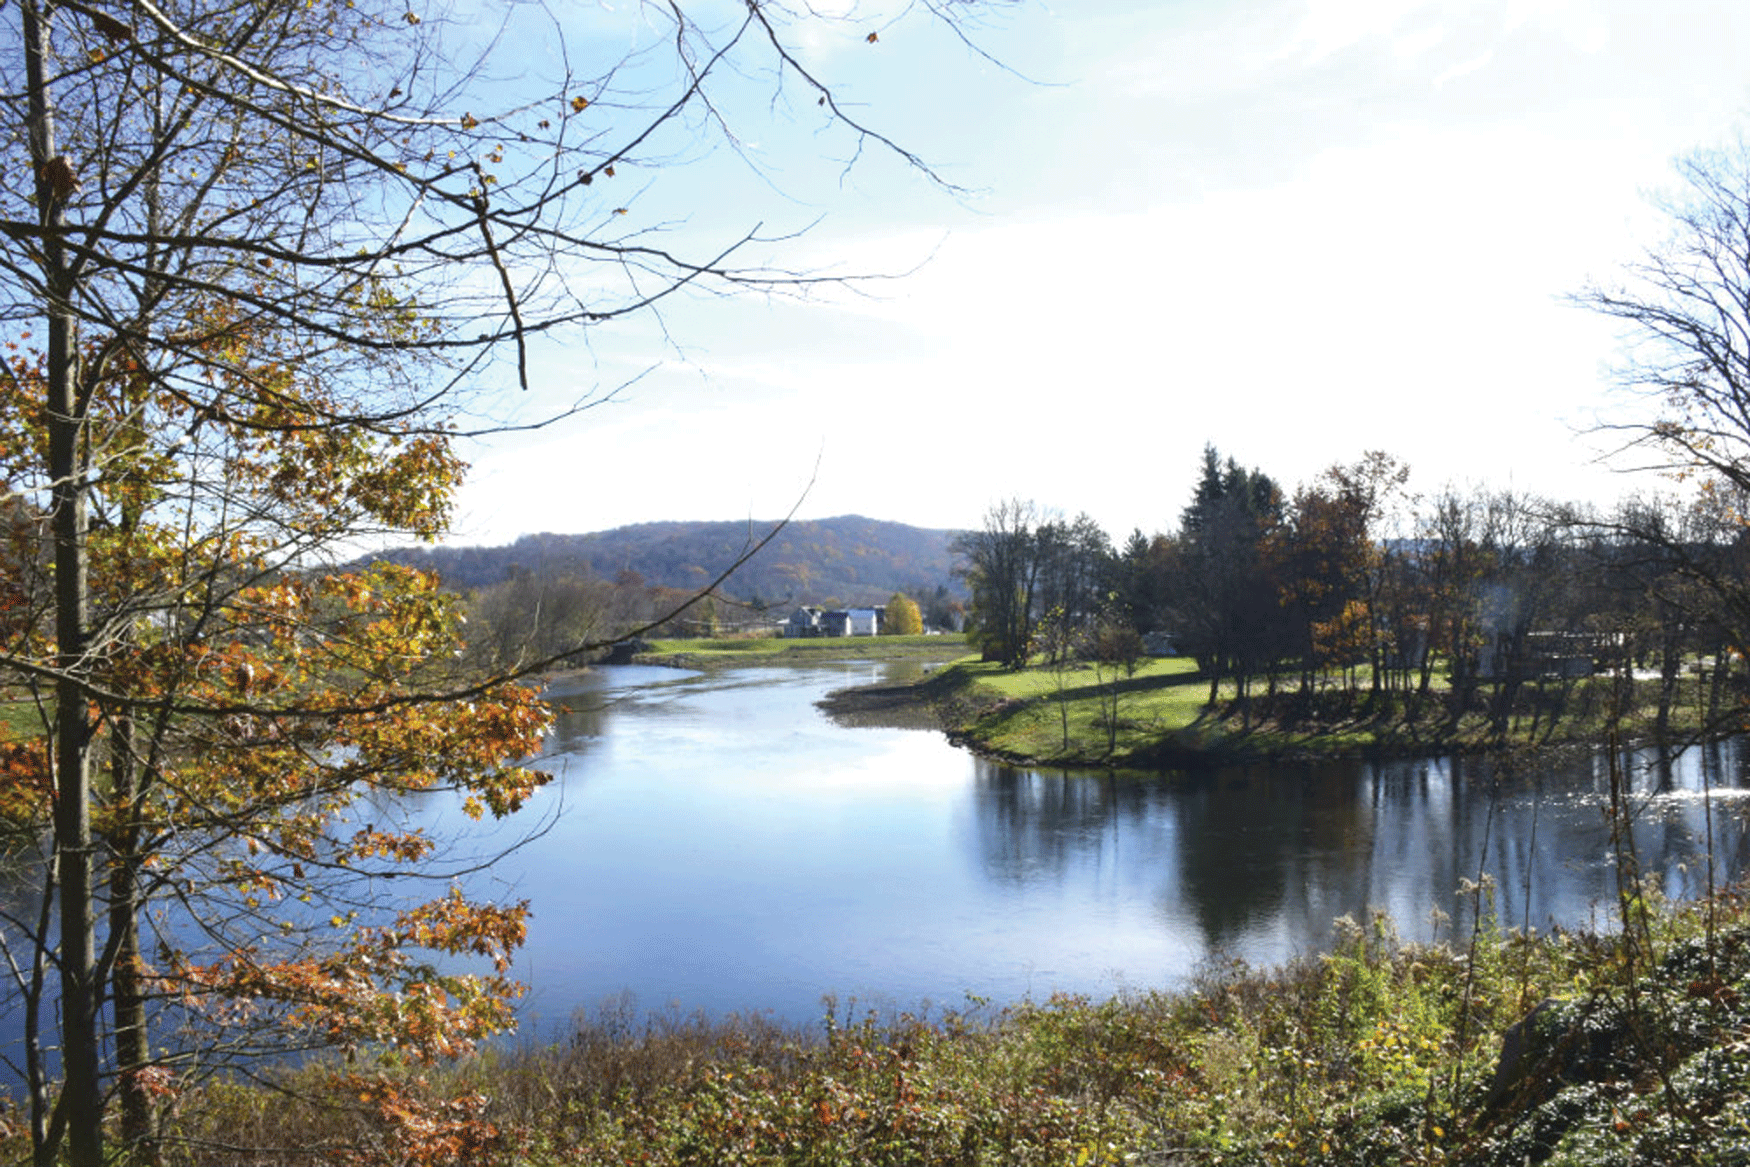
Turkeyfoot Overlook views the convergence of the Casselman and Youghiogheny Rivers as they merge just north of Confluence, Pennsylvania.
Mapping the Past, Sketching the Future
In the mid-1960s, drought conditions helped draw salty seawater from the Delaware River Estuary north through the rivers and streams of the Delaware River Basin. The saltwater came within 8 miles of the water supply for the City of Philadelphia. The incident was a stark reminder of the importance of wise management. Urban growth and land use change have affected the basin, but rising sea levels have made complex issues surrounding water management even more urgent. Saltwater infiltration and drought, along with more powerful and frequent storms, are just a few of the concerns facing Pennsylvania. In 2021, researchers used Landsat and other data to “backcast” hundreds of years of land cover change across the basin, and to model multiple land change scenarios for 100 years into the future (Dornbierer and others, 2021). Projections like these can inform decisions on land management and resiliency planning.
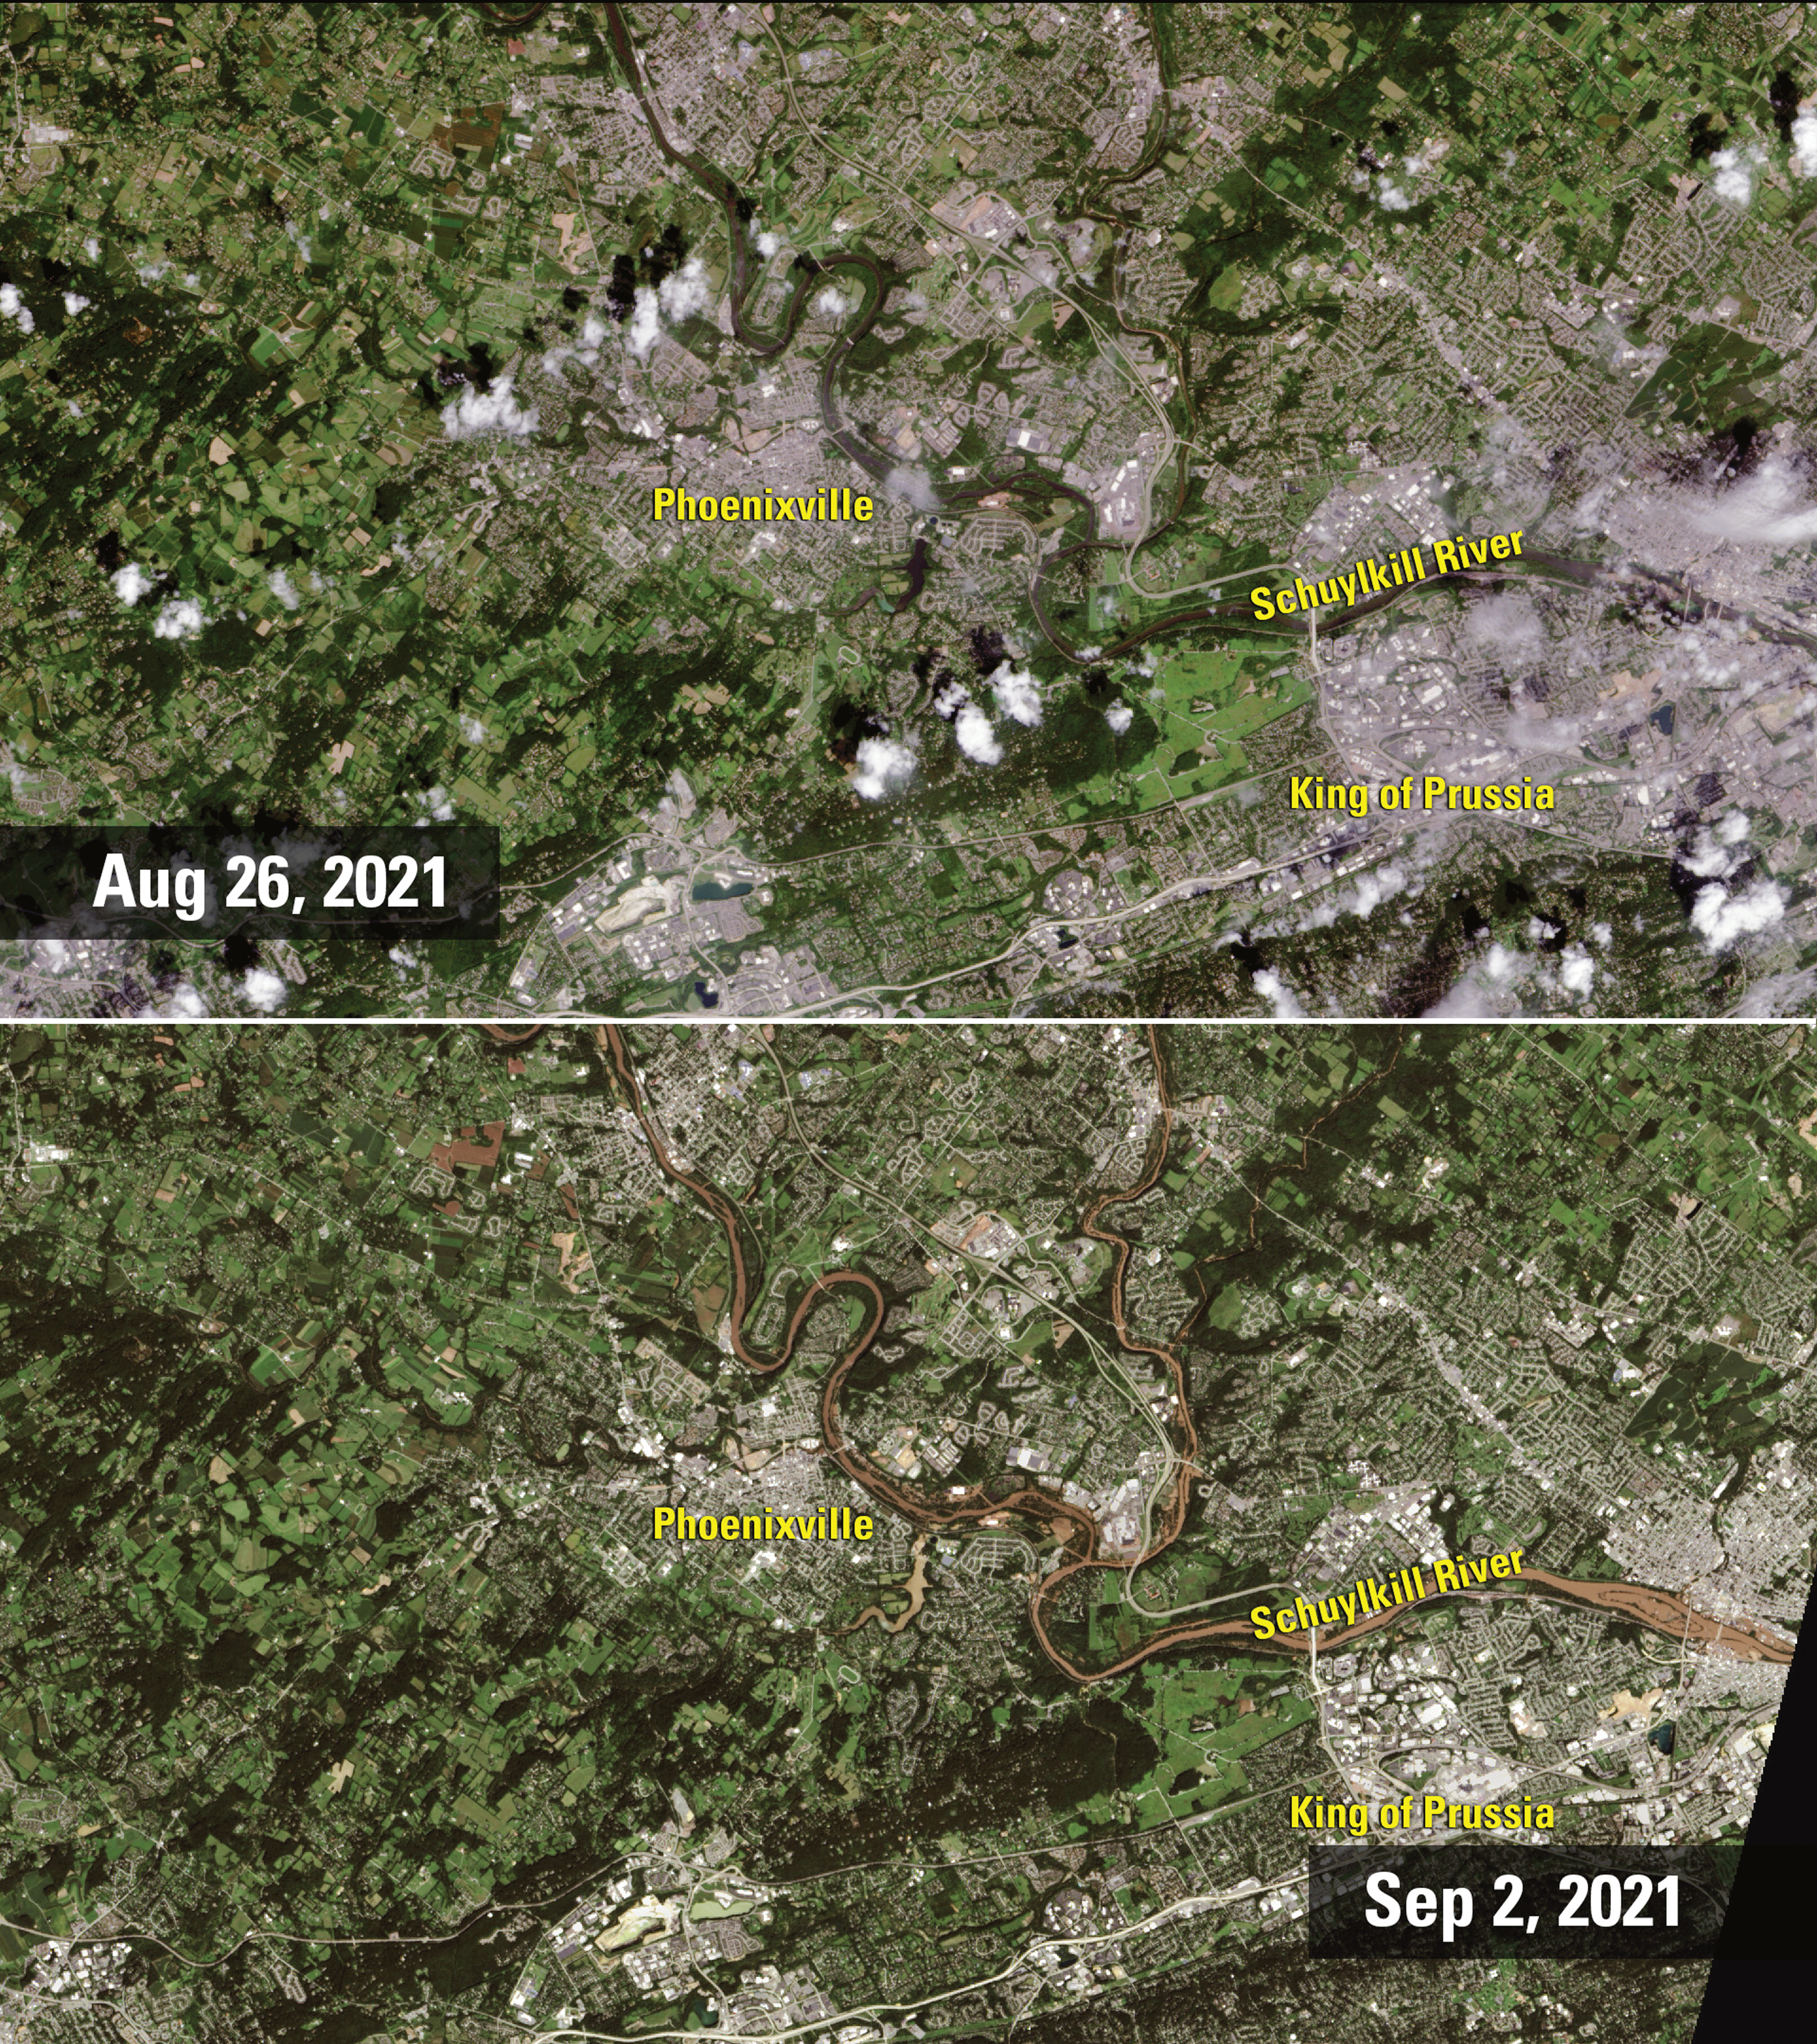
These Landsat images show the Schuylkill River west of Philadelphia, where muddied waters rose in several communities after the Hurricane Ida deluge.
Tracking Change from the Energy Industry
More than 160 years have passed since Edwin L. Drake drilled the Nation’s first commercially successful oil well in Titusville. By 1859, Pennsylvania was already a leading producer and consumer of bituminous coal. The steel mills of Western Pennsylvania that proliferated in the early 1900s are the reason Pittsburgh’s National Football League team is called the “Steelers.” Fossil fuels and steel no longer stand as the largest industries in the Commonwealth, but both remain important to its economy. Landsat satellite data can be used in innovative ways to monitor the recovery of former mines and oil production sites and for the study of the environmental effects of new energy developments (Platt and others, 2018).
National Land Imaging Program Benefits—Pennsylvania
The U.S. Geological Survey (USGS) National Land Imaging Program provides a wide range of satellite imagery and other remotely sensed and geospatial data to Government, commercial, academic, and public users. Those users can get worldwide access to Landsat satellite data through the National Land Imaging Program-funded USGS Earth Resources Observation and Science (EROS) Center.
Landsat—Critical Information Infrastructure for the Nation
Landsat is the most widely used land remote sensing data source within Federal civilian agencies. Local, State, Tribal, and Federal agencies use Landsat to monitor and forecast a wide range of land surface phenomena. Information from Landsat contributes to day-to-day decisions on land, water, and resource use that protect life and property; safeguard the environment; advance science, technology and education; support climate change resiliency; and grow the U.S. economy. Landsat’s imagery provides a landscape-level view of land surface, inland lake, and coastal processes, both natural and human-induced. Landsat enables us to better understand the scope, nature, and speed of change to the natural and built environment.
Businesses draw upon Landsat data to provide customer-specific applications to improve logistics, resource allocation, and investment decisions. Commercial space-imaging firms leverage Landsat data to refine product offerings and support new information services. A 2017 USGS study determined the total annual economic benefit of Landsat data in the United States to be $2.06 billion, far surpassing its development and operating costs (Straub and others, 2019).
Landsat 8 and Landsat 9 provide 8-day repeat coverage of the Earth’s land surfaces. The National Aeronautics and Space Administration (NASA) and the USGS are currently reviewing the findings from a joint Architecture Study Team, which will inform the design and implementation approach for Landsat Next, the follow-on mission to Landsat 9. Landsat 9 and its successors are planned to provide a sustainable, space-based system to extend the 50-year Landsat series of high-quality global land imaging measurements—the world’s longest time series of the Earth’s land surface.
The long-term availability of consistent and accurate Landsat data, combined with a no-cost data policy, allows users to analyze extensive geographic areas and better understand and manage long-term trends in land surface change. New cloud computing and data analytics technologies use Landsat data in a wide range of decision-support tools for Government and industry. Much like global positioning systems and weather data, Landsat data are used every day to help us better understand our dynamic planet.
References Cited
Dornbierer, J., Wika, S., Robison, C., Rouze, G., and Sohl, T., 2021, Prototyping a methodology for long-term (1680–2100) historical-to-future landscape modeling for the conterminous United States: Land, v. 10, no. 5, p. 536, accessed February 15, 2022, at https://doi.org/10.3390/land10050536.
Huebner, C.D., Morin, R.S., Zurbriggen, A., White, R.L., Moore, A., and Twardus, D., 2009, Patterns of exotic plant invasions in Pennsylvania’s Allegheny National Forest using intensive Forest Inventory and Analysis plots: Forest Ecology and Management, v. 257, no. 1, p. 258–270, accessed February 15, 2022, at https://doi.org/10.1016/j.foreco.2008.08.036.
Pennsylvania Department of Conservation and Natural Resources [DCNR], [undated], Forest health fact sheet—Forest tent caterpillar: Pennsylvania DCNR fact sheet, 4 p., accessed February 15, 2022, at http://elibrary.dcnr.pa.gov/PDFProvider.ashx?action=PDFStream&docID=1737935&chksum=&revision=0&docName=+Health+Factsheet-Forest+Tent+Caterpillar&nativ eExt=pdf&PromptToSave=False&Size=101324&ViewerMode=2&overlay=0.
Platt, R.V., Manthos, D., and Amos, J., 2018, Estimating the creation and removal date of fracking ponds using trend analysis of Landsat imagery: Environmental Management, v. 61, no. 2, p. 310–320, accessed February 15, 2022, at https://doi.org/10.1007/s00267-017-0983-4.
Straub, C.L., Koontz, S.R., and Loomis, J.B., 2019, Economic valuation of Landsat imagery: U.S. Geological Survey Open-File Report 2019–1112, 13 p., accessed January 13, 2022, at https://doi.org/10.3133/ofr20191112.
Williams, D.L., 1975, A-13 computers analysis and mapping of gypsy moth defoliation levels, in Proceedings of the NASA Earth Resources Survey Symposium, Houston, Texas, June 1975: National Aeronautics and Space Administration, First Comprehensive Symposium on the Practical Application of Earth Resources Survey Data, v. 58168, accessed February 15, 2022, at https://ntrs.nasa.gov/citations/19760010393.
For additional information on Landsat, please contact:
Program Coordinator
USGS National Land Imaging Program
12201 Sunrise Valley Drive
Reston, VA 20192
703–648–5953
The Landsat series is a joint effort of USGS and NASA. NASA develops and launches the spacecraft; USGS manages satellite operations, ground reception, data archiving, product generation, and data distribution. Funding for the National Land Imaging Program’s Landsat operations and data management is provided through the USGS.
Disclaimers
Any use of trade, firm, or product names is for descriptive purposes only and does not imply endorsement by the U.S. Government.
Although this information product, for the most part, is in the public domain, it also may contain copyrighted materials as noted in the text. Permission to reproduce copyrighted items must be secured from the copyright owner.
Suggested Citation
U.S. Geological Survey, 2022, Pennsylvania and Landsat: U.S. Geological Survey Fact Sheet 2022–3025, 2 p., https://doi.org/10.3133/fs20223025.
ISSN: 2327-6932 (online)
ISSN: 2327-6916 (print)
Study Area
| Publication type | Report |
|---|---|
| Publication Subtype | USGS Numbered Series |
| Title | Pennsylvania and Landsat |
| Series title | Fact Sheet |
| Series number | 2022-3025 |
| DOI | 10.3133/fs20223025 |
| Publication Date | May 04, 2022 |
| Year Published | 2022 |
| Language | English |
| Publisher | U.S. Geological Survey |
| Publisher location | Reston, VA |
| Contributing office(s) | Earth Resources Observation and Science (EROS) Center |
| Description | 2 p. |
| Country | United States |
| State | Pennsylvania |
| Online Only (Y/N) | N |