

Nevada and Landsat
Links
- Document: Report (3.75 MB pdf) , HTML , XML
- Download citation as: RIS | Dublin Core
Abstract
Nevada’s geography is colorful—and contradictory. As one of the most mountainous States, Nevada shares the country’s second-deepest lake, Lake Tahoe, with neighboring California. It is also the driest State and largely covered by desert. Northern Nevada has long, cold winters, whereas the south has long, hot summers. It is the seventh-largest State, but it ranks in the bottom one-half of States for population. More than 72 percent of its 3.1 million residents live in the Las Vegas area.
In Nevada, the desert is not dull. An extraordinary variety of wildflowers bloom in the spring, and other plants include mesquite, cacti, creosote, and yucca such as Joshua trees (Yucca brevifolia). Sagebrush (Artemisia tridentata) is more than the State flower; it is a hardy, enduring shrub foundational to a vast ecosystem in the Great Basin that feeds and shelters hundreds of wildlife species. The Silver State has a strong mining tradition, and agriculture centers around livestock ranching and irrigated crops. Although mining and agriculture once formed the base of Nevada’s economy, tourism now leads the way, mostly from gambling and entertainment in Las Vegas, Reno, and other cities. Water is a critical resource for supporting residents, visitors, and industries, and Lake Mead behind Hoover Dam on the Colorado River supplies most of it for southern Nevada.
Nevada has significant natural resources, but they face threats—especially in a warming climate. Here are a few ways Landsat benefits Nevada.
Watching the Water
The Colorado River Basin supplies water to seven U.S. States and to Mexico. Drought varying in extremity has persisted in the basin since 2000. In August 2021, Lake Mead dropped to a record low—about 35 percent of its capacity. For the first time, the Bureau of Reclamation declared a water shortage for Lake Mead, one of two key reservoirs on the river. This decision resulted in reductions of the water supply for Nevada, Arizona, and Mexico starting in 2022. Landsat imagery shows how the lake has expanded and contracted over time, and the data can help measure water use on land to improve water budgets and modeling. Using Landsat to measure evapotranspiration (ET), or the movement of water into the atmosphere via evaporation and plant transpiration, can reveal how much water is used in irrigation, which accounts for more than two-thirds of freshwater use in Nevada. The Nevada Department of Water Resources has used Landsat-based data to help monitor agricultural water consumption (Serbina and Miller, 2014).
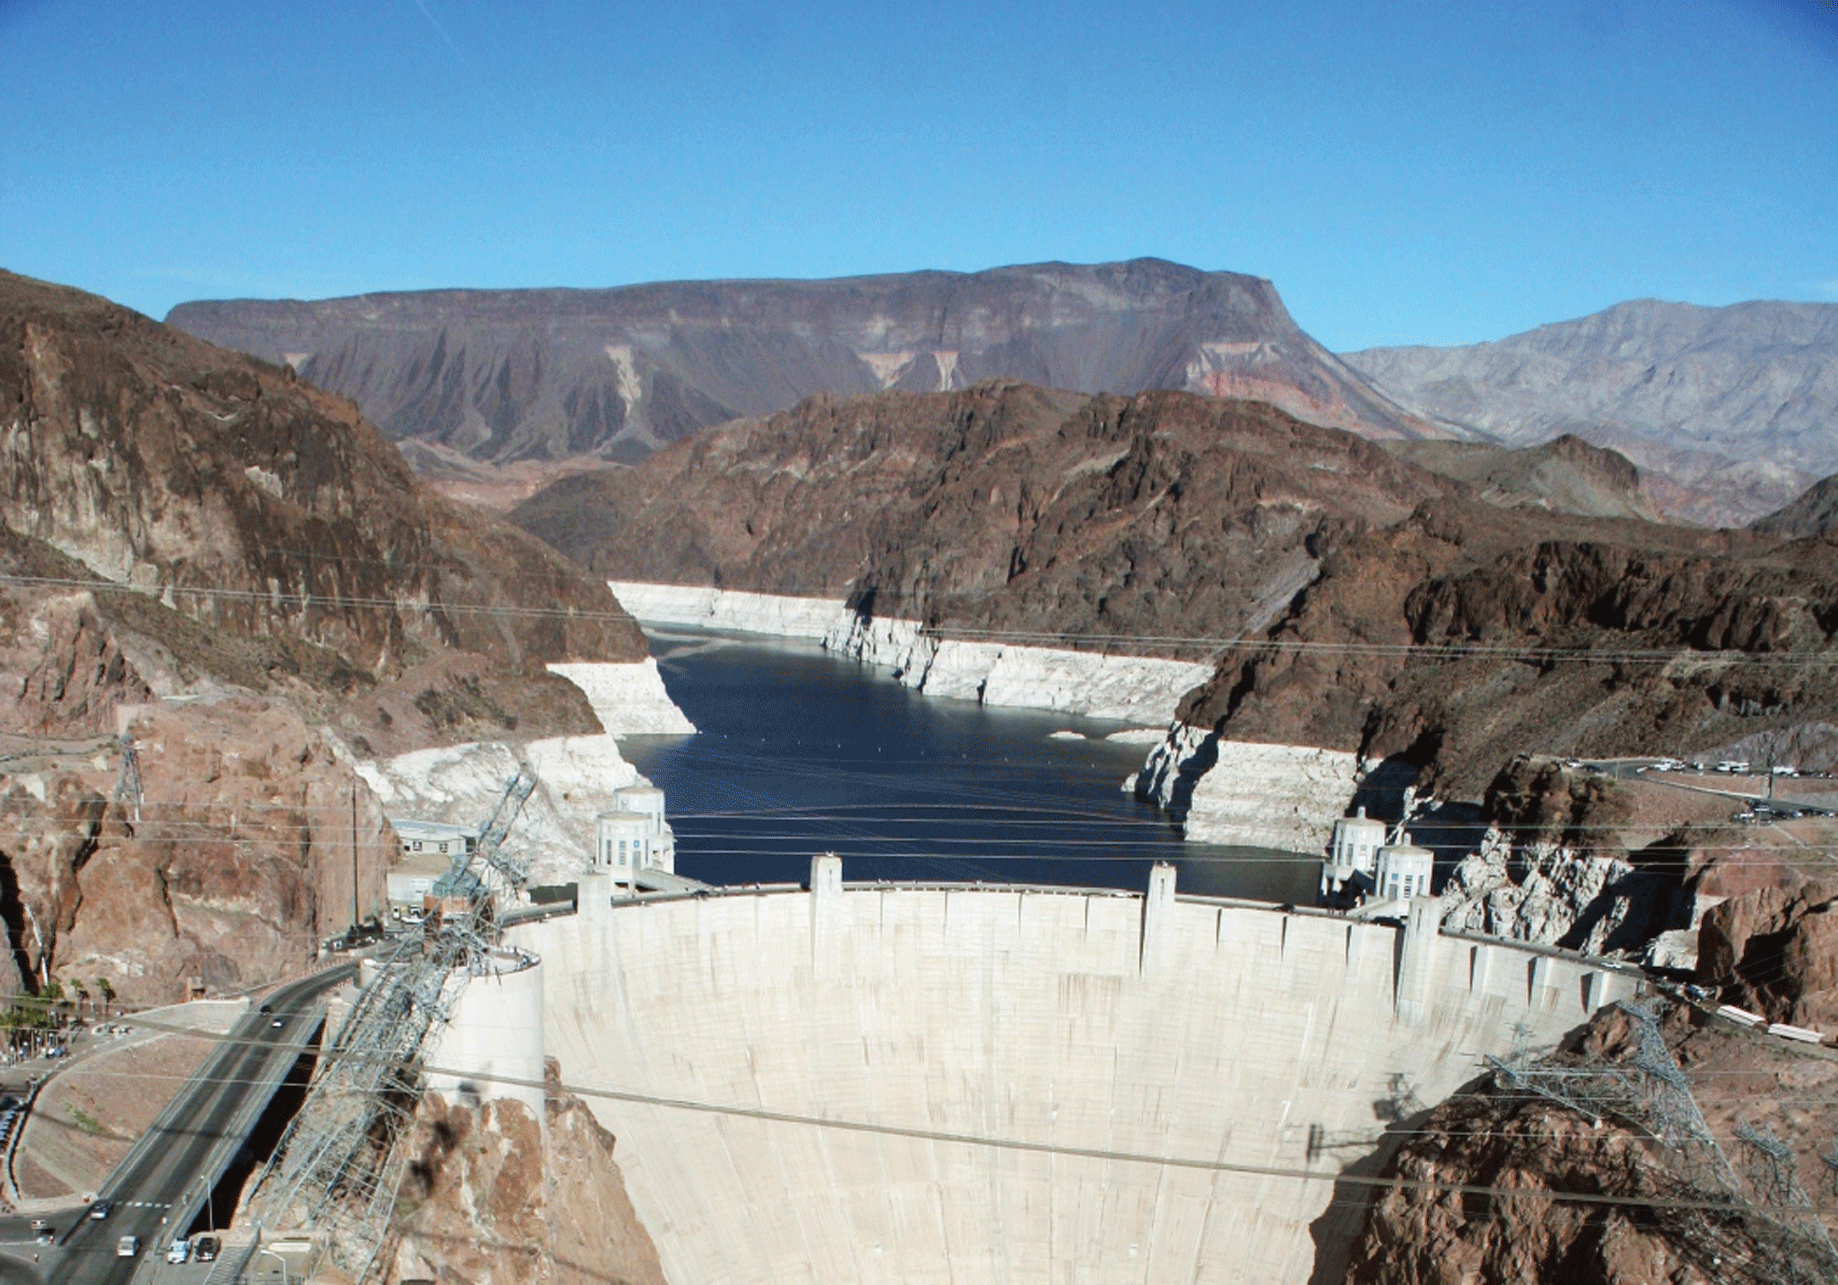
Lake Mead, behind Hoover Dam (foreground) on the Colorado River, supplies 90 percent of the water needed to southern Nevada. A white “bathtub ring” surrounding the lake represents the highwater mark, becoming more visible the lower the water level gets. Photograph credit: Michael R. Rosen, U.S. Geological Survey.
Monitoring Threats to Sagebrush
Drought-resistant sagebrush can thrive in places other plants cannot, and some sagebrush species live as long as 150 years. Some wildlife, like the iconic greater sage-grouse (Centrocercus urophasianus), live solely in the sagebrush ecosystem. However, sagebrush communities cannot survive wildfires and can take decades to recover after a fire or other disturbance. They are also vulnerable to invasive plants such as cheatgrass (Bromus tectorum) that increase the risk of fire. Landsat’s scale and historical archive can help map the extent of cheatgrass and other invasive plants over time and use those patterns to model future vulnerability (Pastick and others, 2021).
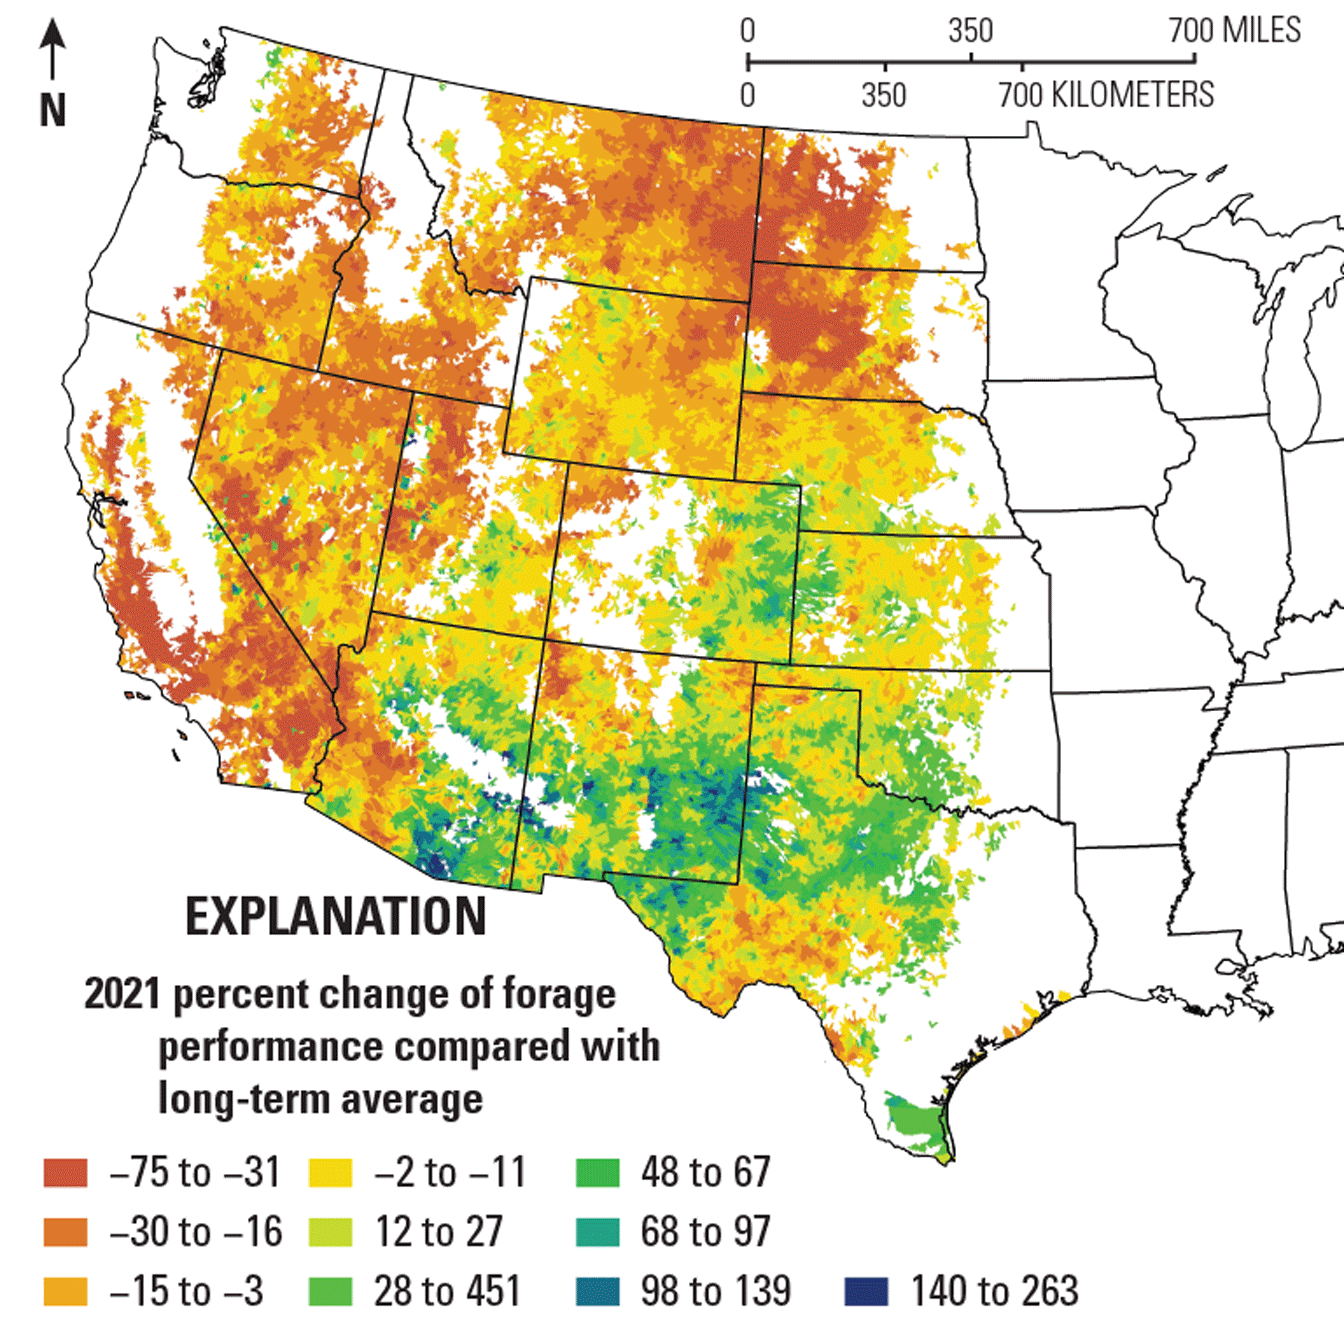
The U.S. Geological Survey’s cheatgrass/exotic annual grass maps, which use Landsat data, help inform maps like this for Fuelcast, which calculates biomass estimates for the western United States. Map credit: Matt Reeves, U.S. Department of Agriculture.
Characterizing Urban Areas
Landsat reveals useful details about urban conditions. For example, its imagery shows the remarkable growth of the Las Vegas area spanning several decades. Data also can unveil the parts of a city that are hotter than others, or urban heat islands. These spaces occur in areas that have more impervious surfaces and fewer natural features, where daytime and nighttime temperatures exceed surrounding areas. Urban heat islands can place vulnerable residents at higher risk for heat-related illness or death. A NASA effort to help the Washoe County Health District mitigate urban heat effects in the Reno-Sparks area involved using Landsat data on land cover and land-surface temperature to help identify areas of high heat and vulnerability (Heslin and others, 2018).
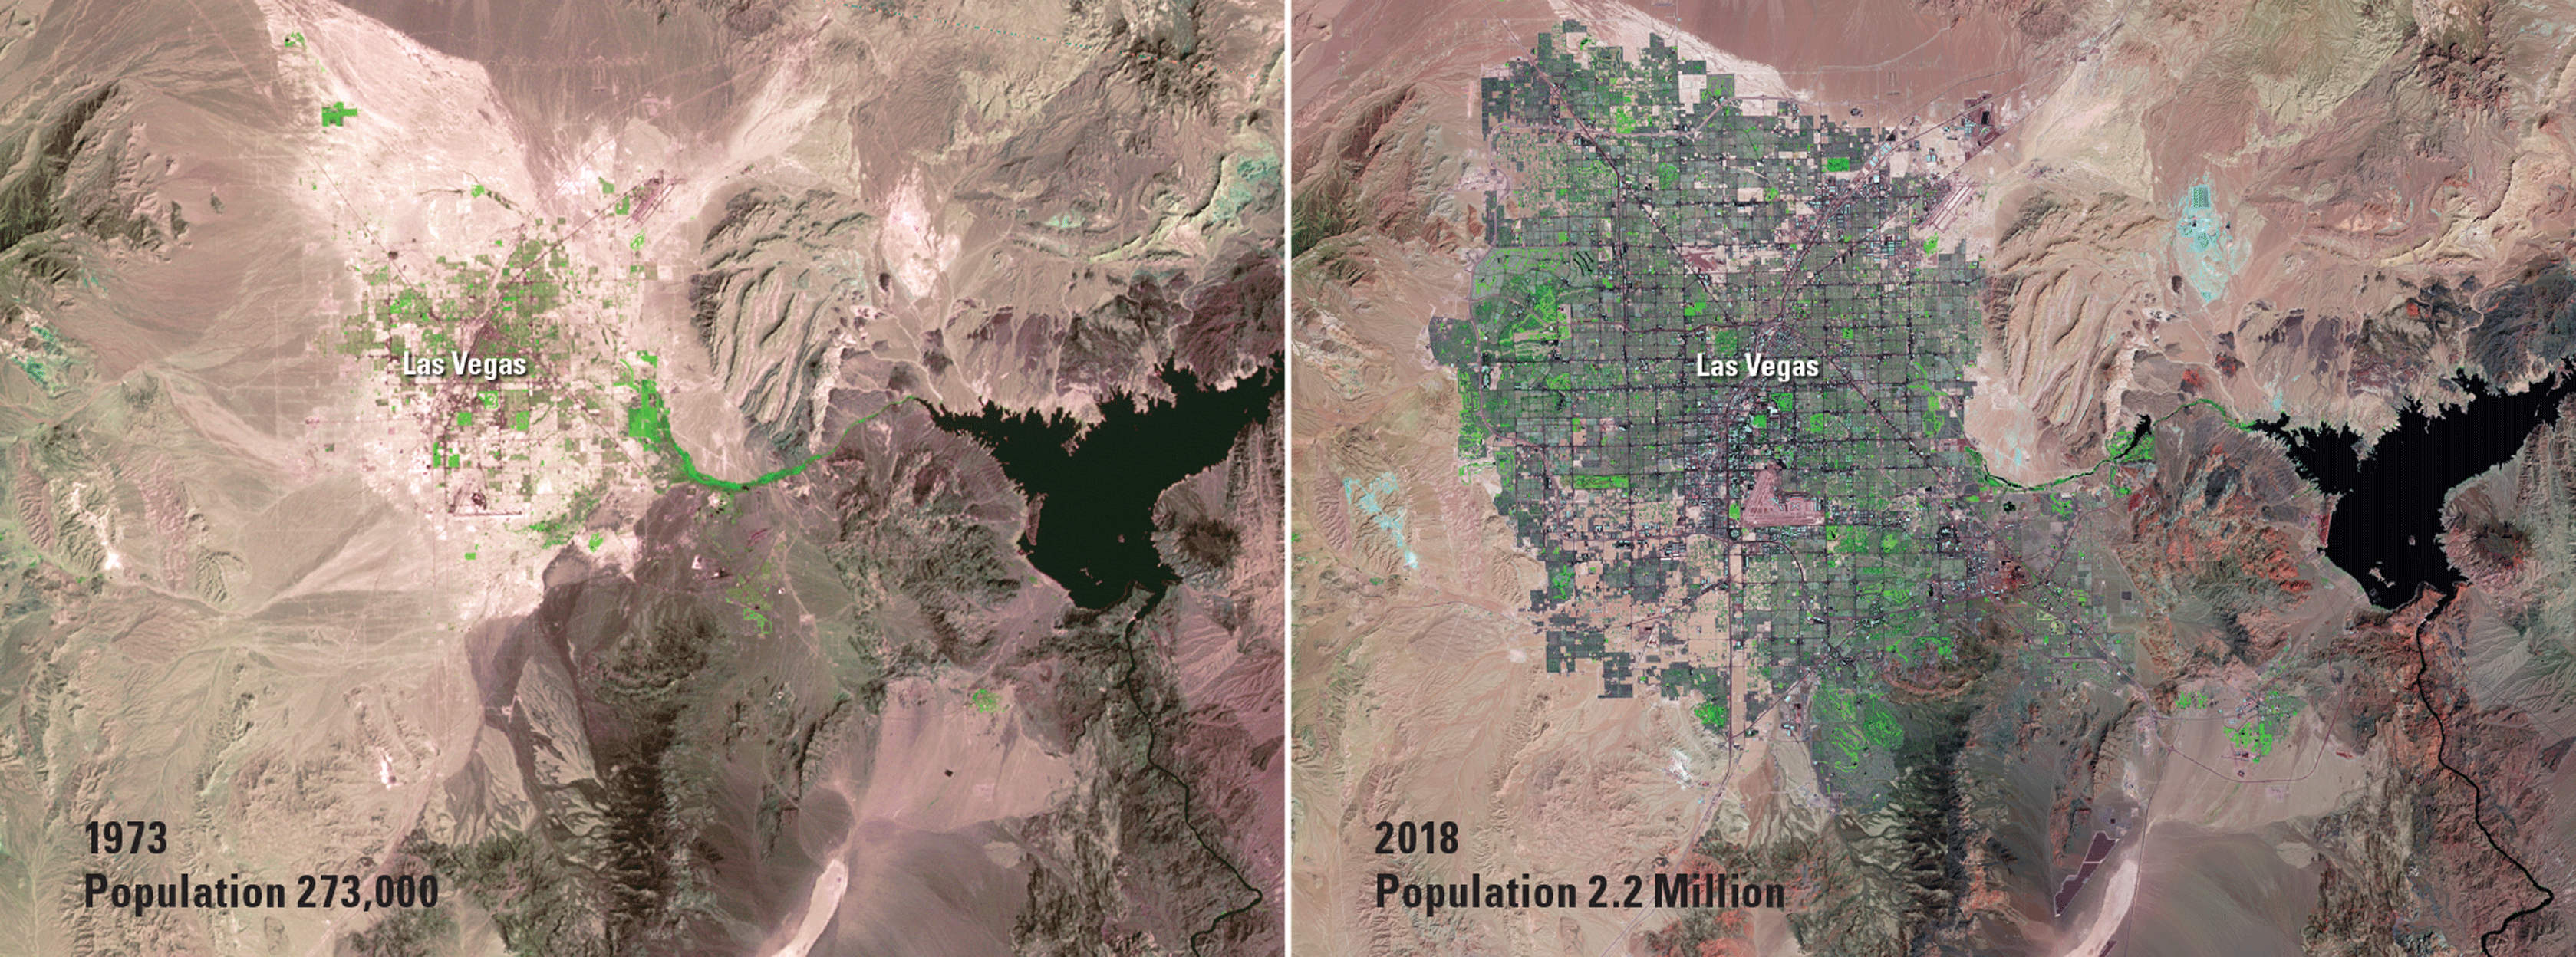
Landsat imagery can illustrate changes in urban development and land features, such as these maps showing where the Las Vegas metropolitan area population grew. Image credit: U.S. Geological Survey.
National Land Imaging Program Benefits—Nevada
The U.S. Geological Survey (USGS) National Land Imaging Program provides a wide range of satellite imagery and other remotely sensed and geospatial data to Government, commercial, academic, and public users. Those users can get worldwide access to Landsat satellite data through the National Land Imaging Program-funded USGS Earth Resources Observation and Science (EROS) Center.
Landsat—Critical Information Infrastructure for the Nation
Landsat is the most widely used land remote sensing data source within Federal civilian agencies. Local, State, Tribal, and Federal agencies use Landsat to monitor and forecast a wide range of land surface phenomena. Information from Landsat contributes to day-to-day decisions on land, water, and resource use that protect life and property; safeguard the environment; advance science, technology and education; support climate change resiliency; and grow the U.S. economy. Landsat’s imagery provides a landscape-level view of land surface, inland lake, and coastal processes, both natural and human-induced. Landsat enables us to better understand the scope, nature, and speed of change to the natural and built environment.
Businesses draw upon Landsat data to provide customer-specific applications to improve logistics, resource allocation, and investment decisions. Commercial space-imaging firms leverage Landsat data to refine product offerings and support new information services. A 2017 USGS study determined the total annual economic benefit of Landsat data in the United States to be $2.06 billion, far surpassing its development and operating costs (Straub and others, 2019).
Landsat 8 and Landsat 9 provide 8-day repeat coverage of the Earth’s land surfaces. The National Aeronautics and Space Administration (NASA) and the USGS are currently reviewing the findings from a joint Architecture Study Team, which will inform the design and implementation approach for Landsat Next, the follow-on mission to Landsat 9. Landsat 9 and its successors are planned to provide a sustainable, space-based system to extend the 50-year Landsat series of high-quality global land imaging measurements—the world’s longest time series of the Earth’s land surface.
The long-term availability of consistent and accurate Landsat data, combined with a no-cost data policy, allows users to analyze extensive geographic areas and better understand and manage long-term trends in land surface change. New cloud computing and data analytics technologies use Landsat data in a wide range of decision-support tools for Government and industry. Much like global positioning systems and weather data, Landsat data are used every day to help us better understand our dynamic planet.
References Cited
Heslin, J., Dialesandro, J., Heck, M., and Lin, C., 2018, Utilizing NASA earth observations to assess urban heat island reduction strategies in Washoe County, Nevada: NASA DEVELOP National Program, Washoe County Urban Development web page, summer 2018, accessed February 2, 2022, at https://develop.larc.nasa.gov/2018/summer/WashoeUrban.html.
Pastick, N.J., Wylie, B.K., Rigge, M.B., Dahal, D., Boyte, S.P., Jones, M.O., Allred, B.W., Parajuli, S., and Wu, Z., 2021, Rapid monitoring of the abundance and spread of exotic annual grasses in the western United States using remote sensing and machine learning: AGU Advances, v. 2, no. 2, accessed February 2, 2022, at https://doi.org/10.1029/2020AV000298.
Serbina, L.O., and Miller, H.M., 2014, Landsat uses and benefits—Case studies by application area: U.S. Geological Survey Open-File Report 2014–1108, 61 p., accessed February 2, 2022, at https://doi.org/10.3133/ofr20141108.
Straub, C.L., Koontz, S.R., and Loomis, J.B., 2019, Economic valuation of Landsat imagery: U.S. Geological Survey Open-File Report 2019–1112, 13 p., accessed January 13, 2022, at https://doi.org/10.3133/ofr20191112.
For additional information on Landsat, please contact:
Program Coordinator
USGS National Land Imaging Program
12201 Sunrise Valley Drive
Reston, VA 20192
703–648–5953
The Landsat series is a joint effort of USGS and NASA. NASA develops and launches the spacecraft; USGS manages satellite operations, ground reception, data archiving, product generation, and data distribution. Funding for the National Land Imaging Program’s Landsat operations and data management is provided through the USGS.
Suggested Citation
U.S. Geological Survey, 2022, Nevada and Landsat: U.S. Geological Survey Fact Sheet 2022–3026, 2 p., https://doi.org/10.3133/fs20223026.
ISSN: 2327-6932 (online)
ISSN: 2327-6916 (print)
Study Area
| Publication type | Report |
|---|---|
| Publication Subtype | USGS Numbered Series |
| Title | Nevada and Landsat |
| Series title | Fact Sheet |
| Series number | 2022-3026 |
| DOI | 10.3133/fs20223026 |
| Year Published | 2022 |
| Language | English |
| Publisher | U.S. Geological Survey |
| Publisher location | Reston, VA |
| Contributing office(s) | Earth Resources Observation and Science (EROS) Center |
| Description | 2 p. |
| Country | United States |
| State | Nevada |
| Online Only (Y/N) | N |
| Google Analytic Metrics | Metrics page |