

Oklahoma and Landsat
Links
- Document: Report (3.23 MB pdf) , HTML , XML
- Download citation as: RIS | Dublin Core
Abstract
Oklahoma benefits from a varied landscape abundant in resources. Mountains, grasslands, reservoirs, rivers, fields, and forests offer employment and enjoyment in a State that epitomizes the transition from north to south and east to west. Wheat grows in northern Oklahoma; cotton grows in the south. Wetter deciduous forest lands in the southeast contrast with drier mesas in the northwest. Among the many lakes and reservoirs, the Great Salt Plains Lake on the Arkansas River has thousands of acres of salt flats with unique hourglass-shaped selenite crystals.
Grassland and grazing permeate the Sooner State, which is the second largest cattle producer in the country. Oil, natural gas, and coal have long played a key role in Oklahoma’s economy and energy industry, whereas wind farms in western Oklahoma are a more recent addition.
The Landsat series of Earth observation satellites has allowed analysts to search for oil in Oklahoma from hundreds of miles above the Earth (Nelson, 1985). The satellite program also helps Oklahoma’s agriculture industry keep an eye on the condition of crops and grazing land.
Here are just a few ways Landsat has benefited Oklahoma.
Viewing Fields
More than 75 percent of Oklahoma’s land is used by the agriculture industry. Oklahoma produces a variety of crops in addition to wheat and cotton, including corn, soybeans, sorghum, rye, hay, peanuts, and pecans. The U.S. Department of Agriculture’s (UDSA’s) Cropland Data Layer (CDL) gives information about each State’s fields, such as crop type, acreage, and yield, based on a foundation of Landsat and other data. The annual data layer reveals what is planted, how much, and where, as well as where the land has changed in use. This information about the food supply helps agricultural producers and others in the industry make prudent decisions (USDA, 2022).
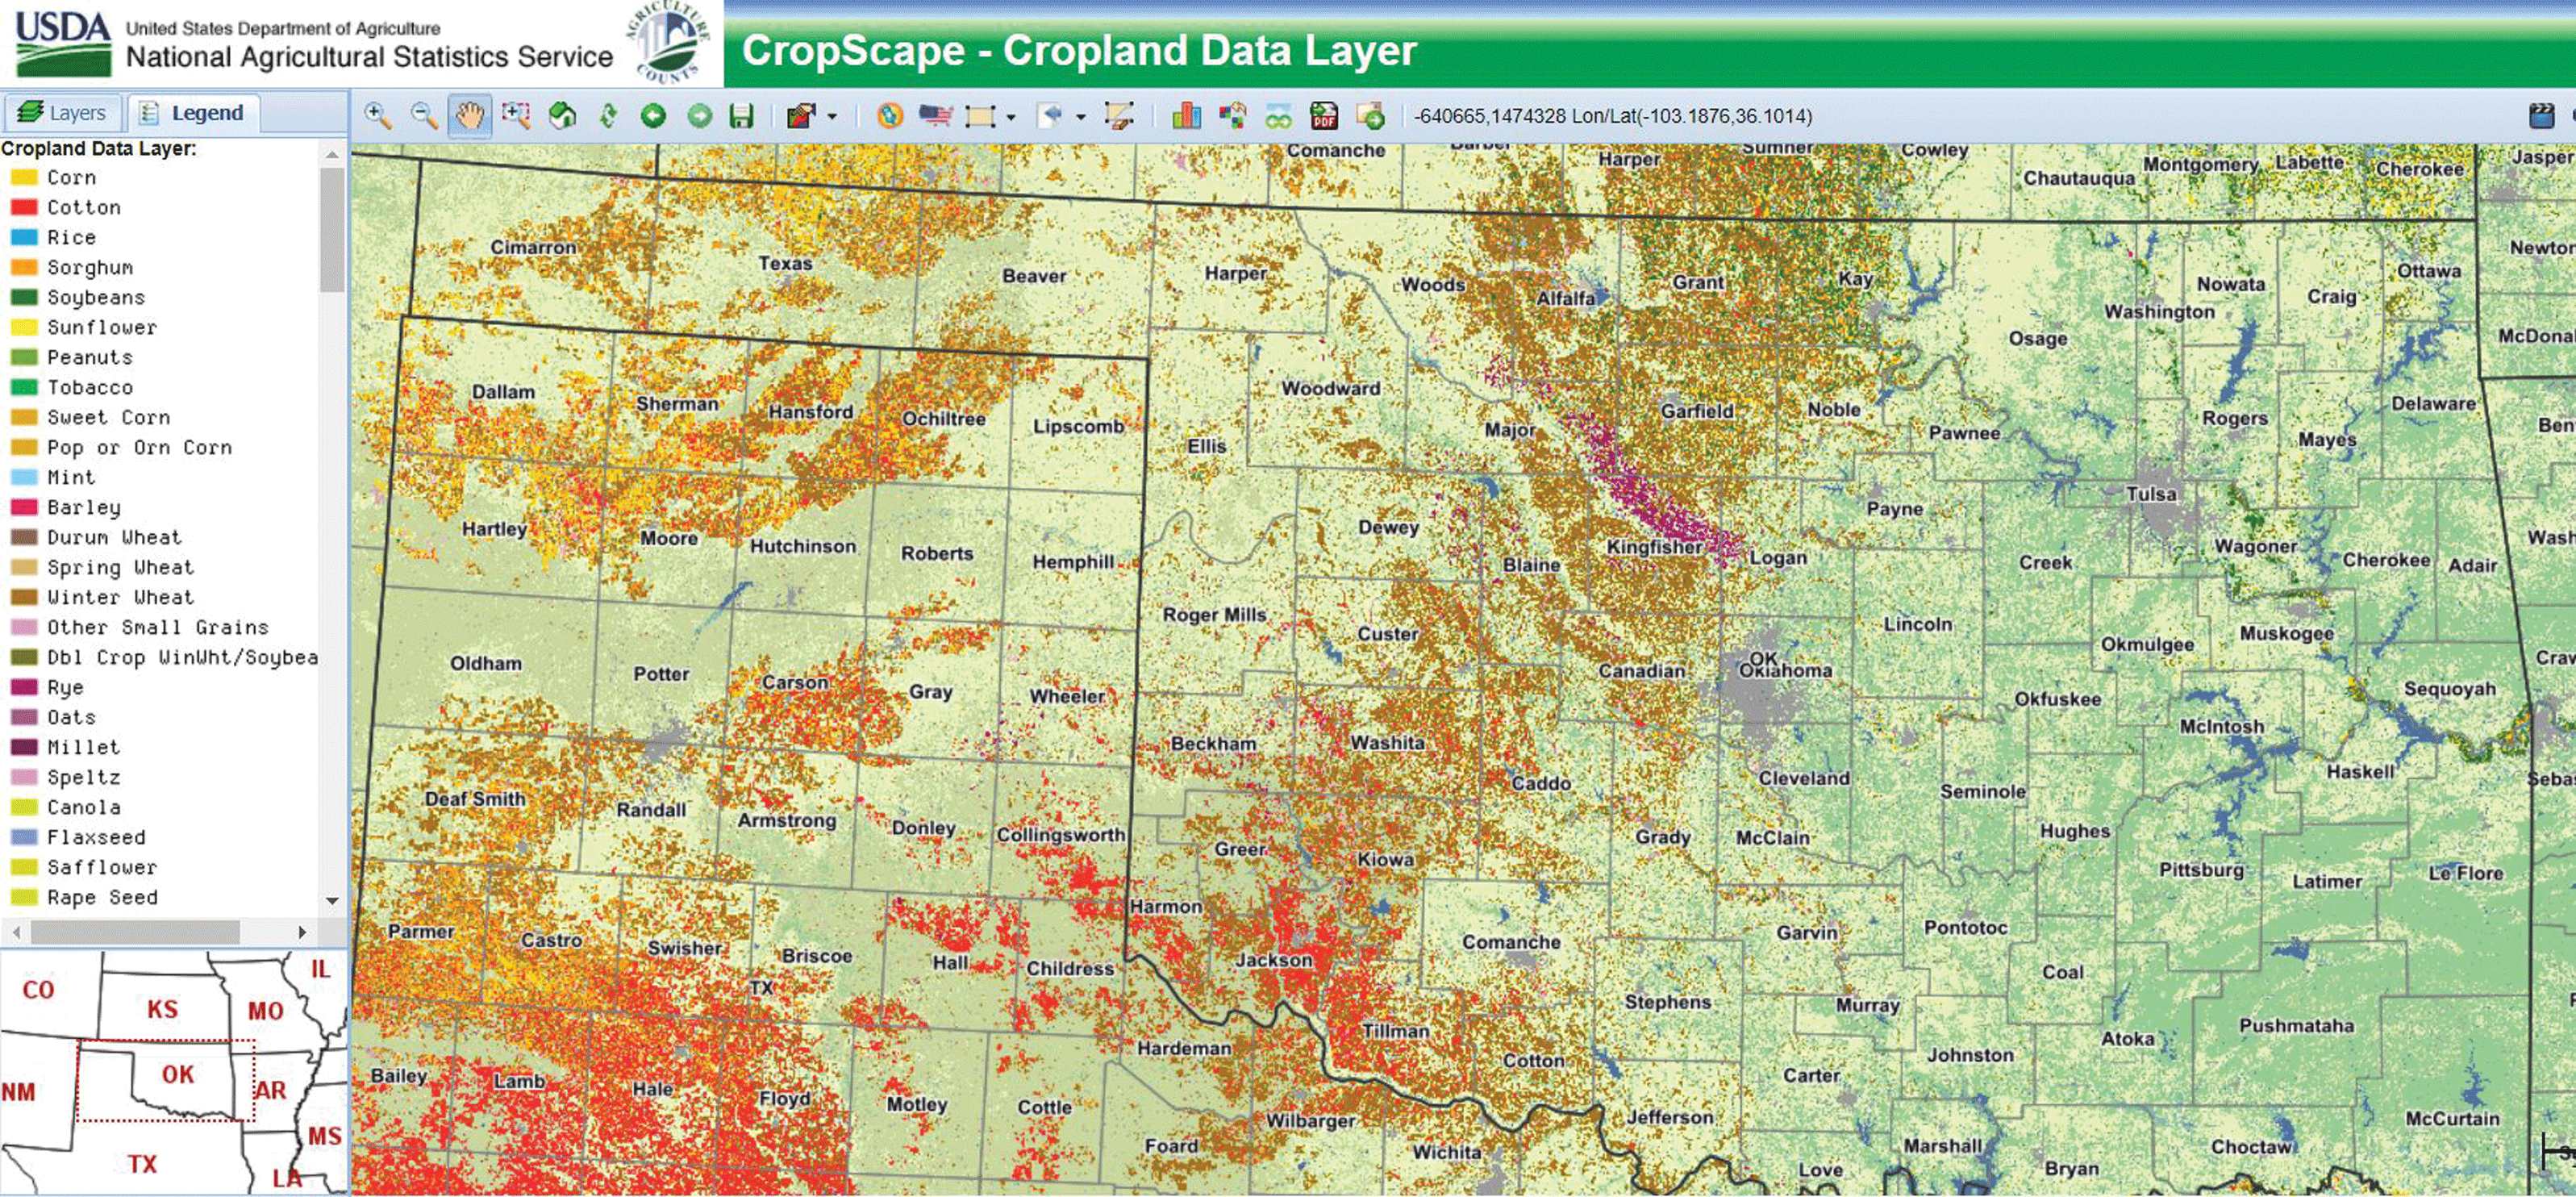
The 2021 Cropland Data Layer map of Oklahoma includes forest (medium green), grass and pasture (light yellow-green), shrubland (light tan), wheat (dark brown), corn and sorghum (shades of orange), soybeans (dark green), cotton (red), and rye (purple). Gray and dark blue represent developed areas and water, respectively. Image credit: U.S. Department of Agriculture.
Characterizing Wildfires
A dry winter can turn one summer’s lush, rain-fed grassland into brittle fuel for raging fires the next year. This scenario led to the Anderson Creek Fire, which started in the spring of 2016 in northern Oklahoma. Driven across the border by wind, the Anderson Creek Fire turned into Kansas’ largest wildfire in modern history—until the Starbuck Fire started in Oklahoma the following spring and spread to Kansas. Landsat data can provide a before-and-after landscape view of the fires and show their severity and extent. The Landsat-based program Monitoring Trends in Burn Severity (MTBS) has mapped this information for large fires across the United States from 1984 to the present (2022)—nearly 29,000 fires so far. MTBS information supports fire management strategies, land management, and research about fires and fire recovery (MTBS, 2022).
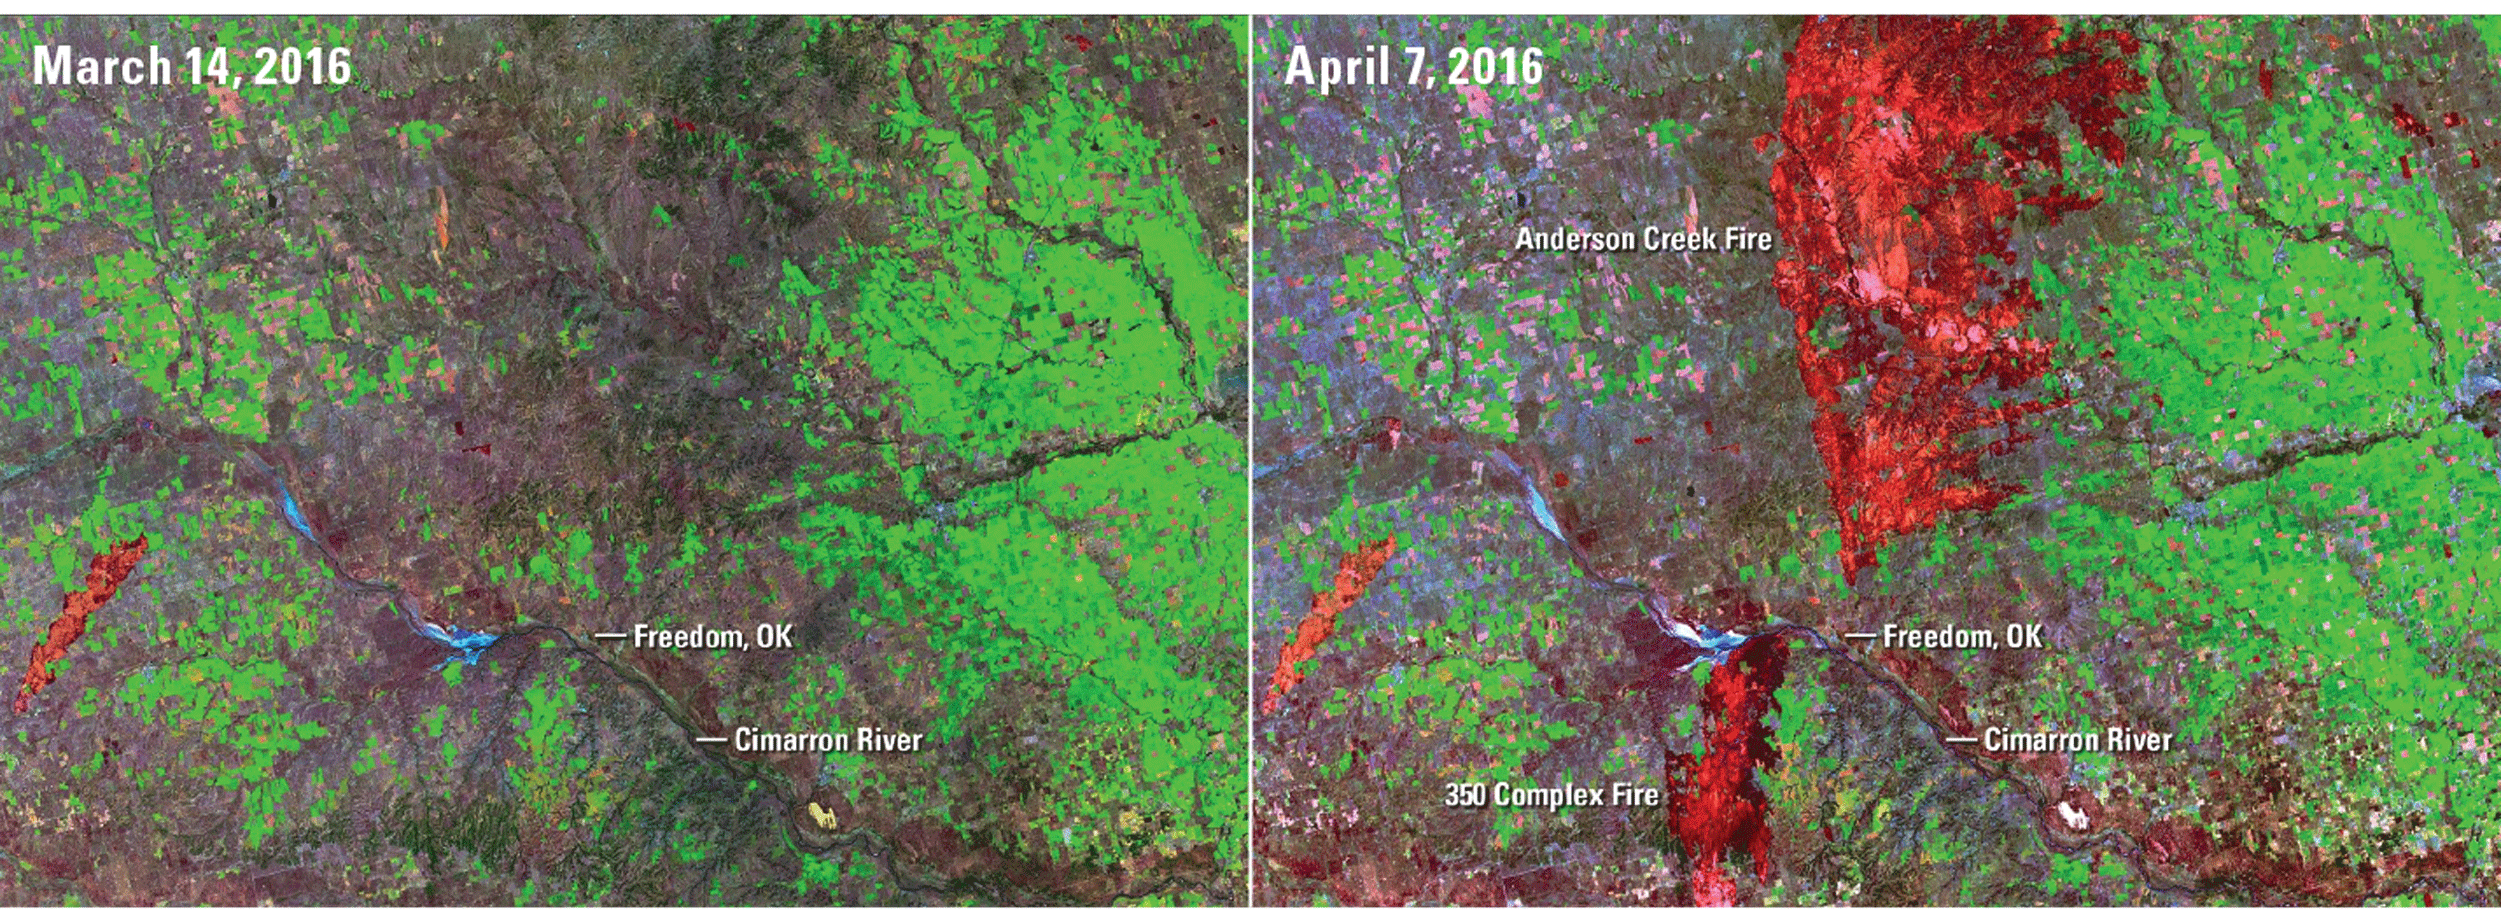
Landsat images capture terrain before and after two fires began in Oklahoma. The Anderson Creek Fire started in late March 2016 and spread north into Kansas. Four fires merged into Oklahoma’s 350 Complex Fire just southwest of the Anderson Creek Fire. The orange area in the lower left is a burn scar from a previous fire. Image credit: U.S. Geological Survey.
Examining Tornado Damage
Oklahomans are quite familiar with severe weather and tornadoes; in fact, the first official tornado forecast and warning in the United States were provided in 1948 by Tinker Air Force Base near Oklahoma City. The National Oceanic and Atmospheric Administration’s National Severe Storms Laboratory (NSSL) and Storm Prediction Center are in Norman. Landsat imagery can provide a useful view of the location and extent of tornado damage, especially in a State that averages 57 tornadoes each year but experienced 149 in 2019. A study by University of Oklahoma and NSSL researchers also used Landsat data to examine variations of tornado damage in 17 urban, forest, and grassland areas in the southeastern United States—including 3 in Oklahoma—between 2002 and 2015, as well as recovery in forests (Kingfield and De Beurs, 2017).
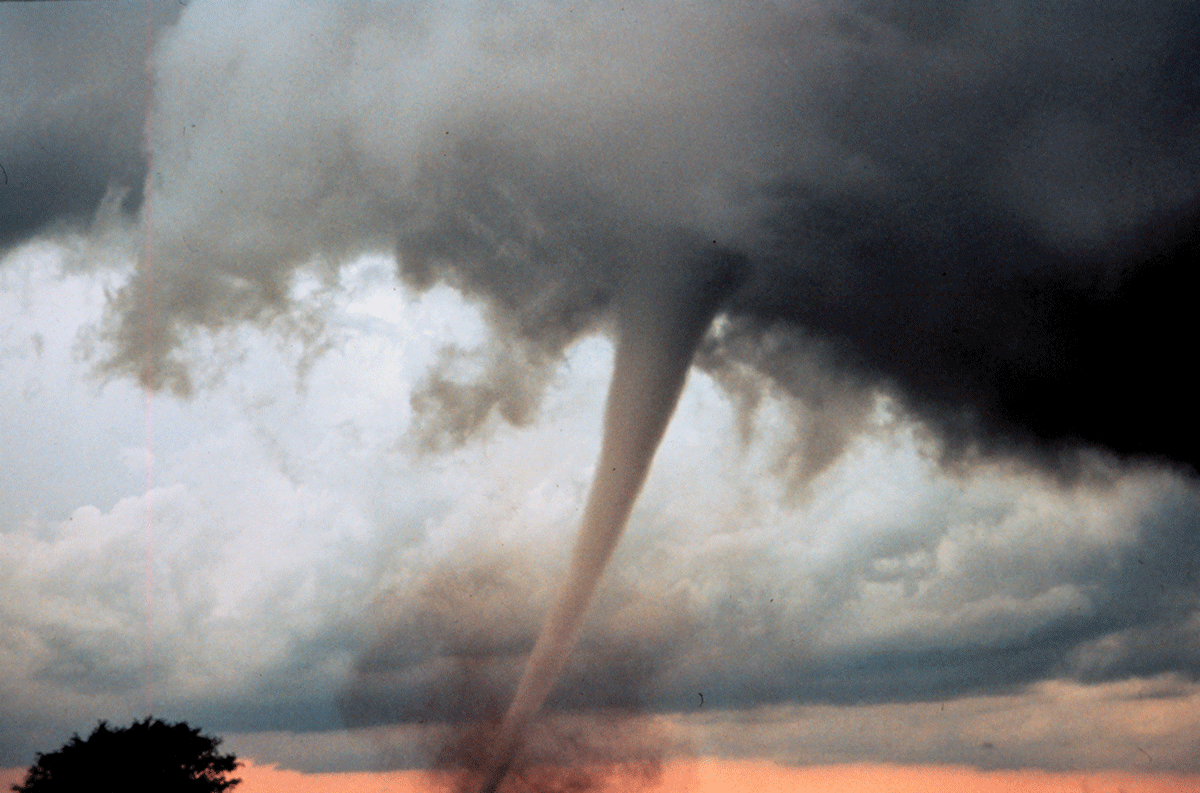
This tornado south of Anadarko, Oklahoma, was part of an outbreak of 74 tornadoes across Oklahoma and Kansas on May 3, 1999, that killed 46 people and injured 800, mostly in the Oklahoma City area. Photograph credit: National Oceanic and Atmospheric Administration National Severe Storms Laboratory.
National Land Imaging Program Benefits—Oklahoma
The U.S. Geological Survey (USGS) National Land Imaging Program provides a wide range of satellite imagery and other remotely sensed and geospatial data to Government, commercial, academic, and public users. Those users can get worldwide access to Landsat satellite data through the National Land Imaging Program-funded USGS Earth Resources Observation and Science (EROS) Center.
Landsat—Critical Information Infrastructure for the Nation
Landsat is the most widely used land remote sensing data source within Federal civilian agencies. Local, State, Tribal, and Federal agencies use Landsat to monitor and forecast a wide range of land surface phenomena. Information from Landsat contributes to day-to-day decisions on land, water, and resource use that protect life and property; safeguard the environment; advance science, technology and education; support climate change resiliency; and grow the U.S. economy. Landsat’s imagery provides a landscape-level view of land surface, inland lake, and coastal processes, both natural and human-induced. Landsat enables us to better understand the scope, nature, and speed of change to the natural and built environment.
Businesses draw upon Landsat data to provide customer-specific applications to improve logistics, resource allocation, and investment decisions. Commercial space-imaging firms leverage Landsat data to refine product offerings and support new information services. A 2017 USGS study determined the total annual economic benefit of Landsat data in the United States to be $2.06 billion, far surpassing its development and operating costs (Straub and others, 2019).
Landsat 8 and Landsat 9 provide 8-day repeat coverage of the Earth’s land surfaces. The National Aeronautics and Space Administration (NASA) and the USGS are currently reviewing the findings from a joint Architecture Study Team, which will inform the design and implementation approach for Landsat Next, the follow-on mission to Landsat 9. Landsat 9 and its successors are planned to provide a sustainable, space-based system to extend the 50-year Landsat series of high-quality global land imaging measurements—the world’s longest time series of the Earth’s land surface.
The long-term availability of consistent and accurate Landsat data, combined with a no-cost data policy, allows users to analyze extensive geographic areas and better understand and manage long-term trends in land surface change. New cloud computing and data analytics technologies use Landsat data in a wide range of decision-support tools for Government and industry. Much like global positioning systems and weather data, Landsat data are used every day to help us better understand our dynamic planet.
References Cited
Kingfield, D.M., and De Beurs, K.M., 2017, Landsat identification of tornado damage by land cover and an evaluation of damage recovery in forests: Journal of Applied Meteorology and Climatology, v. 56, no. 4, p. 965–987, accessed March 25, 2022, at https://doi.org/10.1175/JAMC-D-16-0228.1.
Monitoring Trends in Burn Severity [MTBS], 2022, Project overview: Monitoring Trends in Burn Severity web page, accessed March 25, 2022, at https://www.mtbs.gov/project-overview.
Nelson, M.J., 1985, Landsat helps geologists discover oil: The Oklahoman, accessed March 25, 2022, at https://www.oklahoman.com/story/news/1985/10/20/landsat-helps-geologists-discover-oil-satellite-images-not-just-pretty-art/62748254007/.
Straub, C.L., Koontz, S.R., and Loomis, J.B., 2019, Economic valuation of Landsat imagery: U.S. Geological Survey Open-File Report 2019–1112, 13 p., accessed March 25, 2022, at https://doi.org/10.3133/ofr20191112.
U.S. Department of Agriculture [USDA], 2022, CropScape and Cropland Data Layers FAQs: USDA National Agricultural Statistics Service web page, accessed March 25, 2022, at https://www.nass.usda.gov/Research_and_Science/Cropland/sarsfaqs2.php#Section3_17.0.
For additional information on Landsat please contact:
Program Coordinator
USGS National Land Imaging Program
12201 Sunrise Valley Drive
Reston, VA 20192
703–648–5953
The Landsat series is a joint effort of USGS and NASA. NASA develops and launches the spacecraft; USGS manages satellite operations, ground reception, data archiving, product generation, and data distribution. Funding for the National Land Imaging Program’s Landsat operations and data management is provided through the USGS.
Suggested Citation
U.S. Geological Survey, 2022, Oklahoma and Landsat: U.S. Geological Survey Fact Sheet 2022–3032, 2 p., https://doi.org/10.3133/fs20223032.
ISSN: 2327-6932 (online)
ISSN: 2327-6916 (print)
Study Area
| Publication type | Report |
|---|---|
| Publication Subtype | USGS Numbered Series |
| Title | Oklahoma and Landsat |
| Series title | Fact Sheet |
| Series number | 2022-3032 |
| DOI | 10.3133/fs20223032 |
| Year Published | 2022 |
| Language | English |
| Publisher | U.S. Geological Survey |
| Publisher location | Reston, VA |
| Contributing office(s) | Earth Resources Observation and Science (EROS) Center |
| Description | 2 p. |
| Country | United States |
| State | Oklahoma |
| Online Only (Y/N) | N |
| Google Analytic Metrics | Metrics page |