

Hydrologic Conditions in Kansas, Water Year 2021
Links
- Document: Report (4.09 MB pdf) , HTML , XML
- Download citation as: RIS | Dublin Core
Abstract
The U.S. Geological Survey (USGS) maintains a network of hydrologic monitoring stations across Kansas in cooperation with Federal, State, Tribal, and local agencies. During water year (WY) 2021, this network included 230 real-time surface water data collection sites, referred to as “streamgages.” A WY is the 12-month period from October 1 through September 30 and is designated by the calendar year in which it ends. These real-time data are routinely collected and calibrated by USGS personnel via regular measurements of streamflow and water levels. Analyses of these data provide an understanding of hydrologic conditions in the State critical to the management of water resources, industrial and agricultural uses, protection of life and property during flooding, operation of reservoirs, recreation, and other activities.
Streamflow Conditions and Drainage Basin Runoff
Hydrologic conditions in Kansas for WY 2021 varied substantially across space and time. The year began with normal (25th–75th percentile class) streamflow over much of the State (based on the historical record of streamgages with more than 30 years of data); basins primarily in southern Kansas experienced less than normal (10th–24th percentile class) or low (lowest ever observed for the given time frame) flows, and a part of the Smoky Hill-Saline Basin experienced greater than normal (76th–90th percentile class) flow (fig. 1; U.S. Geological Survey, 2022b). Through February, less than normal to much less than normal (less than 10th percentile class) flows persisted in the northwestern and southwestern parts of the State, and the less than normal areas in east-central Kansas returned to normal flow by January. Late winter and spring precipitation events brought normal to high (highest observed for a given time frame) flows for most of the central and eastern parts of the State, which either persisted or returned to normal over the rest of the water year (fig. 2; National Weather Service, 2022). As summer progressed, flows in the southwestern and northwestern parts of the State decreased to be less or much less than normal, part of the Cimarron Basin dropped into low flow, and some central Kansas basins dropped to the less than normal percentile class. In the last quarter of WY 2021, flows increased in the western part of the State and primarily were within the less than normal and normal categories, whereas the eastern part of the State was mostly in the normal range but included areas ranging from less than normal to much greater than normal.
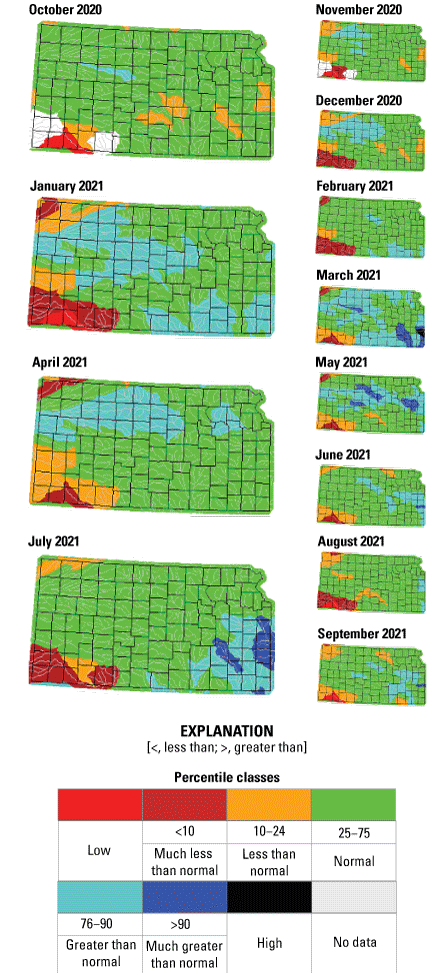
Comparison of monthly streamflow conditions across Kansas throughout water year 2021 (U.S. Geological Survey, 2022b). Clockwise from top left, October with subset November and December, 2020; January with subset February and March, 2021; April with subset May and June, 2021; and July with subset August and September, 2021.
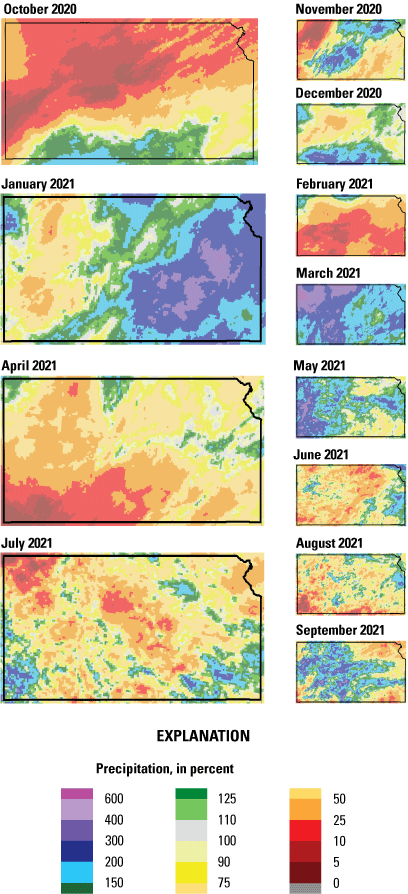
Statewide percentage of normal precipitation in Kansas throughout water year 2021 (National Weather Service, 2022). Clockwise from top left, October with subset November and December, 2020; January with subset February and March, 2021; April with subset May and June, 2021; and July with subset August and September, 2021.
Runoff, or streamflow per unit area, can be used to characterize precipitation and streamflow across a given drainage basin. Monthly runoff in Kansas was in the normal percentile class for much of WY 2021 (fig. 3A), with the exceptions of January, March, and July, which fell into the greater than normal percentile class. The 7-day average runoff graph (fig. 3B) shows seven instances of average runoff increasing to the greater than normal or much greater than normal percentile classes, and a peak in March was greater than the 95th percentile. The cumulative 7-day average hydrograph for WY 2021 (based on data from WYs 1901 to 2021) was within the 25th–75th percentiles throughout the WY (fig. 4). Overall, WY 2021 was in the 58th percentile and ranked 51st in computed runoff going back to WY 1901 (U.S. Geological Survey, 2022b). The annual runoff for Kansas, in millimeters, going back to WY 1946 is shown in figure 5.
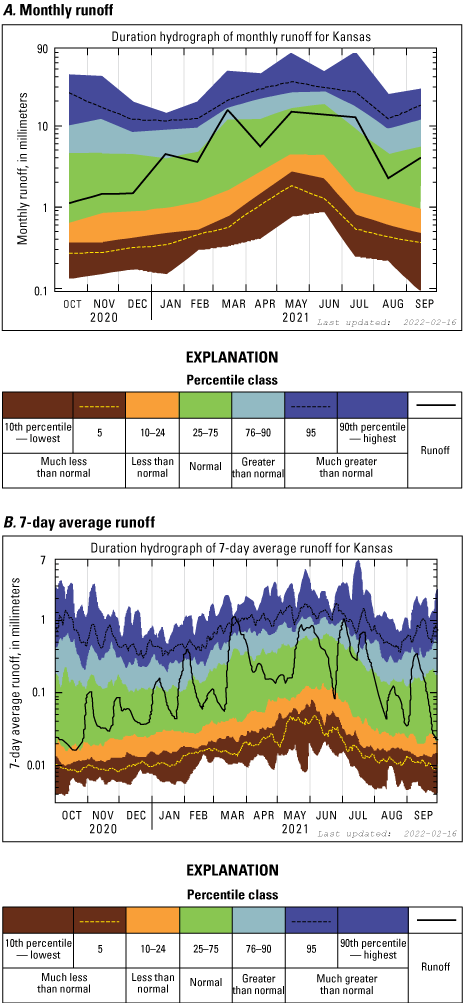
Statewide (A) monthly and (B) 7-day average runoff for Kansas during water year 2021 (U.S. Geological Survey, 2022b).
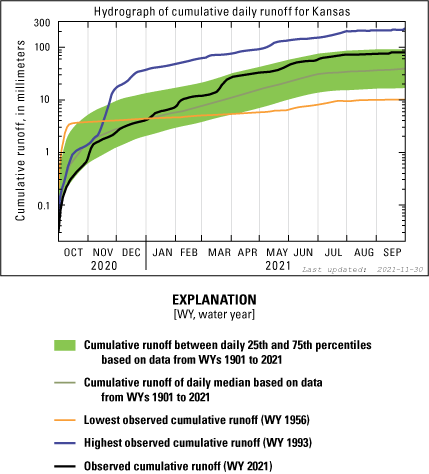
Statewide cumulative 7-day average runoff for Kansas during water year 2021 (U.S. Geological Survey, 2022b).
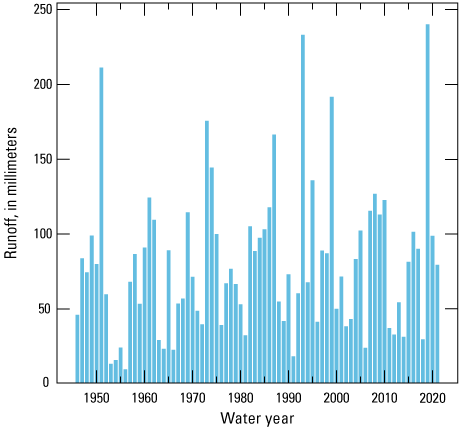
Annual runoff for Kansas, in millimeters, from water years 1946 to 2021 (U.S. Geological Survey, 2022b).
Statewide Precipitation and Drought Conditions
Annual precipitation for WY 2021 was typical in that it demonstrated a gradient increasing from west to east (figs. 6A–D; National Weather Service, 2022). Parts of western Kansas, along with an area in east-central Kansas, experienced higher than average rainfall, but much of the rest of the State experienced average to less than average rainfall amounts.
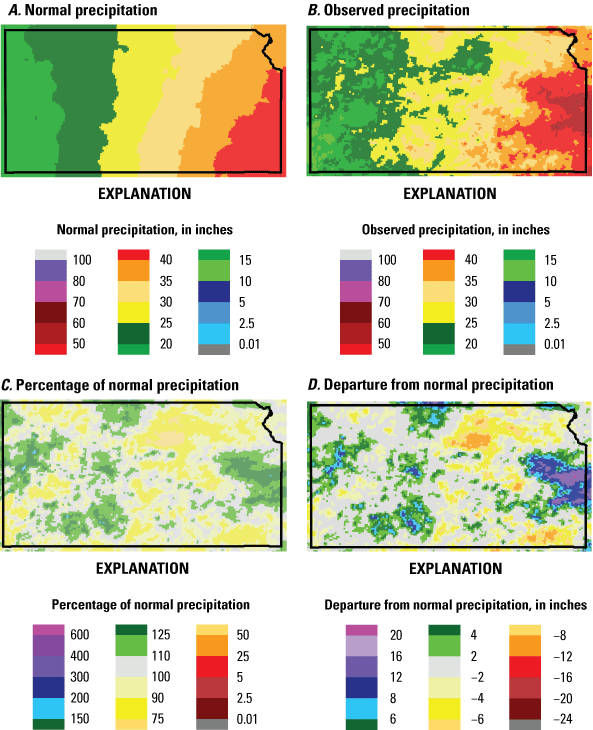
Statewide (A) normal precipitation, in inches, based on data from calendar years 1981 to 2010; (B) observed precipitation, in inches; (C) percentage of normal precipitation; and (D) departure from normal precipitation, in inches, for water year 2021 (National Weather Service, 2022).
In early October, drought conditions were prevalent across the State, and about 80 percent of land area was categorized as abnormally dry; the remaining land area was categorized as experiencing moderate, severe, or extreme drought conditions (fig. 7; National Drought Mitigation Center, 2022). By the end of October, dry conditions began to intensify in the northwestern part of the State (fig. 8; National Drought Mitigation Center, 2022). National Drought Mitigation Center data in figures 7 and 8 indicate dry conditions subsided in the far southern reaches of the State around early November. These data also indicate dry conditions in the western reaches persisted through the end of April. In May and June, much of the State did not fall into any drought category, except for two clusters in north-central and south-central Kansas, which were categorized as abnormally dry (fig. 8). After June, dry conditions returned and were somewhat localized to the northwestern corner and central corridor. About 50 percent of Kansas was under some level of the drought monitor categories by the end of WY 2021 (fig. 7).
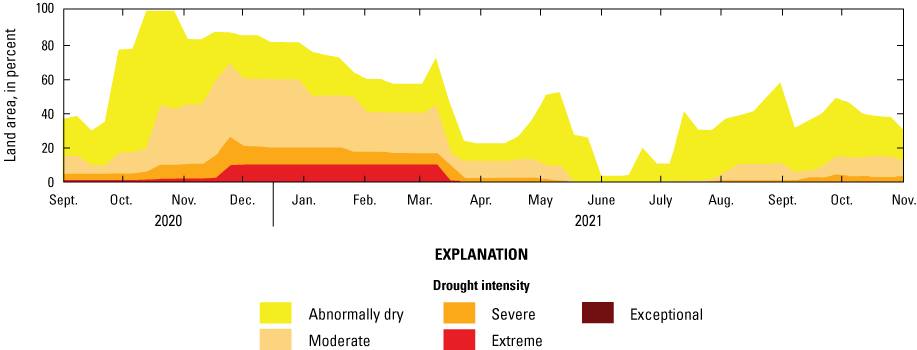
Statewide land area in U.S. drought monitor categories, in percent (National Drought Mitigation Center, 2022).
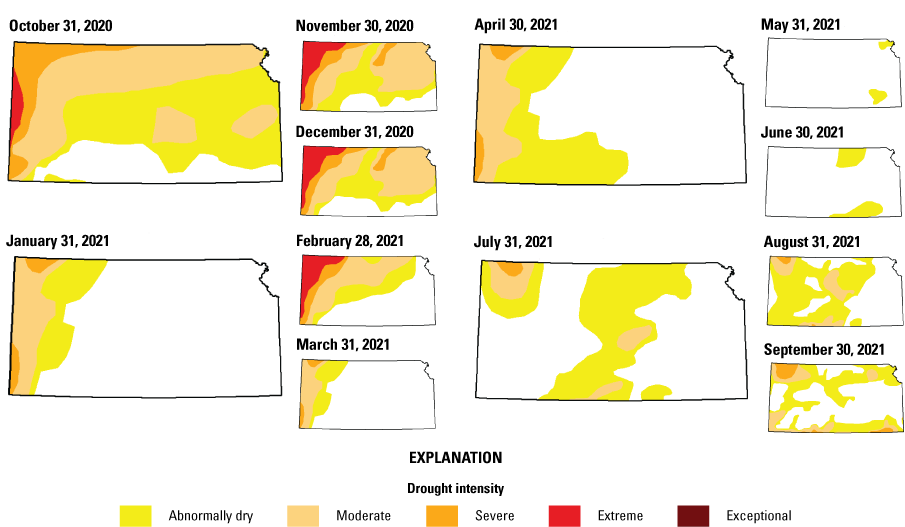
Comparison of drought conditions in Kansas during water year 2021 (National Drought Mitigation Center, 2022). Clockwise from top left, October 31 with subset November 30 and December 31, 2020; January 31 with subset February 28 and March 31, 2021; April 30 with subset May 31 and June 30, 2021; and July 31 with subset August 31 and September 30, 2021.
Reservoirs
The USGS monitors real-time water levels and storage for 12 reservoirs in Kansas. At the beginning of WY 2021, five of these reservoirs, Milford Lake (06857050), Tuttle Creek Lake (06886900), Perry Lake (06890898), Clinton Lake (06891478), and Hillsdale Lake (06914995) had 100 percent of their conservation-pool capacity filled when comparing daily mean storage values with reservoir capacity tables (fig. 9; U.S. Geological Survey, 2022a). Of the seven reservoirs below full conservation-pool capacity, Cedar Bluff Reservoir (06861500), at 63 percent of conservation-pool capacity, had the smallest percentage of conservation-pool capacity filled. By the end of WY 2021, nine reservoirs were filled to their conservation-pool capacities; those with less than 100 percent storage in the conservation pool included Cedar Bluff Reservoir (06861500) at 59 percent, HorseThief Reservoir (07140885) at 95 percent, and Cheney Reservoir (07144790) at 90 percent. Five reservoirs exceeded 150 percent of conservation-pool capacity at some point in WY 2021 including Kanopolis Lake (06865000), Tuttle Creek Lake (06886900), Clinton Lake (06891478), Melvern Lake (06910997), and Pomona Lake (06912490). Pomona Lake demonstrated the greatest storage in relation to conservation-pool capacity during WY 2021 with a peak daily mean storage of 289 percent of the conservation pool.
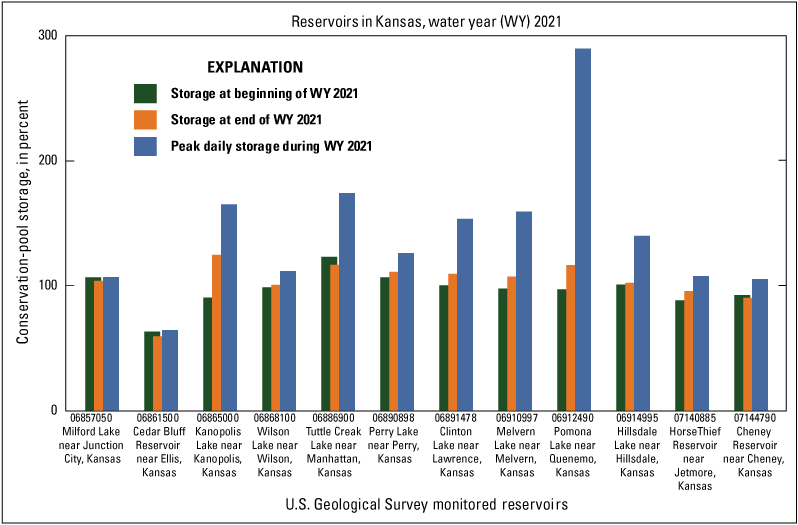
Conservation-pool storage, in percent, in reservoirs monitored by the U.S. Geological Survey as daily mean values at the beginning and end of water year 2021 and the peak daily value during that time frame (U.S. Geological Survey, 2022a).
Summary
Hydrologic conditions in Kansas during water year 2021 were generally normal, although seasonal variation in precipitation and runoff was observed in different parts of the State. Drought conditions were most severe in western Kansas from October to December, whereas precipitation and flows were highest in east-central Kansas from March to July. Despite spatial and temporal variability in precipitation and runoff, hydrologic conditions were sufficient to maintain reservoir conservation-pool storage in most reservoirs across the State.
References Cited
National Drought Mitigation Center, 2022, U.S. Drought Monitor—Kansas: National Drought Mitigation Center web page, accessed February 16, 2022, at https://droughtmonitor.unl.edu/.
National Weather Service, 2022, Advanced Hydrologic Prediction Service: National Weather Service digital data, accessed January 27, 2022, at https://water.weather.gov/precip/.
U.S. Geological Survey, 2022a, USGS water data for the Nation: U.S. Geological Survey National Water Information System database, accessed March 16, 2022, at https://doi.org/10.5066/F7P55KJN.
U.S. Geological Survey, 2022b, WaterWatch: U.S. Geological Survey digital data, accessed January 27, 2022, at https://waterwatch.usgs.gov/.
For more information about this publication, contact:
Director, USGS Kansas Water Science Center
1217 Biltmore Drive
Lawrence, KS 66049
785–842–9909
For additional information, visit: https://www.usgs.gov/centers/kswsc
Publishing support provided by the Rolla Publishing Service Center
Suggested Citation
Puls, K.A., 2022, Hydrologic conditions in Kansas, water year 2021: U.S. Geological Survey Fact Sheet 2022–3071, 6 p., https://doi.org/10.3133/fs20223071.
ISSN: 2327-6932 (online)
ISSN: 2327-6916 (print)
Study Area
| Publication type | Report |
|---|---|
| Publication Subtype | USGS Numbered Series |
| Title | Hydrologic conditions in Kansas, water year 2021 |
| Series title | Fact Sheet |
| Series number | 2022-3071 |
| DOI | 10.3133/fs20223071 |
| Year Published | 2022 |
| Language | English |
| Publisher | U.S. Geological Survey |
| Publisher location | Reston, VA |
| Contributing office(s) | Kansas Water Science Center |
| Description | 6 p. |
| Country | United States |
| State | Kansas |
| Online Only (Y/N) | N |
| Google Analytic Metrics | Metrics page |