

Rangeland Condition Monitoring Assessment and Projection, 1985–2021
Links
- Document: Report (2.14 MB pdf) , HTML , XML
- Download citation as: RIS | Dublin Core
Description
In collaboration with the Bureau of Land Management (BLM), the U.S. Geological Survey has produced annual maps of fractional (that is, percentage) component cover for 1985–2021 (37 years) as part of the Rangeland Condition Monitoring Assessment and Projection (RCMAP) project (Shi and others, 2022). Components mapped include annual herbaceous, perennial herbaceous, total herbaceous, sagebrush, nonsagebrush shrub, total shrub, litter, bare ground, and tree canopy cover. RCMAP 1985-2021 time series data (Rigge and others, 2022) can be downloaded from the Multi-Resolution Land Characteristics Consortium website at https://www.mrlc.gov/data.
Intended Use
Land managers and scientists can use annual fractional cover maps to monitor changes to vegetation composition, evaluate past management practices, target future improvements, determine locations of critical wildlife habitat, assess effects of climate change and interannual variation, and appraise landscape health and fragmentation.
Training Data
Training data are obtained from various sources, including field observations and field data upscaled using remotely sensed imagery and machine learning (table 1 and fig. 1).
Table 1.
Training data for Rangeland Condition Monitoring Assessment and Projection fractional component time series.[n, number of observations; RCMAP, Rangeland Condition Monitoring Assessment and Projection; m, meter; ~, about; km, kilometer; BLM, Bureau of Land Management; USGS, U.S. Geological Survey; NPS, National Park Service]
| Source | n | Notes | Spatial extent | Temporal extent |
|---|---|---|---|---|
| RCMAP high-resolution sites degraded to 30 m | 56,426,952 | Data for each high-resolution site are predicted from 60 to 120 ocular observations, collected at the 2-m imagery resolution (see Rigge and others, 2020) | 331 sites of ~15 x ~15 km | 2006–17 |
| RCMAP Landsat-scale plots | 8,691 | Field observations located between high-resolution sites | Average of 2 transects of 30 m or ocular estimation | 2013–21 |
| BLM Analysis Inventory and Monitoring | 28,971 | Herrick and others, 2017 | Average of 3 transects of 50 m | 2011–21 |
| BLM Landscape Monitoring Framework | 16,674 | Herrick and others, 2017 | Average of 3 transects of 50 m | 2004–19 |
| LANDFIRE public database | 183,861 | Curated from several sources: Forest Service vegetation and fuel plot data, USGS National Gap Analysis Program, NPS Inventory and Monitoring, State inventory data (see LANDFIRE, 2022) | Various methods | 1985–2015 |
| Total | 56,665,149 | 1985–2021 |
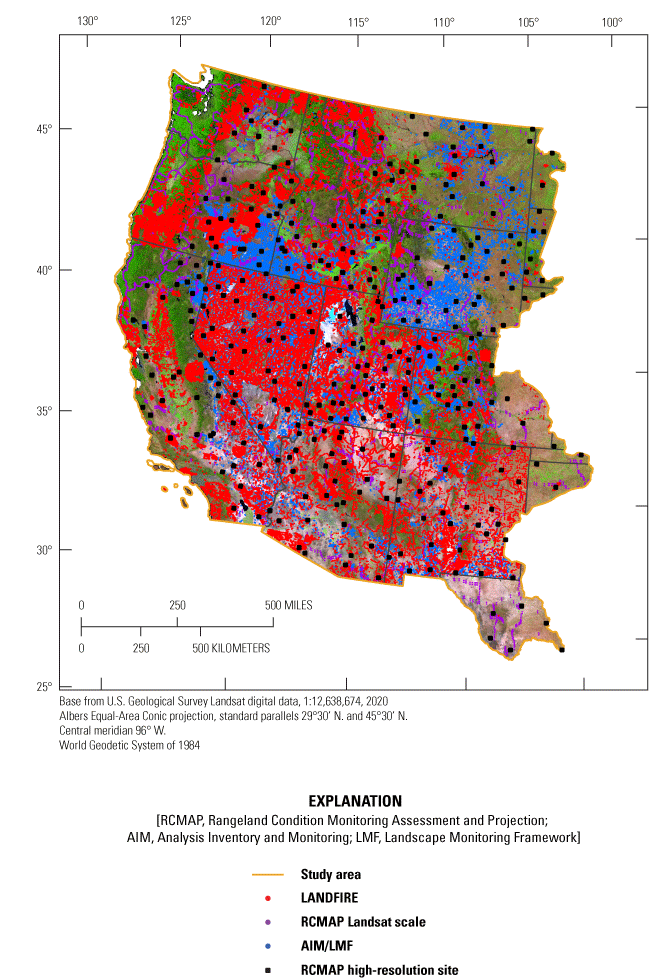
Rangeland Condition Monitoring Assessment and Projection training data distribution.
Independent Data
Training data relations to independent data are the basis of the model development, and the relations (and independent data) thus directly drive mapping of fractional components.
-
Topographic data include slope, aspect, position index, and elevation.
-
Landsat imagery includes two median pixel composites for each year: leaf on, to represent peak vegetation growth, and leaf off, senesced (that is, brown) conditions (see table 2 for dates) by mapping region (fig. 2). The composites are further cleaned by identifying pixels with fewer than three clear observations, which tend to have inconsistent dates or have cloud/shadow/snow contamination, and by considering the relevant synthetic dates (see C) in the median value calculation of these locations.
-
Continuous Change Detection and Classification (CCDC) synthetic imagery were used to enhance the phenologic detail of imagery, improving discrimination among components. We included 6 months of CCDC synthetic images per year, created from Landsat imagery, using models fit to the historical observations for each pixel (see Zhu and others, 2015). Synthetic images are targeted to preferentially capture the early growing season (see table 2 for dates).
-
Landsat imagery indices include the normalized difference water index, built-up index, soil adjusted vegetation index, and tassel cap indices: greenness, wetness, and brightness. Each index was produced for leaf-on and leaf-off median composites for each year. Indices are designed to reduce the feature space of Landsat imagery to better capture biophysically relevant patterns and complement the imagery itself.
Table 2.
Imagery composite dates by mapping region.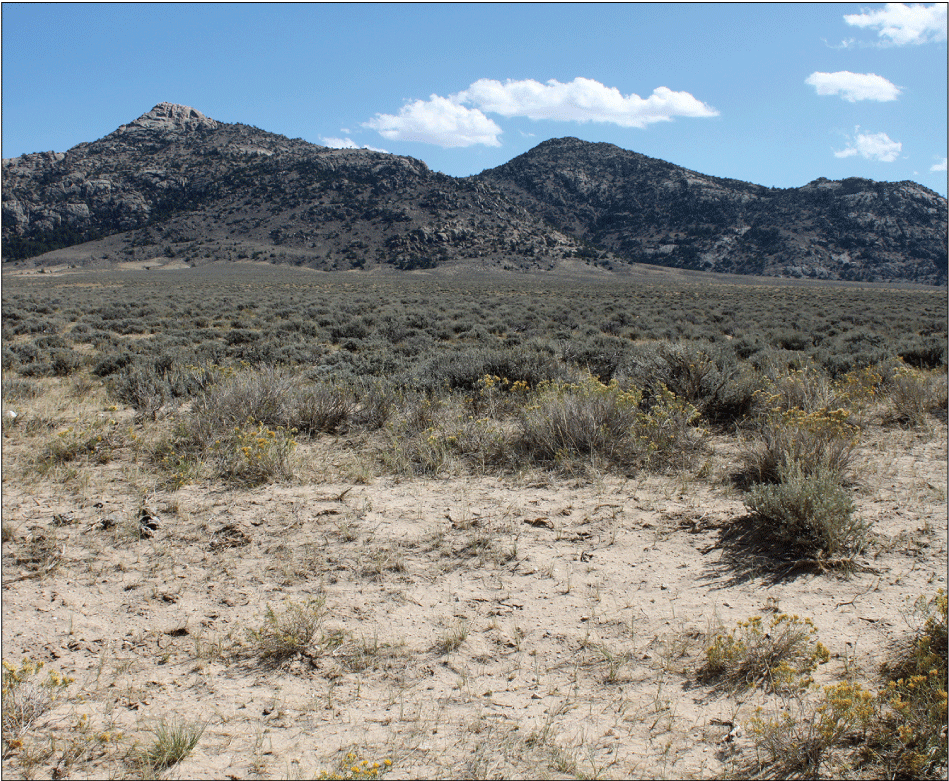
Healthy sagebrush (Artemisia tridentata) steppe near Granite Mountain, central Wyoming. Photograph by Hua Shi, U.S. Geological Survey.

Rangeland Condition Monitoring Assessment and Projection mapping regions.
Model and Postprocessing
We used neural network models to predict fractional component cover; the models, which are 4 layers deep, are 128 neurons wide, and have a 20-percent dropout rate between each layer, were optimized with KerasTuner. For each mapping region, we developed a single neural network model to predict all components. We compared our neural network results with the previous versions of RCMAP (Rigge and others, 2021a, b) that used Cubist (regression tree model): finding all else equal, error rates were reduced by 5–7 percent.
We want our products to represent a combination of empirical data and logic-based rules; therefore, we used postprocessing models to limit noise and accurately capture postfire component cover values. Postprocessing has been improved with updated fire recovery equations stratified by ecosystem resistance and resilience classes (Maestas and others, 2016).
Validation Results
Maps are rigorously validated using field data not included as training (that is, independent validation) and by assessing model fit to training data. Our independent field data consist of (1) 1,880 points, each specifically designed to represent a single Landsat pixel, collected from 2013 to 2020 and (2) long-term monitoring data in southwestern Wyoming at 126 plots observed 12 times between 2008 and 2021 (number of observations [n]=1,137). Validation was assessed using the coefficient of determination (R2), in this case, the proportion of the spatial/temporal variation in independent field data that is explained by the component cover maps; that is, the precision. The root mean square error (RMSE) indicates the expected difference between the field and mapped data; that is, the accuracy.
Correlations between RCMAP and independent validation sites were again robust across all components; the R2 value was 0.75 for bare ground (RMSE=13.5 percent) and 0.40 for shrub cover (RMSE=10.3 percent) (table 3) and the average R2 value was 0.53 and the average RMSE was 10.4 across components. We compared RCMAP data to BLM Analysis Inventory and Monitoring (AIM) and Landscape Monitoring Framework data (n=45,132) collected between 2004 and 2021 (table 3). Correlations between RCMAP and AIM/Landscape Monitoring Framework data were again robust across all components, and the R2 value was 0.60 for bare ground, 0.66 for tree, and 0.35 for shrub cover; the average R2 value was 0.38 and the average RMSE was 14.3 across components.
Table 3.
Summary of independent validation at independent and Bureau of Land Management Analysis Inventory and Monitoring/Landscape Monitoring Framework sites and cross-validation high-resolution training sites.[R2, coefficient of determination; n/a, not applicable; AIM/LMF, Analysis Inventory and Monitoring/Landscape Monitoring Framework; RMSE, root mean square error]
At the long-term monitoring sites in southwestern Wyoming, the spatial-temporal correlation (n=1,137) indicated robust correlations for all components, and the R2 value was 0.62 for bare ground (RMSE=11.7 percent) and 0.47 for shrub cover (RMSE=8.0 percent); the average R2 value was 0.42 and the average RMSE was 8.93 across components.
Finally, we completed a cross validation of predictions against training data at high-resolution training sites using a random sample of 100,000 points (table 3). Cross-validation correlations included an R2 value of 0.89 for bare ground (RMSE=9.7 percent) and 0.66 for shrub cover (RMSE=8.3 percent) and an average R2 value of 0.76 and average RMSE of 7.3 across components.
It is important to consider that all accuracy assessments described previously are designed to evaluate single-pixel level correspondence. Because of fine-scale landscape heterogeneity, this is the most rigorous approach, and most applications looking at broader spatial scales or averages across management units would tend to lower the error relative to this analysis.
Caveats
CCDC synthetic data rely on harmonic models to fit the temporal profile of all available clear Landsat data. The algorithm can predict Landsat surface reflectance for any dates. The quality of the model is dependent on the number of clear observations, and increased likelihood of simple models is near the end of the time series (Zhu and others, 2015). The method creates the potential for a temporal lag in phenomena to manifest in the synthetic imagery. We do not consider synthetic images to be exact proxies of additional “real” Landsat observations; rather, the images include the data to represent the inter- and intra-annual phenological patterns, which are strongly related to component cover.
The nature of our modeling approach tends to result in bias toward underestimating change between periods rather than overestimating change. Most training data were derived from high-resolution predictions (table 1) of component cover, which greatly increase the number and spatial extent of training data; however, because these are modeled products, they do contain error (table 4). Assessments of component predictions at the high-resolution scale demonstrate average correlation by component ranging from 0.90 to 0.97 and absolute error of 1.81 to 4.65 percent. High-resolution training for tree cover was derived using a convolutional neural network classification of imagery, not cubist as the other components. Error also exists in the other sources of training data (for example, BLM AIM).
Table 4.
Test accuracy, correlation coefficient (r), and absolute error of high-resolution (2-meter) scale predictions of component cover.RCMAP products are designed to reflect the ground conditions under the peak of the growing season (that is, greenest conditions); however, because of image availability and timing of training observations, these conditions may not always be reflected. Users are encouraged to evaluate differences between the largest possible units acceptable to their analysis (for example, compare the population of pixels between two pastures instead of comparing two pixels) to minimize the effect of error.
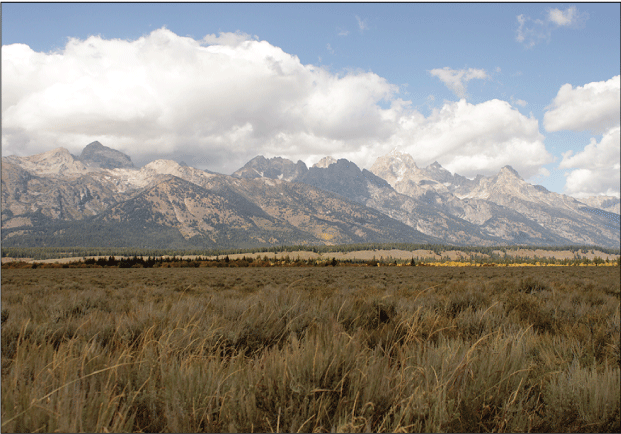
Sagebrush flat in Grand Teton National Park, Wyoming. Photograph by Hua Shi, U.S. Geological Survey.
References Cited
Herrick, J.E., Van Zee, J.W., McCord, S.E., Courtright, E.M., Karl, J.W., and Burkett, L.M., 2017, Monitoring manual for grassland, shrubland, and savanna ecosystems (2d ed.)—Volume I—Core methods: Las Cruces, N.M., U.S. Department of Agriculture Agricultural Research Service Jornada Experimental Range, 77 p. [Also available at https://jornada.nmsu.edu/files/Core_Methods.pdf.]
LANDFIRE, 2022, Download LANDFIRE 2016 Remap (LF 2.0.0) LFRDB: U.S. Department of the Interior, U.S. Geological Survey, and U.S. Department of Agriculture database, accessed December 3, 2021, at https://landfire.gov/lfrdb_data.php.
Maestas, J.D., Campbell, S.B., Chambers, J.C., Pellant, M., and Miller, R.F., 2016, Tapping soil survey information for rapid assessment of sagebrush ecosystem resilience and resistance: Rangelands, v. 38, no. 3, p. 120–128. [Also available at https://doi.org/10.1016/j.rala.2016.02.002.]
Rigge, M., Bunde, B., Shi, H., and Postma, K., 2021a, Rangeland Condition Monitoring Assessment and Projection (RCMAP) fractional component time-series across the western U.S. 1985–2020: U.S. Geological Survey data release, accessed January 5, 2022, at https://doi.org/10.5066/P95IQ4BT.
Rigge, M., Homer, C., Cleeves, L., Meyer, D., Bunde, B., Shi, H., Xian, G., Schell, S., and Bobo, M., 2020, Quantifying western U.S. rangelands as fractional components with multi-resolution remote sensing and in situ data: Remote Sensing, v. 12, no. 3, art. 412, 26 p. [Also available at https://doi.org/10.3390/rs12030412.]
Rigge, M.B., Bunde, B., Postma, K., and Shi, H., 2022, Rangeland Condition Monitoring Assessment and Projection (RCMAP) fractional component time-series across the western U.S. 1985–2021: U.S. Geological Survey data release, accessed December 10, 2022, at https://doi.org/10.5066/P9ODAZHC.
Rigge, M., Homer, C., Shi, H., Meyer, D., Bunde, B., Granneman, B., Postma, K., Danielson, P., Case, A., and Xian, G., 2021b, Rangeland fractional components across the western United States from 1985 to 2018: Remote Sensing, v. 13, no. 4, art. 813, 24 p. [Also available at https://doi.org/10.3390/rs13040813.]
Shi, H., Rigge, M., Postma, K., and Bunde, B., 2022, Trends analysis of Rangeland Condition Monitoring Assessment and Projection (RCMAP) fractional component time series (1985–2020): GIScience & Remote Sensing, v. 59, no. 1, p. 1243–1265. [Also available at https://doi.org/10.1080/15481603.2022.2104786.]
Zhu, Z., Woodcock, C.E., Holden, C., and Yang, Z., 2015, Generating synthetic Landsat images based on all available Landsat data—Predicting Landsat surface reflectance at any given time: Remote Sensing of Environment, v. 162, p. 67–83. [Also available at https://doi.org/10.1016/j.rse.2015.02.009.]
For more information, please contact:
Customer Services
USGS Earth Resources Observation and Science Center
47914 252nd Street
Sioux Falls, SD 57198
605–594–6151
For additional information, visit https://www.mrlc.gov/ or https://www.mrlc.gov/rangeland-viewer/
Publishing support provided by the
Rolla Publishing Service Center
Suggested Citation
Rigge, M.B., 2023, Rangeland Condition Monitoring Assessment and Projection, 1985–2021: U.S. Geological Survey Fact Sheet 2023–3004, 6 p., https://doi.org/10.3133/fs20233004.
ISSN: 2327-6932 (online)
Study Area
| Publication type | Report |
|---|---|
| Publication Subtype | USGS Numbered Series |
| Title | Rangeland Condition Monitoring Assessment and Projection, 1985–2021 |
| Series title | Fact Sheet |
| Series number | 2023-3004 |
| DOI | 10.3133/fs20233004 |
| Year Published | 2023 |
| Language | English |
| Publisher | U.S. Geological Survey |
| Publisher location | Reston, Va. |
| Description | 6 p. |
| Country | United States |
| Other Geospatial | western United States |
| Online Only (Y/N) | Y |
| Google Analytic Metrics | Metrics page |