

Focus Areas for Data Acquisition for Potential Domestic Resources of 13 Critical Minerals in the Conterminous United States and Puerto Rico—Antimony, Barite, Beryllium, Chromium, Fluorspar, Hafnium, Helium, Magnesium, Manganese, Potash, Uranium, Vanadium, and Zirconium
Links
- Document: Report (14.8 MB pdf) , HTML , XML
- Chapters:
- Open-File Report 2019-1023-A - Focus Areas for Data Acquisition for Potential Domestic Sources of Critical Minerals—Rare Earth Elements
- Open-File Report 2019-1023-B - Focus Areas for Data Acquisition for Potential Domestic Resources of 11 Critical Minerals in the Conterminous United States, Hawaii, and Puerto Rico—Aluminum, Cobalt, Graphite, Lithium, Niobium, Platinum-Group Elements, Rare Earth Elements, Tantalum, Tin, Titanium, and Tungsten
- Open-File Report 2019-1023-C - Focus Areas for Data Acquisition for Potential Domestic Resources of 11 Critical Minerals in Alaska—Aluminum, Cobalt, Graphite, Lithium, Niobium, Platinum Group Elements, Rare Earth Elements, Tantalum, Tin, Titanium, and Tungsten
- Open-File Report 2019-1023-E - Alaska Focus Area Definition for Data Acquisition for Potential Domestic Sources of Critical Minerals in Alaska for Antimony, Barite, Beryllium, Chromium, Fluorspar, Hafnium, Magnesium, Manganese, Uranium, Vanadium, and Zirconium
- Related Works:
- USGS data release - GIS and data tables for focus areas for potential domestic nonfuel sources of rare earth elements
- USGS data release - GIS for focus areas of potential domestic resources of 11 critical minerals—aluminum, cobalt, graphite, lithium, niobium, platinum group elements, rare earth elements, tantalum, tin, titanium, and tungsten (version 2.0, August 2020)
- Data Releases:
- USGS data release - GIS, supplemental data table, and references for focus areas of potential domestic resources of 13 critical minerals in the United States and Puerto Rico—antimony, barite, beryllium, chromium, fluorspar, hafnium, helium, magnesium, manganese, potash, uranium, vanadium, and zirconium
- USGS data release
- USGS data release
- Download citation as: RIS | Dublin Core
Acknowledgments
These studies were conducted under a partnership between the U.S. Geological Survey (USGS) and State geological surveys to obtain information on potential domestic resources of the critical minerals considered for phase 3 of the Earth Mapping Resources Initiative (Earth MRI). Many USGS scientists participated in developing the approach adopted for this study and provided information on focus areas for the data release that accompanies this report.
Members of the Earth Mapping Resources Initiative (Earth MRI) Technical Working Group for project planning included USGS colleagues primarily funded by the National Cooperative Geologic Mapping Program—Gregory J. Walsh, Arthur Merschat, Christopher Swezey, David Soller, and Drew Siler—and representatives from State geological surveys—William L. Lassetter, Virginia Division of Geology and Mineral Resources; Guy Means, Florida Geological Survey; Fred Denny, Illinois State Geological Survey; Ranie M. Lynds, Wyoming State Geological Survey; Melanie B. Werdon, Alaska Division of Geological and Geophysical Surveys; and Erica Key, California Geological Survey.
Many representatives from State geological surveys and the USGS participated in workshops, provided data, and identified priority areas for new data acquisition. All workshop participants are listed below.
We also thank USGS colleagues Ryan Taylor and Brad Van Gosen for their constructive reviews of this report.
Acknowledgements Table
Workshop Participants
Chemical Symbols
Ag
silver
Al
aluminum
Au
gold
Ba
barium
Be
beryllium
C
carbon
Ca
calcium
Co
cobalt
Cr
chromium
Cs
cesium
Cu
copper
Fe
iron
Ga
gallium
Ge
germanium
H
hydrogen
Hf
hafnium
In
indium
K
potassium
Li
lithium
Mn
manganese
Mo
molybdenum
Na
sodium
Nb
niobium
Ni
nickel
O
oxygen
Pb
lead
Re
rhenium
S
sulfur
Sb
antimony
Si
silicon
Sn
tin
Ta
tantalum
Te
tellurium
Ti
titanium
U
uranium
V
vanadium
W
tungsten
Y
yttrium
Zn
zinc
Zr
zirconium
Abstract
The Earth Mapping Resources Initiative (Earth MRI) is conducted in phases to identify areas for acquiring new geologic framework data to identify potential domestic resources of the 35 mineral materials designated as critical minerals for the United States. This report describes the data sources and summary results for 13 critical minerals evaluated in the conterminous United States and Puerto Rico during phase 3 of the study (antimony, barite, beryllium, chromium, fluorspar, hafnium, helium, magnesium, manganese, potash, uranium, vanadium, and zirconium). Phases 1 and 2 of the Earth MRI addressed aluminum, cobalt, graphite, lithium, niobium, platinum-group elements (PGEs), rare earth elements (REEs), tantalum, tin, titanium, and tungsten. Critical minerals in Alaska are covered in a separate report. No focus areas for phase 3 critical minerals are delineated for Hawaii.
The geologic, geochemical, topographic, and geophysical mapping provided by the Earth MRI documents geologic features that reflect the extent of individual mineral systems and provides information about critical mineral deposits that may not have been previously considered. The mineral-systems approach links critical mineral commodities to deposit types that represent the manifestations of large mineral systems.
Each of the 13 critical mineral commodities for phase 3 of the Earth MRI is discussed in terms of its importance to the Nation’s economy, modes of occurrence, mineral systems, and deposit types, and is accompanied by maps and tables listing examples of focus areas in the conterminous United States and Puerto Rico. Examples of important mineral systems for this group of 13 critical minerals include basin brine path systems for barite and fluorspar, Carlin-type systems and Coeur d’Alene systems for antimony, chemical weathering and volcanogenic seafloor systems for manganese, Climax-type systems for beryllium, mafic magmatic systems for chromium, marine evaporite systems for potash and magnesium, meteoric recharge systems for uranium, petroleum systems for helium, and placer systems for zirconium and hafnium.
Preface
Pursuant to Presidential Executive Order (EO) 13817 of December 20, 2017, “A Federal Strategy to Ensure Secure and Reliable Supplies of Critical Minerals” (82 FR 60835–60837), the Secretary of the Interior directed the U.S. Geological Survey (USGS), in coordination with other Federal agencies, to draft a list of critical minerals. The USGS developed a draft list of 35 critical minerals using a quantitative screening tool (S.M. Fortier and others, 2018, USGS Open-File Report 2018–1021, https://doi.org/10.3133/ofr20181021). The draft list of 35 minerals or mineral material groups deemed critical was finalized in May 2018 (83 FR 23295–23296), although the designation of “critical” will be reviewed at least every 3 years in accordance with the Energy Act of 2020 (Public Law 116–260, 134 Stat. 2565). A “critical mineral” is defined by EO 13817, section 2, as follows:
Definition. (a) A “critical mineral” is a mineral identified by the Secretary of the Interior pursuant to subsection (b) of this section to be (i) a non-fuel mineral or mineral material essential to the economic and national security of the United States, (ii) the supply chain of which is vulnerable to disruption, and (iii) that serves an essential function in the manufacturing of a product, the absence of which would have significant consequences for our economy or our national security.
Disruptions in supply chains may arise for any number of reasons, including natural disasters, labor strife, trade disputes, resource nationalism, and conflict.
EO 13817 noted that “despite the presence of significant deposits of some of these minerals across the United States, our miners and producers are currently limited by a lack of comprehensive, machine-readable data concerning topographical, geological, and geophysical surveys.”
In response to the need for information on potential domestic sources of these critical minerals, the USGS launched the Earth Mapping Resources Initiative (Earth MRI). The Earth MRI is a partnership between the U.S. Geological Survey, other Federal agencies, State geological surveys, and the private sector, and it is designed to acquire the national geologic framework information essential for identifying areas with potential for hosting the Nation’s critical mineral resources. The goal of the Earth MRI is to improve the geological, geophysical, and topographic mapping of the United States and to procure new data to stimulate mineral exploration to secure the Nation’s supply of critical minerals.
Introduction
The Earth Mapping Resources Initiative (Earth MRI) was developed in 2019 as a collaborative effort with the Association of American State Geologists (AASG) to identify and prioritize areas for the acquisition of new geologic framework data for the United States (Day, 2019). This report describes the background and methods used to define broad areas within the conterminous United States and Puerto Rico as focus areas for future geoscience research on potential sources of 13 critical minerals. A companion report addresses this topic for Alaska (Kreiner and others, 2022). The first two phases of the Earth MRI addressed aluminum, cobalt, graphite (natural), lithium, niobium, platinum group elements (PGEs), rare earth elements (REEs), tantalum, tin, titanium, and tungsten (Hammarstrom and Dicken, 2019; Hammarstrom and others, 2020; Kreiner and Jones, 2020). The initial group of 11 critical minerals was selected because the United States is highly reliant on imports for each, and their use has increased beyond foreseeable domestic production (Fortier and others, 2018; U.S. Department of the Interior, Office of the Secretary, 2018). Factors other than net import reliance are considered in determining criticality. These factors include indirect trade reliance (country of origin is obscured), embedded trade reliance (commodity is contained in an imported product), and foreign ownership of mineral assets and processing facilities (Fortier and others, 2021).
The 13 critical minerals in phase 3 (table 1) include commodities that are not currently mined in the United States or are subject to supply chain vulnerabilities (Fortier and others, 2019). Antimony, chromium, and manganese are not currently mined in the United States. Potash and vanadium were mined in the United States in 2020, but annual consumption in 2020 is an order of magnitude greater than production (table 1). In 2020, zirconium and hafnium were produced from heavy-mineral sands. Some barite, fluorspar, and magnesium were produced in 2020, but mine production data are proprietary (table 1). Although the United States is the major world producer of beryllium, it is considered a critical mineral because the number of beryllium producers is limited, and substitute materials are inadequate for vital domestic applications (Lederer and others, 2016).
Similarly, the United States is a major producer of helium, a critical commodity used in health care by magnetic resonance imaging (MRI) instruments. Helium is a byproduct of natural gas (methane) production and, as a gas, poses storage issues. Global helium-supply disruptions, such as occurred in 2017, demonstrated that supply chain issues, inabilities to increase production, few sources, and an absence of storage facilities, along with other factors, warranted its designation as a critical mineral (Anderson, 2018).
Some imported critical mineral commodities are mainly produced as primary products; however, some imported and domestic critical mineral commodities, such as vanadium and hafnium, are byproducts or coproducts in mineral deposit types that are chiefly used to produce other primary commodities.
Table 1.
Salient data for phase 3 critical minerals.[Production and consumption data from U.S. Geological Survey (2021a); Notable application examples from Fortier and others (2019). W, withheld (data withheld to avoid disclosing company proprietary data); t, metric ton; m3, cubic meter; Mlb, million pounds. Uranium data from U.S. Energy Information Administration (EIA) (EIA, 2020a) and World Nuclear Association (2021). Magnesium consumption as MgO]
The areas with the potential for one or more critical minerals are referred to as “focus areas” in this report. Focus areas are designated as such based on existing data. Focus areas can include known deposits and areas with the potential for deposits based on the geologic characteristics of mineral deposits and the mineral systems that host the critical minerals considered. The methods used to define focus areas are described in Hammarstrom and others (2020). For the information and methods used to define focus areas in Alaska, consult Kreiner and Jones (2020).
This report has sections for each phase 3 critical mineral and information describing each critical mineral’s importance to the Nation’s economy, its modes of occurrence, and a discussion of applicable mineral systems. The most important mineral systems, deposit types, and examples of focus areas defined for each critical mineral are listed in a table along with a map showing the focus areas. Information on domestic production, use, and world resources is also included—taken directly from the USGS “Mineral Commodity Summaries 2021” (U.S. Geological Survey, 2021a)—to provide perspectives on the importance of each critical mineral to the Nation’s economy. A full report on domestic and global statistics for each of the other critical minerals discussed here, as well as additional publications, are available from the USGS National Minerals Information Center (https://www.usgs.gov/centers/national-minerals-information-center). Because uranium is not among the commodities that the USGS considers, other sources are cited for that information. Schulz and others (2017), and chapters therein, include detailed information on geology, resources and production, exploration, and environmental considerations for deposits that host some of the critical minerals discussed in this report (antimony, barite, beryllium, fluorspar, manganese, vanadium, zirconium, and hafnium).
A related USGS data release (Dicken and others, 2021) uses a geographic information system (GIS) to show the focus areas. The GIS allows focus areas to be plotted on maps by region, mineral system, deposit type, and critical mineral commodity. The data release includes tables that document the rationale for delineating each focus area along with other attributes and comprehensive references. Examples included in this summary report are derived from the data release, which contains complete focus-area information.
Users of this report should consider the following caveats, as described in Hammarstrom and others (2020): (1) focus areas provide a screening tool for initiating the identification of priority areas for new data acquisition, (2) many focus areas are very large, and their inclusion is meant to draw attention to regions of the country that may contain critical minerals, (3) the areas selected for new work are small relative to the size of the focus areas, (4) the discovery and development of new mineral deposits can take a decade or longer, and (5) the number of new data acquisition projects that can be initiated each year is dependent upon factors such as funding, land access, and the availability of personnel, time, and expertise.
The exploration and subsequent development of mineral resources in the United States is the role of private industry. Many factors influence the likelihood that critical minerals, if present, could ever be developed. These include land-use policies, regulations, world markets, and technology appropriate for the mining and processing of critical minerals.
Earth Mapping Resources Initiative Status and Products
Projects developed to acquire new geological, geophysical, geochemical, and lidar data in selected areas throughout the country were initiated in 2019 by the Earth MRI. Projects underway in 2021 include six high-resolution airborne magnetic and radiometric surveys designed to complement geologic mapping and mineral-resource research and optimize the coverage of important geologic features throughout the country (fig. 1). No projects are underway in Hawaii or Puerto Rico. The acquisition of new district- to regional-scale airborne magnetic and radiometric surveys was hampered by the COVID-19 pandemic in 2020, but data collection was rescheduled for 2021. The Earth MRI partnered with the USGS 3D Elevation Program (3DEP), the Department of Energy, the Natural Resources Conservation Service, and the Bureau of Land Management for airborne geophysical and 3DEP lidar surveys over parts of Nevada and California through the Geoscience Data Acquisition for Western Nevada (GeoDAWN) project (U.S. Geological Survey, 2020). The GeoDAWN effort can provide information that can be used to identify and characterize undiscovered geothermal and critical mineral resources, as well as groundwater potential, soil mapping for agriculture, and landslide and seismic geohazards.
The complete list of ongoing projects, as of 2021, is available on the Earth MRI Acquisitions viewer website (https://ngmdb.usgs.gov/emri/#3/40/-96). This website shows the locations of all projects, along with a description of the project and contacts for information. New data acquired through the Earth MRI are available on the Earth MRI website (https://www.usgs.gov/special-topics/earth-mri) through the navigation pane links “Data and Tools” and “Publications.” Geophysical and geochemical data are released as USGS data release projects in ScienceBase (https://www.sciencebase.gov/catalog/), a USGS Trusted Digital Repository.
The first geochemical data release was published in March 2021 (U.S. Geological Survey, 2021b). Subsequent geochemical data releases are updated periodically and offered through the Earth MRI web portal. Reports, GIS, and supporting data for focus areas for the 11 critical mineral commodities covered in phases 1 and 2 of the Earth MRI are also available through the navigation pane links “Data and Tools” and “Publications” (Dicken and others, 2019, 2021; Hammarstrom and Dicken, 2019; Dicken and Hammarstrom, 2020; Hammarstrom and others, 2020). Summaries of the Earth MRI activities are included in the annual review of USGS work on critical minerals published in the May issue of Mining Engineering (Fortier and others, 2019, 2020, 2021).
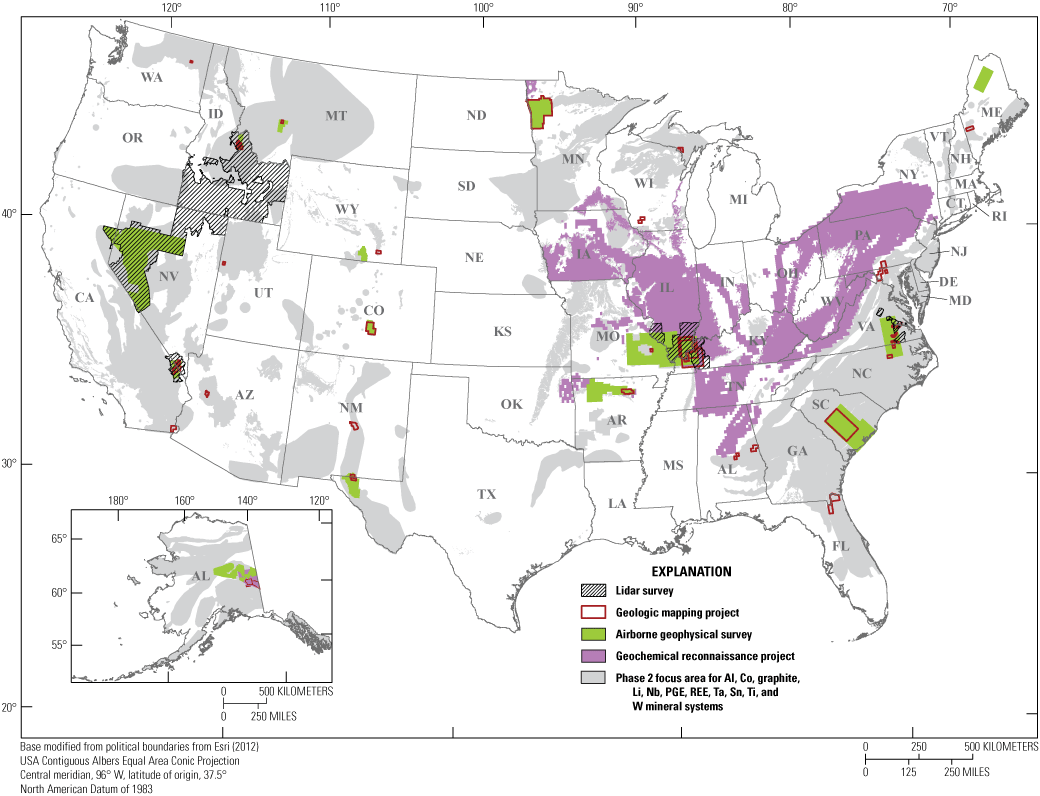
Map of the conterminous United States and Alaska showing ongoing data acquisition projects in 2021 for coverage of important geologic features throughout the country. Al, aluminum; Co, cobalt; Li, lithium; Nb, niobium; PGE, platinum-group element; REE, rare earth element; Ta, tantalum; Sn, tin; Ti, titanium; W, tungsten.
In the fall of 2020, the USGS hosted a virtual workshop with geologists from 42 State geological surveys and 3 other institutions to help develop focus areas for the 13 critical mineral commodities considered in this report. In October and November of 2020, each State developed top priorities for new projects. In January 2021, priority projects were evaluated based on the following criteria:
-
· the area contains or has potential for mineral systems that commonly contain critical minerals,
-
· new-framework geologic, geophysical, and lidar data can materially add to delineating terranes for critical minerals,
-
· land status can allow for mineral exploration and development in the reasonably foreseeable future,
-
· new data can support other geoscience needs, and
-
· synergy with ongoing USGS and State activities.
Methods
The mineral systems framework used by the project was developed by Hofstra and Kreiner (2020) to allow the Earth MRI to link critical minerals to genetically related deposit types that can form within a given mineral system. See appendix 1 for a description of each system and a list of deposit types and commodities commonly associated with each system. By delineating the possible extent of a given mineral system, target areas can be selected for both detailed geologic mapping by State geological surveys and the acquisition of new airborne geophysical surveys via the Earth MRI.
Table 2 lists the mineral systems identified for the phase 3 critical mineral commodities. Note that a mineral system can include many types of mineral deposits with multiple commodities (appendix 1). Many phase 3 critical mineral commodities occur in focus areas for mineral systems identified in phases 1 and 2 of the Earth MRI. Some new systems and deposit types were added for phase 3 (Hofstra and Kreiner, 2020). For example, petroleum systems were added because helium occurs in natural gas.
Table 2.
Mineral systems that may contain phase 3 critical minerals as principal commodities.[Data from Hofstra and Kreiner (2020). See appendix 1 for a complete list of the deposit types, principal commodities, and other critical minerals associated with each mineral system. Note that appendix 1 distinguishes between critical minerals produced from some deposit types in each system and those enriched but not yet produced. IOA, iron oxide-apatite; IOCG, iron oxide-copper-gold; Cu, copper; Mo, molybdenum; Au, gold; Sn, tin; REE, rare earth elements]
Data Sources
Many data sources were used to develop focus areas and identify data gaps. State geological survey representatives provided geologic maps, mineral occurrence data, and critical minerals expertise in their respective States. In addition to a digital compilation of state-scale maps (Horton, 2017), the National Geologic Map Database (https://ngmdb.usgs.gov/ngmdb/ngmdb_home.html) provided a gateway to available geological maps at different scales. Principal sources of mineral-occurrence data included the USGS Mineral Resources Data System (https://mrdata.usgs.gov/mrds/), the USMIN mineral deposit database (https://mrdata.usgs.gov/deposit/), other deposit type databases, and previous mineral resource assessments, as well as databases maintained by State geological surveys. The availability and quality of aeromagnetic and airborne radiometric data were determined using a compilation of national-scale, ranked geophysical data (Johnson and others, 2019). The status of lidar data for the conterminous United States is available on the 3DEP website (https://www.usgs.gov/3d-elevation-program).
All references, including references to geologic maps that cover the focus areas at various map scales and other geological and deposit information, are included in the tables that accompany the GIS in the associated data release (Dicken and others, 2021).
Delineation of Focus Areas
Focus areas for the phase 3 critical mineral commodities in the United States were delineated by teams of USGS geologists working with representatives from State geological surveys and other geologic institutions. Some phase 3 focus areas were based on selected geologic map units. Other focus areas were based on generalized outlines of mining districts or mineral belts, distributions of critical mineral occurrences, polygons of mining areas and surface features from USMIN, or geochemical and geophysical anomalies that could be associated with deposits. The factors considered include the basis for the focus area, any past production data, availability of geologic maps and other data for the area, and references (table 3). These factors and complete references are included in the data tables that accompany the GIS (Dicken and others, 2021).
Table 3.
Factors used to delineate U.S. focus areas potentially containing critical minerals along with specific new data needs.[U.S. Geological Survey (USGS) databases: ARDF, Alaska Resource Data File (https://mrdata.usgs.gov/ardf/); MRDS, Mineral Resources Data System (https://mrdata.usgs.gov/mrds/); USMIN, USGS Mineral Deposit Database (https://www.usgs.gov/centers/gggsc/science/usmin-mineral-deposit-database). Lidar, light detection and ranging; NA, not applicable]
| Topic | Explanation |
|---|---|
| Name of focus area | Descriptive geographic or geologic name |
| Region | Alaska, West, Central, East |
| Subregion | Alaska, Northwest, Southwest, Rocky Mountain, North Central, South Central, Northeast, Southeast |
| Mineral system | Select from appendix 1 |
| Deposit types | Select from appendix 1 |
| Commodities | Mineral commodities associated with the focus area |
| Identifier | A unique identifier for each focus area; some focus areas may be multipart |
| States | States included in the focus area |
| Basis for focus area | Short description of the main geologic criteria (basis) for delineating the area |
| Production | Yes (when), no, or unknown |
| Status of activity | Active mining, current or past exploration, unknown |
| Estimated resources | Cite, if known |
| Geologic maps | Estimate of the percentage of the focus area covered by geologic mapping at different scales; cite specific references if applicable |
| Geophysical data | Types and quality of available data (aeromagnetic, gravity, radiometric, other) |
| Favorable rocks and structures | Lithostratigraphic suitability for deposits; structures that may control mineralization |
| Deposits | Named deposits within the focus area that have identified resources or past production |
| Mineral occurrences | Summarized occurrences, if any, from USMIN, MRDS, ARDF, or other databases |
| Geochemical evidence | Stream sediment, rock, or soil indications of various commodities |
| Geophysical evidence | Data that may indicate exposed or buried intrusions, extensions of known mineralization, or structural controls |
| Evidence from other sources | If applicable |
| Comments | Author’s general comments on the focus area |
| Cover thickness and description | Comment, if applicable. Otherwise, not applicable (NA) |
| Selected references | Short reference (authors, year) |
| Authors | USGS and State geological surveys |
| Specific new data needs | |
| Geologic mapping and modeling needs | List geologic mapping needs. |
| Geophysical survey and modeling needs | List types of geophysical data needed and explain why. |
| Lidar | Give examples of the utility of lidar for the focus area. |
Using Focus Area Maps
Focus area maps and the accompanying tables of geologic and mineral deposit information for the phase 3 critical mineral commodities in the United States and Puerto Rico are included in a GIS data release (Dicken and others, 2021). The data release GIS for phase 3 includes 530 focus-area polygon features: 81 areas in Alaska, 448 areas in the conterminous United States, and 1 area in Puerto Rico (fig. 2). The size of individual focus areas is highly variable, ranging from <100 square kilometers (km2) to 31,000 km2, depending on the type of mineral system considered. Very large areas highlight broad regions of the country where specific mineral systems are known to occur; this does not imply that every part of the area is geologically permissive for critical minerals. Approximately 25 percent of the focus areas are <200 km2, or about the size of a 1:24,000-scale quadrangle map or smaller. Most small areas outline mineral districts or clusters of known mineral occurrences for a given deposit type. Other areas outline the maximum extent of large geological features, such as large sedimentary basins or belts of intrusive igneous rocks of a certain age that contain the mineral systems addressed.
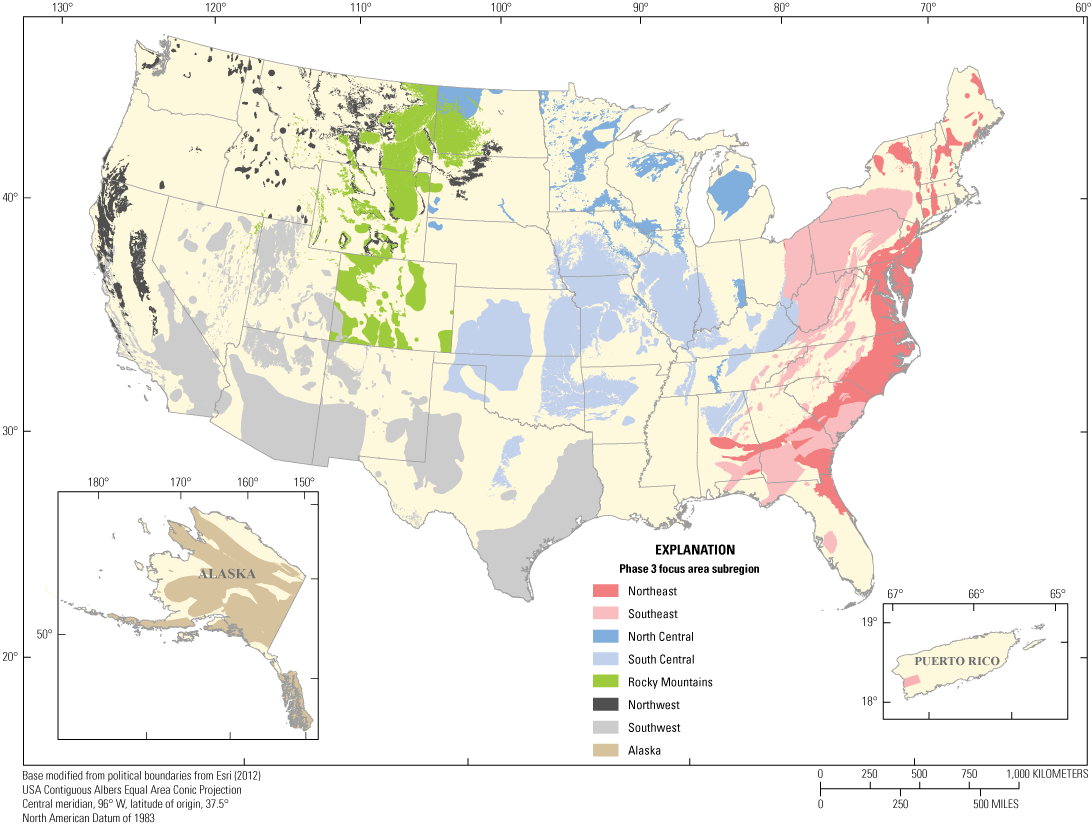
Map showing the distribution of focus areas in the conterminous United States for mineral systems and deposit types associated with phase 3 critical minerals in each focus-area subregion.
Phase 3 Critical Mineral Commodities and Associated Mineral Systems
The following sections describe the importance and mode of occurrence of the phase 3 critical mineral commodities and the mineral systems and deposit types in the conterminous United States that can host each critical mineral as either a primary product, coproduct, or byproduct commodity. The first topic in each section, “Importance to the Nation’s Economy,” includes excerpts on domestic production and use and world resources for critical minerals from the “Mineral Commodity Summaries 2021” for all commodities except uranium (U.S. Geological Survey, 2021a).
The organization of this part of the report follows the format used for phase 2 (Hammarstrom and others, 2020). For each of the phase 3 critical minerals, major focus areas are plotted by mineral system, along with point locations, for examples of significant occurrences. Examples of focus areas are listed in tables. All of the focus areas and supporting data tables are available in Dicken and others (2021). Many focus areas have the geological characteristics needed to contain critical mineral resources but have not produced critical minerals in the past. Brief descriptions of the important mineral systems highlight recent or ongoing mining and exploration in the focus area.
Antimony
Importance to the Nation’s Economy
The following two subsections describing factors that indicate the importance of antimony to the Nation’s economy are quoted from the “Mineral Commodity Summaries 2021” (U.S. Geological Survey, 2021a, p. 22–23).
Domestic Production and Use: In 2020, no marketable antimony was mined in the United States. A mine in Nevada that had extracted about 800 tons of stibnite ore from 2013 through 2014 was placed on care-and-maintenance status in 2015 and had no reported production in 2020. Primary antimony metal and oxide were produced by one company in Montana using imported feedstock. Secondary antimony production was derived mostly from antimonial lead recovered from spent lead-acid batteries. The estimated value of secondary antimony produced in 2020, based on the average New York dealer price for antimony, was about $35 million. Recycling supplied about 18% of estimated domestic consumption, and the remainder came mostly from imports. The value of antimony consumption in 2020, based on the average New York dealer price, was about $193 million. In the United States, the leading uses of antimony were as follows: flame retardants, 42%; metal products, including antimonial lead and ammunition, 36%; and nonmetal products, including ceramics and glass and rubber products, 22%.
World Resources: U.S. resources of antimony are mainly in Alaska, Idaho, Montana, and Nevada. Principal identified world resources are in Australia, Bolivia, China, Mexico, Russia, South Africa, and Tajikistan. Additional antimony resources may occur in Mississippi Valley-type lead deposits in the Eastern United States.
Mode of Occurrence
Stibnite (Sb2S3), the most common antimony ore mineral, occurs in many ore deposit types. However, primary antimony deposits are rare. Most antimony ore production comes from simple quartz-stibnite veins and replacement deposits (Seal and others, 2017). Antimony occurs as a byproduct of complex polymetallic ores that form in hydrothermal mineral systems. Although antimony is present in many gold deposits, it is typically not recovered, owing in part to cyanide heap-leaching processing constraints (Seal and others, 2017; Seal, 2021). Antimony is also a trace constituent in some intermediate-sulfidation gold-silver deposits (John and others, 2018).
Mineral Systems for Antimony
Many mineral systems can host antimony as a primary or byproduct commodity. The main mineral systems and deposit types for antimony are highlighted in figure 3. Selected examples are listed in table 4. See the data tables in Dicken and others (2021) for the complete list of focus areas that may contain antimony.
Carlin-Type
Carlin-type mineral systems include antimony deposits as well as gold-silver-mercury deposits with potential byproduct antimony. An antimony district in Utah produced 105,000 short tons of antimony in the past; samples taken near old mines suggest subeconomic inferred resources on the order of 14 million metric tons (Mt) at an average grade of 0.75 percent antimony (Krahulec, 2018). Although antimony concentrations can be anomalously enriched in Carlin-type gold deposits, no antimony resource estimates are available. A small amount of antimony was previously produced from other Nevada gold and antimony deposits.
Coeur d’Alene-Type
Coeur d’Alene-type antimony deposits in Idaho and Montana are hosted in Precambrian Belt sediments (Hofstra and others, 2013). Similar to deposits in orogenic systems, Coeur d’Alene-type antimony deposits are related to metamorphic dewatering during exhumation, but the source rocks are moderately oxidized rather than reduced siliciclastic sequences (Hofstra and Kreiner, 2020). Antimony and polymetallic silver-rich ores of the Coeur d’Alene district (Silver Valley antimony) represent the second-largest known antimony resource in the United States (fig. 3). The U.S. Antimony mine in Montana, also known as Stibnite Hill, closed in 1983 due to declining prices, with reported production and reserves of about 15.4 metric kilotons of antimony; the nearby Sunshine silver mine stopped recovering antimony in 2001 (Hofstra and others, 2013). Antimony in this district occurs in simple quartz-stibnite veins where antimony is recovered as the primary commodity. Antimony is also recovered as a byproduct from the silver mineral tetrahedrite in polymetallic silver-lead-zinc veins. Other examples of antimony in the Coeur d’Alene-type system include shallow mines developed in polymetallic, antimony-bearing fissure veins in Mississippian shale in the southwest Arkansas antimony district (fig. 3), which produced 5,400 short tons of antimony from 1873 to 1947 (Howard, 1979).
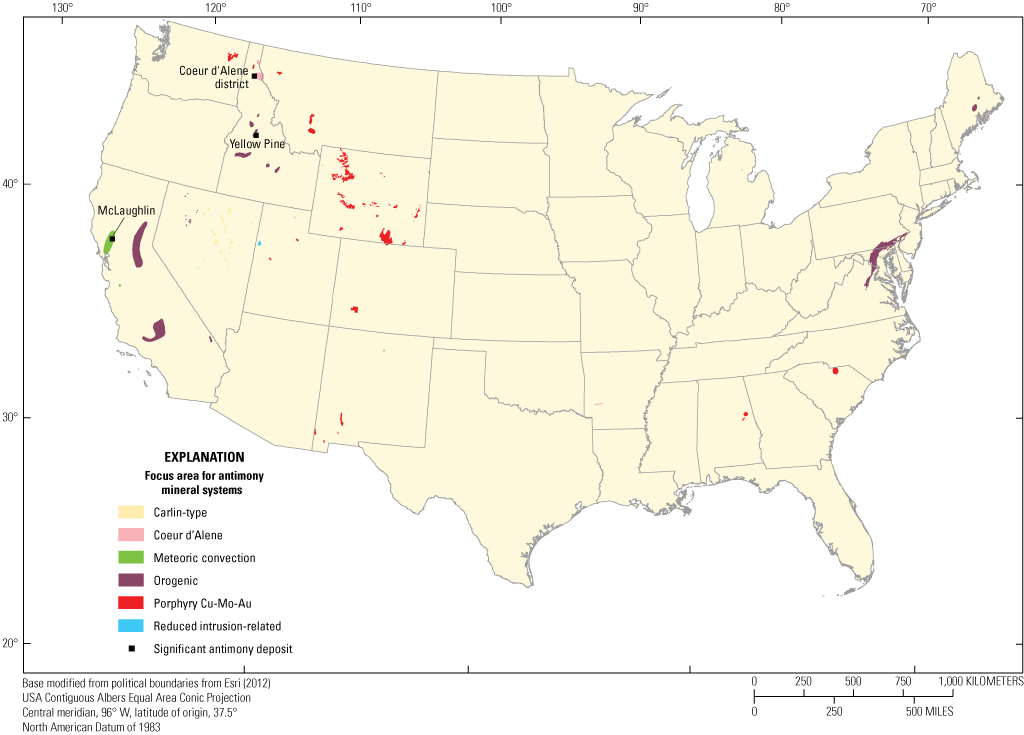
Map showing mineral system focus areas and significant mineral deposits for antimony resources in the conterminous United States. Cu, copper; Mo, molybdenum; Au, gold.
Meteoric Convection
Antimony is a byproduct commodity associated with gold, silver, and mercury in some low-sulfidation epithermal Au-Ag and antimony deposits of the meteoric convection mineral system. The mined out and reclaimed McLaughlin hot spring gold-mercury deposit and other hot spring deposits in the Coast Ranges of California lie along faulted contacts between the Coast Range ophiolites and the Great Valley sequence (fig. 3). At the McLaughlin deposit, antimony occurs in stibnite and sulfosalts; the deposit also hosted various arsenic-bearing sulfosalts, arsenian pyrite, and native arsenic (Sherlock and others, 1995).
Orogenic
Processes that form simple quartz-antimony deposits are related to the metamorphic dewatering of different rock types, including sulfidic, carbonaceous, or calcareous siliciclastic rocks during exhumation, where fluid flow along dilatant structures leads to vein deposition (Hofstra and Kreiner, 2020). The Yellow Pine deposit in Idaho (fig. 3) represents the largest known antimony resource in the United States. In the Stibnite-Yellow Pine mining district in Idaho, antimony occurs in narrow (<1 foot wide) high-grade quartz-stibnite veins and disseminated stibnite in shear zones in the granitic rocks of the Idaho batholith (White, 1940). The district was mined intermittently for gold, silver, tungsten, and antimony over the past century (Gillerman and others, 2019). In 2021, exploration and permitting are in progress at the Stibnite Gold project with plans to develop an open-pit gold-antimony mine, produce gold, silver, and antimony on-site, reprocess historical mine tailings, and conduct reclamation and restoration on the effects of historical mining (Zimmerman and others, 2021).
As of December 2020, the proven and probable mineral reserves at the Stibnite Gold project were estimated to be 104 Mt grading 1.43 grams per ton (g/t) gold, 1.91 g/t silver, and 0.064 percent antimony. The project was estimated to contain 4.8 million ounces (Moz) of gold, 1.2 Moz of silver, as well as 148.6 million pounds (Mlb) of antimony, with an estimated mine life of 14 years (Zimmerman and others, 2021). In addition to orogenic antimony deposits, orogenic gold and mercury deposits commonly contain byproduct antimony.
Other Mineral Systems
Antimony occurs in polymetallic sulfide S-R-V-IS (skarn, replacement, vein, intermediate sulfidation epithermal) deposits in porphyry Cu-Mo-Au, reduced intrusion-related, and IOA-IOCG mineral systems. For example, a cluster of polymetallic antimony occurrences in the Lakeview mining district near the Coeur d’Alene district in northern Idaho includes the Weber mine, which has historical assays of 1 percent antimony and silver, gold, lead, zinc, and arsenic. Similarly, antimony can be enriched in high-sulfidation epithermal deposits in Porphyry Sn and Climax-type systems. While these deposit types and mineral systems can be enriched in antimony, they have not represented significant antimony resources historically.
Table 4.
Examples of mineral systems, deposit types, and focus areas for potential antimony resources in the conterminous United States.[*, mineral systems and deposit types most likely to represent significant sources of antimony. See Hofstra and Kreiner (2020) for detailed descriptions of mineral systems and deposit types. Ag, silver; Au, gold; Cu, copper; Mo, molybdenum; S-R-V-IS, skarn, replacement, vein, intermediate sulfidation epithermal]
Barite
Importance to the Nation’s Economy
The following two subsections describing factors indicating the importance of barite to the Nation’s economy are quoted from the “Mineral Commodity Summaries 2021” (U.S. Geological Survey, 2021a, p. 28–29).
Domestic Production and Use: Numerous domestic barite mining and processing facilities were idled in 2020, and only one company in Nevada mined barite. Production data were withheld to avoid disclosing company proprietary data. An estimated 1.3 million tons of barite (from domestic production and imports) was sold by crushers and grinders operating in seven States. Typically, more than 90% of the barite sold in the United States is used as a weighting agent in fluids used in the drilling of oil and natural gas wells. The majority of Nevada crude barite was ground in Nevada and then sold to companies drilling in the Central and Western United States. Because of the higher cost of rail and truck transportation compared with ocean freight, offshore drilling operations in the Gulf of Mexico and onshore drilling operations in other regions primarily used imported barite.
Barite also is used as a filler, extender, or weighting agent in products such as paints, plastics, and rubber. Some specific applications include use in automobile brake and clutch pads, automobile paint primer for metal protection and gloss, use as a weighting agent in rubber, and in the cement jacket around underwater petroleum pipelines. In the metal-casting industry, barite is part of the mold-release compounds. Because barite significantly blocks x-ray and gamma-ray emissions, it is used as aggregate in high-density concrete for radiation shielding around x-ray units in hospitals, nuclear power plants, and university nuclear research facilities. Ultrapure barite is used as a contrast medium in x-ray and computed tomography examinations of the gastrointestinal tract.
World Resources: In the United States, identified resources of barite are estimated to be 150 million tons, and undiscovered resources contribute an additional 150 million tons. The world’s barite resources in all categories are about 2 billion tons, but only about 740 million tons are identified resources. However, no known quantitative assessment of either United States or global barite resources has been conducted since the 1980s.
Mode of Occurrence
Barite (BaSO4) occurs in four main types of mineral deposits: (1) bedded-sedimentary, (2) bedded-volcanic, (3) vein, cavity fill, and metasomatic, and (4) residual (Johnson and others, 2017). The largest and most important source of barite is the bedded-sedimentary type, which is stratiform, massive ore formed in marine basins within sedimentary sequences that typically contain organic-rich shale, mudstone, or chert. Barite beds can be laterally extensive and up to 100 meters or more in thickness. Barite deposits form where reduced brines encounter marine sulfate or carbonate in marine evaporite basins, forming bedded and replacement barite and witherite (BaCO3) deposits. Most bedded barite deposits are associated with sulfide mineralization related to large fluid-flow systems that produce Mississippi Valley-type and sedex-type zinc-lead deposits, as well as other deposit types. Bedded-volcanic barite deposits form at submarine volcanic centers, often in association with volcanogenic massive sulfide deposits. Vein and cavity-fill barite deposits form along permeable structures such as faults, breccia zones, or other open spaces or permeable rock infiltrated by barium-bearing fluids. The weathering of any of these deposit types can lead to the development of residual barite deposits.
Mineral Systems for Barite Resources
Barite is a primary commodity in deposits in mineral systems formed in marine settings. Historically, barite was mined in Arkansas, Georgia, Illinois, Missouri, Tennessee, and Nevada (fig. 4). Table 5 lists examples of focus areas.
Basin Brine Path
Bedded-sedimentary barite deposits have been extensively mined in Nevada since the 1960s, where high-grade deposits requiring minimal processing meet specifications for use in drilling muds by the oil industry (Johnson and others, 2017). The Greystone and Argenta mines are active barite producers (Nevada in fig. 4). The Snake Mountains mining district in Nevada produced more than 1 million short tons of barite between 1974 and 1985 (LaPointe and others, 1991). In the Eastern United States, the Sweetwater barite district in Tennessee produced more than 1 million short tons of barite; districts in southeast Missouri, Alabama, and Virginia also historically produced barite from bedded-sedimentary and residual deposits.
Hybrid Magmatic REE/Basin Brine Path
In hybrid magmatic/basin brine mineral systems, CO2- and HF-bearing magmatic volatiles condense into basinal brines that replace carbonate with fluorspar ± barite, REE, titanium, niobium, and beryllium. Examples include the Illinois-Kentucky Fluorspar district and the Hicks Dome in southern Illinois. These are primary fluorspar deposits with byproduct or coproduct barite.
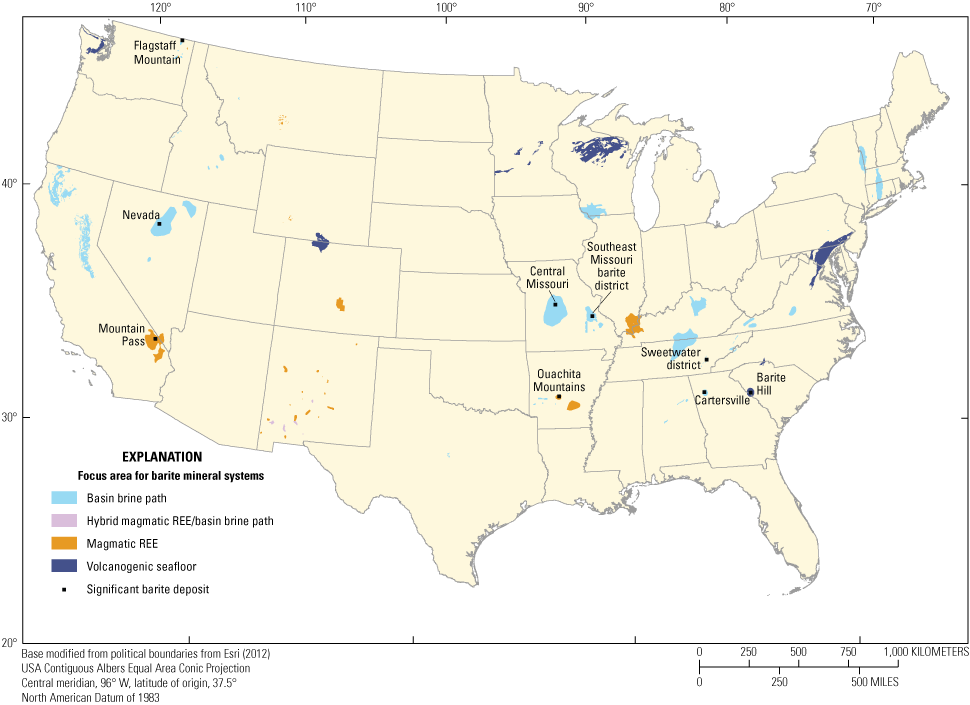
Map showing mineral system focus areas and significant deposits for barite resources in the conterminous United States. Significant barite deposits from Labay and others (2017).
Magmatic REE
Barite can occur as a principal commodity in carbonatites and peralkaline syenite assemblages in magmatic REE systems. For example, at Mountain Pass, California, barite comprises about 25 percent of the carbonatite (Johnson and others, 2017).
Table 5.
Examples of mineral systems, deposit types, and focus areas for potential barite resources in the conterminous United States.[*, mineral systems and deposit types most likely to represent significant sources of barite. See Hofstra and Kreiner (2020) for detailed descriptions of mineral systems and deposit types. REE, rare earth element]
Volcanogenic Seafloor
Bedded volcanic deposits form as volcanic seafloor deposits associated with copper, lead, zinc, or precious metal sulfide ores. The Barite Hill gold deposit in South Carolina is a Kuroko-type volcanogenic massive sulfide deposit in the Carolina slate belt with lenses of massive barite and quartz (Clark, 1999). Other examples of barite in this system include the Kings Creek barite district on the North Carolina-South Carolina border (table 5). Volcanic seafloor systems in other parts of the country are permissive for barite but unlikely to host significant resources.
Beryllium
Importance to the Nation’s Economy
The following two subsections describing factors indicating the importance of beryllium to the Nation’s economy are quoted from the “Mineral Commodity Summaries 2021” (U.S. Geological Survey, 2021a, p. 32–33).
Domestic Production and Use: One company in Utah mined bertrandite ore and converted it, along with imported beryl, into beryllium hydroxide. Some of the beryllium hydroxide was shipped to the company’s plant in Ohio, where it was converted into metal, oxide, and downstream beryllium-copper master alloy, and some was sold. Based on the estimated unit value for beryllium in imported beryllium-copper master alloy, beryllium apparent consumption of 170 tons was valued at about $110 million. Based on sales revenues, approximately 24% of beryllium products were used in aerospace and defense applications; 23% in industrial components; 12% each in automotive electronics and telecommunications infrastructure; 11% in consumer electronics; 9% in energy applications; 1% in semiconductor applications; and 8% in other applications. Beryllium alloy strip and bulk products, the most common forms of processed beryllium, were used in all application areas. Most unalloyed beryllium metal and beryllium composite products were used in defense and scientific applications.
World Resources: The world’s identified resources of beryllium have been estimated to be more than 100,000 tons. About 60% of these resources are in the United States; by tonnage, the Spor Mountain area in Utah, the McCullough Butte area in Nevada, the Black Hills area in South Dakota, the Sierra Blanca area in Texas, the Seward Peninsula in Alaska, and the Gold Hill area in Utah account for most of the total.
Mode of Occurrence
Beryllium occurs in varied deposit types, mainly as magmatic-related beryllium deposits associated with alkaline to peralkaline and metaluminous to peraluminous igneous rocks (Foley and others, 2017). The major sources of beryllium are the minerals bertrandite [Be4Si2O7(OH)2] and beryl (Be3Al2Si6O18). Bertrandite ores are produced from volcanogenic-hosted beryllium deposits, such as Utah’s world-class Spor Mountain deposit (fig. 5). Industrial beryl is mainly produced from rare-metal lithium-cesium-tantalum (LCT)-type pegmatites, as from the pegmatite districts in the Black Hills of South Dakota. In the Eastern United States, the tin-spodumene belt of North Carolina and South Carolina represents potential beryllium resources.
Mineral Systems for Beryllium Resources
Beryllium is a primary or byproduct commodity in deposits in mineral systems that contain evolved igneous intrusions with related pegmatites and greisens (fig. 5). Table 6 lists examples of phase 3 focus areas with known or potential beryllium resources.
Climax-Type
Climax-type systems form in continental rift settings characterized by hydrous bimodal magmatism (Hofstra and Kreiner, 2020). A variety of deposit types can form as aqueous supercritical fluids exsolved from anorogenic topaz rhyolite plutons, and the apices of subvolcanic stocks move upward and outward, split into liquid and vapor phases, react with country rocks, and mix with groundwater. The large thermal and chemical gradients in these systems result in diverse deposit types, such as volcanogenic beryllium deposits or beryllium in greisen, skarn, and replacement deposits. At deep levels in these systems, late-stage niobium-yttrium-fluorine (NYF)-type pegmatites carrying beryllium emanate from plutons.
The volcanogenic beryllium deposit at Spor Mountain in Utah, which opened in 1968, provides most of the world’s beryllium. Beryllium ore deposits occur with topaz-bearing rhyolite flows, pyroclastic deposits, and fluorite-bearing pipes along the ring fracture zone of an Oligocene caldera (Foley and others, 2016). Spor Mountain contains sufficient reserves to meet current expected domestic demands with resources of 7,011,000 metric tons (t) of ore and a grade of 0.76 percent BeO (Brush Engineered Materials, Inc., 2009). Other known large deposits include Apache Warm Springs in New Mexico, which has a beryllium resource of 39,063 t of ore at a grade of 0.72 percent BeO (McLemore, 2010).
Greisen and skarn in a large, fluorspar-rich system at McCullough Butte, Nevada, produced beryllium in the past (fig. 5). The deposit has a resource of 175 Mt of ore at an average grade of 0.27 percent BeO (J. Muntean, Nevada Bureau of Mines and Geology, written commun., 2021). NYF-type pegmatites and greisens associated with the Redskin Granite at Boomer Lake in Colorado produced 3,000 t of high-grade ore (2.0–11.2 percent BeO) between 1948 and 1969 (Hawley, 1969; Piper, 2007).
Magmatic REE
Beryllium occurs in Magmatic REE systems in deposits grouped as Peralkaline syenite/granite/rhyolite/alaskite/pegmatites (Hofstra and Kreiner, 2020). Examples include the Hicks Dome deposit in Illinois, where the mineral bertrandite occurs in breccia bodies (Baxter and Bradbury, 1980) and the Round Top deposit in Texas. Round Top is being primarily developed as an REE deposit with the potential for byproduct recovery of both beryllium and lithium (Pingitore and others, 2016). Resource estimates are available for potential commodities at Round Top, but no reserves are reported; 364,000 t of measured and indicated resources have an average beryllium grade of 32.15 parts per million (Hulse and others, 2019).
Porphyry Sn
Granite-related porphyry Sn systems form in back-arc or hinterland settings by similar processes from fluids exsolved from more crustally contaminated S-type peraluminous plutons and stocks. At deep levels, LCT pegmatites emanate from plutons (Hofstra and Kreiner, 2020). Beryllium occurs as a main or byproduct commodity with tin and tungsten in porphyry, skarn, and greisen deposits in this system and related LCT-type pegmatites. Examples of beryllium-rich LCT-type pegmatites include the famous pegmatite deposits in the Black Hills of South Dakota, as well as the pegmatite districts in Maine and Colorado (fig. 5).
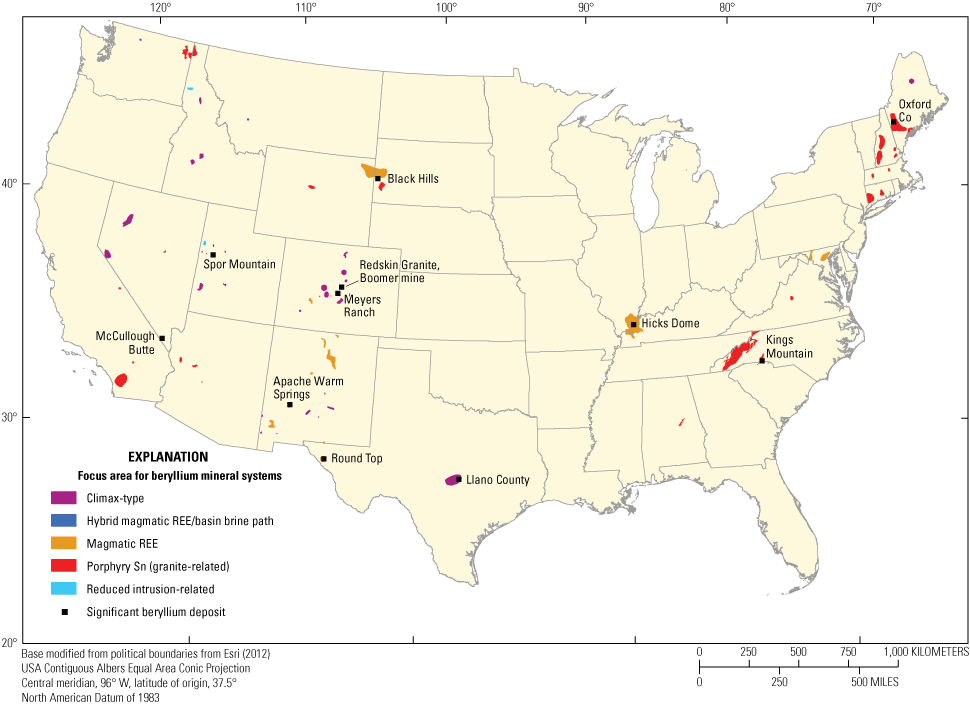
Map showing mineral system focus areas and significant occurrences for beryllium resources in the conterminous United States. Significant beryllium occurrences from Labay and others (2017). REE, rare earth elements; Sn, tin.
Table 6.
Examples of focus areas for potential beryllium resources.[*, mineral systems and deposit types most likely to represent significant sources of beryllium. See Hofstra and Kreiner (2020) for detailed descriptions of mineral systems and deposit types. Sn, tin; NYF, niobium-yttrium-fluorine; LCT, lithium-cesium-tantalum; REE, rare earth element; S-R, skarn and replacement]
Chromium
Importance to the Nation’s Economy
The following two subsections describing factors indicating the importance of chromium to the Nation’s economy are quoted from the “Mineral Commodity Summaries 2021” (U.S. Geological Survey, 2021a, p. 46–47).
Domestic Production and Use: In 2020, the United States was expected to consume 4% of world chromite ore production in various forms of imported materials, such as chromite ore, chromium chemicals, chromium ferroalloys, chromium metal, and stainless steel. Imported chromite ore was consumed by one chemical firm to produce chromium chemicals. Stainless-steel and heat-resisting-steel producers were the leading consumers of ferrochromium. Stainless steels and superalloys require the addition of chromium via ferrochromium or chromium containing scrap. The value of chromium material consumption was expected to be about $600 million in 2020, as measured by the value of net imports, excluding stainless steel, and was an increase from $304 million in 2019.
World Resources: World resources are greater than 12 billion tons of shipping-grade chromite, sufficient to meet conceivable demand for centuries. World chromium resources are heavily geographically concentrated (95%) in Kazakhstan and southern Africa; United States chromium resources are mostly in the Stillwater Complex in Montana.
Mode of Occurrence
The mineral chromite [(Mg, Fe2+) (Cr, Al, Fe3+)2O4] is the only source of commercial chromium. Two major types of chromite deposits are both related to ultramafic igneous rocks: (1) layered or stratiform chromite deposits in layered intrusions and (2) podiform chromite deposits. Chromite is a high-density mineral that can also accumulate in heavy-mineral sands in placer deposits that were sourced from mafic and ultramafic igneous rocks.
In stratiform mafic and ultramafic layered complexes, chromite crystallizes directly from magma as a cumulate mineral that concentrates in layers ranging in thickness from centimeters to meters. Typically, chromite seams are laterally extensive and can occur along the entire length of the layered intrusion (Zientek, 1993). These stratiform chromite-enriched layers are classified as Bushveld-type chromium deposits, named for the world-class Bushveld Complex, South Africa. Some chromite layers are also enriched in PGEs, as in the Stillwater Complex, Montana.
Podiform chromite deposits are found in alpine-type peridotites that form in ophiolites, which is oceanic crust tectonically emplaced along continental margins. Most major podiform chromite deposits in the United States occur in Alaska; other countries, such as Kazakhstan, Turkey, and the Philippines, also have large podiform chromite deposits (Mosier and others, 2012). Podiform chromite deposits in the conterminous United States are considered minor deposits, with a median deposit size of 100 t of ore compared to the median deposit size of 11,000 t for major deposits. Both stratiform and podiform chromite deposits have average grades of 51 percent Cr2O3 (Mosier and others, 2012).
Mineral Systems for Chromium Resources
Most chromite comes from deposits in mafic magmatic mineral systems. Some placer deposits concentrate chromite (fig. 6). Examples of chromium focus areas are listed in table 7.
Mafic Magmatic
The Stillwater Complex, Montana (fig. 6, table 7), hosts multiple types of mineral deposits. The Basal series of this layered igneous complex contains low-grade copper-nickel sulfide mineralization. The overlying Ultramafic series contains laterally extensive stratiform chromite seams ranging in thickness from <1 m to about 4 m. The Upper and Banded series host PGE sulfide deposits. Sibanye Stillwater operates the Stillwater and East Boulder mines to produce palladium and platinum from the J-M Reef in the Banded series; a third project along the J-M Reef, the Blitz project, is in development (Sibanye Stillwater, 2021).
Chromite exploration at the Stillwater Complex started before 1900. Mines were developed during the Second World War under a government subsidy. Chromite seams in the Stillwater Complex are referred to by letters, starting with “A” at the base. The “A” and “B” seams are enriched in PGE. Between 1956 and 1962, the “G” and “H” chromite seams produced 2 Mt of chromite ore, averaging 22.8 percent Cr2O3 (Courtney, 2000). Further exploration in the 1980s identified a drill-indicated reserve of 14.6 Mt at the same average grade as the earlier production (Courtney, 2000).
In a mineral resource assessment of the Custer and Gallatin National Forests that covers the Stillwater Complex and adjacent areas, Zientek (1993) compiled available resource data for all deposits, prospects, and occurrences in the Stillwater Complex. He noted that chromite resources in some areas are partially delimited by exploration; additional resources are likely within undiscovered deposits as fault-offset extensions of known deposits and prospects. Exploration for chromite, however, is unlikely unless low-cost options for ore processing become available.
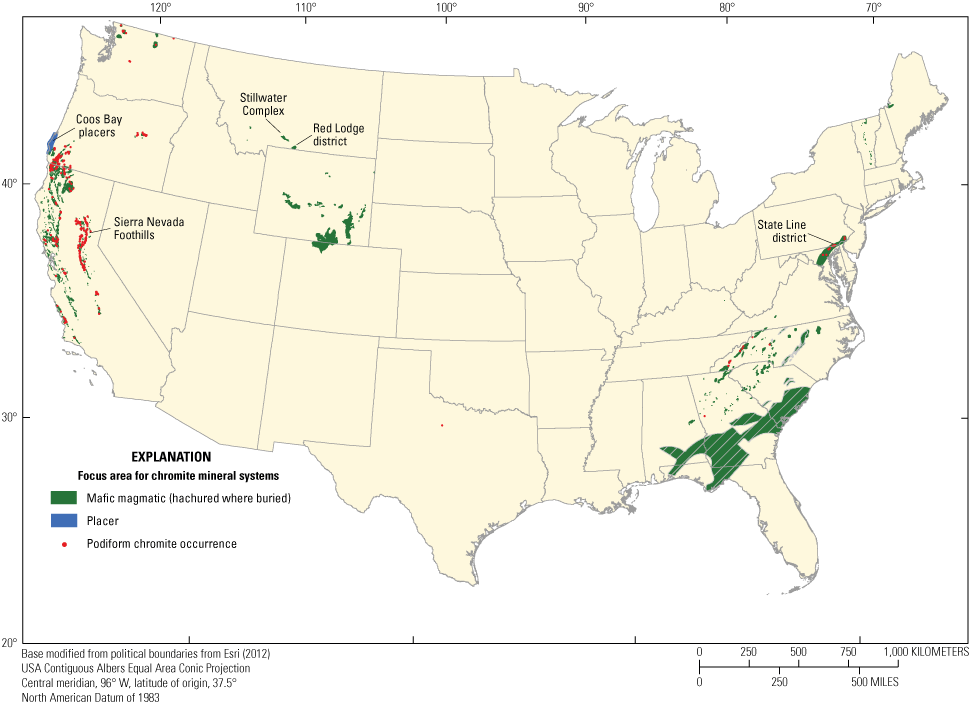
Map showing mineral system focus areas for chromite resources in the conterminous United States.
Podiform chromite deposits, many containing <1,000 t of ore, are scattered along the Pacific coast from Alaska to southern California. The chromite deposits of the Sierra Nevada foothills, the Klamath Mountain districts, and the Coastal Ranges in California shipped nearly 600,000 t of chromite in the 1940s (Thayer and Lipin, 1979). Small, ultramafic bodies were discovered in the Red Lodge district of southwest Montana in 1916; total production from the area was about 61,600 t of chromite ore at an average grade of 24–40 percent Cr2O3 (Simons and others, 1979; Loferski, 1986). Most of the massive chromite at the Red Lodge district is mined out. The high iron content, alteration, and low concentrations of cobalt, nickel, and PGEs as potential byproducts should be considered negative factors for future mining (Loferski, 1986).
Podiform chromite deposits also occur in the Eastern United States in Maryland, Pennsylvania, and North Carolina. The State Line district in Maryland and Pennsylvania (table 7) was mined extensively in two periods between 1820 and the early 1870s. About 40 deposits were developed during that time with the production of 250,000–280,000 t of chromite ore; these included the Wood deposit, which was the largest massive chromite deposit in the United States at that time (Pearre and Heyl, 1960). The large part of the focus area for mafic magmatic systems in the Southeastern United States (shown as the hachure pattern in fig. 6) represents the extent of possible, buried, mafic intrusions in Triassic basins that could host chromite or other resources, based on geophysical anomalies.
Placer
Chromite-rich placer deposits are uncommon. However, a notable example is the terraced black-sand deposits in the Coos Bay area of southwestern Oregon (table 7), which were explored for chromite, garnet, and iron-rich ilmenite starting in 1989. Oregon Resources Corp., a subsidiary of the former Industrial Minerals Corp, Ltd. (Australia), started recovering chromite in 2011 and was the only domestic producer of foundry-grade chromite until the property became inactive in 2013 (Papp, 2013). As of 2011, the Oregon deposit had JORC1-compliant reserves and resources of 18,217,009 t of ore with average grades of 7.853 percent chromite, 0.16 percent zircon, 9.768 percent heavy minerals sands, and 0.692 percent garnet (Industrial Minerals Corp., Ltd., 2011).
Australasian Joint Ore Reserves Committee professional code of practice that sets minimum standards for Public Reporting of minerals Exploration Results, Mineral Resources and Ore Reserves.
Some chromite placers were related to the State Line podiform chromite deposits of Maryland and Pennsylvania. Pearre and Heyl (1960) suggested that a potential of at least 30,000 tons of chromite concentrates (30–54 percent Cr2O3) could remain in placers in the State Line and nearby Soldier’s Delight districts. However, these areas are unlikely as sites of future resources due to urban development.
Table 7.
Examples of mineral systems, deposit types, and focus areas for potential chromium resources in the conterminous United States.[*, mineral systems and deposit types most likely to represent significant sources of chromite. See Hofstra and Kreiner (2020) for detailed descriptions of mineral systems and deposit types]
Fluorspar
Importance to the Nation’s Economy
The following two subsections describing factors indicating the importance of fluorspar to the Nation’s economy are quoted from the “Mineral Commodity Summaries 2021” (U.S. Geological Survey, 2021a, p. 60–61).
Domestic Production and Use: In 2020, minimal fluorspar (calcium fluoride, CaF2) was produced in the United States. One company sold fluorspar from stockpiles produced as a byproduct of its limestone quarrying operation in Cave-in-Rock, IL, and continued development on its fluorspar mine in Kentucky. After acquiring a fluorspar mine in Utah, a second company continued a drilling program to further define the mineral resource and facilitate development of a mine plan. An estimated 29,000 tons of fluorosilicic acid (FSA), equivalent to about 47,000 tons of fluorspar grading 100%, was recovered from five phosphoric acid plants processing phosphate rock, which was primarily used in water fluoridation. The U.S. Department of Energy continued to produce aqueous hydrofluoric acid (HF) as a byproduct of the conversion of depleted uranium hexafluoride to depleted uranium oxide at plants in Paducah, KY, and Portsmouth, OH.
U.S. fluorspar consumption was satisfied primarily by imports. Domestically, production of HF in Louisiana and Texas was by far the leading use for acid-grade fluorspar. Hydrofluoric acid is the primary feedstock for the manufacture of virtually all fluorine-bearing chemicals, particularly refrigerants and fluoropolymers, and is also a key ingredient in the processing of aluminum and uranium. Fluorspar was also used in cement production, in enamels, as a flux in steelmaking, in glass manufacture, in iron and steel casting, and in welding rod coatings.
World Resources: Large quantities of fluorine are present in phosphate rock. Current U.S. reserves of phosphate rock are estimated to be 1 billion tons, containing about 72 million tons of 100% fluorspar equivalent assuming an average fluorine content of 3.5% in the phosphate rock. World reserves of phosphate rock are estimated to be 71 billion tons, equivalent to about 5 billion tons of 100% fluorspar equivalent.
Mode of Occurrence
Fluorspar is the commercial name for the mineral fluorite, CaF2, the only major geologic source of fluorine. Fluorspar deposits form in many different mineral systems and deposit types, most commonly in hydrothermal deposits associated with alkaline igneous rocks, highly evolved granites, NYF-type pegmatites, and carbonatites (Hayes and others, 2017). Fluorspar deposits are also associated with Mississippi Valley-type deposits and spatially related residual deposits where host carbonate rocks dissolved away. Fluorine is a byproduct from phosphate deposits that contain about 3 percent fluorine concentrated in the phosphate mineral apatite (Brobst and Pratt, 1973).
Mineral Systems for Fluorspar
Fluorspar deposits can be related to alkaline igneous rocks in several mineral systems. For example, fluorite is a primary commodity in fluorspar deposits in alkalic porphyry, Climax-type, and magmatic REE systems (fig. 7). Examples of fluorspar focus areas for six mineral systems are listed in table 8.
Alkalic Porphyry and Climax-Type Mineral Systems
Alkalic porphyry systems in the Western United States include historical fluorspar producing areas in Idaho, Montana, and Colorado. Tertiary-age fluorite deposits occur in a belt in south-central Idaho that includes the Bayhorse, Meyers Cove, Yankee Fork, and Stanley districts. In the 1950s, the Bayhorse mine and Meyers Cove area (fig. 7) produced about 650 t and 33,900 t of fluorite, respectively (Anderson and Van Alstine, 1964). Measured reserves of 3.2 million short tons of ore (averaging 36 percent CaF2) were reported for the Bayhorse deposit in the Challis fluorspar area in Idaho (Snyder, 1978). Fluorspar occurs in low-sulfidation epithermal deposits associated with the Zortman syenite in Montana and the Jamestown and St. Peter’s Dome mining districts in Colorado.
In Climax-type systems, fluorite is a primary commodity in fluorspar deposits, greisens, and NYF-type pegmatites, commonly occurring with beryllium-bearing minerals. Examples include a relatively large fluorite deposit at the Daisy mine in Nevada containing more than 80 Mt of ore at an average grade of 10 percent CaF2 and the Northgate district in Colorado (fig. 7). In the Northgate district, veins and faults in breccia zones associated with Precambrian quartz monzonite produced $25 million worth of fluorspar between 1952 and 1973 (Shawe, 1976; Schwochow and Hornbaker, 1985). The Spor Mountain area of Utah produced more than 350,000 t of fluorspar from 29 deposits starting in 1943 (Hughes, 2019). The deposits are fault-controlled breccias, pipes, and replacements associated with Paleozoic dolomites and Tertiary topaz- and beryllium-bearing rhyolite and rhyolitic tuff.
The Lost Sheep mine, the largest fluorspar producer in the area, was the subject of a 2019 technical report summarizing the historical mining, exploration, and sampling results indicating high-grade (70–89 percent CaF2) fluorspar deposits, but no recent drilling results or resources have been reported (Hughes, 2019). In 2021, Ares Strategic Mining Inc. announced the results of a geophysical (IP) survey over the permitted mine area and plans for the construction of a plant that would produce metallurgical- and acid-grade fluorspar (Ares Strategic Mining Inc., 2021a, b).
Basin Brine Path
Historically, fluorspar deposits associated with zinc-lead deposits represented the major source of domestic fluorspar production. The Illinois-Kentucky fluorspar district, for example, produced more than 8 Mt of fluorspar from the 1880s until the 1970s (Pinckney, 1976). A large vein at the Klondike II property in the Illinois-Kentucky fluorspar district (fig. 7) contains at least 1.6 Mt at a grade of 60 percent CaF2 (Feytis, 2009). In the past, fluorspar was also produced in New Hampshire and northern New York.
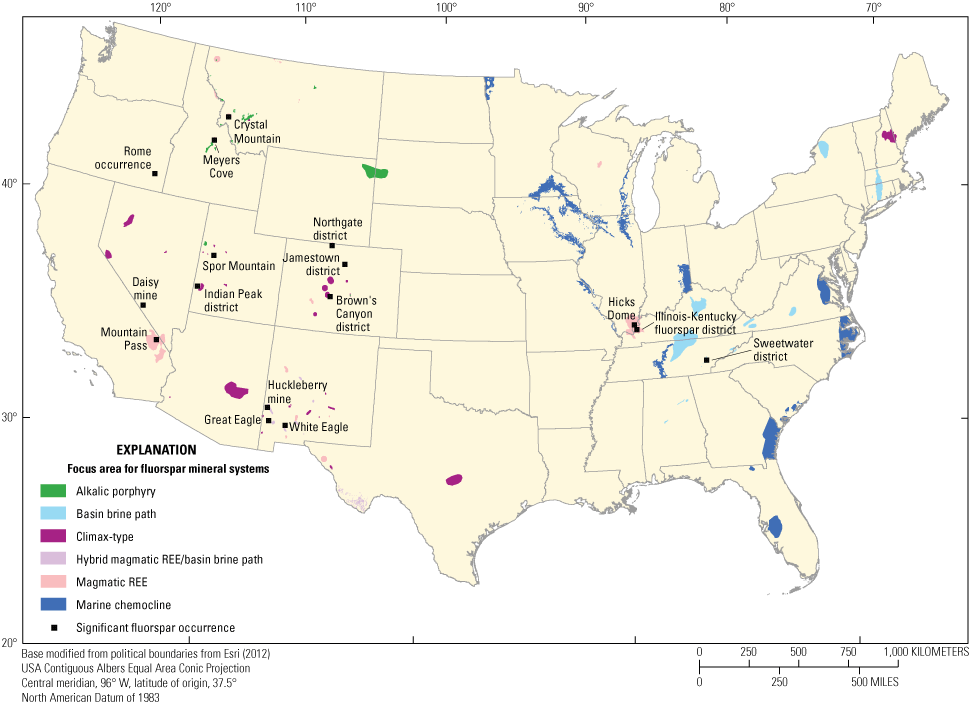
Map showing mineral system focus areas and significant occurrences for fluorspar resources in the conterminous United States. Significant fluorspar occurrences from Labay and others (2017).
Hybrid Magmatic REE/Basin Brine Path
Fluorspar deposits representing a hybrid of magmatic REE and basin brine systems occur at the Hicks Dome in Illinois (fig. 7). These types of fluorspar deposits were identified in New Mexico, where mines in the fluorite district along the western rim of the Mogollon Mountains provided production in the past.
Magmatic REE
In magmatic REE systems, the rare-earth mineral bastnaesite—found in carbonatite at Mountain Pass, California—contains about 7 percent fluorine and constitutes 5–15 percent of the rock. Based on an estimated 100 Mt of potential ore at Mountain Pass (Olson and others, 1954), about 1 Mt of fluorine is estimated as a potential byproduct of REE extraction.
Marine Chemocline
Marine phosphate rock in Florida, North Carolina, Tennessee, Utah, Wyoming, Idaho, and Montana (fig. 7) was estimated to represent a potential fluorine resource of about 2 billion tons (Gt) or about 4 Gt of fluorspar (Worl and others, 1973). More than 75 percent of domestic mining of phosphate rock in 2020 came from Florida and North Carolina (U.S. Geological Survey, 2021a).
Table 8.
Examples of mineral systems, deposit types, and focus areas for potential fluorspar resources in the conterminous United States.[*, mineral systems and deposit types most likely to represent significant sources of fluorspar. See Hofstra and Kreiner (2020) for detailed descriptions of mineral systems and deposit types. REE, rare earth element]
Helium
Importance to the Nation’s Economy
The following two subsections describing factors indicating the importance of helium to the Nation’s economy are quoted from the “Mineral Commodity Summaries 2021” (U.S. Geological Survey, 2021a, p. 76–77).
Domestic Production and Use: The estimated value of Grade-A helium (99.997% or greater) extracted during 2020 by private industry was about $322 million. Fourteen plants (one in Arizona, two in Colorado, five in Kansas, one in Oklahoma, four in Texas, and one in Utah) extracted helium from natural gas and produced crude helium, which range from 50 to 99% helium. One plant in Colorado and another in Wyoming extracted helium from natural gas and produced Grade-A helium. Three plants in Kansas and one in Oklahoma accepted crude helium from other producers and the Bureau of Land Management (BLM) pipeline and purified it to Grade-A helium. In 2020, estimated domestic apparent consumption of Grade-A helium was 40 million cubic meters (1.4 billion cubic feet), and it was used for magnetic resonance imaging, lifting gas, analytical and laboratory applications, welding, engineering and scientific applications, leak detection and semiconductor manufacturing, and various other minor applications.
World Resources: Section 16 of Public Law 113–40 requires the U.S. Geological Survey (USGS) to complete a national helium gas assessment. The USGS and the BLM coordinated efforts to complete this assessment, which is expected to be published in 2021. The BLM plans to publish an update to its report of the Helium Resources of the United States by midyear 2021. Until then, the following estimates are still the best available. As of December 31, 2006, the total helium reserves and resources of the United States were estimated to be 20.6 billion cubic meters (744 billion cubic feet). This includes 4.25 billion cubic meters (153 billion cubic feet) of measured reserves, 5.33 billion cubic meters (192 billion cubic feet) of probable resources, 5.93 billion cubic meters (214 billion cubic feet) of possible resources, and 5.11 billion cubic meters (184 billion cubic feet) of speculative resources. Measured reserves include 670 million cubic meters (24.2 billion cubic feet) of helium stored in the Cliffside Field Government Reserve and 65 million cubic meters (2.3 billion cubic feet) of helium contained in Cliffside Field native gas. The Cliffside (Texas), Hugoton (Kansas, Oklahoma, and Texas), Panhandle West (Texas), Panoma (Kansas), and Riley Ridge (Wyoming) Fields are the depleting fields from which most U.S. produced helium is extracted. These fields contained an estimated 3.9 billion cubic meters (140 billion cubic feet) of helium. Helium resources of the world, exclusive of the United States, were estimated to be about 31.3 billion cubic meters (1.13 trillion cubic feet). The locations and volumes of the major deposits, in billion cubic meters, are Qatar, 10.1; Algeria, 8.2; Russia, 6.8; Canada, 2.0; and China, 1.1. As of December 31, 2020, the BLM had analyzed about 22,700 gas samples from 26 countries and the United States, in a program to identify world helium resources.
Mode of Occurrence
Helium is a naturally occurring gas with critical applications for military, homeland security, medical, science, and research needs (National Research Council, 2010). Helium is found trapped in subsurface geologic reservoirs as a trace constituent in hydrocarbon and inert gas accumulations. The dominant isotope of naturally occurring helium is helium-4, which is formed by the decay of uranium-235, uranium-238, and thorium-232, and, therefore, typically referred to as “radiogenic” helium (Ballentine and Burnard, 2002). Helium concentrations in gas reservoirs are typically below the 1 mole percent level but, in some reservoirs, can be upwards of 8–10 mole percent (Katz, 1969; Brennan and others, 2021).
Helium is typically found in gas reservoirs associated with elevated or dominant nitrogen gas concentrations (Katz, 1969; Ballentine and Sherwood Lollar, 2002; Brown, 2010). The prevailing thought about this relationship is that nitrogen might form in the same rocks as the helium and then act as a carrier gas, liberating helium from source rocks and traveling with helium dissolved in connate waters (Ballentine and Sherwood Lollar, 2002; Brown, 2010). The geologic model for the migration of the gases from source to trap is that as helium- and nitrogen-bearing waters reach shallow depths, lower pressures lead to exsolution of the gases, which are then trapped in porous strata beneath relatively impermeable sealing formations (Ballentine and Sherwood Lollar, 2002; Brown, 2010). Most high-helium gas reservoirs in the United States are found in the Central Plains and Rocky Mountain States (Kansas, Oklahoma, Texas, New Mexico, Colorado, Utah, and Wyoming) (Hamak, 2020).
Mineral Systems for Helium Resources
Petroleum systems are the only source of helium. Helium occurs with oil or natural gas in the central and western United States (fig. 8, table 9).
Petroleum
Helium occurs in oil and natural gas deposits in the Central United States (fig. 8). Focus areas represent basins with current and potential helium production and basins with historical helium production (table 9). The U.S. Government operates the helium production, refining, and distribution system. Since 1962, the Bureau of Land Management has maintained a long-term, large-scale storage facility within the Hugoton-Panhandle gas field complex spanning from southwest Kansas into northwest Oklahoma and the panhandle of Texas. However, this system is being sold off due to declining helium production. New data could revive this critical mineral production system.
Helium-bearing oil and natural gas deposits occur throughout Colorado (fig. 8), including the Piceance Basin, Sand Wash Basin (part of the Greater Green River Basin), Hugoton Embayment, Paradox Basin, San Juan Basin, San Juan Mountains (Sag), San Luis Basin, and Raton Basins. There is some current production at McElmo Dome in the Paradox Basin, and current exploration in Baca County identified 173 million cubic feet (MMcf) of marginal helium reserves (Gage and Driskill, 2001). Marginal reserves of 368 MMcf of helium are reported for the Douglas Creek Arch. Subeconomic and inferred resources are reported for other focus areas in Colorado.
In Wyoming, helium is recovered along with natural gas and carbon dioxide from wells in the northern part of the Moxa Arch (fig. 8) and processed and sold through ExxonMobil's LaBarge-Shute Creek Treating Facility. Production is primarily from the Mississippian Madison Limestone. The Moxa Arch focus area outlines a broad, general region around fields with known production on the northern Moxa Arch (Clark, 1981). Helium was measured in natural gas elsewhere in the State (Clark, 1981; De Bruin, 2004).
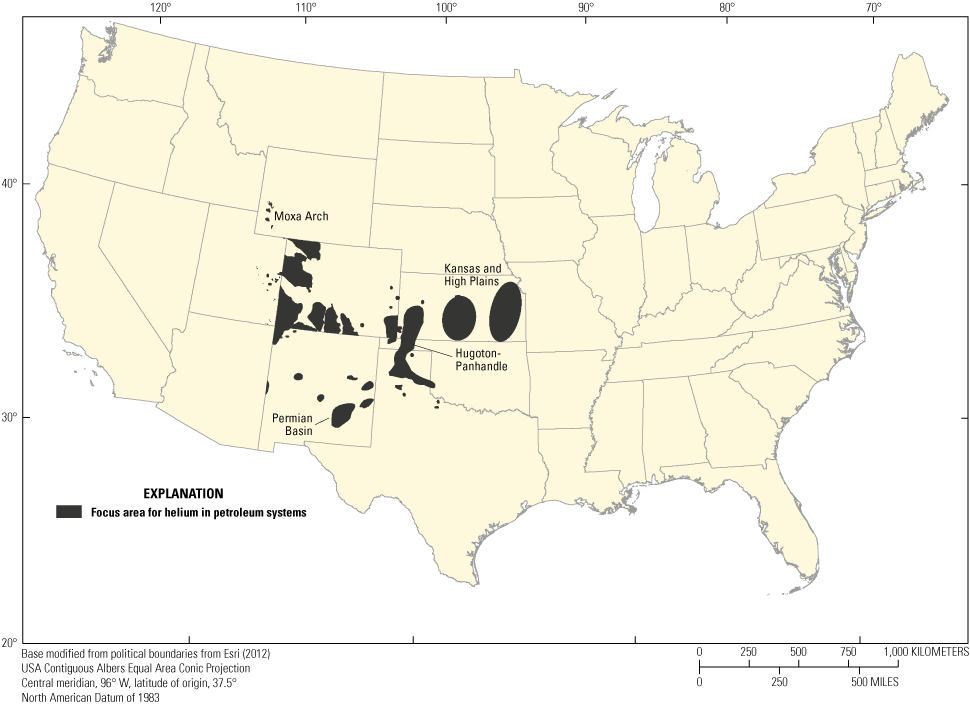
Map showing mineral system focus areas for helium resources in the conterminous United States.
In New Mexico, helium has been extracted from produced gases since 1943. Permian Basin reservoirs in New Mexico have elevated helium concentrations associated with regional northeast-trending strike-slip faults that provide migration pathways for helium produced in the underlying Precambrian basement. The Redbed sandstone of the Abo Formation represents the trap with the overlying Yeso Formation acting as a seal (Broadhead, 2005).
Most domestic helium is extracted from the Hugoton-Panhandle (Kansas, Oklahoma, and Texas) and fields along the Moxa Arch in Wyoming (fig. 8). Most helium in Kansas is thought to come from the Precambrian basement, which is brought closer to the surface by the Central Kansas Uplift. Numerous “hot shales” that thicken into the Cherokee-Forest City Basin in eastern Kansas may contribute to shallower production. The two large focus areas in central and eastern Kansas (Kansas and High Plains) outline areas of potential helium resources in the Precambrian basement and shales (fig. 8).
Magnesium
Importance to the Nation’s Economy
The following two subsections describing factors indicating the importance of magnesium compounds to the Nation’s economy are quoted from the “Mineral Commodity Summaries 2021” (U.S. Geological Survey, 2021a, p. 100–101).
Domestic Production and Use: Seawater and natural brines accounted for about 70% of U.S. magnesium compound production in 2020. The value of shipments of all types of magnesium compounds was estimated to be $360 million, essentially unchanged from the revised value in 2019. Magnesium oxide and other compounds were recovered from seawater by one company in California and another company in Delaware, from well brines by one company in Michigan, and from lake brines by two companies in Utah. Magnesite was mined by one company in Nevada. One company in Washington processed olivine that was mined previously for use as foundry sand. About 67% of the magnesium compounds consumed in the United States was used in agricultural, chemical, construction, deicing, environmental, and industrial applications in the form of caustic-calcined magnesia, magnesium chloride, magnesium hydroxide, and magnesium sulfates. The remaining 33% was used for refractories in the form of dead-burned magnesia, fused magnesia, and olivine.
World Resources: Resources from which magnesium compounds can be recovered range from large to virtually unlimited and are globally widespread. Identified world magnesite and brucite resources total 12 billion tons and several million tons, respectively. Resources of dolomite, forsterite, magnesium-bearing evaporite minerals, and magnesia-bearing brines are estimated to constitute a resource of billions of tons. Magnesium hydroxide can be recovered from seawater. Serpentine could be used as a source of magnesia but global resources, including in tailings of asbestos mines, have not been quantified but are thought to be very large.
Mode of Occurrence
Magnesium is produced from both minerals and brines. Magnesite (MgCO3) occurs as crystalline lenses or disseminations in ultramafic rocks, typically mixed with talc replacing dunite or serpentinized dunite (Bodenlos and Thayer, 1973). Forsterite, the magnesium-rich end member of olivine [(Mg,Fe)2SiO4], is the main constituent of dunite and serpentinite. Olivine easily weathers in the presence of CO2 producing secondary carbonates, including magnesite. Thus, carbonation of peridotite and other ultramafic rocks during metamorphism results in the formation of magnesite. A cryptocrystalline form of magnesite, also known as bone magnesite, occurs in serpentinized ultramafic rocks and generally forms smaller deposits than crystalline magnesite.
Magnesite also precipitates along with dolomite in both marine and lacustrine evaporites. Magnesium occurs in salts associated with potash deposits primarily as the minerals carnallite (KMgCl3•6H2O), kainite (MgSO4•KCl•3H2O), langbeinite [K2Mg2(SO4)3], and polyhalite [(K2Ca2Mg(SO4)4•2H2O)]. Magnesium is the third most common cation in brines after sodium and calcium (Blondes and others, 2018). However, brine geochemistry is a complex function of dissolution of evaporites, water-rock interactions, mixing, and other factors (Kharaka and Hanor, 2014).
Mineral Systems for Magnesium Resources
Magnesium occurs in several different mineral systems, including both lacustrine and marine evaporites as well as magnesite deposits mainly associated with altered untramafic rocks (fig. 9, table 10). Some skarn deposits associated with porphyry Cu-Mo-Au systems also host magnesite deposits.
Lacustrine Evaporite
Magnesium has been commercially produced from brines in the Great Salt Lake within the Bonneville Basin of Utah since 1972 (fig. 9). Naturally occurring magnesium chloride in the lake is concentrated by solar evaporation. The magnesium concentration in the lake is variable but averages 0.45 weight percent magnesium (Tripp, 2009).
Marine Evaporite
Intracratonic marine basins contain magnesium salts associated with potash deposits (fig. 9). In the intracratonic Paradox Basin, the Paradox Member of the Middle Pennsylvanian Hermosa Formation contains halokinetic potash-bearing salt comprised of sylvite and carnallite along with halite, dolomite, and anhydrite. Carnallite and langbeinite occur as potash minerals in other marine basins, such as the Permian, High Plains, and Williston basins (Orris and others, 2014).
Sabkha dolomite deposits such as the high-Mg dolomite in the Florida Mountains of New Mexico represent another potential source of magnesium (McLemore and Austin, 2017). American Magnesium LLC is developing plans to quarry dolomite at the Foothills Dolomite deposit near Deming, New Mexico, and process it into magnesium metal at a local mill (Keeven and Torrez, 2020).
Meteoric Recharge
In a meteoric recharge system, dissolved carbon dioxide in meteoric groundwater can alter magnesium silicate minerals, such as olivine in ultramafic rocks, to form cryptocrystalline magnesite deposits. Focus areas for magnesite can thus be coincident with focus areas for mafic magmatic deposit types that host chromite because of their similar host rocks. Examples include the peridotite and serpentinite belts in California and the State Line district associated with the Baltimore Mafic Complex in Maryland and Pennsylvania (fig. 9). These types of deposits were mined for magnesite in the past but are much less important now that the technology is available for magnesium production from brines and seawater. In addition to the exposed deposits in the State Line district and Blue Ridge belts, geophysical anomalies indicate buried mafic rocks in Triassic basins in the southeastern United States (fig. 9) that could host ultramafic and mafic magmatic deposits, which could subsequently alter to magnesite.
Porphyry Cu-Mo-Au
The Premier mine at Gabbs, Nevada, is the only (2021) active magnesite mine in the United States. This area was explored and drilled in the 1940s for magnesia production during the Second World War (fig. 9). Both magnesite and brucite were produced in the 1940s. The deposit is in Mesozoic carbonate rocks in the Walker Lane terrain in western Nevada that surround a granodiorite intrusion. Skarn magnesite deposits formed at intrusion contacts with dolomite of the Triassic Luning Formation. Magnesite currently produced from the Premier mine is mainly used for animal feed supplements and acid neutralizers. As of 2018, Premier Magnesia, Inc., estimated a mine life of 70 years, with additional reserves and resources and the potential for re-mining waste piles (Harding, 2018).
Other skarn magnesite deposits that produced magnesium in the past include the Currant Creek mining district in Nevada and a 30-mile-long belt in Stevens County, Washington, that produced about 5 million short tons of magnesite between 1916 and 1954 (Campbell and Loofbourow, 1962).
Table 10.
Examples of mineral systems, deposit types, and focus areas for magnesium resources in the conterminous United States.[*, mineral systems and deposit types most likely to represent significant sources of magnesium. See Hofstra and Kreiner (2020) for detailed descriptions of mineral systems and deposit types. Au, gold; Cr, chromium; Cu, copper; Fm, formation; Mg, magnesium; Mo, molybdenum]
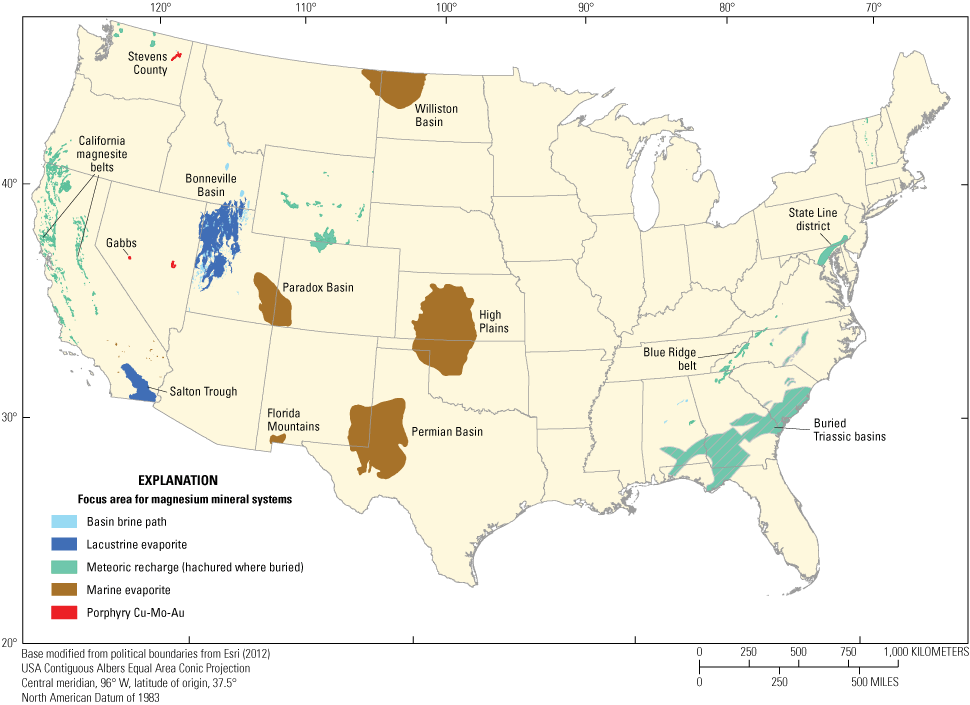
Map showing mineral system focus areas for magnesium resources in the conterminous United States. Au, gold; Cu, copper; Mo, molybdenum.
Manganese
Importance to the Nation’s Economy
The following two subsections describing factors indicating the importance of manganese to the Nation’s economy are quoted from the “Mineral Commodity Summaries 2021” (U.S. Geological Survey, 2021a, p. 104–105).
Domestic Production and Use: Manganese ore containing 20% or more manganese has not been produced domestically since 1970. Manganese ore was consumed mainly by six firms with plants principally in the East and Midwest. Most ore consumption was related to steel production, either directly in pig iron manufacture or indirectly through upgrading the ore to ferroalloys. Manganese ferroalloys were produced at two plants. Additional quantities of ore were used for such nonmetallurgical purposes as production of dry cell batteries, in fertilizers and animal feed, and as a brick colorant.
World Resources: Land-based manganese resources are large but irregularly distributed; those in the United States are very low grade and have potentially high extraction costs. South Africa accounts for about 40% of the world’s manganese reserves, and Brazil accounts for about 20%.
Mode of Occurrence
Manganese occurs in land-based deposits of ancient marine sedimentary rocks, banded iron formations, supergene manganese deposits, and seabed deposits of ferromanganese nodules and crusts (Cannon and others, 2017). Major manganese ore minerals include rhodochrosite (MnCO3), cryptomelane (K(Mn4+, Mn2+)8O16), manganite (MnO(OH)), and pyrolusite (MnO2). Supergene manganese deposits represent an important global source of manganese. These deposits form where groundwater chemically reacts with manganese-enriched rocks to leach out other components, leaving residual and small but relatively high-grade manganese ore bodies. Manganese oxide deposits associated with volcanogenic seafloor systems occur in modern seafloor settings and on land where rocks formed by ancient seafloor hydrothermal activity are preserved. An extensive manganese resource lies within the United States Exclusive Economic Zone offshore of the Atlantic and Pacific Coasts, including Alaska and Hawaii, where ferromanganese crusts and lesser volumes of nodules are known. However, these offshore areas are not quantified as manganese resources, and the technological challenges and economics of seabed mining have not yet been demonstrated. Thus, these areas are not included in this study.
Mineral Systems for Manganese Resources
Manganese occurs in various mineral systems as principal commodities in some deposit types and as potential byproducts in others. Focus areas for the major mineral systems that include manganese are shown in figure 10. See table 11 for examples of focus areas for the different deposit types within these systems.
Chemical Weathering
Potential areas of interest for supergene manganese deposits in the Eastern United States are along the Valley and Ridge area of the southern Appalachian Mountains (fig. 10). Manganese mining peaked in the United States in the early 1900s in the Blue Ridge and central Shenandoah Valley (Stose and others, 1919). A recent study on the origin of manganese oxide deposits in the Appalachian Valley and Ridge of northeastern Tennessee and northern Virginia noted the proximity of all deposits to faults or deformation zones. The conclusion was that local supergene or biological processes remobilized manganese from a deep-seated primary source (Carmichael and others, 2017). The Valley and Ridge focus area includes these areas and an area in eastern West Virginia previously outlined as permissive for undiscovered supergene manganese deposits (Cannon and others, 1994).
In the Southwestern United States, focus areas for manganese in chemical weathering systems largely coincide with porphyry Cu-Au-Mo systems. Hundreds of manganese occurrences, including small past-producing mines, represent both primary replacement and vein manganese deposits associated with porphyry systems as well as supergene deposits and gossans that formed as those deposits were exposed and weathered.
In Nevada, the Golconda manganese-iron hot-spring deposit was mined for manganese in 1918 and tungsten in the 1940s (Kerr, 1940). The deposits occur above the former Pleistocene Lake Lahontan shoreline and probably formed where the lake and groundwater levels were high. The deposit is young (<50,000 years), <5 meters thick, and characterized by manganese oxides (Hollister and others, 1992). Though not a significant manganese resource, Golconda (fig. 10) is an example of an unusual type of manganese deposit that may occur elsewhere. The ore is anomalous in containing other critical minerals such as cobalt, beryllium, tungsten, and germanium (University of Nevada, Reno, and Nevada Bureau of Mines and Geology, 2012).
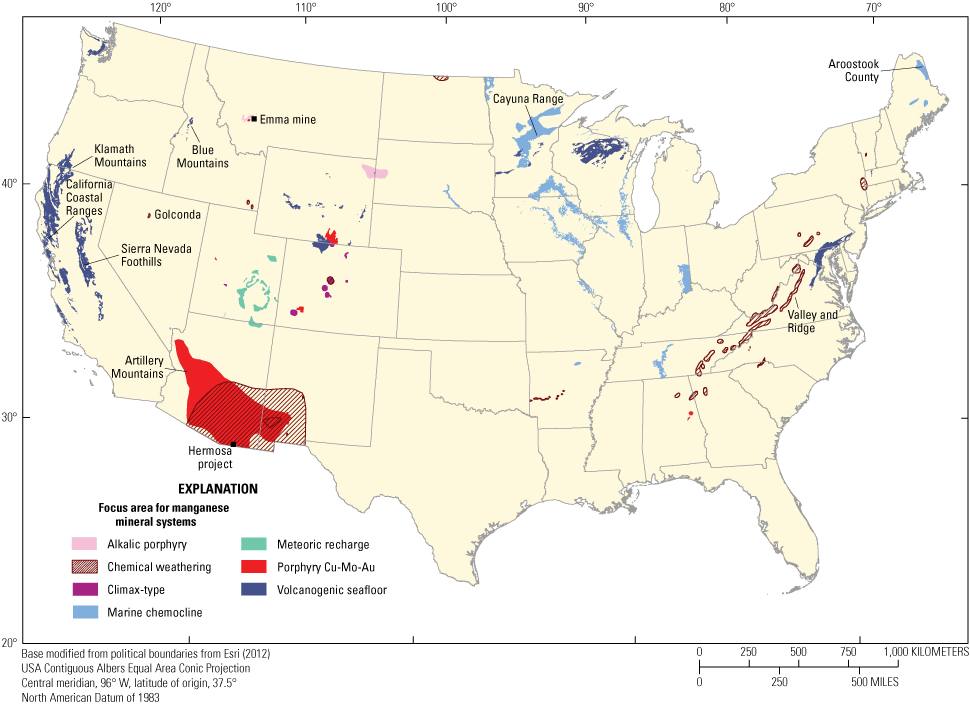
Map showing mineral system focus areas for manganese resources in the conterminous United States.
Marine Chemocline
Iron-manganese deposits also form where chemical gradients along ocean chemoclines result in the precipitation of manganese and iron oxides along with carbonates and silicates. A 50-kilometer (km)-long discontinuous belt of manganese deposits in Aroostook County, Maine, is an example of this type of deposit (fig. 10). The Maine deposits are large, with about 300 Mt of ore. However, an economic analysis showed that these low-grade ores (about 9 percent manganese) were not economically viable in the 1980s owing to the costs of mining, beneficiation, and transportation (Kilgore and Thomas, 1982). No further work has been done on these resources.
Other examples of marine chemocline iron-manganese deposits include Precambrian iron formations in the Lake Superior region, such as the Cuyuna Range in Minnesota that produced manganiferous iron ore until 1984 (Cannon and others, 2017).
Volcanogenic Seafloor
Manganese oxide (layers, crusts, and nodules) deposits in the Sierra Nevada foothills, the Klamath Mountains of northern California and Oregon, the Blue Mountains island arc of western Idaho, and the Artillery Mountains of Arizona represent remnant seafloor deposits. Before 1957, approximately 175 locations in California produced 263,000 short tons of manganese (Davis, 1957). No recent mining or exploration activity for manganese, however, has occurred in these areas.
Other
Manganese is a potential byproduct in polymetallic sulfide skarn, vein, replacement, and epithermal deposits in porphyry Cu-Mo-Au, Climax-type, and alkalic porphyry systems. The Emma manganese mine (fig. 10) near Butte, Montana, is an example of a relatively small (1 Mt) but high-grade (18 percent manganese) deposit associated with a porphyry system (Kilgore and Thomas, 1982). Active exploration and project development at the Hermosa project in Arizona (fig. 10) is currently being advanced by the South32 company with a combined measured, indicated, and inferred mineral resource of 65.3 Mt at an average grade of 2.2 percent zinc, 2.3 ounces per ton silver, and 9.5 percent manganese for an oxidized carbonate replacement deposit that overlies a zinc-lead-silver deposit (Methven and others, 2018). Some sandstone uranium deposits in meteoric recharge systems contain manganese, in addition to uranium and vanadium.
Table 11.
Examples of mineral systems, deposit types, and focus areas for potential manganese resources in the conterminous United States.[*, mineral systems and deposit types most likely to represent significant sources of manganese. See Hofstra and Kreiner (2020) for detailed descriptions of mineral systems and deposit types]
Potash
Importance to the Nation’s Economy
The following two subsections describing factors indicating the importance of potash to the Nation’s economy are quoted from the “Mineral Commodity Summaries 2021” (U.S. Geological Survey, 2021a, p. 126–127).
Domestic Production and Use: In 2020, the estimated sales value of marketable potash, free on board (f.o.b.) mine, was $430 million, which was 10% higher than that in 2019. Potash denotes a variety of mined and manufactured salts that contain the element potassium in water-soluble form. In agriculture, the term potash refers to potassic fertilizers, which are potassium chloride (KCl), potassium sulfate or sulfate of potash (SOP), and potassium magnesium sulfate (SOPM) or langbeinite. Muriate of potash (MOP) is an agriculturally acceptable mix of KCl (95% pure or greater) and sodium chloride for fertilizer use. The majority of U.S. production was from southeastern New Mexico, where two companies operated two underground mines and one deep-well solution mine. Sylvinite and langbeinite ores in New Mexico were beneficiated by flotation, dissolution-recrystallization, heavy-media separation, solar evaporation, and (or) combinations of these processes, and accounted for about 50% of total U.S. producer sales. In Utah, two companies operated three facilities. One company extracted underground sylvinite ore by deep-well solution mining. Solar evaporation crystallized the sylvinite ore from the brine solution, and a flotation process separated the MOP from byproduct sodium chloride. The firm also processed subsurface brines by solar evaporation and flotation to produce MOP at its other facility. Another company processed brine from the Great Salt Lake by solar evaporation to produce SOP and other byproducts.
The fertilizer industry used about 85% of U.S. potash sales, and the remainder was used for chemical and industrial applications. About 65% of the potash produced was SOPM and SOP, which are required to fertilize certain chloride sensitive crops. The remaining 35% of production was MOP and was used for agricultural and chemical applications.
World Resources: Estimated domestic potash resources total about 7 billion tons. Most lie at depths between 1,800 and 3,100 meters in a 3,110-square-kilometer area of Montana and North Dakota as an extension of the Williston Basin deposits in Manitoba and Saskatchewan, Canada. The Paradox Basin in Utah contains resources of about 2 billion tons, mostly at depths of more than 1,200 meters. The Holbrook Basin of Arizona contains resources of about 0.7 to 2.5 billion tons. A large potash resource lies about 2,100 meters under central Michigan and contains more than 75 Mt. Estimated world resources total about 250 billion tons.
Mode of Occurrence
Potash is the term applied to a variety of water-soluble potassium-rich minerals and rocks. Potash includes various chloride and sulfate minerals, but the most common potash minerals are sylvite (KCl) and carnallite (KMgCl3•6H2O). Primary potash ore materials are mixtures of halite (NaCl) and potassium minerals. Sylvinite is the term for mixtures of halite and sylvite; carnallitite is the term for mixtures of halite and carnallite.
Potash occurs in evaporite sequences in pre-Quaternary sedimentary basins and brines (Orris and others, 2014). Stratabound potash-bearing salt deposits are preserved in flat-lying, undeformed salt and evaporite rocks. Potash also occurs where such salt beds were deformed by halokinesis, creating salt domes or other salt structures, and in basins with mixtures of undeformed and deformed salt. Potash-bearing brines in Pliocene to Quaternary closed continental basins are another major source of potash. Lithocap alunite [KAl3(SO4)2(OH)6] deposits that form in porphyry and Climax-type systems commonly contain potassium sulfate minerals. These deposit types are not major sources of potash, but some alunite deposits produced byproduct potassium sulfate.
Potash can be mined using underground or solution-mining methods. Underground mining in salt is unsafe below depths of 3,600 feet (ft). Therefore, deep deposits are typically mined using solution mining (Halabura and Hardy, 2007).
Mineral Systems for Potash Resources
Potash deposits can occur in several mineral systems (table 12). Focus areas for the major potash-bearing basins in the United States are shown in figure 11, along with point locations for sites with active or recent potash production or exploration.
Lacustrine Evaporite
Lacustrine evaporite systems operate in closed drainage basins in arid to hyperarid climates where elements in meteoric surface, ground, and geothermal recharge waters are concentrated by evaporation. As salinity increases, evaporite minerals typically precipitate in the following sequence: gypsum or anhydrite, halite, sylvite, carnallite, borate. Residual brines enriched in lithium and other elements often accumulate in aquifers below dry lake beds (Hofstra and Kreiner, 2020). In these systems, potash can occur in evaporite minerals and residual brines.
Potash and magnesium are currently produced at the Great Salt Lake and the Bonneville Salt Flats in the Bonneville Basin of Utah (fig. 11). The Great Salt Lake Minerals Corporation uses solar evaporation ponds to produce more than 360,000 t of potassium sulfate annually from surface brines (Rupke, 2012). The Bonneville Salt Flats deposit is estimated to have a 30-year mine life (Mills and Rupke, 2020). The Sevier Lake playa has an estimated in-place resource of 36 Mt of potassium sulfate in shallow brine (Brebner and others, 2018). Evaporation ponds are used to precipitate potash minerals at all of Utah’s processing facilities.
Potash was produced in the early 1900s from the Searles Lake area in the California lithium and potash focus area (fig. 11). Resources at Searles Lake are estimated at 32 Mt of K2O (British Sulphur Corporation Limited, 1984). The Salton Sea geothermal brines in the southernmost part of the California lithium and potash area have an average potassium concentration of 14,000 milligrams per liter (mg/L); however, no estimates of potassium resources have been made.
Marine Evaporite
Marine evaporite systems operate in shallow, restricted, epicontinental basins in arid to hyperarid climatic zones where elements present in seawater are concentrated by evaporation. As salinity increases, evaporite minerals typically precipitate in the following sequence: gypsum or anhydrite, halite, sylvite. Potash deposits in marine evaporite basins represent significant identified and potential domestic resources. Examples include the Michigan Basin (fig. 11), which produced potash from brine from 1952 to 1970; solution mining at the Hersey mine produced up to 160,000 short tons of potash annually until the mine was decommissioned in 2014. As of 2020, plans were underway to operate additional solution mines in the basin. The southern part of the areally extensive Williston Basin extends from Canada southward into northern North Dakota (fig. 11). The currently productive part of the basin is in Canada; however, the Devonian Prairie Formation in North Dakota is estimated to contain 50 Gt of potash (Anderson and Swinehart, 1979). Potash occurs in six stratigraphic horizons of the Prairie Formation in North Dakota. Maps were made showing the distribution, thickness, and potassium contents estimated from gamma-ray intensities for these formations in northwestern North Dakota (Kruger, 2014; S. Box, USGS, written commun., 2020). Circa 2010, several companies were exploring for sylvinite and carnallite in North Dakota (Wetzel, 2012), but no development has occurred. The North Dakota potash deposits occur at depths that exceed 5,600 ft; therefore, solution mining rather than conventional underground mining is required (Kruger, 2014).
In the Paradox Basin in southeastern Utah and southwestern Colorado (fig. 11), sylvinite ore is mined using solution mining from deeply buried evaporite deposits having proven and probable reserves estimated to last 100 years (Mills and Rupke, 2020). The western part of the Permian Basin in southeastern New Mexico (fig. 11) produces most of the potash in the United States—from sylvinite and langbeinite—from the Permian Salado Formation (U.S. Geological Survey 2021a; Orris and others, 2014).
Other marine basins that host salt deposits are permissive for the occurrence of potash but have not produced potash (Orris and others, 2014). These include Silurian Salina Group strata in the High Plains area of Kansas (fig. 11), where several Permian formations host extensive salt beds containing minor amounts of K2O; however, no potash production has occurred.
Climax-Type
Climax-type systems occur in continental rifts with hydrous bimodal magmatism. Aqueous supercritical fluids exsolved from anorogenic topaz rhyolite plutons, and the apices of subvolcanic stocks, form a variety of deposit types as the supercritical fluids move upward and outward, split into liquid and vapor phases, react with country rocks, and mix with groundwater. Lithocap alunite deposits form in the advanced argillic alteration stages of epithermal activity in the uppermost parts of the system, typically above, or offset from, the causative intrusion. Blawn Mountain, Utah (fig. 11), is a Climax-type porphyry molybdenum system with a well-developed alunite lithocap and represents the largest known alunite resource in the United States. In addition to alunite resources, the deposit has an identified resource of 32 Mt of K2SO4 (Kerr and others, 2017; SOPerior Fertilizer Corp., 2019).
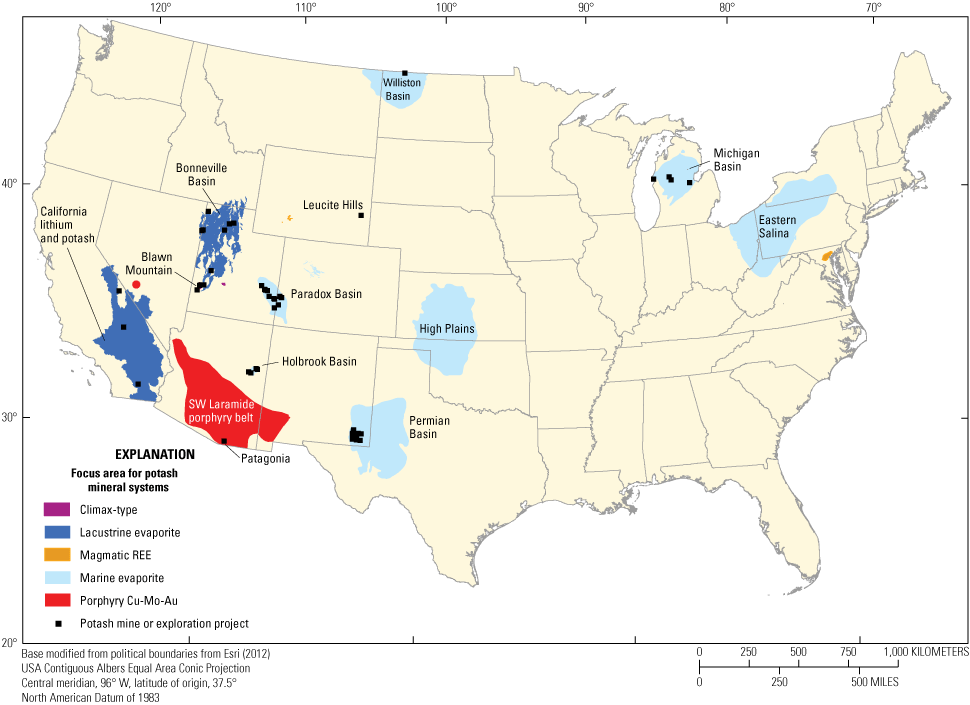
Map showing mineral system focus areas for potash resources in the conterminous United States. Potash deposits from Orris and others (2014). Au, gold; Cu, copper; Mo, molybdenum; REE, rare earth element; SW, southwest.
Other Systems
Potash-bearing lithocap alunite deposits also formed in some porphyry copper systems in the Southwestern United States. Drilling at the Patagonia alunite property in the Southwest Laramide porphyry belt (fig. 11) in Arizona in the 1970s resulted in a preliminary (noncompliant) resource estimate of 303 Mt of mineralized material, averaging 30 percent alunite, for potential recovery of alumina and potassium sulfate (North American Potash Developments, Inc., 2012). In Wyoming, the Leucite Hills ultrapotassic mafic volcanic rocks (lamproites) were mined during World War I for KCl to use in fertilizer (Thoenen, 1932; Hausel, 2006). These rocks represent an unusual example of deposits classified as “peralkaline syenite/granite/rhyolite/alaskite/pegmatites” in Magmatic REE systems.
Table 12.
Examples of mineral systems, deposit types, and focus areas for potential potash resources in the conterminous United States.[*, mineral systems and deposit types most likely to represent significant sources of potash. See Hofstra and Kreiner (2020) for detailed descriptions of mineral systems and deposit types. Mtn.; mountain; SW, southwest]
Uranium
Importance to the Nation’s Economy
Uranium is used to fuel nuclear reactors, which provide about 20 percent of the electricity produced in the United States (U.S. Energy Information Administration [EIA]), (EIA 2021a). In 2019, U.S. requirements to fuel domestic reactors were the largest globally, comprising about 26 percent of world requirements (International Atomic Energy Agency and Nuclear Energy Agency [IAEA–NEA]), (IAEA–NEA, 2020). The United States currently imports almost all the uranium used in domestic reactors. Identifying domestic uranium resources is crucial to ensure the continued production of electricity from existing nuclear power plants should there be an interruption of the international uranium supply.
Domestic Production and Use
In 2019, 0.17 Mlb of U3O8 concentrate was produced from U.S. uranium mines (EIA, 2020a). This quantity represents 76 percent less production than the previous year (2018) and is the lowest domestic production since at least 1950 (EIA, 2021b). In 2019, U.S. civilian nuclear power owners-operators purchased 48 Mlb of U3O8 averaging $35.59 per pound (EIA, 2020b). Most of this uranium was of foreign origin, primarily from Kazakhstan, Russia, Uzbekistan, Canada, and Australia. The EIA estimates the uranium requirements for civilian operated reactors over the next 10 years to be 388 Mlb of U3O8 (EIA, 2020b).
World Resources
Reasonably assured uranium resources in the United States are estimated by the EIA as 31 Mlb in the forward-cost category2 of <$30 per lb of U3O8; 206 Mlb of U3O8 in the <$50 per lb of U3O8 forward-cost category; and 389 Mlb in the <$100 per lb of U3O8 forward-cost category (EIA, 2020a). Total identified, recoverable world resources in the reasonably assured and inferred categories, as of January 1, 2019, was 5,200 Mlb of U3O8 in the <$30 per lb of U3O8 forward-cost category; 15,980 Mlb of U3O8 in the <$50 per lb of U3O8 forward-cost category; and 20,980 Mlb of U3O8 in the <$100 per lb of U3O8 forward-cost category (IAEA–NEA, 2020). Those countries with the largest percentage of world resources (in the <$50 per lb of U3O8 forward-cost category) in 2019 were Australia (28 percent), Kazakhstan (15 percent), Canada (9 percent), Russia (8 percent), and Namibia (7 percent) (IAEA, 2020). The United States contains 1 percent of world resources in this cost category (IAEA–NEA, 2020). However, this estimate is probably low because the assessment methodology used by the EIA does not comprehensively capture all identified U.S. uranium resources (EIA, 2020a).
Forward costs include power and fuel, labor, materials, insurance, severance and advalorem taxes, and applicable administrative costs. The forward costs used to estimate U.S. uranium ore reserves are independent of the price at which uranium produced from the estimated reserves might be sold in the commercial market. Reserves values in forward-cost categories are cumulative; that is, the quantity at each level of forward cost includes all reserves at the lower cost in that category (EIA, 2021a).
Six countries accounted for 88 percent of world production in 2018 (IAEA–NEA, 2020). These countries produced uranium from sandstone-type deposits in Kazakhstan (41 percent), high-grade unconformity-type deposits in Canada (13 percent), as a byproduct of copper mining the large Olympic Dam IOCG-type deposit and some sandstone-type uranium production in Australia (12 percent), calcrete and intrusive-type deposits in Namibia (10 percent), sandstone-type uranium deposits in Uzbekistan (6 percent), and mostly volcanic-related and some sandstone-type deposits in Russia (5 percent [1 percent lost to rounding]) (IAEA–NEA, 2020).
Mode of Occurrence
Uranium is found in many geological environments; the IAEA identifies fifteen uranium mineral systems (IAEA, 2020). As measured by total, reasonably assured resources in 2019, the relative importance of deposit types include (in descending order) sandstone, polymetallic breccia complex, Proterozoic unconformity, metasomatite, intrusive, paleo-quartz pebble conglomerate, surficial type (such as calcrete-hosted), volcanic, phosphate, granite, metamorphite, lignite-coal, collapse breccia and black shale type deposits (IAEA, 2020). Rankings change slightly when considering uranium mined in the past and estimated in situ resources. In this case, the most important deposits (in descending order) are phosphate, sandstone, polymetallic breccia complexes, metasomatite, quartz-pebble conglomerate, unconformity, metamorphite vein, intrusive, black shale, volcanogenic, calcrete, breccia-pipe, and lignite deposits (IAEA, 2021). Uranium production from lignite, coal, black shale, polymetallic breccia, and phosphate deposits is typically a byproduct of mining another commodity. The most important deposit types in the United States, based on a combination of factors including past production, known resources, and estimated (undiscovered) resources, are sandstone, phosphate, metasomatite, volcanogenic, breccia-pipe, and calcrete deposits. Due to their economics, other deposit types that may have significant resources but are unlikely to be developed in the immediate future are uranium in lignite and black shale.
Mineral Systems for Uranium Resources
Uranium occurs in a variety of different mineral systems. Note that for this study, the mineral systems and deposit types developed by Hofstra and Kreiner (2020) are correlated with the IAEA classification (described above) shown in table 13. For example, the IAEA (2020) classification “9.1–Sandstone and all the associated subtypes” are included in the meteoric recharge mineral system as sandstone uranium deposits. This system’s other deposit types are IAEA “12–Lignite-coal” and “13–Carbonate (stratabound, cataclastic, and paleokarst).” The IAEA “4–Volcanic-related deposits” are included in the Climax-type mineral system as volcanogenic uranium deposits (IAEA, 2020). See figure 12 and table 14 for selected examples of uranium focus areas. Key focus areas mentioned in the text are labeled in figure 12.
Table 13.
Correlation of the Earth Mapping Resources Initiative mineral system and deposit-type framework with the International Atomic Energy Agency (IAEA) classification (IAEA, 2020).[See Hofstra and Kreiner (2020) for detailed descriptions of mineral systems and deposit types. IAEA, International Atomic Energy Agency; IOA, iron oxide-apatite; IOCG, iron oxide-copper-gold; REE, rare earth element]
Basin Brine
Basin brine systems can host unconformity and breccia pipe uranium deposits. No unconformity-type uranium deposits have been recognized in the United States, although they are important in Canada and Australia. These systems can form sediment-hosted and replacement copper deposits that contain potential byproduct uranium and vanadium.
The focus area for Northwest Arizona uranium breccia pipes (fig. 12) outlines an area in the Grand Canyon region that includes hundreds of solution-collapse breccia pipes (Van Gosen and others, 2016). After six decades of exploration, however, only a small percentage that contains significant mineralization has been found. Thirteen breccia deposits were mined for uranium from the 1950s to the present; most are mined out and reclaimed (Alpine, 2010). Development of a copper-uranium-bearing breccia pipe at the Canyon Mine, including the construction of a mine shaft, was completed in 2018; mining is inactive pending higher uranium oxide prices (Van Gosen and others, 2020a, 2020b). Geochemical and mineralogical analyses of uranium ores from former mines confirmed previous data showing that the ores are enriched in uranium oxide as well as copper, arsenic, cobalt, lead, nickel, and zinc minerals (Wenrich, 1985; Van Gosen and others, 2020a, 2020b, 2020c). The largest production is from the Hack II deposit, which produced 7 Mlb of uranium oxide (Otton and Van Gosen, 2010). The mined deposits had production numbers that ranged from 428,000 lb of uranium oxide to the 7 Mlb of the Hack II deposit, with average grades ranging from 0.44 to 1.08 percent U3O8.
Chemical Weathering
Chemical weathering systems operate in stable areas of low to moderate relief with sufficient rainfall, where the downward percolation of surface water in the unsaturated zone chemically dissolves and concentrates elements present in various rock types and mineral occurrences. Chemical gradients cause different elements to be concentrated at different positions in a weathering profile and at the water table. Dissolved uranium in this setting is reduced on carbonaceous material in lakes and swamps (Hofstra and Kreiner, 2020).
Uranium occurs in chemical weathering systems in surficial and lacustrine deposits and coal. In the southwestern part of the Williston Basin, uranium occurs in carbonaceous shale and lignite throughout multiple horizons of Upper Cretaceous, Paleocene, and Eocene rocks more than 2,500 ft thick (Denson and others, 1965). In North and South Dakota, uranium was produced from lignites in the Paleocene Fort Union Formation. In North Dakota, blanket-type mineralization ranges from 100 to 700 parts per million U, with irregular, higher grade pods from <0.1 to 0.29 percent U3O8, and in South Dakota, grades range from 0.1 to 0.4 percent U3O8 for mined lignite, with maximum values of up to 2.8 percent U3O8 (Dahlkamp, 2010).
The Fort Union Formation extends into eastern Montana, where Paleocene and late Cretaceous lignite and coal beds are widespread, but uranium resources are low-grade based on reconnaissance studies (Boberg, 1975). Uranium-bearing lignite beds 1.5–8 ft thick occur in the Fort Union Formation of the southern part of the Ekalaka Hills, where surface outcrops indicated about 16.5 Mt of subsurface uranium-bearing lignite. The uranium content of the lignite beds ranges from 0.001 to 0.034 percent uranium, the average being about 0.005 percent (Gill, 1959).
Climax-Type
Volcanogenic uranium deposits in the Western United States produced uranium in the 1950s and in areas of Colorado until the 1980s. Orebodies at the Los Ochos mine in the Cochetopa areas in Colorado are in brecciated and silicified sandstones and mudstones of the Junction Creek and Morrison Formations and in Precambrian schist. The genesis of the deposits is unclear, but based on work by Olson (1988), who identified Oligocene volcanic rocks as the possible source of uranium, a tentative assignment of volcanogenic uranium (IAEA volcanic-related structure-bound deposit type) is assigned to this area. The Los Ochos mine produced about 1.25 Mlb of U3O8 between 1976 and 1981 (T.C. Pool, USGS volunteer with Central Energy Resources Science Center in Denver, written commun., 2017). Before 1971, the Los Ochos Group produced 448,685 t of ore at 0.14 percent U3O8, producing 1,253,513 lb of U3O8 (Nelson-Moore and others, 1978).
Arizona’s Date Creek focus area includes prospective lake deposits of the Artillery Peak-Date Creek Basin and encompasses the Artillery Peak and Anderson deposits. The Anderson deposit, hosted in Miocene tuffaceous lakebed sediments, had minor historical production (Lindblom and Young, 1958); recent exploration identified an NI 43–101 compliant indicated resource of 15.5 Mlb of U3O8 and an inferred resource of 2.5 Mlb of U3O8 (Davis and Sim, 2012).
Other examples of volcanogenic uranium deposits include structurally controlled deposits associated with Miocene volcanic rocks in the Lakeview focus area in Oregon and veins and tabular uranium orebodies associated with the McDermitt caldera in Nevada (fig. 12).
Iron Oxide-Apatite and Iron Oxide-Copper-Gold (IOA-IOCG)
The Southeast Piedmont Rift Zones focus area (fig. 12) is delineated for an unusual type of uranium deposit, classified for this study as albitite uranium. The deposit type is based on a genetic model for the Coles Hill deposit in the Piedmont physiographic province of Virginia (Hall and others, 2022). The Coles Hill uranium deposit model indicates favorable areas for concealed mineralization along structural zones adjacent to Triassic basins in the Eastern United States. The type-deposit is the undeveloped Coles Hill deposit with an NI 43–101 compliant indicated resource of 132 Mlb of U3O8 (119 Mt at 0.056 percent eU3O8 using a 0.25 percent eU3O8 cutoff) and an inferred resource of 30 Mlb of U3O8 (36 Mt at 0.042 percent eU3O8 using a 0.025 percent eU3O8 cutoff) (Kyle and Beahm, 2013), making it the largest unmined uranium deposit in the United States.
Meteoric Recharge
Calcrete uranium deposits formed by regional groundwater evaporation occur in Pliocene to Pleistocene sediments in the Southern High Plains physiographic province (Hall and others, 2019). The Southern High Plains focus area (fig. 12) comprises the prospective and favorable assessment tracts of an undiscovered resource assessment of this region and includes 15 known occurrences, 2 of which have estimated historical in-place resources (Van Gosen and Hall, 2017). Two calcrete uranium deposits discovered within the focus area in Texas (Sulphur Springs Draw and Buzzard Draw) represent the first identified occurrences of this deposit type in the United States (Van Gosen and Hall, 2017). The deposits have historic non-NI 43–101 compliant drill-delineated resources of about 2.1 Mt of ore with an average grade of 0.037 percent U3O8 (Sulphur Springs Draw) and another deposit of about 0.93 Mt of ore averaging 0.047 percent U3O8 (Buzzard Draw) (Van Gosen and Hall, 2017).
Carbonate uranium occurrences and mines in the Todilto Limestone in the Grants uranium district, New Mexico (fig. 12), produced 6.6 Mlb of U3O8 between 1950 and 1981; many deposits remain undeveloped in the area (McLemore, 2011).
The most important uranium deposit type in the United States is the sandstone-hosted deposit. Forty-eight focus areas are delineated for sandstone uranium deposits, mostly in areas with historical uranium production of Utah, Colorado, Wyoming, and Texas. A few focus areas include currently (2021) productive uranium mines or have modern identified resources. Triassic, Jurassic, Cretaceous, and Tertiary clastic sediments in basins in Wyoming, Colorado, Nebraska, New Mexico, Utah, and Texas host significant roll-front and tabular sandstone deposits. More than 240 mines in the Uravan district in Colorado and Utah produced significant amounts of uranium and vanadium prior to the late 1940s (Chenoweth, 1981).
Currently (2021) the only active uranium mining is from in situ recovery mines in Wyoming. There is only one active, conventional uranium mill (2021)—the White Mesa mill in Blanding, Utah—which is in the central portion of the Colorado Plateau uranium region (Boberg, 2010). The most important regions, based on past production and potential resources, are: (1) the Colorado Plateau (fig. 12), in which mineralization is mostly as tabular sandstone deposits in the Jurassic Morrison Formation and Triassic Chinle Formation, (2) Wyoming Basins including portions of Nebraska and South Dakota where roll-front type mineralization is hosted mostly in Paleocene Fort Union and Eocene Wasatch, Wind River, and Battle Spring Formations and the Cretaceous Inyan Kara Group, (3) the Texas Coastal Plain, throughout which roll-front type uranium deposits form in Eocene to Pliocene sediments (the Claiborne and Jackson groups, Catahoula Formation, Oakville and Goliad Sands, and Beaumont, Lissie, and Willis Formations), (4) the Denver Basin, in which roll-front deposits have been identified in the Cretaceous Fox Hill and Laramie Formations, but remain unmined, and (5) the Tallahassee Creek district, in which mixed sandstone and volcanic type deposits are hosted in a Tertiary graben that developed in the Rocky Mountains (Boberg, 2010, Chenoweth, 1981, Dahlkamp, 2010, Hall and others, 2017).
Other Systems
Phosphate and black shale deposits in marine chemocline systems represent another important system for uranium. Focus areas for these deposits include the Miocene-Pliocene phosphates along the eastern coast of the United States and broad areas of Pennsylvanian phosphate and black shale extending from Texas to New York (fig. 12). See the discussion of these deposits in the vanadium section of this report.
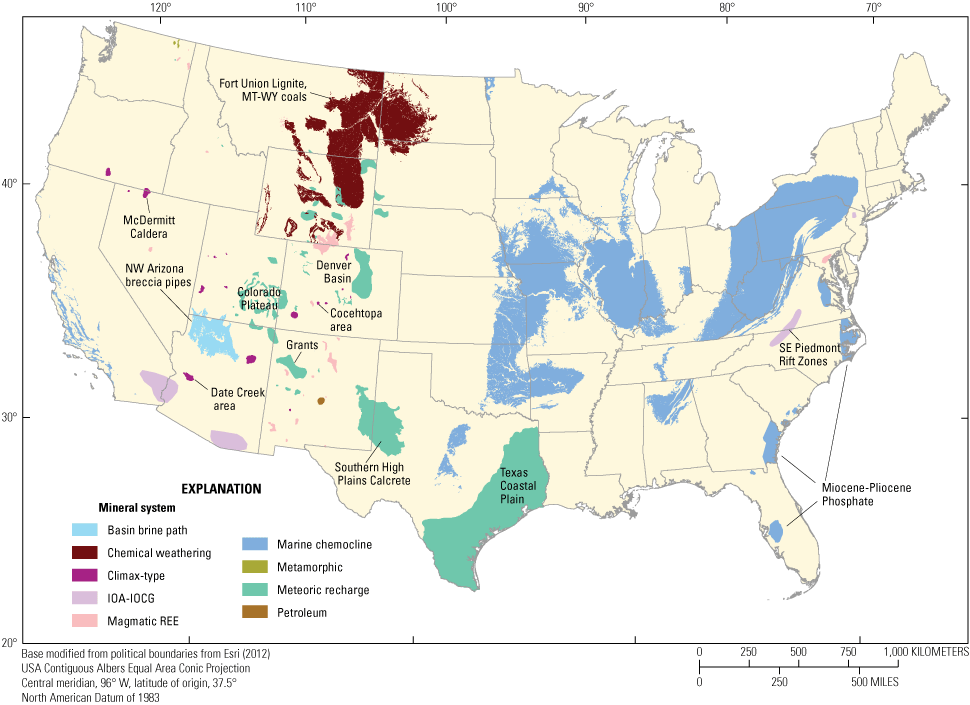
Map showing mineral system focus areas for uranium resources in the conterminous United States. IOA, iron oxide-apatite; IOCG, iron oxide-copper-gold; MT, Montana; NW, northwest; REEs, rare earth elements; SE, southeast; WY, Wyoming.
Table 14.
Examples of mineral systems, deposit types, and focus areas for uranium resources in the conterminous United States.[*, mineral systems and deposit types most likely to represent significant sources of uranium. See Hofstra and Kreiner (2020) for detailed descriptions of mineral systems and deposit types. IOA, iron oxide-apatite; IOCG, iron oxide-copper-gold; REE, rare earth element; SE, southeast]
Vanadium
Importance to the Nation’s Economy
The following two subsections describing factors indicating the importance of vanadium to the Nation’s economy are quoted from the “Mineral Commodity Summaries 2021” (U.S. Geological Survey, 2021a, p. 180–181).
Domestic Production and Use: Byproduct vanadium production in Utah from the mining of uraniferous sandstones on the Colorado Plateau ceased in the first quarter of 2020 owing to decreasing vanadium prices. An estimated 170 tons of contained vanadium with an estimated value of $1.4 million was produced in 2020. Secondary vanadium production continued primarily in Arkansas, Delaware, Ohio, Pennsylvania, and Texas, where processed waste materials (petroleum residues, spent catalysts, utility ash, and vanadium-bearing pig iron slag) were used to produce ferrovanadium, vanadium-bearing chemicals or specialty alloys, vanadium metal, and vanadium pentoxide. Metallurgical use, primarily as an alloying agent for iron and steel, accounted for about 94% of domestic reported vanadium consumption in 2020. Of the other uses for vanadium, the major nonmetallurgical use was in catalysts to produce maleic anhydride and sulfuric acid.
World Resources: World resources of vanadium exceed 63 million tons. Vanadium occurs in deposits of phosphate rock, titaniferous magnetite, and uraniferous sandstone and siltstone, in which it constitutes less than 2% of the host rock. Significant quantities are also present in bauxite and carboniferous materials, such as coal, crude oil, oil shale, and tar sands. Because vanadium is typically recovered as a byproduct or coproduct, demonstrated world resources of the element are not fully indicative of available supplies. Although domestic resources and secondary recovery are adequate to supply a large portion of domestic needs, almost all of U.S. demand is currently met by foreign sources.
Mode of Occurrence
Vanadium occurs in four main types of mineral deposits: (1) vanadiferous titanomagnetite (iron titanium oxide) deposits that form in mafic magmatic systems, (2) sandstone-hosted uranium-vanadium deposits in meteoric recharge systems, (3) black shales and phosphorites in marine chemocline systems, and (4) supergene base-metal vanadate deposits that form in oxidized zones of lead, zinc, and copper deposits in chemical weathering systems (Kelley and others, 2017).
Mineral Systems for Vanadium Resources
Vanadium can occur in several different minerals systems (table 15, fig. 13). However, most vanadium is recovered as a byproduct or coproduct of uranium production, such as the uraniferous sandstones of the Colorado Plateau.
Mafic Magmatic
Iron-titanium oxide deposits associated with mafic and ultramafic igneous rocks can host significant amounts of vanadium in vanadiferous titanomagnetite. Although these deposit types represent the largest global source of vanadium, few deposits in the United States have proven economic. The Sanford Lake district in New York produced titanium, iron, and vanadium from deposits hosted in anorthosite and gabbro from 1834 until 1982 (Tahawus, fig. 13). The Ossining mine in southeastern New York is another example. Before 1950, vanadium was produced as a byproduct of titanium mining in the San Gabriel Mountains anorthosite in California. Scattered occurrences of mafic and ultramafic rocks in the North-Central States are permissive for occurrences of these deposit types.
Marine Chemocline
Vanadium is enriched in black shales in many marine chemocline systems, primarily in Proterozoic and Phanerozoic marine settings associated with phosphorite deposits and marine oil shales (Kelley and others, 2017). The Gibellini and Carlin vanadium focus area includes two deposits with identified vanadium resources (fig. 13). The Gibellini vanadium project in Fish Creek, Eureka County, Nevada, targets thin-bedded shales of the Devonian Woodruff Formation in an allochthonous fault wedge along a 21-km northeast-trending vanadium belt. The project is designed as an open-pit heap leach operation. The deposit has NI 43–101 compliant measured and indicated resources of 22.95 Mt of ore at an average grade of 0.286 percent V2O5, with additional inferred resources at Gibellini and Louie Hill (Hanson and others, 2018). Production decisions are waiting on a 2021 environmental impact statement “record of decision” for the project (Silver Elephant Mining Corp., 2021). First Vanadium Corporation’s Carlin vanadium project in north-central Nevada also targets shales in the Woodruff Formation. The deposit is partly exposed, although most of the mineralization lies at shallow depths (60 m). An NI 43–101 compliant measured (24.64 Mt at 0.615 percent V2O5) and indicated resource (7.19 Mt at 0.520 percent V2O5) has been defined for the Carlin project at a cutoff grade of 0.3 percent V2O5 (Stryhas and others, 2019).
Vanadium-enriched black shales occur in other areas of the country, such as a broad belt of Devonian and Pennsylvanian black shales (for example, Mecca Quarry, fig. 13) in the Eastern and Central United States, but no resources have been identified. Phosphorite deposits, such as the regionally extensive Phosphoria Formation in the Western United States, also contain vanadium-enriched black shales.
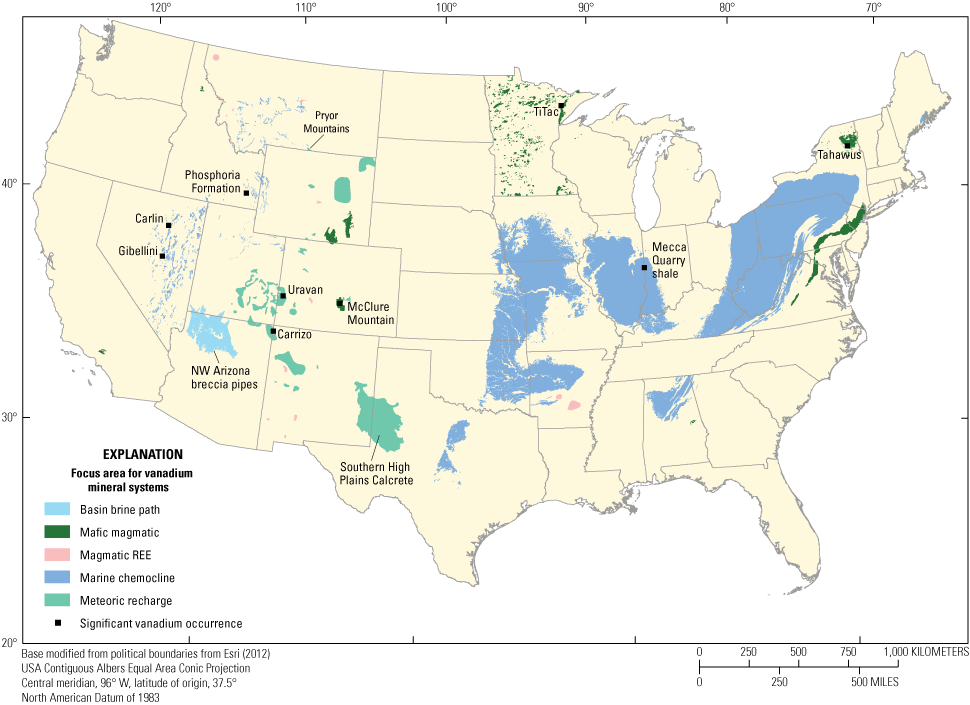
Map showing mineral system focus areas and significant occurrences for vanadium resources in the conterminous United States. Mineral occurrences from Labay and others (2017). REE, rare earth elements.
Meteoric Recharge
Carbonate uranium deposits occur as collapse breccia pipes within the Little Mountains district in Wyoming (Gregory, 2019) and deposits with a similar geology occur in the Pryor Mountains of Montana (fig. 13). In these deposits, uranium minerals with accompanying silica fill open space in solution collapse features in paleokarst developed in the Mississippian Madison Limestone (Van Gosen and others, 1996; Dahlkamp, 201030). The principal ore minerals of the Pryor Mountains deposits are the uranium-vanadium minerals tyuyamunite [Ca(UO2)2(VO4)2• 5-8H2O] and metatyuyamunite [Ca(UO2)2(VO4)2• 3H2O]. A quantitative mineral resource assessment by Van Gosen and others (1996) estimated that undiscovered carbonate uranium deposits in the Pryor Mountains area in Montana might contain a mean of 170 t of undiscovered uranium resources (U3O8) and 140 t of vanadium (V2O5). These amounts of potential undiscovered resources are comparable to the tonnages of uranium and vanadium produced in this area in the past. These deposits are small relative to many other uranium deposit types (Van Gosen and others, 1996).
Calcrete uranium deposits in the Southern High Plains physiographic province are permissive for the occurrence of vanadium (Hall and others, 2019). Although no vanadium resources are available for the known deposits, mineralogy indicates that vanadium occurs in the form of the minerals carnotite and finchite, a newly identified strontium-uranium-vanadium mineral (Spano and others, 2017; Van Gosen and Hall, 2017).
Many sandstone uranium deposits in the United States also produced vanadium in the past. The Shiprock area in northeastern New Mexico (Carrizo deposit, fig. 13) produced about 3.9 Mlb of U3O8 and 6,603 short tons of vanadium between 1948 and 1967 (McLemore, 2020). Thirty-two mines in the AEC Circle Cliffs ore-reserve area produced about 70,000 lb of U3O8 and 4 short tons of vanadium between 1951 and 1978 (T.C. Pool, USGS volunteer with Central Energy Resources Science Center in Denver, written commun., 2017). The Uravan district in Colorado and Utah includes more than 240 mines with significant historical production of both uranium and vanadium. Before 1947, about 1,700 t of U3O8 and 12,000 t of V2O5 were mined from the Uravan district (Chenoweth, 1981). Exploration activity continues in the Uravan focus area at the Wray Mesa uranium-vanadium project in southwestern Colorado (Hartman, 2019).
Table 15.
Examples of mineral systems, deposit types, and focus areas for potential vanadium resources in the conterminous United States.[*, mineral systems and deposit types most likely to represent significant sources of vanadium. See Hofstra and Kreiner (2020) for detailed descriptions of mineral systems and deposit types]
Zirconium and Hafnium
Importance to the Nation’s Economy
The following two subsections describing factors indicating the importance of zirconium and hafnium to the Nation’s economy are quoted from the “Mineral Commodity Summaries 2021” (U.S. Geological Survey, 2021a, p. 192–193).
Domestic Production and Use: In 2020, one firm recovered zircon (zirconium silicate) from surface-mining operations in Florida and Georgia as a coproduct from the mining of heavy-mineral sands and the processing of titanium and zirconium mineral concentrates, and a second company processed existing mineral sands tailings in Florida. Zirconium metal and hafnium metal were produced from zirconium chemical intermediates by one producer in Oregon and one in Utah. Zirconium and hafnium are typically contained in zircon at a ratio of about 36 to 1. Zirconium chemicals were produced by the metal producer in Oregon and by at least 10 other companies. Ceramics, foundry sand, opacifiers, and refractories are the leading end uses for zircon. Other end uses of zircon include abrasives, chemicals (predominantly, zirconium basic sulfate and zirconium oxychloride octohydrate as intermediate chemicals), metal alloys, and welding rod coatings. The leading consumers of zirconium metal are the chemical process and nuclear energy industries. The leading use of hafnium metal is in superalloys.
World Resources: Resources of zircon in the United States included about 14 million tons associated with titanium resources in heavy-mineral-sand deposits. Phosphate rock and sand and gravel deposits could potentially yield substantial amounts of zircon as a byproduct. World resources of hafnium are associated with those of zircon and baddeleyite. Quantitative estimates of hafnium resources are not available.
Mode of Occurrence
Zirconium (Zr) and hafnium (Hf) have similar geochemical properties and occur together in the mineral zircon (ZrSiO4), typically with a Zr:Hf ratio of about 36:1 (Jones and others, 2017). Uranium also substitutes for zirconium in zircon. Zircon forms as small, early crystallizing minerals in magmas. Owing to its refractory and chemically inert properties, zircon persists during the weathering and erosion of igneous, sedimentary, and metamorphic rocks. Liberated zircon can be transported by wind and water and concentrated in heavy-mineral placer deposits. Zircon-bearing coastal and alluvial placers and paleoplacers represent the major global and domestic sources of zirconium and hafnium. These deposits typically include titanium (ilmenite, rutile, leucoxene) and REE minerals (monazite, xenotime).
Some alkaline igneous rocks and pegmatite deposits can be enriched in zircon, but primary igneous zircon deposits are rare. The only igneous deposit that produces primary zirconium is found in the Kola alkaline province in Russia, where the rare mineral baddeleyite (ZrO2) is produced along with apatite and magnetite from mining carbonatites and phoscorites (Jones and others, 2017).
Mineral Systems for Zirconium and Hafnium Resources
Placer
Zircon is a byproduct of mining heavy-mineral sands for titanium minerals from placer deposits. In the Atlantic Coastal Plain focus area, modern economic deposits that are located in Florida, Georgia, and Virginia include Trail Ridge, Mission, and Old Hickory (fig. 14, table 16). The Trail Ridge mine produces titanium minerals (ilmenite, rutile, leucoxene), zircon, and staurolite separated from coastal deposits of heavy-mineral sands. Projected potential mineral production for a proposed Trail Ridge South project for the period of 2021–2028 is 532,690 t of titanium minerals, 184,951 t of zircon, and 173,018 t of staurolite (Urbanomics, 2019). The Mission deposit area in Georgia, explored since the 1970s, is a series of ancient beach ridges, some of which are actively mined through dredging operations. Titanium minerals are the primary ore minerals, with zircon concentrations ranging from 9 to 25 percent (O’Driscoll, 2015). The deposit area produced 5,000 t of zircon in 2014 with an expected production life of 10–15 years. Exploration is ongoing in Virginia around the Old Hickory mine, which produced zircon through 2017. In North Carolina, the focus area includes numerous past-producing mines. The Tennessee Fall Line placer focus area delineates the Cretaceous McNairy Sand, where paleoplacers were prospected and drilled in the past, but no resources are reported.
Some areas in the Western United States produced zircon from stream and river placers, such as modern heavy-mineral sands in central Idaho, where sediments mainly eroded from the Idaho batholith are deposited in valleys (fig. 14). Paleoplacers, which represent ancient coastal deposits, occur in a belt of Cretaceous black sands extending from Colorado into Wyoming, Montana, North Dakota, and South Dakota. The belt traces the distribution of ancient shorelines marked by the Fox Hills Formation, which is permissive for zircon-bearing paleoplacer deposits. Exploration for mostly buried paleoplacers in the Fox Hills Sandstone in the Denver Basin resulted in an estimated 17.5 million short tons of heavy minerals comprised of ilmenite, rutile, zircon, and garnet (Wojcik, 2000). Further studies by the Colorado Geological Survey are underway (O’Keeffe and others, 2019). The resource potential of the Cretaceous black sands to the north of the Denver Basin has not been evaluated.
The Coos Bay placers along the Oregon coast are primarily a chromite resource but have reserves and resources of 18,217,009 t of ore with average grades of 0.16 percent zircon (Industrial Minerals Corp., Ltd., 2011).
Magmatic REE and Porphyry Sn
Peralkaline syenite/granite/rhyolite/alaskite/pegmatite deposit types in magmatic REE systems have the potential to be enriched in zirconium and hafnium. However, no such deposits are known to occur in the conterminous United States, and these are unlikely to represent a significant source of zirconium. Eight focus areas outline areas broadly permissive for zirconium in igneous rocks, such as the Central Laramie Range focus area in Wyoming. Historically, some LCT-type pegmatites in granite-related porphyry tin systems produced zircon on a small scale; however, these deposits are of mineralogical interest and do not represent significant resources. The Zirconia district of North Carolina is an example of pegmatite deposits that produced large (up to 1.5 centimeters) zircons during mining in the early 1900s (Callahan and others, 2007).
Table 16.
Examples of mineral systems and focus areas for zirconium and hafnium resources in the conterminous United States.[*, mineral systems and deposit types most likely to represent significant sources of zirconium and hafnium. See Hofstra and Kreiner (2020) for detailed descriptions of mineral systems and deposit types. LCT, lithium-cesium-tantalum; REE, rare earth element; Sn, tin]
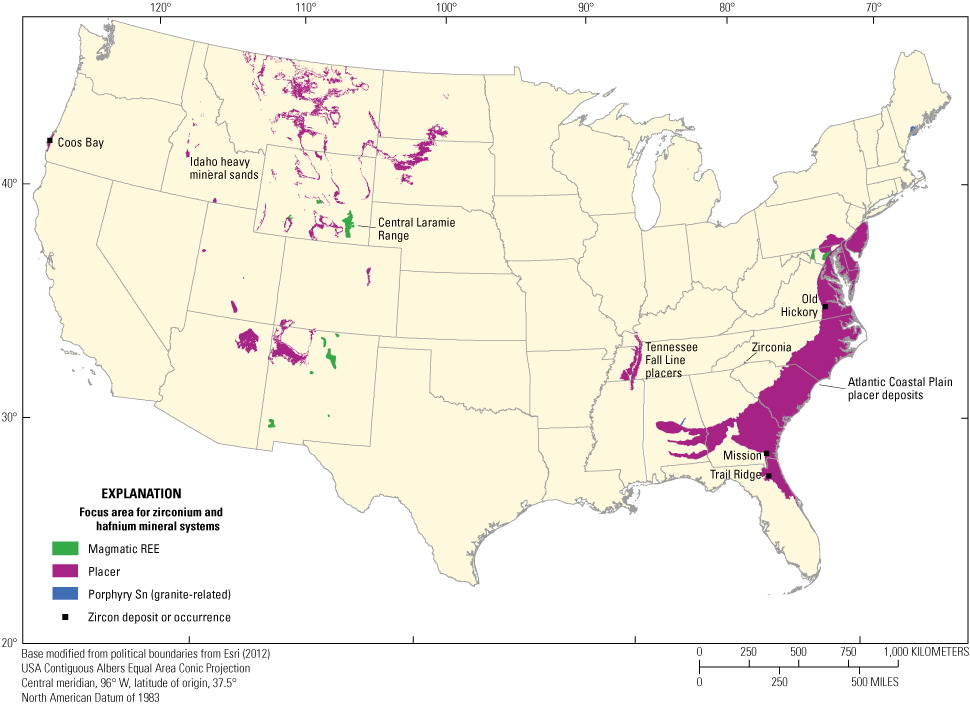
Map showing mineral system focus areas and significant occurrences for zirconium and hafnium resources in the conterminous United States. Mineral occurrences from Labay and others (2017). REEs, rare earth elements; Sn, tin.
Discussion
Currently, the United States produces the phase 3 critical minerals barite, beryllium, helium, magnesium, potash, uranium, vanadium, and zirconium-hafnium. An antimony deposit in Idaho is slated to come into production soon. Domestic production for all 13 critical minerals discussed in this report occurred in the past, in most cases before 1950 and with government support for strategic minerals. For some critical minerals, there are few active mines. For magnesium, examples include the mining of magnesite ore at Gabbs, Nevada, and magnesium extraction from brine operations at The Great Salt Lake in Utah. Although the volcanogenic beryllium deposit at Spor Mountain in Utah is the only operating beryllium mine in the country, other large beryllium deposits are known at Apache Warm Springs in New Mexico, and this study identified some 50 focus areas for Climax-type systems that potentially host these types of deposits.
Active mining and exploration for heavy-mineral sands along the Atlantic Coastal Plain target zircon, titanium minerals, and in some cases the rare-earth mineral monazite, which can be recovered as a byproduct. Airborne radiometric data and lidar data from Earth MRI projects are useful for identifying potential placer deposits within large focus areas. The heavy-mineral potential of paleoplacers along the former Cretaceous seaway in the Western States has not been thoroughly evaluated.
Some large, low-grade domestic manganese deposits are known; however, they are inferior to the readily available manganese ores mined in other countries (Cannon and others, 2017). Manganese resources in seabed deposits of ferromanganese nodules and crusts are larger than those on land but not quantified. The development of economically successful seabed mining could alter the current manganese and cobalt supply scenario by providing a large new resource.
The mafic magmatic-system chromite deposit at the Stillwater Complex in Montana is the most likely source of domestic chromite if there was an incentive to recover the chromite (in addition to the PGE resources currently mined). Phase 3 of the Earth MRI delineated 444 focus areas within the conterminous United States and 1 in Puerto Rico. Consideration of these focus areas led to the identification of more than 100 areas for new data acquisition across a variety of mineral systems and deposit types. A subset of those areas was then prioritized for the allocation of funds through the Earth MRI to initiate new projects for phase 3 critical minerals. For Alaska, 80 focus areas are included in the data release by Dicken and others (2021). The Yukon-Tanana area in eastern Alaska remains a priority area for new data acquisition in phase 3 because of multiple mineral systems that may host many critical minerals.
Conclusions
The mineral systems and deposit types considered for phase 3 critical minerals are potential sources of domestic resources. These locations include areas that currently produce critical minerals, areas that produced critical minerals in the past, and areas that may, upon further study, prove to host critical minerals. Critical minerals currently produced and sought in the United States are a function of technology and market conditions. As the demand for critical minerals increases and recovery methods evolve, some deposit types not currently mined but enriched in critical minerals may become important. Many deposit types with the potential to host critical minerals are not yet thoroughly characterized. The geochemical data acquired on samples collected by mapping projects will greatly expand our knowledge of critical mineral abundances in different deposit types. Reprocessing mine tailings and wastes at historical mines represents another possible source of domestic critical minerals. Until wastes can be processed economically, or along with site cleanup, new discoveries and the redevelopment of past producers remain the most current, viable sources of critical minerals for the United States.
References Cited
Alpine, A.E., ed., 2010, Hydrological, geological, and biological site characterization of breccia pipe uranium deposits in northern Arizona: U.S. Geological Survey Scientific Investigations Report 2010–5025, 353 p., 1 pl., scale 1:375,000, accessed August 30, 2016, at https://doi.org/10.3133/sir20105025.
Anderson, S.T., 2018, Economics, helium, and the U.S. Federal Helium Reserve—Summary and outlook: Natural Resources Research, v. 27, no. 4, p. 455–477, accessed March 22, 2021, at https://doi.org/10.1007/s11053-017-9359-y.
Anderson, S.B., and Swinehart, R.P., 1979, Potash salts in the Williston Basin, U.S: Economic Geology, v. 74, no. 2, p. 358–376, accessed August 30, 2021, at https://doi.org/10.2113/gsecongeo.74.2.358.
Ares Strategic Mining Inc, 2021a, Ares reports large geophysics anomalies at its mine indicating potential additional fluorspar pipes: Ares Mining news release, April 12, 2021, accessed June 14, 2021, at https://www.aresmining.com/post/ares-reports-large-geophysics-anomalies-at-its-mine-indicating-potential-additional-fluorspar-pipes.
Ares Strategic Mining Inc, 2021b, Ares Strategic Mining commences construction work in preparation for plant installation: Ares Mining news release, May 20, 2021, accessed June 14, 2021, at https://www.aresmining.com/post/ares-strategic-mining-commences-construction-work-in-preparation-for-plant-installation.
Ballentine, C.J., and Burnard, P.G., 2002, Production, release and transport of noble gases in the continental crust: Reviews in Mineralogy and Geochemistry, v. 47, no. 1, p. 481–538, accessed August 30, 2021, at https://doi.org/10.2138/rmg.2002.47.12.
Ballentine, C.J., and Sherwood Lollar, B., 2002, Regional groundwater focusing of nitrogen and noble gases into the Hugoton-Panhandle giant gas field, USA: Geochimica et Cosmochimica Acta, v. 66, no. 14, p. 2483–2497, accessed August 30, 2021, at https://doi.org/10.1016/S0016-7037(02)00850-5.
Baxter, J.W., and Bradbury, J.C., 1980, Bertrandite at Hicks Dome, Hardin County: Illinois, Illinois State Academy of Science, v. 73, p. 1–13. [Also available at http://ilacadofsci.com/wp-content/uploads/2013/09/073-01-print.pdf.]
Blondes, M.S., Gans, K.D., Engle, M.A., Kharaka, Y.K., Reidy, M.E., Saraswathula, V., Thordsen, J.J., Rowan, E.L., and Morrissey, E.A., 2018, U.S. Geological Survey National Produced Waters Geochemical Database (ver. 2.3, January 2018): U.S. Geological Survey data release, accessed May 28, 2021, at https://doi.org/10.5066/F7J964W8.
Boberg, W.W., 1975, Uranium in Montana: Montana Geological Society, Energy Resources of Montana, 22nd annual publication, p. 223–227, accessed April 28, 2021, at https://archives.datapages.com/data/mgs/mt/data/0032/0223/0223.html.
Bodenlos, A.J., and Thayer, T.P., 1973, Magnesian refractories, in Brobst, D.A., and Pratt, W.P., eds., 1973, United States mineral resources: U.S. Geological Survey Professional Paper 820, p. 379–384, accessed February 24, 2020, at https://doi.org/10.3133/pp820.
Brebner, J., Lefaivre, A., Bairos, D., Laxer, C., Henchel, L.D., Reinke, R., and Ennis, S., 2018, NI [Canadian National Instrument] 43–101 technical report summarizing the feasibility study for the Sevier Playa potash project, Millard County, Utah: Salt Lake City, Utah, Crystal Peak Minerals Inc., prepared by Novopro Projects, Inc., Montreal, Quebec, Canada, and Norwest Corp., Calgary, Alberta, Canada, 338 p., accessed August 30, 2021, at https://crystalpeakminerals.com/wp-content/uploads/2018/12/NI-43-101-Technical-Report-Summarizing-the-Feasibility-Study-for-the-Sevier-Playa-Potash-Project-Millard-County-Utah-00-19-Feb-18.pdf.
Brennan, S.T., East, J.A., Dennen, K.O., Jahediesfanjani, H., and Varela, B., 2021, Dataset of helium concentrations in United States wells: U.S. Geological Survey data release, accessed September 5, 2021, at https://doi.org/10.5066/P92QL79J.
Broadhead, R.F., 2005, Helium in New Mexico—Geologic distribution, resource demand, and exploration possibilities: New Mexico Geology, v. 27, no. 4, p. 93–101, accessed May 20, 2021, at https://geoinfo.nmt.edu/publications/periodicals/nmg/27/n4/nmg_v27_n4_p93.pdf.
Brobst, D.A., and Pratt, W.P., eds., 1973, United States mineral resources: U.S. Geological Survey Professional Paper 820, 722 p., accessed February 24, 2020, at https://doi.org/10.3133/pp820.
Brown, A.A., 2010, Formation of high helium gases—A guide for explorationists [Adapted from poster presentation at AAPG Convention, New Orleans, La., April 11–14, 2010]: Search and Discovery Article 80115, 5 p., accessed May 10, 2021, at https://www.searchanddiscovery.com/documents/2010/80115brown/ndx_brown.pdf.
Brush Engineered Materials, Inc., 2009, Transforming our world and yours—Annual report: Mayfield Heights, Ohio, Brush Engineered Materials, Inc., 122 p., accessed May 27, 2010, at http://files.shareholder.com/downloads/BW/925738805x0x368575/A9F177AFD3E5-4546-8707-73F26F14E146/bw2009ar.pdf.
Callahan, J.E., Bream, B.R., Johnson, N.E., and Stepp, J.D., 2007, Geochemistry of megacrystic zircons with distinctive fluorescent zircon populations from the Freeman mine, Zirconia, North Carolina: Southeastern Geology, v. 45, no. 1, p. 1–13. [Also available at https://core.ac.uk/download/pdf/345087533.pdf#page=5.]
Campbell, I., and Loofbourow, J.S., Jr., 1962, Geology of the magnesite belt of Stevens County, Washington: U.S. Geological Survey Bulletin 1442–F, p. F1–F53, accessed August 10, 2020, at https://pubs.usgs.gov/bul/1142f/report.pdf.
Cannon, W.F., Clark, S.H.B., Lesure, F.G., Hinkle, M.E., Paylor, R.L., King, H.M., Simard, C.M., Ashton, K.C., and Kite, J.S., 1994, Mineral resources of West Virginia: Miscellaneous Investigations Series Map 2364–A, accessed August 30, 2021, at https://doi.org/10.3133/i2364A.
Cannon, W.F., Kimball, B.E., and Corathers, L.A., 2017, Manganese, chap. L of Schulz, K.J., DeYoung, J.H., Jr., Seal, R.R., II, and Bradley, D.C., eds., Critical mineral resources of the United States—Economic and environmental geology and prospects for future supply: U.S. Geological Survey Professional Paper 1802, p. L1–L28, accessed May 1, 2021, at https://doi.org/10.3133/pp1802L.
Carmichael, S.K., Doctor, D.H., Wilson, C.G., Feierstein, J., and McAleer, R.J., 2017, New insight into the origin of manganese oxide ore deposits in the Appalachian Valley and Ridge of northeastern Tennessee and northern Virginia, USA: Geological Society of America Bulletin, v. 129, no. 9–10, p. 1158–1180, accessed August 30, 2021, at https://doi.org/10.1130/B31682.1.
Chenoweth, W.L., 1981, The uranium-vanadium deposits of the Uravan mineral belt and adjacent areas, Colorado and Utah, in Epis, R.C., and Callender, J.F., eds., Western Slope (western Colorado and eastern Utah), New Mexico Geological Society thirty-second field conference, October 8–10, 1981: [Socorro, N. Mex.], New Mexico Geological Society, Field conference guidebook, no. 32, p. 165–170.
Clark, M., 1981, Abstract—Helium in Wyoming [abs.]: Earth Science Bulletin, v. 14, no. 1–4, p. 219, accessed May 20, 2021, https://archives.datapages.com/data/wyoming-geo-assoc-earth-science-bull/data/014/014001_4/219_esb140219.htm.
Clark, S.H.B., 1999, Geologic maps and block diagrams of the Barite Hill gold-silver deposit and vicinity, South Carolina and Georgia: U.S. Geological Survey Open-File Report OF–99-148–A, 3 p., 3 pls., accessed June 16, 2021, at https://pubs.usgs.gov/of/1999/of99-148a/. [This report is preliminary and has not been reviewed for conformity with U.S. Geological Survey editorial standards or with the North American Stratigraphic code.]
Dahlkamp, F.J., 2010, Uranium deposits of the world—USA and Latin America: Berlin and Heidelberg, Germany, Springer-Verlag, 515 p., accessed May 1, 2021, at https://doi.org/10.1007/978-3-540-78943-7.
Davis, R.E., 1957, Magnesium resources of the United States—A geologic summary and annotated bibliography to 1953: U.S. Geological Survey Bulletin 1019–E, p. 373–515, 1 pl., accessed August 10, 2020, at https://doi.org/10.3133/b1019E.
Davis, B., and Sim, R., 2012, NI [Canadian National Instrument] 43–101 technical report on the Anderson Uranium Project, Yavapai County, Arizona, USA: Corpus Christi, Tex., Uranium Energy Corp., prepared by BD Resource Consulting Inc., and SIM Geological, Inc., 107 p. [Also available at https://portal.azoah.com/oedf/documents/12-005-WQAB/SWVP-0368-%202012-06-19%20UEC%20Tech%20Rpt%20Anderson%20Project.pdf.]
Day, W.C., 2019, The Earth Mapping Resources Initiative (Earth MRI)—Mapping the Nation’s critical mineral resources (ver. 1.2, September 2019): U.S. Geological Survey Fact Sheet 2019–3007, 2 p., accessed May 15, 2020, at https://doi.org/10.3133/fs20193007.
De Bruin, R.H., 2004, Natural gas in Wyoming: Wyoming State Geological Survey, Information Pamphlet 10, 23 p., accessed May 20, 2021, at https://www.wsgs.wyo.gov/products/wsgs-2004-ip-10.pdf.
Denson, N.M., Gill, J.R., and Chisholm, W.A., 1965, Uranium-bearing lignite and carbonaceous shale in the southwestern part of the Williston Basin—A regional study, with a section on heavy minerals in Cretaceous and Tertiary rocks associated with uranium occurrences: U.S. Geological Survey Professional Paper 463, 19 pls., 75 p., accessed June 15, 2021, at https://doi.org/10.3133/pp463.
Dicken, C.L., and Hammarstrom, J.M., 2020, GIS for focus areas of potential domestic resources of 11 critical minerals—Aluminum, cobalt, graphite, lithium, niobium, PGEs, rare earth elements, tantalum, tin, titanium, and tungsten (version 2.0, August 2020): U.S. Geological Survey data release, accessed September 5, 2021, at https://doi.org/10.5066/P9U6SODG.
Dicken, C.L., Hammarstrom, J.M., Woodruff, L.G., and Mitchell, R.J., 2021, GIS, supplemental data table, and references for focus areas of potential domestic resources of 13 critical minerals—Antimony, barite, beryllium, chromium, fluorspar, hafnium, helium, magnesium, manganese, potash, uranium, vanadium, and zirconium: U.S. Geological Survey data release, https://doi.org/10.5066/P9WA7JZY.
Dicken, C.L., Horton, J.D., San Juan, C.A., Anderson, A.K., Ayuso, R.A., Bern, C.R., Bookstrom, A.A., Bradley, D.C., Bultman, M.W., Carter, M.W., Cossette, P.M., Day, W.C., Drenth, B.J., Emsbo, P., Foley, N.K., Frost, T.P., Gettings, M.E., Hammarstrom, J.M., Hayes, T.S., Hofstra, A.H., Hubbard, B.E., John, D.A., Jones, J.V., III, Kreiner, D.C., Lund, K., McCafferty, A.E., Merschat, A.J., Ponce, D.A., Schulz, K.J., Shah, A.K., Siler, D.L., Taylor, R.D., Vikre, P.G., Walsh, G.J., Woodruff, L.G., and Zurcher, L., 2019, GIS and data tables for focus areas for potential domestic nonfuel sources of rare earth elements: U.S. Geological Survey data release, accessed July 8, 2020, at https://doi.org/10.5066/P95CHIL0.
Feytis, A., 2009, Fluorspar supply fortified: Industrial Minerals web page, accessed January 9, 2010, at https://www.indmin.com/Article/2299402/Fluorspar-supply-fortified.html.
Foley, N.K., Jaskula, B.W., Piatak, N.M., and Schulte, R.F., 2017, Beryllium, chap. E of Schulz, K.J., DeYoung, J.H., Jr., Seal, R.R., II, and Bradley, D.C., eds., Critical mineral resources of the United States—Economic and environmental geology and prospects for future supply: U.S. Geological Survey Professional Paper 1802, p. E1–E32, accessed May 1, 2021, at https://doi.org/10.3133/pp1802E.
Foley, N., Ayuso, R., Lederer, G., and Jaskula, B., 2016, Volcanogenic beryllium deposits at Spor Mountain, Utah, USA—Impact on past production and material flow cycles [abs.], in Goldschmidt Conference, Yokohama, Japan, 26 June–1 July, 2016: Goldschmidt Abstracts website, accessed May 10, 2021, at https://goldschmidtabstracts.info/abstracts/abstractView?id=2016000557.
Fortier, S.M., Nassar, N.T., Lederer, G.W., Brainard, J., Gambogi, J., and McCullough, E.A., 2018, Draft critical mineral list—Summary of methodology and background information—U.S. Geological Survey technical input document in response to Secretarial Order No. 3359: U.S. Geological Survey Open-File Report 2018–1021, 15 p., accessed December 15, 2018, at https://doi.org/10.3133/ofr20181021.
Gill, J.R., 1959, Reconnaissance for uranium in the Ekalaka Lignite Field, Carter County, Montana, chap. F of Uranium in Coal in the Western United States: U.S. Geological Survey Bulletin, v. 1055, p. 167–179, accessed April 28, 2021, at https://doi.org/10.3133/b1055.
Gillerman, V.S., Schmitz, M.D., Benowitz, J.A., and Layer, P.W., 2019, Geology and temporal evolution of alteration and Au-Sb-W mineralization, Stibnite mining district, Idaho: Idaho Geological Survey Bulletin B–31, 149 p. [Also available at https://www.idahogeology.org/product/B-31.]
Gregory, R.W., 2019, Uranium geology and resources of the Gas Hills district, Wind River Basin, central Wyoming: Wyoming State Geological Survey Public Information Circular 47, 31 p., accessed August 30, 2021, at https://sales.wsgs.wyo.gov/uranium-geology-and-resources-of-the-gas-hills-district-wind-river-basin-central-wyoming-2019/.
Halabura, S.P., and Hardy, M.P., 2007, An overview of solution mining of potash in Saskatchewan, Solution Mining Research Institute, Fall 2007 Technical Meeting, Halifax, Nova Scotia, Canada, 8–9 October 2007: Clarks Summit, Pa., Solution Mining Research Institute, Technical conference paper, 18 p. [Also available at https://www.agapito.com/wp-content/uploads/2010/04/An-Overview-of-the-Geology-of-Solution-Mining-of-Potash-in-Saskatchewan.pdf.]
Hall, S.M., Beard, J.S., Potter, C.J., Bodnar, R.J., Neymark, L.A., Paces, J.B., Johnson, C.A., Breit, G.N., Zielinski, R.A., and Aylor, G.J., Jr., 2022, The Coles Hill uranium deposit, Virginia, USA—Geology, geochemistry, geochronology, and genetic model: Economic Geology, v. 117, no. 2, p. 273–304. [Also available at https://doi.org/10.5382/econgeo.4874.]
Hall, S.M., Mihalasky, M.J., Tureck, K.R., Hammarstrom, J.M., and Hannon, M.T., 2017, Genetic and grade and tonnage models for sandstone-hosted roll-type uranium deposits, Texas Coastal Plain, USA: Ore Geology Reviews, v. 80, p. 716–753, accessed August 30, 2021, at https://doi.org/10.1016/j.oregeorev.2016.06.013.
Hall, S.M., Van Gosen, B.S., Paces, J.B., Zielinski, R.A., and Breit, G.N., 2019, Calcrete uranium deposits in the Southern High Plains, USA: Ore Geology Reviews, v. 109, p. 50–78, accessed August 30, 2021, at https://doi.org/10.1016/j.oregeorev.2019.03.036.
Hamak, J.E., 2020, Helium [advance release], in Metals and minerals: U.S. Geological Survey 2016 Minerals Yearbook, v. I, p. 34.1–34.8, accessed August 30, 2021, at https://prd-wret.s3-us-west-2.amazonaws.com/assets/palladium/production/atoms/files/myb1-2016-heliu.pdf.
Hammarstrom, J.M., and Dicken, C.L., 2019, Focus areas for data acquisition for potential domestic sources of critical minerals—Rare earth elements, chap. A of U.S. Geological Survey, Focus areas for data acquisition for potential domestic sources of critical minerals: U.S. Geological Survey Open-File Report 2019–1023, 11 p., accessed May 15, 2020, at https://doi.org/10.3133/ofr20191023A.
Hammarstrom, J.M., Dicken, C.L., Day, W.C., Hofstra, A.H., Drenth, B.J., Shah, A.K., McCafferty, A.E., Woodruff, L.G., Foley, N.K., Ponce, D.A., Frost, T.P., and Stillings, L.L., 2020, Focus areas for data acquisition for potential domestic resources of 11 critical minerals in the conterminous United States, Hawaii, and Puerto Rico—Aluminum, cobalt, graphite, lithium, niobium, platinum-group elements, rare earth elements, tantalum, tin, titanium, and tungsten, chap. B of U.S. Geological Survey, Focus areas for data acquisition for potential domestic sources of critical minerals: U.S. Geological Survey Open-File Report 2019–1023, 67 p., accessed August 30, 2021, at https://doi.org/10.3133/ofr20191023B.
Hanson, K., Orbock, E.J.C., III, Peralta, E., and Gormely, L., 2018, NI [Canadian National Instrument] 43–101 technical report on preliminary economic assessment for Gibellini Vanadium Project, Eureka County, Nevada: Vancouver, British Columbia, Canada, Prophecy Development Corp., prepared by Amec Foster Wheeler E&C Services, Inc., Reno, Nev., and Amec Foster Wheeler Americas Limited, Vancouver, British Columbia, Canada, 256 p., accessed April 29, 2021, at https://www.silverelef.com/files/Gibellini_2018_PEA_Technical_Report.pdf.
Harding, A., 2018, Premier Magnesia mine near Gabbs only one in U.S.: Elko Daily news article, June 8, 2018, accessed April 26, 2021, at https://elkodaily.com/mining/premier-magnesia-mine-near-gabbs-only-one-in-u-s/article_ecdb8749-0f0f-5cc8-a097-1a1ef61a25f0.html.
Hartman, M.J., 2019, NI [Canadian National Instrument] 43–101 technical report Wray Mesa project, Montrose County, Colorado, USA: Vancouver, British Columbia, Canada, United Battery Metal Corp., prepared by SRK Consulting, Inc., Denver, Colo., 64 p., accessed March 24, 2021, at https://webfiles.thecse.com/sedar_filings/00043203/1902190955556820.pdf.
Hausel, W.D., 2006, Geology and geochemistry of the Leucite Hills volcanic field: Wyoming State Geological Survey Report of Investigations 56, 71 p. [Also available at https://sales.wsgs.wyo.gov/geology-and-geochemistry-of-the-leucite-hills-volcanic-field-2006/.]
Hawley, C.C., 1969, Geology and beryllium deposits of the Lake George (or Badger Flats) beryllium area, Park and Jefferson Counties, Colorado: U.S. Geological Survey Professional Paper 608–A, 4 pls., p. A1–A44, accessed March 24, 2021, at. https://doi.org/10.3133/pp608A.
Hayes, T.S., Miller, M.M., Orris, G.J., and Piatak, N.M., 2017, Fluorine, chap. G of Schulz, K.J., DeYoung, J.H., Jr., Seal, R.R., II, and Bradley, D.C., eds., Critical mineral resources of the United States—Economic and environmental geology and prospects for future supply: U.S. Geological Survey Professional Paper 1802, p. G1–G80, accessed April 18, 2020, at https://doi.org/10.3133/pp1802G.
Hofstra, A.H., Marsh, E.E., Todorov, T.I., and Emsbo, P., 2013, Fluid inclusion evidence for a genetic link between simple antimony veins and giant silver veins in the Coeur d’Alene mining district, ID and MT, USA: Geofluids, v. 13, no. 4, p. 475–493, accessed April 18, 2020, at https://doi.org/10.1111/gfl.12036.
Hofstra, A.H., and Kreiner, D.C., 2020, Systems-deposits-commodities-critical minerals table for the Earth Mapping Resources Initiative (ver. 1.1, May 2021): U.S. Geological Survey Open-File Report 2020–1042, 26 p., accessed May 30, 2021, at https://doi.org/10.3133/ofr20201042.
Hollister, V., Hruska, D., and Moore, R., 1992, A mine-exposed hot spring deposit and related epithermal gold resource: Economic Geology, v. 87, no. 2, p. 421–424, accessed August 30, 2021, at https://doi.org/10.2113/gsecongeo.87.2.421.
Horton, J.D., 2017, The State geologic map compilation (SGMC) geodatabase of the conterminous United States (ver. 1.1, August 2017): U.S. Geological Survey data release, accessed May 15, 2020, at https://doi.org/10.5066/F7WH2N65.
Hughes, T.N.J., 2019, [NI (Canadian National Instrument) 43–101] Technical report on the Lost Sheep Property, Juab County, Utah, U.S.A.: Lithium Energy Products, Vancouver, British Columbia, Canada, prepared by Antediluvial Consulting Inc., Vancouver, British Columbia, Canada, 118 p., accessed September 5, 2021, at https://c2789c21-62f1-4082-847e-d877f86d2499.filesusr.com/ugd/f57d32_873e912dde574e6cb1805b289fbc58ff.pdf.
Hulse, D.E., Malhotra, D., Matthews, T., and Emanuel, C., 2019, NI [Canadian National Instrument] 43–101 preliminary economic assessment, Round Top project, Sierra Blanca, Texas: USA Rare Earth LLC, New York, N.Y., and Texas Mineral Resources Corp., Sierra Blanca, Tex., prepared by Gustavson Associates, LLC, Lakewood, Colo., 218 p., accessed June 14, 2021, at http://tmrcorp.com/_resources/reports/TMRC-NI43-101-PEA-2019-16-August-2019.pdf.
Industrial Minerals Corp, Ltd., 2011, Annual report 2011: West Perth, Western Australia, Australia, Industrial Minerals Corp., Ltd., September 30, 95 p., accessed November 9, 2011, at http://www.idminternational.net/wp-content/uploads/2011/03/IMC-Limited-2011-Annual-Report.pdf.
International Atomic Energy Agency [IAEA], 2020, Descriptive uranium deposit and mineral system models: Vienna, Austria, IAEA, 313 p., accessed June 16, 2021, at https://www-pub.iaea.org/MTCD/Publications/PDF/DES_MOD_web.pdf.
International Atomic Energy Agency [IAEA], 2021, World distribution of uranium deposits (UDEPO) database: International Atomic Energy Agency, Vienna, Austria, accessed March 23, 2021, at https://www.iaea.org/resources/nucleus-information-resources.
International Atomic Energy Agency and Nuclear Energy Agency [IAEA–NEA], 2020, Uranium 2020—Resources, production, and demand: Paris, France, NEA Organization for Economic Cooperation and Development, 479 p., accessed August 30, 2021, at https://www.oecd-nea.org/upload/docs/application/pdf/2020-12/7555_uranium_-_resources_production_and_demand_2020__web.pdf.
John, D.A., Vikre, P.G., du Bray, E.A., Blakely, R.J., Fey, D.L., Rockwell, B.W., Mauk, J.L., Anderson, E.D., and Graybeal, F.T., 2018, Descriptive models for epithermal gold-silver deposits, chap. Q of Mineral deposit models for resource assessment: U.S. Geological Survey Scientific Investigations Report 2010–5070–Q, 247 p., accessed May19, 2021, at https://doi.org/10.3133/sir20105070Q.
Johnson, C.A., Piatak, N.M., and Miller, M.M., 2017, Barite (Barium), chap. D of Schulz, K.J., DeYoung, J.H., Jr., Seal, R.R., II, and Bradley, D.C., eds., Critical mineral resources of the United States—Economic and environmental geology and prospects for future supply: U.S. Geological Survey Professional Paper 1802, p. D1–D18, accessed June 15, 2021, at https://doi.org/10.3133/pp1802D.
Johnson, M.R., Anderson, E.D., Ball, L.B., Drenth, B.J., Grauch, V.J.S., McCafferty, A.E., Scheirer, D.S., Schweitzer, P.N., Shah, A.K., and Smith, B.D., 2019, Airborne geophysical survey inventory of the conterminous United States, Alaska, Hawaii, and Puerto Rico (ver. 2.0, June 2020): U.S. Geological Survey data release, accessed May 15, 2020, at https://doi.org/10.5066/P9K8YTW1.
Jones, J.V., III, Piatak, N.M., and Bedinger, G.M., 2017, Zirconium and hafnium, chap. V of Schulz, K.J., DeYoung, J.H., Jr., Seal, R.R., II, and Bradley, D.C., eds., Critical mineral resources of the United States—Economic and environmental geology and prospects for future supply: U.S. Geological Survey Professional Paper 1802, p. V1–V26, accessed June 15, 2021, at https://doi.org/10.3133/pp1802V.
Keeven, L., and Torrez, S., 2020, American Magnesium Foothill Dolomite Mine project environmental assessment: Bureau of Land Management Environmental Assessment Document DOI–BLM–NM–L000–2020–0024–EA, 77 p. [Also available at https://eplanning.blm.gov/public_projects/nepa/1505404/20018258/250024285/DOI-BLM-NM-L000-2020-0024-EA-American_Magnesium_Foothill_Mine.pdf.]
Kelley, K.D., Scott, C.T., Polyak, D.E., and Kimball, B.E., 2017, Vanadium, chap. U of Schulz, K.J., DeYoung, J.H., Jr., Seal, R.R., II, and Bradley, D.C., eds., Critical mineral resources of the United States—Economic and environmental geology and prospects for future supply: U.S. Geological Survey Professional Paper 1802, p. U1–U36, accessed June 15, 2021, at https://doi.org/10.3133/pp1802U.
Kerr, S.B., Todd, J.N., and Malhotra, D., 2017, NI [Canadian National Instrument] 43–101 technical report, the Blawn Mountain project, updated prefeasibility report, revised, Beaver County, Utah: Toronto, Ontario, Canada, Potash Ridge Corporation, prepared by Millcreek Mining Group, Salt Lake City, Utah, [variously paged; 285 p.]
Kerr, P.F., 1940, Tungsten-bearing manganese deposit at Golconda, Nevada: Bulletin of the Geological Society of America, v. 51, no. 9, p. 1359–1390, accessed August 30, 2021, at https://doi.org/10.1130/GSAB-51-1359.
Kharaka, Y.K., and Hanor, J.S., 2014, Deep fluids in sedimentary basins, section 7.14 of Treatise on Geochemistry (2d edition): Amsterdam, Netherlands, Elsevier, v. 7, p. 471–515. [Also available at https://doi.org/10.1016/B978-0-08-095975-7.00516-7.]
Krahulec, K., 2018, Utah mining districts: Utah Geological Survey Open-File Report 695, 1 pl., 191 p., accessed September 5, 2021, at https://ugspub.nr.utah.gov/publications/open_file_reports/ofr-695.pdf.
Kreiner, D.C., and Jones, J.V., III, 2020, Focus areas for data acquisition for potential domestic resources of 11 critical minerals in Alaska—Aluminum, cobalt, graphite, lithium, niobium, platinum group elements, rare earth elements, tantalum, tin, titanium, and tungsten: U.S. Geological Survey Open-File Report 2019–1023–C, 20 p., accessed May 15, 2021, at https://pubs.er.usgs.gov/publication/ofr20191023C.
Kreiner, D.C., Jones, J.V., III, and Case, G., 2022, Alaska focus area definition for data acquisition for potential domestic sources of critical minerals in Alaska for antimony, barite, beryllium, chromium, fluorspar, hafnium, magnesium, manganese, uranium, vanadium, and zirconium, chap. E of U.S. Geological Survey, Focus areas for data acquisition for potential domestic sources of critical minerals: U.S. Geological Survey Open-File Report 2019–1023, 18 p., https://doi.org/10.3133/ofr20191023E.
Kruger, N.W., 2014, The potash members of the Prairie Formation in North Dakota: North Dakota Geological Survey Report of Investigations 113, 39 p., accessed August 30, 2021, at https://www.dmr.nd.gov/ndgs/documents/Publication_List/pdf/RISeries/RI-113.pdf.
Kyle, J.L., and Beahm, D., 2013, NI [Canadian National Instrument] preliminary economic assessment update (revised) Coles Hill Uranium property, Pittsylvania County, Virginia, United States of America: Vancouver, British Columbia, Canada, Virginia Energy Resources, Inc.; Chatham, Virginia, Virginia Uranium, Inc., and Virginia Uranium Holdings, Inc., prepared by Lyntek Inc., Lakewood, Colo., and BRS Engineering, Riverton, Wyo., 126 p., accessed August 30, 2021, at http://www.virginiaenergyresources.com/i/pdf/VUI-Coles-Hill-PEA-Updated-Technical-Report-Aug19.pdf.
Labay, K., Burger, M.H., Bellora, J.D., Schulz, K.J., DeYoung, J.H., Jr., Seal, R.R., II, Bradley, D.C., Mauk, J.L., and San Juan, C.A., 2017, Global distribution of selected mines, deposits, and districts of critical minerals: U.S. Geological Survey data release, accessed May 15, 2020, at https://doi.org/10.5066/F7GH9GQR.
LaPointe, D.D., Tingley, J.V., and Jones, R.B., 1991, Mineral resources of Elko County, Nevada: Nevada Bureau of Mines and Geology Bulletin 106, 1 pl., 236 p., accessed August 30, 2021, at https://pubs.nbmg.unr.edu/Mineral-resources-of-Elko-Count-p/b106.htm.
Lederer, G.W., Foley, N.K., Jaskula, B.W., and Ayuso, R.A., 2016, Beryllium—A critical mineral commodity—Resources, production, and supply chain: U.S. Geological Survey Fact Sheet 2016–3081, 4 p., accessed May 19, 2021, at https://doi.org/10.3133/fs20163081.
Loferski, P.A., 1986, Petrology of metamorphosed chromite-bearing ultramafic rocks from the Red Lodge District, Montana: U.S. Geological Survey Bulletin 1626–B, 34 p., accessed June 15, 2021, at https://pubs.usgs.gov/bul/1626b/report.pdf.
McLemore, V.T., 2010, Beryllium resources in New Mexico and adjacent areas: New Mexico Institute of Mining and Technology Open-File Report OF–533, 106 p., accessed August 15, 2021, at https://geoinfo.nmt.edu/publications/openfile/downloads/500-599/533/ofr_533.pdf.
McLemore, V.T., 2011, The Grants Uranium District, New Mexico—Update on source, deposition, and exploration: The Mountain Geologist, v. 48, no. 1, p. 23–43, accessed August 30, 2021, at https://archives.datapages.com/data/mountain-geologist-rmag/data/048/048001/23_rmag-mg480023.htm.
McLemore, V.T., 2020, Uranium resources in New Mexico: New Mexico Bureau of Geology and Mineral Resources website, accessed July 24, 2020, at https://geoinfo.nmt.edu/resources/uranium/nmresources.html.
McLemore, V.T., and Austin, G.S., 2017, Industrial minerals and rocks, v. E of McLemore, V.T., Timmons, S., and Wilks, M., eds., Energy and mineral deposits in New Mexico: Socorro, N. Mex., New Mexico Bureau of Geology and Mineral Resources, Memoir 50E, New Mexico Geological Society Special Publication 13E.
Methven, G., Nussipakynova, D., Bloom, L., Jim, Q., Kaye, C., Smith, R.M., Kottmeire, C., Bartlett, D., and Christenson, E., 2018, [NI (Canadian National Instrument) 43–101] Technical report—Hermosa property mineral resource and Taylor deposit PEA update, Arizona Mining, Inc., Santa Cruz County, Arizona, USA: Vancouver, British Columbia, Canada, Arizona Mining Inc., prepared by AMC Mining Consultants (Canada) Ltd., Vancouver, British Columbia, Canada, 245 p., accessed May 22, 2020, at http://www.rosemontminetruth.com/wp-content/uploads/2018/06/Hermosa-technical-report.pdfcontent/uploads/2018/06/Hermosa-technical-report.pdf.
Mills, S.E., and Rupke, A., 2020, Critical minerals in Utah: Utah Geological Survey Circular 129, 49 p., accessed August 30, 2021, at https://ugspub.nr.utah.gov/publications/circular/c-129.pdf.
Mosier, D.L., Singer, D.A., Moring, B.C., and Galloway, J.P., 2012, Podiform chromite deposits—Database and grade and tonnage models: U.S. Geological Survey Scientific Investigations Report 2012–5157, 45 p. and database, accessed April 15, 2021, at https://pubs.usgs.gov/sir/2012/5157/.
National Research Council, 2010, Selling the Nation's Helium Reserve: Washington, D.C., National Academics Press, 156 p., accessed August 30, 2021, at https://www.nap.edu/catalog/12844/selling-the-nations-helium-reserve.
Nelson-Moore, J.L., Collins, D.B., and Hornbaker, A.L., 1978, Radioactive mineral occurrences of Colorado and bibliography: Colorado Geological Survey Bulletin 40, prepared under U.S. Department of Energy contract EW–77–C–13–1674, 1,054 p. [Also available at http://hermes.cde.state.co.us/drupal/islandora/object/co:26433/datastream/OBJ/view.]
North American Potash Developments, Inc., 2012, North American Potash Developments, Inc., Acquires Potassium Sulfate/Alunite: North American Potash Developments Inc., Press release dated February 27, 2012, accessed May 27, 2021, at https://www.marketscreener.com/quote/stock/NORTH-AMERICAN-POTASH-DEV-9364964/news/North-American-Potash-Developments-Inc-nbsp-North-American-Potash-Developments-Inc-Acquires-Potas-14044295/.
O’Driscoll, M., 2015, Zircon plant in US opened by Southern Ionics Minerals: IMFORMED (Industrial Minerals Forums & Research) website, accessed May 10, 2021, at https://imformed.com/zircon-plant-opened-in-us-by-southern-ionics-minerals/.
O’Keeffe, M.K., Dechesne, M., Morgan, M.L., Pfaff, K., and Keller, S.M., 2019, Critical minerals in beach placer deposits of the Fox Hills Sandstone, Elbert County, Colorado: Geological Society of America Abstracts with Programs, v. 51, no. 5, accessed May 20, 2021, at https://doi.org/10.1130/abs/2019AM-337497.
Olson, J.C., 1988, Geology and uranium deposits of the Cochetopa and Marshall Pass districts, Saguache and Gunnison Counties, Colorado: U.S. Geological Survey Professional Paper 1457, 44 p., accessed June 15, 2021, at https://doi.org/10.3133/pp1457.
Olson, J.C., Shawe, D.R., Pray, L.C., and Sharp, W.N., 1954, Rare-earth mineral deposits of the Mountain Pass District, San Bernardino County, California: U.S. Geological Survey Professional Paper 261, 75 p., 13 pls, accessed June 15, 2021, at https://doi.org/10.3133/pp261.
Orris, G.J., Cocker, M.D., Dunlap, P., Wynn, J., Spanski, G.T., Briggs, D.A., and Gass, L., Bliss, J.D., Bolm, K.S., Yang, C., Lipin, B.R., Ludington, S., Miller, R.J., and Slowakiewicz, M., 2014, Potash—A global overview of evaporite-related potash resources, including spatial databases of deposits, occurrences, and permissive tracts: U.S. Geological Survey Scientific Investigations Report 2010–5090–S, 76 p., and GIS packages, accessed April 26, 2021, at https://doi.org/10.3133/sir20105090S.
Otton, J.K., and Van Gosen, B.S., 2010, Uranium resource availability in breccia pipes in northern Arizona, chap. A of Alpine, A.E., ed., Hydrological, geological, and biological site characterization of breccia pipe uranium deposits in northern Arizona: U.S. Geological Survey Scientific Investigations Report 2010-5025, p. 23–41, accessed May 28, 2021, at https://pubs.usgs.gov/sir/2010/5025/.
Papp, J.F., 2013, Chromium, in Metals and Minerals: U.S. Geological Survey Minerals Yearbook 2011, v. I, p. 17.1–17.22, accessed May 20, 2021, at https://s3-us-west-2.amazonaws.com/prd-wret/assets/palladium/production/mineral-pubs/chromium/myb1-2011-chrom.pdf.
Pearre, N.C., and Heyl, A.V., Jr., 1960, Chromite and other mineral deposits in serpentine rocks of the Piedmont Upland Maryland, Pennsylvania and Delaware: U.S. Geological Survey Bulletin 1082–K, 135 p., accessed April 15, 2021, at https://pubs.usgs.gov/bul/1082k/report.pdf.
Pinckney, D.M., 1976, Mineral resources of the Illinois-Kentucky mining district: U.S. Geological Survey Professional Paper 970, 15 p., accessed April 15, 2021, at https://doi.org/10.3133/pp970.
Pingitore, N.E., Jr., Clague, J.W., and Gorski, D., 2016, Lithium and beryllium by-product recovery from the Round Top Mountain, Texas, peraluminous rhyolite heavy rare earth deposit [abs.] in American Geophysical Union, San Francisco, Calif., United States, Dec. 11–15, 2016: American Geophysical Union 2016 Fall Meeting, V23D–3010, accessed May 26, 2021, at https://abstractsearch.agu.org/meetings/2016/FM/V23D-3010.html.
Piper, J., 2007, Beryllium deposits associated with the Redskin Stock and Boomer and China Wall cupolas in Society of Mining, Metallurgy and Exploration Annual Convention, Phoenix, Arizona, February 2007: Society of Mining, Metallurgy and Exploration Annual Convention, no. 39751, 5 p. [Also available at https://www.onemine.org/document/abstract.cfm?docid=39751&title=Beryllium-Deposits-Associated-With-The-Redskin-Stock-And-Boomer-And-China-Wall-Cupolas.]
Rupke, A., 2012, Utah’s potash resources and activity: Utah Geological Survey web page, Survey Notes, v. 44, no. 3, accessed May 21, 2021, at https://geology.utah.gov/map-pub/survey-notes/utahs-potash-resources-and-activity/.
Schulz, K.J., DeYoung, J.H., Jr., Seal, R.R., II, and Bradley, D.C., eds., 2017, Critical mineral resources of the United States—Economic and environmental geology and prospects for future supply: U.S. Geological Survey Professional Paper 1802, 797 p., accessed May 15, 2020, at https://doi.org/10.3133/pp1802.
Seal, R.R., II, 2021, Economic geology and environmental characteristics of antimony deposits, chap. C of Filella, M., ed., Antimony: De Gruyter, Berlin, Germany, p. 49–71, accessed May 22, 2021, at https://doi.org/10.1515/9783110668711-003.
Seal, R.R., II, Schulz, K.J., and DeYoung, J.H., Jr., Sutphin, D.M., Drew, L.J., Carlin, J.F., Jr., and Berger, B.R., 2017, Antimony, chap. C of Schulz, K.J., DeYoung, J.H., Jr., Seal, R.R., II, and Bradley, D.C., eds., Critical mineral resources of the United States—Economic and environmental geology and prospects for future supply: U.S. Geological Survey Professional Paper 1802, p. C1–C27, accessed June 15, 2021, at https://doi.org/10.3133/pp1802C.
Shawe, D.R., ed., 1976, Geology and resources of fluorine in the United States: U.S. Geological Survey Professional Paper 933, 99 p., accessed June 15, 2021, at https://doi.org/10.3133/pp933.
Sherlock, R.S., Tosdal, R.M., Lehrman, N.J., Graney, J.R., Losh, S., Jowett, E.C., and Kesler, S.E., 1995, Origin of the McLaughlin Mine sheeted vein complex—Metal zoning, fluid inclusion, and isotopic evidence: Economic Geology, v. 90, no. 8, p. 2156–2181, accessed August 30, 2021, at https://doi.org/10.2113/gsecongeo.90.8.2156.
Sibanye Stillwater, 2021, Stillwater & East Boulder: Sibanye Stillwater website, accessed May 19, 2021, at https://www.sibanyestillwater.com/business/americas/pgm-operations-americas/stillwater-east-boulder/.
Silver Elephant Mining Corp, 2021, Gibellini (Vanadium): Silver Elephant Mining Corp. website, accessed April 29, 2021, at https://www.silverelef.com/projects/gibellini-vanadium/.
Simons, F.S., Armbrustmacher, T.J., Van Noy, R.M., Zilka, N.T., Federspiel, F.E., and Ridenour, J., 1979, Mineral resources of the Beartooth Primitive Area and vicinity, Carbon, Park, Stillwater, and Sweet Grass Counties, Montana, and Part County, Wyoming: U.S. Geological Survey Bulletin 1391–F, 125 p., accessed February 24, 2020, at https://pubs.usgs.gov/bul/1391f/report.pdf.
Snyder, K.D., 1978, Geology of the Bayhorse fluorite deposit, Custer County, Idaho: Economic Geology, v. 73, no. 2, p. 207–214, accessed August 15, 2021, at https://doi.org/10.2113/gsecongeo.73.2.207.
SOPerior Fertilizer Corp, 2019, Blawn Mountain: SOPerior Fertilizer Corp. website, accessed February 24, 2020, at https://www.soperiorfertilizer.com/blawn-mountain/blawn-mountain/default.aspx.
Spano, T., Olds, T.A., Hall, S.M., Kampf, A.R., Lowers, H., and Burns, P.C., 2017, Finchite, IMA 2017-052—CNMNC Newsletter no. 39, October 2017, p.1282: Mineralogical Magazine, v. 81, no. 5, p. 1279–1286, accessed August 30, 2021, at https://doi.org/10.1180/minmag.2017.081.072.
Stryhas, B., Clarkson, B.M., and Wright, F., 2019, NI [Canadian National Instrument] 43–101 Technical report, Carlin Vanadium Project, Carlin, Nevada: Vancouver, British Columbia, Canada, First Vanadium Corporation, prepared by SRK Consulting (U.S.), Inc., Denver, Colo., 138 p., accessed April 29, 2021, at https://firstvanadium.com/images/Presentation/2019/abr/Carlin_NI43-101_Tech_Report_20190409.pdf.
Thayer, T.P., and Lipin, B.R., 1979, Preliminary map of chromite provinces in the conterminous United States: U.S. Geological Survey Open-File Report 79–576, scale 1:5,000,000, accessed May 10,2020, at https://pubs.usgs.gov/of/1979/0576r/plate-1.pdf.
Thoenen, J.R., 1932, Economics of potash recovery from wyomingite and alunite: U.S. Bureau of Mines Report of Investigations 3190, 22 p. [Also available at https://books.google.com/books?id=xJzjh4UBTlcC&pg=PP1#v=onepage&q&f=false.]
Tripp, T.G., 2009, Production of magnesium from Great Salt Lake, Utah USA: Natural Resources and Environmental Issues, v. 15, article 10, 7 p., accessed April 23, 2021, at https://digitalcommons.usu.edu/nrei/vol15/iss1/10.
University of Nevada, Reno, and Nevada Bureau of Mines and Geology, 2012, Golconda: Nevada Bureau of Mines and Geology Geothermal Site Descriptions, 3 p., accessed June 15, 2021, at https://data.nbmg.unr.edu/Public/Geothermal/SiteDescriptions/Golconda.pdf.
U.S. Department of the Interior, Office of the Secretary, 2018, Final list of critical minerals 2018: Federal Register, v. 83, no. 97, p. 23295–23296, accessed December 15, 2018, at https://www.federalregister.gov/documents/2018/05/18/2018-10667/final-list-of-critical-minerals-2018.
U.S. Energy Information Administration [EIA], 2020a, 2019 domestic uranium production report: EIA report, 15 p., accessed June 15, 2021, at https://www.eia.gov/uranium/production/annual/archive/dupr2019.pdf.
U.S. Energy Information Administration [EIA], 2020b, 2019 uranium marketing annual report: EIA report, 62 p., accessed June 15, 2021, at https://www.eia.gov/uranium/marketing/pdf/umar2019.pdf.
U.S. Energy Information Administration [EIA], 2021a, Electricity explained—Electricity in the United States: EIA website, accessed March 25, 2021, at https://www.eia.gov/energyexplained/electricity/electricity-in-the-us.php.
U.S. Energy Information Administration [EIA], 2021b, Table 8.2, uranium overview in Monthly energy review, July 2021: U.S. Energy Information Administration report DOE/EIA–0035(2021/7), p. 153, accessed March 23, 2021, at https://www.eia.gov/totalenergy/data/monthly/pdf/mer.pdf.
U.S. Geological Survey, 2020, GeoDAWN—Geoscience data acquisition for western Nevada: U.S. Geological Survey website, accessed May 19, 2021, at https://www.usgs.gov/media/images/geodawn-geoscience-data-acquisition-western-nevada.
U.S. Geological Survey, 2021a, Mineral commodity summaries 2021: U.S. Geological Survey, 200 p., accessed March 15, 2021, at https://doi.org/10.3133/mcs2021.
U.S. Geological Survey, 2021b, Geochemical data generated by projects funded by the USGS Earth Mapping Resources Initiative: U.S. Geological Survey data release, accessed August 30, 2021, at https://doi.org/10.5066/P9WHRLXH.
Urbanomics, 2019, Trail Ridge South mine, Bradford County special exception request: Chemours Company, FC, LLC, Starke, Fla., prepared by Sodl & Ingram, Jacksonville, Fla., and Kleinfelder, Jacksonville, Fla., no. 129494.003A/JAX19O99460, accessed April 30, 2021, at https://www.amazon.com/clouddrive/share/axUlCWEdI3QXIbz3b6rmdFjyrvuDPwieI6KLXKHcQcY/folder/hnoXjjjZTMSkM4y-H06-jg/k7XIVTcUT76TYIFvsKkRHA.
Van Gosen, B.S., and Hall, S.M., 2017, The discovery and character of Pleistocene calcrete uranium deposits in the Southern High Plains of west Texas, United States: U.S. Geological Survey Scientific Investigations Report 2017–5134, 27 p., accessed May 24, 2021, at https://doi.org/10.3133/sir20175134.
Van Gosen, B.S., Wilson, A.B., Hammarstrom, J.M., and Kulik, D.M., 1996, Mineral resource assessment of the Custer National Forest in the Pryor Mountains, Carlson County, south-central Montana: U.S. Geological Survey Open-File Report 96–256, 80 p., accessed April 28, 2021, at https://pubs.usgs.gov/of/1996/0256/report.pdf.
Van Gosen, B.S., Johnson, M.R., and Goldman, M.A., 2016, Three GIS datasets defining areas permissive for the occurrence of uranium-bearing, solution-collapse breccia pipes in northern Arizona and southeast Utah: U.S. Geological Survey data release, accessed May 28, 2021, at https://doi.org/10.5066/F76D5R3Z.
Van Gosen, B.S., Benzel, W.M., and Campbell, K.M., 2020a, Geochemical and X-ray diffraction analyses of drill core samples from the Canyon uranium-copper deposit, a solution-collapse breccia pipe, Grand Canyon area, Coconino County, Arizona: U.S. Geological Survey data release, accessed June 10, 2021, at https://doi.org/10.5066/P9UUILQI.
Van Gosen, B.S., Benzel, W.M., Kane, T.J., and Lowers, H.A., 2020b, Geochemical and mineralogical analyses of uranium ores from the Hack II and Pigeon deposits, solution-collapse breccia pipes, Grand Canyon region, Mohave and Coconino Counties, Arizona, USA: U.S. Geological Survey data release, accessed May 28, 2021, at https://doi.org/10.5066/P9VM6GKF.
Van Gosen, B.S., Benzel, W.M., Lowers, H.A., and Campbell, K.M., 2020c, Mineralogical analyses of drill core samples from the Canyon uranium-copper deposit, a solution-collapse breccia pipe, Grand Canyon area, Coconino County, Arizona, USA: U.S. Geological Survey data release, accessed June 10, 2021, at https://doi.org/10.5066/P9F745JX.
Wenrich, K.J., 1985, Mineralization of breccia pipes in northern Arizona: Economic Geology, v. 80, no. 6, p. 1722–1735, accessed August 30, 2021, at https://doi.org/10.2113/gsecongeo.80.6.1722.
Wetzel, D., 2012, ND potash deposit not as promising as thought: Bismarck Tribune, February 12, 2012, accessed August 17, 2020, at https://bismarcktribune.com/news/state-and-regional/nd-potash-deposits-not-as-promising-as-thought/article_f24a5f42-5f3e-11e1-b8c7-001871e3ce6c.html.
White, D.E., 1940, Antimony deposits of a part of the Yellow Pine district, Valley County, Idaho, a preliminary report: U.S. Geological Survey Bulletin 922–I, p. 247–279. [Also available at https://doi.org/10.3133/b922I.]
White House, 2017, A Federal strategy to ensure secure and reliable supplies of critical minerals—Executive Order 13817 of December 20, 2017: Federal Register, v. 82, no. 246, document 2017–27899, p. 60835–60837, accessed February 14, 2018, at https://www.federalregister.gov/documents/2017/12/26/2017-27899/a-federal-strategy-to-ensure-secure-and-reliable-supplies-of-critical-minerals.
Worl, R.G., Van Alstine, R.E., and Shawe, D.R., 1973, Fluorine, in Brobst, D.A., and Pratt, W.P., eds., 1973, United States mineral resources: U.S. Geological Survey Professional Paper 820, p. 223–235, accessed February 24, 2020, at https://doi.org/10.3133/pp820.
World Nuclear Association, 2021, Uranium Production Figures, 2010–2019 web page: World Nuclear Association website, accessed April 12,2021, at https://www.world-nuclear.org/information-library/facts-and-figures/uranium-production-figures.aspx.
Zientek, M.L., 1993, Mineral resource appraisal for locatable mineral—The Stillwater Complex, in Hammarstrom, J.M., Zientek, M.L., and Elliott, J.E., eds., Mineral resource assessment of the Absaroka-Beartooth study area, Custer and Gallatin National Forests, Montana: U.S. Geological Survey Open-File Report 93–207, p. F1–F83, accessed April 15, 2021, at https://doi.org/10.3133/ofr93207.
Zimmerman, R.K., Ibrado, A., Dunn, G.M., Kirkham, G.D., Martin, C.J., Kowalewski, P.E., Roos, C.J., and Rosenthal, S., 2021, [NI (Canadian National Instrument) 43–101] Stibnite Gold Project feasibility study technical report, Valley County, Idaho: Midas Gold Corp., Boise, Idaho, [prepared by M3 Engineering & Technology Corp., Tucson, Ariz.], [M3–PN170045], [variously paged; 675 p.], accessed March 22, 2021, at https://investors.perpetuaresources.com/site/assets/files/2459/2021-01-27-feasibility-study.pdf.
Appendix 1. Mineral Systems Framework
Forward costs include power and fuel, labor, materials, insurance, severance and advalorem taxes, and applicable administrative costs. The forward costs used to estimate U.S. uranium ore reserves are independent of the price at which uranium produced from the estimated reserves might be sold in the commercial market. Reserves values in forward-cost categories are cumulative; that is, the quantity at each level of forward cost includes all reserves at the lower cost in that category (EIA, 2021a).
Reference Cited
Hofstra, A.H., and Kreiner, D.C., 2020, Systems-deposits-commodities-critical minerals table for the Earth Mapping Resources Initiative (ver. 1.1, May 2021): U.S. Geological Survey Open-File Report 2020–1042, 26 p., accessed May 30, 2021, at https://doi.org/10.3133/ofr20201042.
References Cited in Table 1 of Hofstra and Kreiner (2020)
Alpine, A.E., ed., 2010, Hydrological, geological, and biological site characterization of breccia pipe uranium deposits in northern Arizona: U.S. Geological Survey Scientific Investigations Report 2010–5025, 353 p., 1 pl., scale 1:375,000, accessed April 18, 2020, at https://doi.org/10.3133/sir20105025.
Ash, C., 1996, Podiform chromite [profile] M03, in Lefebure, D.V., and Höy, T., eds., Selected British Columbia mineral deposit profiles—Volume 2—Metallic deposits: British Columbia Ministry of Employment and Investment, Geological Survey Branch, Open File 1996–13, p. 109–112. [Also available at http://cmscontent.nrs.gov.bc.ca/geoscience/PublicationCatalogue/OpenFile/BCGS_OF1996-13.pdf.]
Audétat, A., and Li, W., 2017, The genesis of Climax type porphyry Mo deposits—Insights from fluid inclusions and melt inclusions: Ore Geology Reviews, v. 88, p. 436–460. [Also available at https://doi.org/10.1016/j.oregeorev.2017.05.018.]
Balistrieri, L.S., Box, S.E., and Bookstrom, A.A., 2002, A geoenvironmental model for polymetallic vein deposits—A case study in the Coeur d’Alene mining district and comparisons with drainage from mineralized deposits in the Colorado Mineral Belt and Humboldt Basin, Nevada, chap. I of Seal, R.R., II, and Foley, N.K., eds., Progress on geoenvironmental models for selected mineral deposit types: U.S. Geological Survey Open-File Report 02–195, p. 143–160. [Also available at https://doi.org/10.3133/ofr02195.]
Barton, M.D., 2014, Iron oxide(–Cu–Au–REE–P–Ag–U–Co) systems, chap. 13.20 of Heinrich, D.H., and Turekian, K.K., eds., Treatise on geochemistry, (2d ed.): Amsterdam, Netherlands, Elsevier, p. 515–541, accessed April 18, 2020, at https://doi.org/10.1016/B978-0-08-095975-7.01123-2.
Beaudoin, G., and Sangster, D.F., 1992, A descriptive model for silver-lead-zinc veins in clastic metasedimentary terranes: Economic Geology, v. 87, no. 4, p. 1005–1021, accessed April 18, 2020, at https://doi.org/10.2113/gsecongeo.87.4.1005.
Beaudoin, G., and Sangster, D.F., 1995, Clastic metasediment-hosted vein silver-lead-zinc, in Eckstrand, O.R., Sinclair, W.D., and Thorpe, R.I., eds., Geology of Canadian mineral deposit types: Geological Survey of Canada, Geology of Canada 8, p. 393–398. [Also available at https://doi.org/10.4095/208008.]
Bradley, D.C., McCauley, A.D., and Stillings, L.M., 2017a, Mineral-deposit model for lithium-cesium-tantalum pegmatites, chap. O of Mineral deposit models for resource assessment: U.S. Geological Survey Scientific Investigations Report 2010–5070–O, 48 p., accessed April 18, 2020, at https://doi.org/10.3133/sir20105070O.
Bradley, D., Munk, L., Jochens, H., Hynek, S., and Labay, K., 2013, A preliminary deposit model for lithium brines: U.S. Geological Survey Open-File Report 2013–1006, 6 p., accessed April 18, 2020, at https://doi.org/10.3133/ofr20131006.
Bradley, D.C., Stillings, L.L., Jaskula, B.W., Munk, L., and McCauley, A.D., 2017b, Lithium, chap. K of Schulz, K.J., DeYoung, J.H., Jr., Seal, R.R., II, and Bradley, D.C., eds., Critical mineral resources of the United States—Economic and environmental geology and prospects for future supply: U.S. Geological Survey Professional Paper 1802, p. K1–K21, accessed April 18, 2020, at https://doi.org/10.3133/pp1802K.
Breit, G.N., 2016, Resource potential for commodities in addition to uranium in sandstone-hosted deposits, chap. 13 of Verplanck, P.L., and Hitzman, M.W., eds., Rare earth and critical elements in ore deposits: Littleton, Colo., Society of Economic Geologists, Reviews in economic geology series, v. 18, p. 323–338. [Also available at https://doi.org/10.5382/Rev.18.13.]
Breit, G.N., and Hall, S.M., 2011, Deposit model for volcanogenic uranium deposits: U.S. Geological Survey Open-File Report 2011–1255, 5 p., accessed April 18, 2020, at https://doi.org/10.3133/ofr20111255.
Brennan, S.T., and East, J.A., II, 2015, The U.S. Geological Survey national helium resource assessment [abs.], in American Geophysical Union Fall Meeting, 2015, San Francisco, Calif., December 14–18, 2015, Abstracts: American Geophysical Union, abs. IN33A–1789, 1 p., accessed March 30, 2021, at https://ui.adsabs.harvard.edu/abs/2015AGUFMIN33A1789B/abstract.
Burisch, M., Gerdes, A., Walter, B.F., Neumann, U., Fettel, M., and Markl, G., 2017, Methane and the origin of five element veins—Mineralogy, age, fluid inclusion chemistry and ore forming processes in the Odenwald, SW Germany: Ore Geology Reviews, v. 81, pt. 1, p. 42–61, accessed April 18, 2020, at https://doi.org/10.1016/j.oregeorev.2016.10.033.
Cannon, W.F., Kimball, B.E., and Corathers, L.A., 2017, Manganese, chap. L of Schulz, K.J., DeYoung, J.H., Jr., Seal, R.R., II, and Bradley, D.C., eds., Critical mineral resources of the United States—Economic and environmental geology and prospects for future supply: U.S. Geological Survey Professional Paper 1802, p. L1–L28, accessed April 18, 2020, at https://doi.org/10.3133/pp1802L.
Černý, P., and Ercit, T.S., 2005, The classification of granitic pegmatites revisited: Canadian Mineralogist, v. 43, no. 6, p. 2005–2026, accessed April 18, 2020, at https://doi.org/10.2113/gscanmin.43.6.2005.
Cox, D.P., and Singer, D.A., 2007, Descriptive and grade-tonnage models and database for iron oxide Cu-Au deposits: U.S. Geological Survey Open-File Report 2007–1155, 13 p., accessed April 18, 2020, at https://doi.org/10.3133/ofr20071155.
Craddock, W.H., Blondes, M.S., DeVera, C.A., and Hunt, A.G., 2017, Mantle and crustal gases of the Colorado Plateau—Geochemistry, sources, and migration pathways: Geochimica et Cosmochimica Acta, v. 213, p. 346–374, accessed August 30, 2021, at https://doi.org/10.1016/j.gca.2017.05.017.
Day, W.C., 2019, The Earth Mapping Resources Initiative (Earth MRI)—Mapping the Nation’s critical mineral resources (ver. 1.2, September 2019): U.S. Geological Survey Fact Sheet 2019–3007, 2 p., accessed April 18, 2020, at https://doi.org/10.3133/fs20193007.
Denny, F.B., Devera, J.A., and Seid, M.J., 2016, Fluorite deposits within the Illinois-Kentucky Fluorspar district and how they relate to the Hicks Dome cryptoexplosive feature, Hardin County, Illinois, in Lasemi, Z., and Elrick, S., eds., 1967–2016—Celebrating 50 years of geoscience in the mid-continent—Guidebook for the 50th Annual Meeting of the Geological Society of America North-Central Section, April 18–19, 2016: Illinois State Geological Survey Guidebook 43, p. 39–54.
Denny, F.B., Guillemette, R.N., and Lefticariu, L., 2015, Rare earth mineral concentrations in ultramafic alkaline rocks and fluorite within the Illinois-Kentucky Fluorite district—Hicks Dome cryptoexplosive complex, southeast Illinois and northwest Kentucky (USA), in Lasemi, Z., ed., Proceedings of the 47th Forum on the Geology of Industrial Minerals: Illinois State Geological Survey Circular 587, p. 77–92.
Dicken, C.L., Horton, J.D., San Juan, C.A., Anderson, A.K., Ayuso, R.A., Bern, C.R., Bookstrom, A.A., Bradley, D.C., Bultman, M.W., Carter, M.W., Cossette, P.M., Day, W.C., Drenth, B.J., Emsbo, P., Foley, N.K., Frost, T.P., Gettings, M.E., Hammarstrom, J.M., Hayes, T.S., Hofstra, A.H., Hubbard, B.E., John, D.A., Jones, J.V., III, Kreiner, D.C., Lund, K., McCafferty, A.E., Merschat, A.J., Ponce, D.A., Schulz, K.J., Shah, A.K., Siler, D.L., Taylor, R.D., Vikre, P.G., Walsh, G.J., Woodruff, L.G., and Zurcher, L., 2019, GIS and data tables for focus areas for potential domestic nonfuel sources of rare earth elements: U.S. Geological Survey data release, accessed April 18, 2020, at https://doi.org/10.5066/P95CHIL0.
Dostal, J., 2016, Rare metal deposits associated with alkaline/peralkaline igneous rocks, chap. 2 of Verplanck, P.L., and Hitzman, M.W., eds., Rare earth and critical elements in ore deposits: Littleton, Colo., Society of Economic Geologists, Reviews in Economic Geology series, v. 18, p. 33–54. [Also available at https://doi.org/10.5382/Rev.18.02.]
Dostal, J., 2017, Rare earth element deposits of alkaline igneous rocks: Resources, v. 6, no. 3, article 34, 12 p., accessed March 30, 2021, at https://www.mdpi.com/2079-9276/6/3/34.
DSM Observer, 2020, Beyond batteries—Exploring the demand for scandium and tellurium from the deep ocean: Deep Sea Mining News & Resources, November 19, 2020, accessed April 12, 2021, at https://dsmobserver.com/2020/11/beyond-batteries-exploring-the-demand-for-scandium-and-tellurium-from-the-deep-ocean/.
Dyni, J.R., 1991, Descriptive model of sodium carbonate in bedded lacustrine evaporites—Deposit subtype—Green River (Model 35b.1), in Orris, G.J., and Bliss, J.D., eds., Some industrial mineral deposit models—Descriptive deposit models: U.S. Geological Survey Open-File Report 91–11A, p. 46–50. [Also available at https://doi.org/10.3133/ofr9111A.]
Emsbo, P., 2000, Gold in sedex deposits, in Hagemann, S.G., and Brown, P.E., eds., Gold in 2000: Littleton, Colo., Society of Economic Geologists, Reviews in Economic Geology series, v. 13, p. 427–437. [Also available at https://doi.org/10.5382/Rev.13.13.]
Emsbo, P., 2009, Geologic criteria for the assessment of sedimentary exhalative (sedex) Zn-Pb-Ag deposits: U.S. Geological Survey Open-File Report 2009–1209, 21 p. [Also available at https://doi.org/10.3133/ofr20091209.]
Emsbo, P., McLaughlin, P.I., Breit, G.N., du Bray, E.A., and Koenig, A.E., 2015, Rare earth elements in sedimentary phosphate deposits—Solution to the global REE crisis?: Gondwana Research, v. 27, no. 2, p. 776–785, accessed April 18, 2020, at https://doi.org/10.1016/j.gr.2014.10.008.
Emsbo, P., McLaughlin, P.I., du Bray, E.A., Anderson, E.D., Vandenbroucke, T.R.A., and Zielinski, R.A., 2016b, Rare earth elements in sedimentary phosphorite deposits—A global assessment, chap. 5 of Verplanck, P.L, and Hitzman, M.W., eds., Rare earth and critical elements in ore deposits: Littleton, Colo., Society of Economic Geologists, Reviews in Economic Geology series, v. 18, p. 101–114. [Also available at https://doi.org/10.5382/Rev.18.05.]
Emsbo, P., Seal, R.R., Breit, G.N., Diehl, S.F., and Shah, A.K., 2016a, Sedimentary exhalative (sedex) zinc-lead silver deposit model, chap. N of Mineral deposit models for resource assessment: U.S. Geological Survey Scientific Investigations Report 2010–5070–N, 57 p., accessed April 18, 2020, at https://doi.org/10.3133/sir20105070N.
Ernst, R.E., and Jowitt, S.M., 2013, Large igneous provinces (LIPs) and metallogeny, chap. 2 of Colpron, M., Bissig, T., Rusk, B.G., and Thompson, J.F.H., eds., Tectonics, metallogeny, and discovery—The North American Cordillera and similar accretionary settings: Tulsa, Okla., Society of Economic Geologists, Special publication series, v. 17, p. 17–51. [Also available at https://doi.org/10.5382/SP.17.02.]
Executive Office of the President, 2017, A Federal strategy to ensure secure and reliable supplies of critical minerals: Federal Register, v. 82, no. 246, p. 60835–60837, accessed April 18, 2020, at https://www.federalregister.gov/documents/2017/12/26/2017-27899/a-federal-strategy-toensure-secure-and-reliable-supplies-of-critical-minerals.
Foley, N., and Ayuso, R., 2015, REE enrichment in granite-derived regolith deposits of the southeastern United States—Prospective source rocks and accumulation processes, in Simandl, G.J., and Neetz, M., eds., Symposium on strategic and critical materials proceedings, November 13–14, 2015, Victoria, British Columbia: British Columbia Ministry of Energy and Mines, British Columbia Geological Survey Paper 2015–3, p. 131–138. [Also available at http://cmscontent.nrs.gov.bc.ca/geoscience/PublicationCatalogue/Paper/BCGS_P2015-03.pdf.]
Foley, N.K., Hofstra, A.H., Lindsey, D.A., Seal, R.R., II, Jaskula, B., and Piatak, N.M., 2012, Occurrence model for volcanogenic beryllium deposits, chap. F of Mineral deposit models for resource assessment: U.S. Geological Survey Scientific Investigations Report 2010–5070–F, 43 p., accessed April 18, 2020, at https://pubs.usgs.gov/sir/2010/5070/f/SIR10-5070F.pdf.
Force, E.R., Paradis, S., and Simandl, G.J., 1999, Sedimentary manganese [profile] F01, in Simandl, G.J., Hora, Z.D., and Lefebure, D.V., eds., Selected British Columbia mineral deposit profiles—Volume 3—Industrial minerals and gemstones: British Columbia Ministry of Energy and Mines, Geological Survey Branch Open File 1999–10, p. 47–50. [Also available at http://cmscontent.nrs.gov.bc.ca/geoscience/PublicationCatalogue/OpenFile/BCGS_OF1999-10.pdf.]
Fortier, S.M., Nassar, N.T., Lederer, G.W., Brainard, J., Gambogi, J., and McCullough, E.A., 2018, Draft critical mineral list—Summary of methodology and background information—U.S. Geological Survey technical input document in response to Secretarial Order No. 3359: U.S. Geological Survey Open-File Report 2018–1021, 15 p., accessed April 18, 2020, at https://doi.org/10.3133/ofr20181021.
Geological Survey of Western Australia, 2019, Mineral systems atlas: Government of Western Australia, Department of Mines, Industry Regulation and Safety website, accessed April 18, 2020, at http://www.dmp.wa.gov.au/msa.
Geoscience Australia, 2019, Mineral systems of Australia: Geoscience Australia website, accessed April 18, 2020, at https://www.ga.gov.au/about/projects/resources/mineral-systems.
Goldfarb, R.J., Baker, T., Dubé, B., Groves, D.I., Hart, C.J.R., and Gosselin, P., 2005, Distribution, character, and genesis of gold deposits in metamorphic terranes, in Hedenquist, J.W., Thompson, J.F.H., Goldfarb, R.J., and Richards, J.P., eds., Economic geology—One hundredth anniversary volume, 1905–2005: Littleton, Colo., Society of Economic Geologists, p. 407–450. [Also available at https://doi.org/10.5382/AV100.14].
Goldfarb, R.J., Hofstra, A.H., and Simmons, S.F., 2016, Critical elements in Carlin, epithermal, and orogenic gold deposits, chap. 10 of Verplanck, P.L., and Hitzman, M.W., eds., Rare earth and critical elements in ore deposits: Littleton, Colo., Society of Economic Geologists, Reviews in Economic Geology series, v. 18, p. 217–244. [Also available at https://doi.org/10.5382/Rev.18.10.]
Gray, J.E., and Bailey, E.A., 2003, The southwestern Alaska mercury belt, in Gray, J.E., ed., Geologic studies of mercury by the U.S. Geological Survey: U.S. Geological Survey Circular 1248, p. 19–22. [Also available at https://doi.org/10.3133/cir1248.]
Groves, D.I., Bierlein, F.P., Meinert, L.D., and Hitzman, M.W., 2010, Iron oxide copper-gold (IOCG) deposits through Earth history—Implications for origin, lithospheric setting, and distinction from other epigenetic iron oxide deposits: Economic Geology, v. 105, no. 3, p. 641–654, accessed April 18, 2020, at https://doi.org/10.2113/gsecongeo.105.3.641.
Groves, D.I., Goldfarb, R.J., Gebre-Mariam, M., Hagemann, S.G., and Robert, F., 1998, Orogenic gold deposits—A proposed classification in the context of their crustal distribution and relationship to other gold deposit types: Ore Geology Reviews, v. 13, nos. 1–5, p. 7–27. [Also available at https://doi.org/10.1016/S0169-1368(97)00012-7.]
Hall, S.M., Van Gosen, B.S., Paces, J.B., Zielinski, R.A., and Breit, G.N., 2019, Calcrete uranium deposits in the Southern High Plains, USA: Ore Geology Reviews, v. 109, p. 50–78, accessed April 18, 2020, at https://doi.org/10.1016/j.oregeorev.2019.03.036.
Hammarstrom, J.H., and Dicken, C.L., 2019, Focus areas for data acquisition for potential domestic sources of critical minerals—Rare earth elements, chap. A of U.S. Geological Survey, Focus areas for data acquisition for potential domestic sources of critical minerals: U.S. Geological Survey Open-File Report 2019–1023, 11 p., accessed April 18, 2020, at https://doi.org/10.3133/ofr20191023A.
Hart, C.J.R., 2007, Reduced intrusion-related gold systems, in Goodfellow, W.D., ed., Mineral deposits of Canada—A synthesis of major deposit types, district metallogeny, the evolution of geological provinces and exploration methods: St. John’s, Newfoundland and Labrador, Canada, Geological Association of Canada, Special publication 5, p. 95–112.
Hayes, S.M., and McCullough, E.A., 2018, Critical minerals—A review of elemental trends in comprehensive criticality studies: Resources Policy, v. 59, p. 192–199. [Also available at https://doi.org/10.1016/j.resourpol.2018.06.015.]
Hayes, T.S., Cox, D.P., Piatak, N.M., and Seal, R.R., II, 2015, Sediment-hosted stratabound copper deposit model, chap. M of Mineral deposit models for resource assessment: U.S. Geological Survey Scientific Investigations Report 2010–5070–M, 147 p., accessed April 18, 2020, at https://doi.org/10.3133/sir20105070M.
Hayes, T.S., Miller, M.M., Orris, G.J., and Piatak, N.M., 2017, Fluorine, chap. G of Schulz, K.J., DeYoung, J.H., Jr., Seal, R.R., II, and Bradley, D.C., eds., Critical mineral resources of the United States—Economic and environmental geology and prospects for future supply: U.S. Geological Survey Professional Paper 1802, p. G1–G80, accessed April 18, 2020, at https://doi.org/10.3133/pp1802G.
Hofstra, A.H., and Cline, J.S., 2000, Characteristics and models for Carlin-type gold deposits, chap. 5 of Hagemann, S.G., and Brown, P.E., eds., Gold in 2000: Littleton, Colo., Society of Economic Geologists, Reviews in Economic Geology series, v. 13, p. 163–220. [Also available at https://doi.org/10.5382/Rev.13.05.]
Hofstra, A.H., Cosca, M.A., and Rockwell, B.W., 2014, Advanced argillic lithocaps above Climax-type Mo porphyries? Evidence from porphyry clusters in New Mexico, Utah, and Colorado [abs.] in SEG 2014—Building exploration capability for the 21st century, Keystone, Colo., September 27–30, 2014, [proceedings]: Keystone, Colo., Society of Economic Geologists Annual Meeting, 1 p. [Also available at https://www.segweb.org/SEG/_Events/Conference_Archive/2014/Conference_Proceedings/data/index.htm.]
Hofstra, A.H., Marsh, E.E., Todorov, T.I., and Emsbo, P., 2013a, Fluid inclusion evidence for a genetic link between simple antimony veins and giant silver veins in the Coeur d’Alene mining district, ID and MT, USA: Geofluids, v. 13, no. 4, p. 475–493, accessed April 18, 2020, at https://doi.org/10.1111/gfl.12036.
Hofstra, A.H., Todorov, T.I., Mercer, C.N., Adams, D.T., and Marsh, E.E., 2013b, Silicate melt inclusion evidence for extreme pre-eruptive enrichment and post-eruptive depletion of lithium in silicic volcanic rocks of the western United States—Implications for the origin of lithium-rich brines: Economic Geology, v. 108, no. 7, p. 1691–1701, accessed April 18, 2020, at https://doi.org/10.2113/econgeo.108.7.1691.
Hulsbosch, N., 2019, Nb‐Ta‐Sn‐W distribution in granite‐related ore systems—Fractionation mechanisms and examples from the Karagwe‐Ankole Belt of Central Africa, chap. 4 of Decrée, S., and Robb, L., eds., Ore deposits—Origin, exploration, and exploitation: American Geophysical Union, Washington, D.C., and Wiley, Hoboken, N.J., Geophysical monograph series 242, p. 75–107. [Also available at https://doi.org/10.1002/9781119290544.ch4.]
Huston, D.L., Mernagh, T.P., Hagemann, S.G., Doublier, M.P., Fiorentini, M., Champion, D.C., Jaques, A.L., Czarnota, K., Cayley, R., Skirrow, R., and Bastrakov, E., 2016, Tectono-metallogenic systems—The place of mineral systems within tectonic evolution, with an emphasis on Australian examples: Ore Geology Reviews, v. 76, p. 168–210. [Also available at https://doi.org/10.1016/j.oregeorev.2015.09.005.]
International Atomic Energy Agency [IAEA], 2020, Descriptive uranium deposit and mineral system models: Vienna, Austria, IAEA, 313 p., accessed August 30, 2021, at https://www-pub.iaea.org/MTCD/Publications/PDF/DES_MOD_web.pdf.
Jensen, E.P., and Barton, M.D., 2000, Gold deposits related to alkaline magmatism, chap. 8 of Hagemann, S.G., and Brown, P.E., eds., Gold in 2000: Littleton, Colo., Society of Economic Geologists, Reviews in Economic Geology series, v. 13, p. 279–314. [Also available at https://doi.org/10.5382/Rev.13.08.]
John, D.A., Ayuso, R.A., Barton, M.D., Blakely, R.J., Bodnar, R.J., Dilles, J.H., Gray, F., Graybeal, F.T., Mars, J.C., McPhee, D.K., Seal, R.R., Taylor, R.D., and Vikre, P.G., 2010, Porphyry copper deposit model, chap. B of Mineral deposit models for resource assessment: U.S. Geological Survey Scientific Investigations Report 2010–5070–B, 169 p., accessed April 18, 2020, at https://pubs.usgs.gov/sir/2010/5070/b/pdf/SIR10-5070B.pdf.
John, D.A., Seal, R.R., II, and Polyak, D.E., 2017, Rhenium, chap. P of Schulz, K.J., DeYoung, J.H., Jr., Seal, R.R., II, and Bradley, D.C., eds., Critical mineral resources of the United States—Economic and environmental geology and prospects for future supply: U.S. Geological Survey Professional Paper 1802, p. P1–P49, accessed April 18, 2020, at https://doi.org/10.3133/pp1802P.
John, D.A., and Taylor, R.D., 2016, By-products of porphyry copper and molybdenum deposits, chap. 8 of Verplanck, P.L, and Hitzman, M.W., eds., Rare earth and critical elements in ore deposits: Littleton, Colo., Society of Economic Geologists, Reviews in Economic Geology series, v. 18, p. 137–164. [Also available at https://doi.org/10.5382/Rev.18.07.]
Johnson, C.A., Piatak, N.M., and Miller, M.M., 2017, Barite (barium), chap. D of Schulz, K.J., DeYoung, J.H., Jr., Seal, R.R., II, and Bradley, D.C., eds., Critical mineral resources of the United States—Economic and environmental geology and prospects for future supply: U.S. Geological Survey Professional Paper 1802, p. D1–D18, accessed April 18, 2020, at https://doi.org/10.3133/pp1802D.
Jones, J.V., III, Piatak, N.M., and Bedinger, G.M., 2017, Zirconium and hafnium, chap. V of Schulz, K.J., DeYoung, J.H., Jr., Seal, R.R., II, and Bradley, D.C., eds., Critical mineral resources of the United States—Economic and environmental geology and prospects for future supply: U.S. Geological Survey Professional Paper 1802, p. V1–V26, accessed April 18, 2020, at https://doi.org/10.3133/pp1802V.
Kamilli, R.J., Kimball, B.E., and Carlin, J.F., Jr., 2017, Tin, chap. S of Schulz, K.J., DeYoung, J.H., Jr., Seal, R.R., II, and Bradley, D.C., eds., Critical mineral resources of the United States—Economic and environmental geology and prospects for future supply: U.S. Geological Survey Professional Paper 1802, p. S1–S53, accessed April 18, 2020, at https://doi.org/10.3133/pp1802S.
Kelley, K.D., and Spry, P.G., 2016, Critical elements in alkaline igneous rock-related epithermal gold deposits, chap. 9 of Verplanck, P.L, and Hitzman, M.W., eds., Rare earth and critical elements in ore deposits: Littleton, Colo., Society of Economic Geologists, Reviews in economic geology series, v. 18, p. 195–216. [Also available at https://doi.org/10.5382/Rev.18.09.]
King, H.M., 2020, Helium—A byproduct of the natural gas industry: Geology.com website, accessed October 7, 2020, at https://geology.com/articles/helium/.
Kissin, S.A., 1992, Five-element (Ni-Co-As-Ag-Bi) veins: Geoscience Canada, v. 19, no. 3, p. 113–124. [Also available at https://www.erudit.org/en/journals/geocan/1992-v19-n3-geocan_19_3/geocan19_3art02.pdf.]
Knox-Robinson, C.M., and Wyborn, L.A.I., 1997, Towards a holistic exploration strategy—Using geographic information systems as a tool to enhance exploration: Australian Journal of Earth Sciences, v. 44, no. 4, p. 453–463. [Also available at https://doi.org/10.1080/08120099708728326.]
Leach, D.L., Hofstra, A.H., Church, S.E., Snee, L.W., Vaughn, R.B., and Zartman, R.E., 1998, Evidence for Proterozoic and Late Cretaceous-early Tertiary ore-forming events in the Coeur d’Alene district, Idaho and Montana: Economic Geology, v. 93, no. 3, p. 347–359. [Also available at https://doi.org/10.2113/gsecongeo.93.3.347.]
Leach, D.L., Landis, G.P., and Hofstra, A.H., 1988, Metamorphic origin of the Coeur d’Alene base- and precious-metal veins in the Belt basin, Idaho and Montana: Geology, v. 16, no. 2, p. 122–125. [Also available at https://doi.org/10.1130/0091-7613(1988)016<0122:MOOTCD>2.3.CO;2.]
Leach, D.L., Taylor, R.D., Fey, D.L., Diehl, S.F., and Saltus, R.W., 2010, A deposit model for Mississippi Valley-Type lead-zinc ores, chap. A of Mineral deposit models for resource assessment: U.S. Geological Survey Scientific Investigations Report 2010–5070–A, 52 p., accessed April 18, 2020, at https://doi.org/10.3133/sir20105070A.
Lefebure, D.V., and Coveney, R.M., Jr., 1995, Shale-hosted Ni-Zn-Mo-PGE [profile] E16, in Lefebure, D.V., and Ray, G.E., eds., Selected British Columbia mineral deposit profiles—Volume 1—Metallics and coal: Province of British Columbia Ministry of Energy, Mines, and Petroleum Resources, Geological Survey Branch Open File 1995–20, p. 45–48. [Also available at http://cmscontent.nrs.gov.bc.ca/geoscience/PublicationCatalogue/OpenFile/BCGS_OF1995-20.pdf.]
Levson, V.M., 1995, Marine placers [profile] C03, in Lefebure, D.V., and Ray, G.E., eds., Selected British Columbia mineral deposit profiles—Volume 1—Metallics and coal: Province of British Columbia Ministry of Energy, Mines and Petroleum Resources, Geological Survey Branch Open File 1995–20, p. 29–31. [Also available at http://cmscontent.nrs.gov.bc.ca/geoscience/PublicationCatalogue/OpenFile/BCGS_OF1995-20.pdf.]
London, D., 2016, Rare-element granitic pegmatites, chap. 8 of Verplanck, P.L, and Hitzman, M.W., eds., Rare earth and critical elements in ore deposits: Littleton, Colo., Society of Economic Geologists, Reviews in Economic Geology series, v. 18, p. 165–194. [Also available at https://doi.org/10.5382/Rev.18.08.]
Long, K.R., Wynn, J.C., Fritz, F., and Corbett, J., 1992, Lacustrine manganese—A supplement to U.S. Geological Survey Bulletin 1693: U.S. Geological Survey Open-File Report 92–239, 12 p. [Also available at https://doi.org/10.3133/ofr92239.
Ludington, S., and Plumlee, G.S., 2009, Climax-type porphyry molybdenum deposits: U.S. Geological Survey Open-File Report 2009–1215, 16 p. [Also available at https://doi.org/10.3133/ofr20091215.]
Luque, F.J., Huizenga, J.-M., Crespo-Feo, E., Wada, H., Ortega, L., and Barrenechea, J.F., 2014, Vein graphite deposits—Geological settings, origin, and economic significance: Mineralium Deposita, v. 49, no. 2, p. 261–277. [Also available at https://doi.org/10.1007/s00126-013-0489-9.]
Magoon, L.B., and Dow, W.G., eds., 1994, The petroleum system—From source to trap:Tulsa, Okla., American Association of Petroleum Geologists, AAPG Memoir, v. 60, 620 p. [Also available at https://doi.org/10.1306/M60585.
Manning, A.H., and Emsbo, P., 2018, Testing the potential role of brine reflux in the formation of sedimentary exhalative (sedex) ore deposits: Ore Geology Reviews, v. 102, p. 862–874, accessed August 30, 2021, at https://doi.org/10.1016/j.oregeorev.2018.10.003.
Markl, G., Burisch, M., and Neumann, U., 2016, Natural fracking and the genesis of five-element veins: Mineralium Deposita, v. 51, no. 6, p. 703–712, accessed August 30, 2021, at https://doi.org/10.1007/s00126-016-0662-z.
Marsh, E.E., Anderson, E.D., and Gray, F., 2013, Nickel-cobalt laterites—A deposit model, chap. H of Mineral deposit models for resource assessment: U.S. Geological Survey Scientific Investigations Report 2010–5070–H, 38 p., accessed April 18, 2020, at https://doi.org/10.3133/sir20105070H.
Marsh, E.E., Hitzman, M.W., and Leach, D.L., 2016, Critical elements in sediment-hosted deposits (clastic-dominated Zn-Pb-Ag, Mississippi Valley-type Zn-Pb, sedimentary rock-hosted stratiform Cu, and carbonate-hosted polymetallic deposits)—A review, chap. 12 of Verplanck, P.L., and Hitzman, M.W., eds., Rare earth and critical elements in ore deposits: Littleton, Colo., Society of Economic Geologists, Reviews in Economic Geology series, v. 18, p. 307–322. [Also available at https://doi.org/10.5382/Rev.18.12.]
Martin, R.F., and De Vito, C., 2005, The patterns of enrichment in felsic pegmatites ultimately depend on tectonic setting: Canadian Mineralogist, v. 43, no. 6, p. 2027–2048. [Also available at https://doi.org/10.2113/gscanmin.43.6.2027.]
McCuaig, T.C., Beresford, S., and Hronsky, J., 2010, Translating the mineral systems approach into an effective exploration targeting system: Ore Geology Reviews, v. 38, no. 3, p. 128–138. [Also available at https://doi.org/10.1016/j.oregeorev.2010.05.008.]
McKinney, S.T., Cottle, J.M., and Lederer, G.W., 2015, Evaluating rare earth element (REE) mineralization mechanisms in Proterozoic gneiss, Music Valley, California: Geological Society of America Bulletin, v. 127, nos. 7–8, p. 1135–1152, accessed August 30, 2021, at https://doi.org/10.1130/B31165.1.
Menzel, M.D., Garrido, C.J., Sánchez-Vizcaíno, V.L., Marchesi, C., Hidas, K., Escayola, M.P., and Huertas, A.D., 2018, Carbonation of mantle peridotite by CO2-rich fluids—The formation of listvenites in the Advocate ophiolite complex (Newfoundland, Canada): Lithos, v. 323, p. 238–261, accessed March 30, 2021, at https://doi.org/10.1016/j.lithos.2018.06.001.
Monecke, T., Petersen, S., Hannington, M.D., Grant, H., and Samson, I.M., 2016, The minor element endowment of modern sea-floor massive sulfides and comparison with deposits hosted in ancient volcanic successions, chap. 11 of Verplanck, P.L., and Hitzman, M.W., eds., Rare earth and critical elements in ore deposits: Littleton, Colo., Society of Economic Geologists, Reviews in Economic Geology series, v. 18, p. 245–306. [Also available at https://doi.org/10.5382/Rev.18.11.]
Mountney, N.P., 2005, Sedimentary environments—deserts, in Selley, R.C., Cocks, R.M., and Plimer, I.R., eds., Encyclopedia of Geology: Boston, Elsevier Academic, p. 539–549, accessed March 30, 2021, at https://doi.org/10.1016/B0-12-369396-9/00176-3.
Munk, L.A., Hynek, S.A., Bradley, D.C., Boutt, D., Labay, K., and Jochens, H., 2016, Lithium brines—A global perspective, chap. 14 of Verplanck, P.L, and Hitzman, M.W., eds., Rare earth and critical elements in ore deposits: Littleton, Colo., Society of Economic Geologists, Reviews in Economic Geology series, v. 18, p. 339–365. [Also available at https://doi.org/10.5382/Rev.18.14.]
Muntean, J.L., 2018, The Carlin gold system—Applications to exploration in Nevada and beyond, chap. 2 of Muntean, J.L., ed., Diversity of Carlin-style gold deposits: Littleton, Colo., Society of Economic Geologists, Reviews in Economic Geology series, v. 20, p. 39–88. [Also available at https://doi.org/10.5382/rev.20.02.]
Nutt, C.J., and Hofstra, A.H., 2007, Bald Mountain gold mining district, Nevada—A Jurassic reduced intrusion-related gold system: Economic Geology, v. 102, no. 6, p. 1129–1155, accessed August 30, 2021, at https://doi.org/10.2113/gsecongeo.102.6.1129.
Orris, G.J., 1995, Borate deposits: U.S. Geological Survey Open-File Report 95–842, 57 p., accessed August 30, 2021, at https://doi.org/10.3133/ofr95842.
Otton, J.K., Bradbury, J.P., Forester, R.M., and Hanley, J.H., 1990, Paleontological analysis of a lacustrine carbonaceous uranium deposit at the Anderson mine, Date Creek Basin, west-central Arizona (U.S.A): Ore Geology Reviews, v. 5, nos. 5–6, p, 541–552. [Also available at https://doi.org/10.1016/0169-1368(90)90053-P.]
Panteleyev, A., 1996, Sn-Ag veins [profile] H07, in Lefebure, D.V., and Höy, T., eds., Selected British Columbia mineral deposit profiles—Volume 2—Metallic deposits: British Columbia Ministry of Employment and Investment, Geological Survey Branch Open File 1996–13, p. 45–48. [Also available at http://cmscontent.nrs.gov.bc.ca/geoscience/PublicationCatalogue/OpenFile/BCGS_OF1996-13.pdf.]
Plumlee, G.S., Goldhaber, M.B., and Rowan, E.L., 1995, The potential role of magmatic gases in the genesis of Illinois-Kentucky fluorspar deposits—Implications from chemical reaction path modeling: Economic Geology, v. 90, no. 5, p. 999–1011. [Also available at https://doi.org/10.2113/gsecongeo.90.5.999.]
Power, I.M., Harrison, A.L., Dipple, G.M., Wilson, S.A., Barker, S.L.L., and Fallon, S.J., 2019, Magnesite formation in playa environments near Atlin, British Columbia, Canada: Geochimica et Cosmochimica Acta, v. 255, p. 1–24, accessed March 30, 2021, at https://doi.org/10.1016/j.gca.2019.04.008.
Raup, O.B., 1991a, Descriptive model of bedded salt—Deposit subtype—Marine evaporite salt (Model 35a.3), in Orris, G.J., and Bliss, J.D., eds., Some industrial mineral deposit models—Descriptive deposit models: U.S. Geological Survey Open-File Report 91–11A, p. 33–35, accessed August 30, 2021, at https://pubs.usgs.gov/of/1991/ofr-91-0011-a/ofr-91-0011a.pdf.
Raup, O.B., 1991b, Descriptive model of bedded gypsum—Deposit subtype—Marine evaporite gypsum (Model 35a.5), in Orris, G.J., and Bliss, J.D., eds., Some industrial mineral deposit models—Descriptive deposit models: U.S. Geological Survey Open-File Report 91–11A, p. 39–41, accessed August 30, 2021, at https://pubs.usgs.gov/of/1991/ofr-91-0011-a/ofr-91-0011a.pdf.
Robinson, G.R., Jr., Hammarstrom, J.M., and Olson, D.W., 2017, Graphite, chap. J of Schulz, K.J., DeYoung, J.H., Jr., Seal, R.R., II, and Bradley, D.C., eds., Critical mineral resources of the United States—Economic and environmental geology and prospects for future supply: U.S. Geological Survey Professional Paper 1802, p. J1–J24, accessed April 18, 2020, at https://doi.org/10.3133/pp1802J.
Sanematsu, K., and Watanabe, Y., 2016, Characteristics and genesis of ion adsorption-type rare earth element deposits, chap. 3 of Verplanck, P.L., and Hitzman, M.W., eds., Rare earth and critical elements in ore deposits: Littleton, Colo., Society of Economic Geologists, Reviews in Economic Geology series, v. 18, p. 55–80. [Also available at https://doi.org/10.5382/Rev.18.03.]
Scharrer, M., Kreissl, S., and Markl, G., 2019, The mineralogical variability of hydrothermal native element-arsenide (five-element) associations and the role of physicochemical and kinetic factors concerning sulfur and arsenic: Ore Geology Reviews, v. 113, article 103025, 28 p., accessed April 18, 2020, at https://doi.org/10.1016/j.oregeorev.2019.103025.
Schulte, R.F., Taylor, R.D., Piatak, N.M., and Seal, R.R., II, 2012, Stratiform chromite deposit model, chap. E of Mineral deposit models for resource assessment: U.S. Geological Survey Scientific Investigations Report 2010–5070–E, 131 p., accessed August 30, 2021, at https://doi.org/10.3133/sir20105070E.
Schulz, K.J., DeYoung, J.H., Jr., Seal, R.R., II, and Bradley, D.C., eds., 2017, Critical mineral resources of the United States—Economic and environmental geology and prospects for future supply: U.S. Geological Survey Professional Paper 1802, 862 p. [Also available at https://doi.org/10.3133/pp1802.]
Seal, R.R., II, Schulz, K.J., DeYoung, J.H., Jr., Sutphin, D.M., Drew, L.J., Carlin, J.F., Jr., and Berger, B.R., 2017, Antimony, chap. C of Schulz, K.J., DeYoung, J.H., Jr., Seal, R.R., II, and Bradley, D.C., eds., Critical mineral resources of the United States—Economic and environmental geology and prospects for future supply: U.S. Geological Survey Professional Paper 1802, p. C1–C17, accessed April 18, 2020, at https://doi.org/10.3133/pp1802C.
Seedorff, E., Dilles, J.H., Proffett, J.M., Jr., Einaudi, M.T., Zurcher, L., Stavast, W.J.A., Johnson, D.A., and Barton, M.D., 2005, Porphyry deposits—Characteristics and origin of hypogene features, in Hedenquist, J.W., Thompson, J.F.H., Goldfarb, R.J., and Richards, J.P., eds., Economic Geology—One hundredth anniversary volume, 1905–2005: Littleton, Colo., Society of Economic Geologists, p. 251–298, accessed April 18, 2020, at https://doi.org/10.5382/AV100.10.
Sengupta, D., and Van Gosen, B.S., 2016, Placer-type rare earth element deposits, chap. 4 of Verplanck, P.L., and Hitzman, M.W., eds., Rare earth and critical elements in ore deposits: Littleton, Colo., Society of Economic Geologists, Reviews in Economic Geology series, v. 18, p. 81–100. [Also available at https://doi.org/10.5382/Rev.18.04.]
Shanks, W.C., III, and Thurston, R., 2012, Volcanogenic massive sulfide occurrence model, chap. C of Mineral deposit models for resource assessment: U.S. Geological Survey Scientific Investigations Report 2010–5070–C, 345 p., accessed April 18, 2020, at https://doi.org/10.3133/sir20105070C.
Sheppard, R.A., 1991a, Descriptive model of sedimentary zeolites—Deposit subtype—Zeolites in tuffs of open hydrologic systems (Model 25o.1), in Orris, G.J., and Bliss, J.D., eds., Some industrial mineral deposit models—Descriptive deposit models: U.S. Geological Survey Open-File Report 91–11A, p. 16–18. [Also available at https://doi.org/10.3133/ofr9111A.]
Sheppard, R.A., 1991b, Descriptive model of sedimentary zeolites—Deposit subtype—Zeolites in tuffs of saline, alkaline-lake deposits (Model 25o.2), in Orris, G.J., and Bliss, J.D., eds., Some industrial mineral deposit models—Descriptive deposit models: U.S. Geological Survey Open-File Report 91–11A, p. 19–21. [Also available at https://doi.org/10.3133/ofr9111A.]
Sillitoe, R.H., 2010, Porphyry copper systems: Economic Geology, v. 105, no. 1, p. 3–41, accessed August 30, 2021, at https://doi.org/10.2113/gsecongeo.105.1.3.]
Sillitoe, R.H., Steele, G.B., Thompson, J.F.H., and Lang, J.R., 1998, Advanced argillic lithocaps in the Bolivian tin-silver belt: Mineralium Deposita, v. 33, no. 6, p. 539–546. [Also available at https://doi.org/10.1007/s001260050170.]
Simmons, S.F., White, N.C., and John, D.A., 2005, Geological characteristics of epithermal precious and base metal deposits, in Hedenquist, J.W., Thompson, J.F.H., Goldfarb, R.J., and Richards, J.P., eds., Economic geology—One hundredth anniversary volume, 1905–2005: Littleton, Colo., Society of Economic Geologists, p. 485–522, accessed March 30, 2021, at https://doi.org/10.5382/AV100.16.
Skirrow, R.G., Jaireth, S., Huston, D.L., Bastrakov, E.N., Schofield, A., van der Wielen, S.E., and Barnicoat, A.C., 2009, Uranium mineral systems—Processes, exploration criteria and a new deposit framework: Australian Government, Geoscience Australia record 2009/20, Geocat no. 69124, 44 p. [Also available at https://ecat.ga.gov.au/geonetwork/srv/eng/catalog.search#/metadata/69124.]
Slack, J.F., ed., 2013, Descriptive and geoenvironmental model for cobalt-copper-gold deposits in metasedimentary rocks (ver. 1.1, March 14, 2014), chap. G of Mineral deposit models for resource assessment: U.S. Geological Survey Scientific Investigations Report 2010–5070–G, 218 p., accessed April 18, 2020, at https://doi.org/10.3133/sir20105070G.
Slack, J.F., Corriveau, L., and Hitzman, M.W., 2016, A special issue devoted to Proterozoic iron oxide-apatite (±REE) and iron oxide copper-gold and affiliated deposits of southeast Missouri, USA, and the Great Bear magmatic zone, Northwest Territories, Canada—Preface: Economic Geology, v. 111, no. 8, p. 1803–1814, accessed April 20, 2021, at https://doi.org/10.2113/econgeo.111.8.1803.
Sloan, R.E., 1964, The Cretaceous system in Minnesota: Minnesota Geological Survey Report of Investigations RI–05, 64 p. [Also available at https://hdl.handle.net/11299/60189.]
Sutherland, W.M., and Cola, E.C., 2016, A comprehensive report on rare earth elements in Wyoming: Laramie, Wyo., Wyoming State Geological Survey Report of Investigations 71, 137 p., accessed August 30, 2021, at https://sales.wsgs.wyo.gov/a-comprehensive-report-on-rare-earth-elements-in-wyoming-2016/.
Sutphin, D.M., 1991a, Descriptive model of amorphous graphite (Model 18k), in Orris, G.J., and Bliss, J.D., eds., Some industrial mineral deposit models—Descriptive deposit models: U.S. Geological Survey Open-File Report 91–11A, p. 9–10. [Also available at https://doi.org/10.3133/ofr9111A.]
Sutphin, D.M., 1991b, Descriptive model of disseminated flake graphite (Model 37f), in Orris, G.J., and Bliss, J.D., eds., Some industrial mineral deposit models—Descriptive deposit models: U.S. Geological Survey Open-File Report 91–11A, p. 55–57. [Also available at https://doi.org/10.3133/ofr9111A.]
Sutphin, D.M., 1991c, Descriptive model of graphite veins (Model 37g), in Orris, G.J., and Bliss, J.D., eds., Some industrial mineral deposit models—Descriptive deposit models: U.S. Geological Survey Open-File Report 91–11A, p. 58–60. [Also available at https://doi.org/10.3133/ofr9111A.]
Taylor, R.D., Hammarstrom, J.M., Piatak, N.M., and Seal, R.R., II, 2012, Arc-related porphyry molybdenum deposit model, chap. D of Mineral deposit models for resource assessment: U.S. Geological Survey Scientific Investigations Report 2010–5070–D, 64 p., accessed August 30, 2021, at https://doi.org/10.3133/sir20105070D.
Tosdal, R.M., Dilles, J.H., and Cooke, D.R., 2009, From source to sinks in auriferous magmatic-hydrothermal porphyry and epithermal deposits: Elements (Quebec), v. 5, no. 5, p. 289–295, accessed April 18, 2020, at https://doi.org/10.2113/gselements.5.5.289.
U.S. Department of the Interior, 2017, Critical mineral independence and security: U.S. Department of the Interior, Order No. 3359, accessed April 18, 2020, at https://www.doi.gov/sites/doi.gov/files/uploads/so_criticalminerals.pdf.
Van Gosen, B.S., Fey, D.L., Shah, A.K., Verplanck, P.L., and Hoefen, T.M., 2014, Deposit model for heavy-mineral sands in coastal environments, chap. L of Mineral deposit models for resource assessment: U.S. Geological Survey Scientific Investigations Report 2010–5070–L, 51 p., accessed April 18, 2020, at https://doi.org/10.3133/sir20105070L.
Verplanck, P.L., Mariano, A.N., and Mariano, A., Jr., 2016, Rare earth element ore geology of carbonatites, chap. 1 of Verplanck, P.L., and Hitzman, M.W., eds., Rare earth and critical elements in ore deposits: Littleton, Colo., Society of Economic Geologists, Reviews in Economic Geology series, v. 18, p. 5–32. [Also available at https://doi.org/10.5382/Rev.18.01.]
Verplanck, P.L., Van Gosen, B.S., Seal, R.R., II, and McCafferty, A.E., 2014, A deposit model for carbonatite and peralkaline intrusion-related rare earth element deposits, chap. J of Mineral deposit models for resource assessment: U.S. Geological Survey Scientific Investigations Report 2010–5070–J, 58 p., accessed April 18, 2020, at https://doi.org/10.3133/sir20105070J.
Wallace, A.R., and Whelan, J.F., 1986, The Schwartzwalder uranium deposit; III, Alteration, vein mineralization, light stable isotopes, and genesis of the deposit: Economic Geology, v. 81, no. 4, p. 872–888, accessed August 30, 2021, at https://doi.org/10.2113/gsecongeo.81.4.872.
Wang, Z., Li, M.Y.H., Liu, Z.-R.R., and Zhou, M.-F., 2021, Scandium—Ore deposits, the pivotal role of magmatic enrichment and future exploration: Ore Geology Reviews, v. 128, article 103906, 16 p., accessed April 12, 2021, at https://doi.org/10.1016/j.oregeorev.2020.103906.
Warren, J.K., 2010, Evaporites through time—Tectonic, climatic and eustatic controls in marine and nonmarine deposits: Earth-Science Reviews, v. 98, no. 3–4, p. 217–268, accessed August 30, 2021, at https://doi.org/10.1016/j.earscirev.2009.11.004.
Williams, P.J., Barton, M.D., Johnson, D.A., Fontboté, L., de Haller, A., Mark, G., Oliver, N.H.S., and Marschik, R., 2005, Iron oxide copper-gold deposits—Geology, space-time distribution, and possible modes of origin, in Hedenquist, J.W., Thompson, J.F.H., Goldfarb, R.J., and Richards, J.P., eds., Economic geology—One hundredth anniversary volume, 1905–2005: Littleton, Colo., Society of Economic Geologists, p. 371–405. [Also available at https://doi.org/10.5382/AV100.13.]
Williams-Stroud, S., 1991, Descriptive model of iodine bearing nitrate (Model 35bl), in Orris, G.J., and Bliss, J.D., eds., Some industrial mineral deposit models—Descriptive deposit models: U.S. Geological Survey Open-File Report 91–11A, p. 51–52. [Also available at https://doi.org/10.3133/ofr9111A.]
Woodruff, L.G., Nicholson, S.W., and Fey, D.L., 2013, A deposit model for magmatic iron-titanium-oxide deposits related to Proterozoic massif anorthosite plutonic suites, chap. K of Mineral deposit models for resource assessment: U.S. Geological Survey Scientific Investigations Report 2010–5070–K, 47 p., accessed April 18, 2020, at https://pubs.usgs.gov/sir/2010/5070/k.
Wyborn, L.A.I., Heinrich, C.A., and Jaques, A.L., 1994, Australian Proterozoic mineral systems—Essential ingredients and mappable criteria, in Australasian Institute of Mining and Metallurgy Annual Conference, Darwin, Australia, 1994, Proceedings: Darwin, Northern Territory, Australia, Australasian Institute of Mining and Metallurgy, p. 109–115.
Zartman, R.E., and Smith, J.V., 2009, Mineralogy and U-Th-Pb age of a uranium-bearing jasperoid vein, Sunshine Mine, Coeur d’Alene district, Idaho, USA: Chemical Geology, v. 261, nos. 1–2, p. 185–195, accessed August 30, 2021, at https://doi.org/10.1016/j.chemgeo.2008.09.006.
Zientek, M.L., Loferski, P.J., Parks, H.L., Schulte, R.F., and Seal, R.R., II, 2017, Platinum-group elements, chap. N of Schulz, K.J., DeYoung, J.H., Jr., Seal, R.R., II, and Bradley, D.C., eds., Critical mineral resources of the United States—Economic and environmental geology and prospects for future supply: U.S. Geological Survey Professional Paper 1802, p. N1–N91, accessed April 18, 2020, at https://doi.org/10.3133/pp1802N.
Conversion Factors
U.S. customary units to International System of Units
International System of Units to U.S. customary units
Abbreviations
AASG
Association of American State Geologists
ARDF
Alaska Resource Data File
Earth MRI
Earth Mapping Resources Initiative
EO
Executive Order
eU3O8
equivalent triuranium octoxide
ft
foot
GIS
geographic information system
Gt
billion metric tons
g/t
grams per ton
IOA
iron oxide-apatite
IOCG
iron oxide-copper-gold
km
kilometer
lb
pound
LCT
lithium-cesium-tantalum
lidar
light detection and ranging
m
meter
mg/L
milligrams per liter
Mlb
million pounds
MMcf
million cubic feet
Moz
million ounces
MRDS
Mineral Resources Data System
MRI
magnetic resonance imaging
Mt
million metric tons
NYF
niobium-yttrium-fluorine
REE
rare earth element
PGE
platinum-group element
sedex
sedimentary exhalative
S-R-V-IS
skarn, replacement, vein, intermediate sulfidation epithermal
t
metric ton
USGS
U.S. Geological Survey
USMIN
USGS Mineral Deposit Database
Suggested Citation
Hammarstrom, J.M., Dicken, C.L., Woodruff, L.G., Andersen, A.K., Brennan, S., Day, W.C., Drenth, B.J., Foley, N.K., Hall, S., Hofstra, A.H., McCafferty, A.E., Shah, A.K., and Ponce, D.A., 2022, Focus areas for data acquisition for potential domestic resources of 13 critical minerals in the conterminous United States and Puerto Rico—Antimony, barite, beryllium, chromium, fluorspar, hafnium, helium, magnesium, manganese, potash, uranium, vanadium, and zirconium, chap. D of U.S. Geological Survey, Focus areas for data acquisition for potential domestic sources of critical minerals: U.S. Geological Survey Open-File Report 2019–1023, 65 p., https://doi.org/10.3133/ofr20191023D.
ISSN: 2331-1258 (online)
Study Area
| Publication type | Report |
|---|---|
| Publication Subtype | USGS Numbered Series |
| Title | Focus areas for data acquisition for potential domestic resources of 13 critical minerals in the conterminous United States and Puerto Rico — Antimony, barite, beryllium, chromium, fluorspar, hafnium, helium, magnesium, manganese, potash, uranium, vanadium, and zirconium |
| Series title | Open-File Report |
| Series number | 2019-1023 |
| Chapter | D |
| DOI | 10.3133/ofr20191023D |
| Year Published | 2022 |
| Language | English |
| Publisher | U.S. Geological Survey |
| Publisher location | Reston, VA |
| Contributing office(s) | Geology, Energy & Minerals Science Center |
| Description | Report: xv, 66 p.; Data Release |
| Country | Puerto Rico, United States |
| Online Only (Y/N) | Y |
| Additional Online Files (Y/N) | N |
| Google Analytic Metrics | Metrics page |