

Behavior and Movement of Smallmouth Bass (Micropterus dolomieu) in the Forebay of Bonneville Dam, Columbia River, August–December 2020
Links
- Document: Report (26.9 MB pdf) , HTML , XML
- Download citation as: RIS | Dublin Core
Acknowledgments
We thank the following U.S. Army Corps of Engineers employees for assistance with field activities: Kristen Kerns, Katie Richwine, Dan Carlson, Bill Gardiner, Andrew Derugin, and Ida Royer.
Additionally, we thank our colleagues with the U.S. Geological Survey for their efforts with fieldwork including Philip Haner, Brian Ekstrom, Collin Smith, Ryan Tomka and Joe Warren. Fish handling and tagging protocols for the Western Fisheries Research Center were followed during this study.
Abstract
A telemetry study was conducted during August–December 2020 to evaluate behavior and movement patterns of adult smallmouth bass (Micropterus dolomieu) in the forebay of Bonneville Dam, Washington. A total of 40 smallmouth bass were collected, tagged, and released during August–September in seven distinct areas of the dam forebay and monitored until mid-December. Movement data from 36 tagged smallmouth bass were used in behavior analyses with an average detection duration (elapsed time from release to last detection) of 53.3 days. Nine smallmouth bass eventually moved upstream out of the array and sixteen smallmouth bass moved downstream out of the array. Smallmouth bass showed high site fidelity, primarily remaining within their zone of release or moving into nearby adjacent zones. Tagged smallmouth bass spent the greatest percentage of time in their zone of release in all zones except the Boat Rock zone; the five smallmouth bass released in the Boat Rock zone moved to the Goose Island zone, where they stayed most of their time. Smallmouth bass movements to zones farthest away from their zone of release were not common and smallmouth bass residence time in those zones was short. A large percentage of tagged smallmouth bass moved among three zones located immediately upstream from the Bonneville Dam spillway, which was not operated during the study. Results from the study provided new insights into smallmouth bass behavior patterns during fall months in the forebay of Bonneville Dam.
Introduction
Bonneville Dam, which was authorized by the Flood Control Act in 1938 (Public Law No. 761, House Resolution No. 10618), was the first dam constructed on the Columbia River along the Washington and Oregon border. The dam is a multipurpose facility that consists of the first and second powerhouses, old and new navigation locks, and a spillway (fig. 1). Historical practices included disposal of old electrical equipment directly into the river on the north side of Bradford Island, upstream from the spillway (fig. 1), which resulted in substantial contamination at the site (URS Corporation, 2016; U.S. Army Corps of Engineers, 2017).
Numerous investigations have been done since 1997, and in 2012 a remedial investigation report (URS Corporation, 2012) summarized investigation activities over the previous 10 years and used the data to identify contamination source areas at Bradford Island. The report defined the nature and extent of environmental contamination and identified contaminants of potential concern for human health and contaminants of potential ecological concern. The remedial investigation report indicated that 38 smallmouth bass (Micropterus dolomieu), which were sampled in the Bonneville Dam forebay, had elevated levels of polychlorinated biphenyls. However, smallmouth bass movement in the areas around Bradford Island are not well understood. To better understand the potential exposure of smallmouth bass to areas of contaminated sediments and to inform conceptual modeling of the cleanup of the site, the U.S. Army Corps of Engineers contracted with the U.S. Geological Survey in 2020 to collect smallmouth bass for contaminants analysis and to evaluate smallmouth bass movement patterns in the forebay of Bonneville Dam. Smallmouth bass movement patterns were assessed using acoustic telemetry during August–December 2020. Smallmouth bass were collected from seven different zones of the Columbia River immediately upstream from Bonneville Dam. Smallmouth bass were captured, tagged with acoustic transmitters, and released to determine residence time in the different zones, and to evaluate bass movement between the different zones of the forebay. Results from the telemetry study are described in this report.
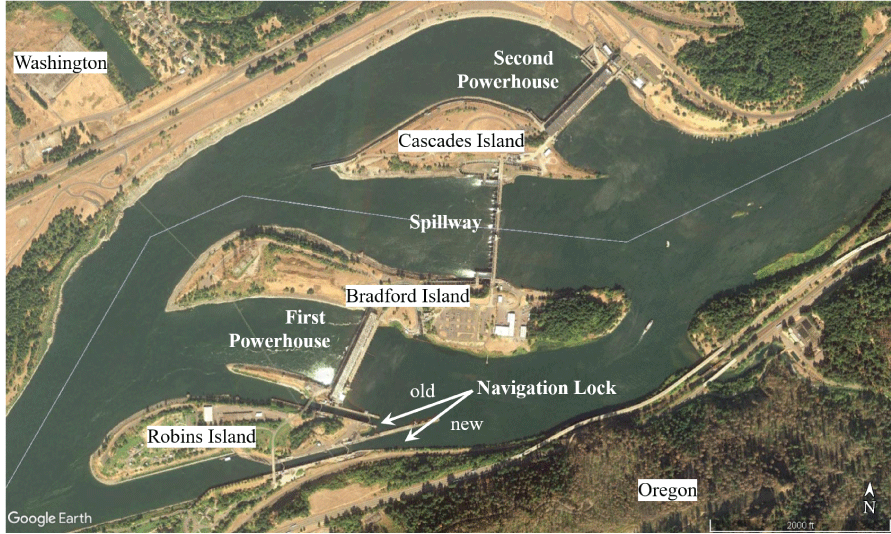
Major structures and islands at Bonneville Dam, Columbia River, Oregon. Satellite imagery 2018 Google Earth™.
Methods
Smallmouth Bass Collection and Tagging
Angling was used to collect adult smallmouth bass for acoustic tagging. A total of 40 acoustic transmitters were purchased for the study. Smallmouth bass were collected, tagged, and released in the same zone of the study area. Because the cleanup site is located primarily along the north shore and eastern tip of Bradford Island, the largest number of acoustic-tagged smallmouth bass (18 smallmouth bass) were from the North Bradford Island zone (13 smallmouth bass) and East Bradford Island zone (5 smallmouth bass; fig. 2). Smallmouth bass also were collected, tagged, and released in five other zones: Cascades Island (5 smallmouth bass), North Shore (5 smallmouth bass), Goose Island (5 smallmouth bass), Boat Rock (5 smallmouth bass), and South Bradford Island (2 smallmouth bass) (fig. 2).
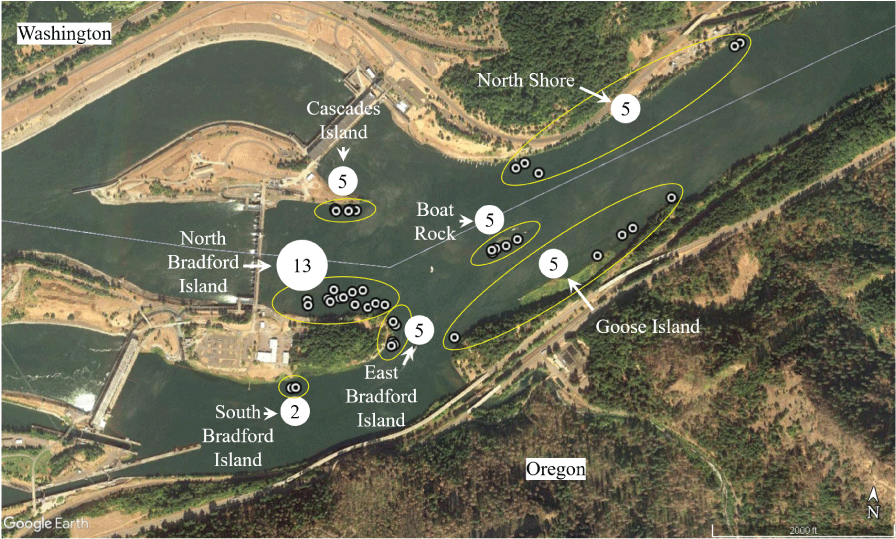
Locations where smallmouth bass were collected, tagged, and released (small dots) for an acoustic telemetry study upstream from Bonneville Dam, Columbia River, Oregon, during August–December 2020. Release location groups (ellipses) and total number of fish released in each location (numbered dots) also are shown. Satellite imagery 2018 Google Earth™.
Tagging and handling procedures were identical for all tagged smallmouth bass. Once smallmouth bass were captured, they were placed in an insulated cooler filled with fresh river water that received supplemental oxygen continuously. The capture locations were recorded on a Global Positioning System and the smallmouth bass were transferred by boat to a nearby tagging station. At the tagging station, the smallmouth bass were placed in a 20-liter (L) anesthetic bath (3 milliliters AQUI-S 20E® per 10 L river water, AquaTactics Fish Health, Kirkland, Washington). When the smallmouth bass seemed disoriented enough for tagging, they were removed from the bath, measured for total length (in millimeters), visually evaluated for condition, and transferred to a lower-dose (2 milliliters AQUI-S 20E® per 10 L river water) anesthetic bath. Smallmouth bass were oriented at an angle, head down, submerged in the bath with the ventral side up and the incision area exposed to air. A longitudinal incision was made to penetrate the peritoneum, the transmitter (Model SS400 Advanced Telemetry Systems, Inc., Asanti, Minnesota 0.210 grams weight in air, 15.0 × 3.3 millimeters) was gently inserted in the abdominal cavity, and the incision was closed with a single suture. Smallmouth bass were then transferred to the transport container, allowed to regain equilibrium, taken back to the collection site, and released.
Acoustic Telemetry Monitoring Sites
A total of 15 monitoring sites were deployed upstream from Bonneville Dam to detect tagged smallmouth bass (fig. 3). Monitoring sites were composed of a stationary acoustic telemetry receiver (Model SR5000 Advanced Telemetry Systems, Inc., Asanti, Minnesota) that was connected to a cabled underwater hydrophone. Telemetry receivers operated continuously throughout the study and recorded detections of tagged smallmouth bass when present. Monitoring sites were checked weekly to download data, do routine maintenance, and verify that receivers and hydrophones were functioning properly.
Receivers were positioned to detect smallmouth bass in specific zones of interest in the forebay of Bonneville Dam; these zones were previously described in the “Smallmouth Bass Collection and Tagging” section of this report. Multiple receivers were required to provide adequate coverage in most zones and were grouped as follows: (1) receivers 12 and 15, providing coverage in the North Shore zone; (2) receiver 11, providing coverage in the Boat Island zone; (3) receivers 8, 10, 13 and 14, providing coverage in the Goose Island zone; (4) receivers 3 and 9, providing coverage in the East Bradford zone; (5) receivers 6 and 7, providing coverage in the Cascades Island zone, (6) receivers 4 and 5, providing coverage in the North Bradford Island zone; and (7) receivers 1 and 2, providing coverage in the South Bradford Island zone (fig. 3).
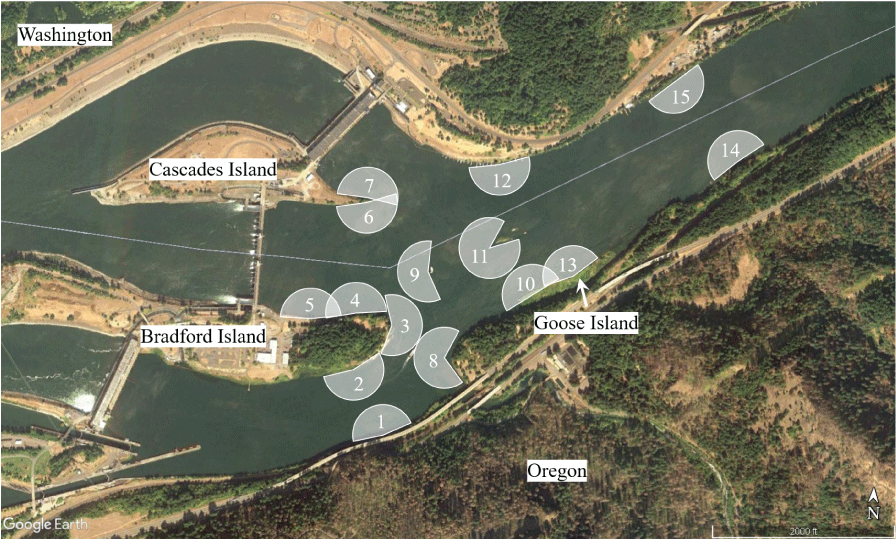
Locations of acoustic telemetry monitoring sites and approximate detection ranges in the forebay of Bonneville Dam, Columbia River, Oregon, August–December 2020. Actual detection ranges of telemetry receivers exceeded ranges shown here. Satellite imagery 2018 Google Earth™.
Data Processing and Analysis
Acoustic telemetry data records were downloaded weekly from each receiver, compiled in a single dataset, merged with tagging and release data, and processed to create a final dataset for analysis. Processing involved (1) evaluation of completeness to ensure that data gaps were not present; (2) removal of false-positive detection events (defined as transmitter detections recorded on a telemetry receiver when the transmitter was not present at the site), which are common in active telemetry systems (Beeman and Perry, 2012); and (3) use of received signal strength to identify where smallmouth bass were located for instances in which simultaneous detections of a single tagged smallmouth bass occurred at multiple receiver sites. We used an automated proofing program to remove false-positive records if (1) the detection record was from a tag code that was not released during the study, (2) the record matched criteria that indicated the detection likely resulted from reflections of valid tag signals (multipath), (3) the detection record did not match a multiple of the tag pulse interval, or (4) the record was not followed by at least three valid detection events of that transmitter on each receiver (McMichael and others, 2010; Deng and others, 2017). Once false-positive detection records were removed, the dataset was analyzed to describe smallmouth bass behavior and movement patterns. For final analysis, receivers were grouped into the following zones to summarize smallmouth bass movements upstream from Bonneville Dam: North Shore, Boat Rock, Goose Island, East Bradford Island, Cascades Island, North Bradford Island, and South Bradford Island (fig. 2). Because four tagged smallmouth bass had limited detections (0–208 detections apiece) during the study and were not detected after 29.3 hours post-release, these smallmouth bass were omitted from behavior and movement analyses.
Smallmouth bass behavior was assessed by describing the zones in which individual tagged smallmouth bass were detected and calculating elapsed time of detection for each smallmouth bass in specific zones of detection. These data were combined for smallmouth bass within each release zone to determine the percentage of smallmouth bass from each group that were detected in each zone and to summarize the percentage of time spent in those zones.
Results
Smallmouth Bass Collection and Tagging
Researchers collected a total of 40 smallmouth bass that were tagged with acoustic transmitters and released for monitoring in the forebay of Bonneville Dam (table 1). Collection, tagging, and release efforts were successful at achieving desired smallmouth bass distributions in the various zones of interest in the study area (fig. 2). Thirteen smallmouth bass were tagged and released in the North Bradford Island zone, 2 smallmouth bass were tagged and released in the South Bradford Island zone, and 5 smallmouth bass were tagged and released in each of the other zones.
Table 1.
Summary of collection dates, number of smallmouth bass collected, tagged, and released and range of total lengths for smallmouth bass collected in the forebay of Bonneville Dam, Columbia River, Oregon, during August–December 2020.[mm, millimeter; Aug, August; Sep, September]
Behavior and Movement of Acoustic-tagged Smallmouth Bass
A total of 36 of the 40 tagged smallmouth bass were detected on telemetry receivers in the study area. This provided detection histories that contributed to better understanding smallmouth bass movement patterns in the study area. Bass were detected from August 28 to December 16, 2020, with a mean detection duration (elapsed time from release to last detection) of 53.3 days (range = 2.3–88.7 days). Sixteen tagged smallmouth bass moved downstream out of the detection array and nine smallmouth bass moved upstream out of the array (fig. 4; table 2). Upstream smallmouth bass movement occurred during September 14–November 11 and downstream smallmouth bass movement occurred during September 19–December 16, with most downstream movements (12 smallmouth bass) occurring in November 2020 (fig. 4). We plotted timing of upstream and downstream movements out of the array with route-specific discharge through the spillway and two powerhouses at Bonneville Dam to visually assess relationships between them, but we did not find any relationships (fig. 4).
Table 2.
Summary of last-known detection areas for acoustic-tagged smallmouth bass upstream from Bonneville Dam, Columbia River, Oregon, August–December 2020.[n, number of smallmouth bass released]
Tagged smallmouth bass from the various zones in the Bonneville Dam forebay generally showed high site fidelity and limited dispersal to other zones. Tagged smallmouth bass were detected most frequently at receivers located near their point of release. Plots showing average residence times at each detection site for individual release groups show that smallmouth bass spent the most time at sites located near their release site, and detection duration generally decreased with increasing distance from the release site. Summaries of detection histories for tagged smallmouth bass released in specific zones are discussed in subsequent sections.
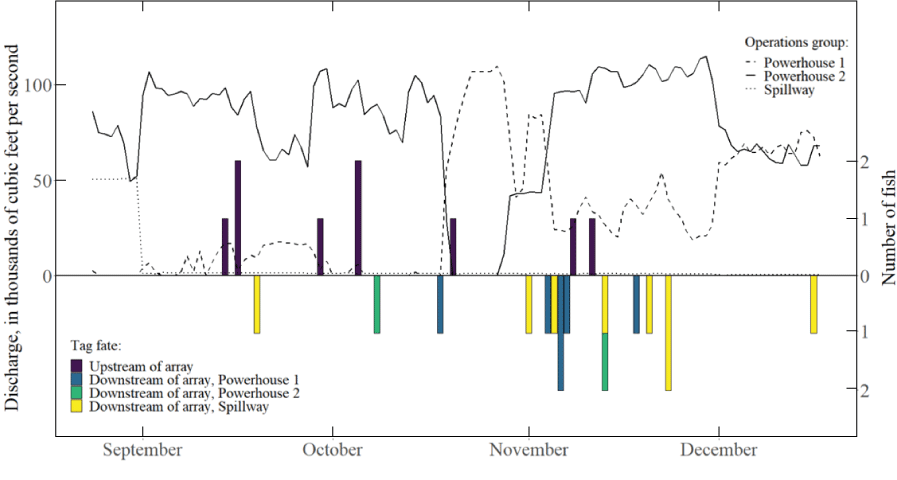
Route-specific discharge at Bonneville Dam through Powerhouse 1, Powerhouse 2, and the spillway; and the timing of when tagged smallmouth bass moved upstream or downstream from the telemetry array, Columbia River, Oregon, during September–December 2020.
Behavior of Tagged Smallmouth Bass Released in the North Shore Zone
All five of the tagged smallmouth bass released in the North Shore zone were detected on receivers in the North Shore zone, two tagged smallmouth bass were detected in the Boat Rock zone, and one tagged smallmouth bass each was detected in Goose Island and North Bradford Island zones (table 3). Tagged smallmouth bass spent 95.1 percent of the time in the North Shore zone (table 4) and smallmouth bass residence times in zones outside the North Shore zone was short (fig. 5).
Table 3.
Number of acoustic-tagged smallmouth bass detected in detection zones in the forebay of Bonneville Dam during August–December 2020.[n, number of smallmouth bass detected from release site]
Table 4.
Percentage of time acoustic-tagged smallmouth bass spent near fixed telemetry sites in the forebay of Bonneville Dam during August–December 2020.[n, number of smallmouth bass released]
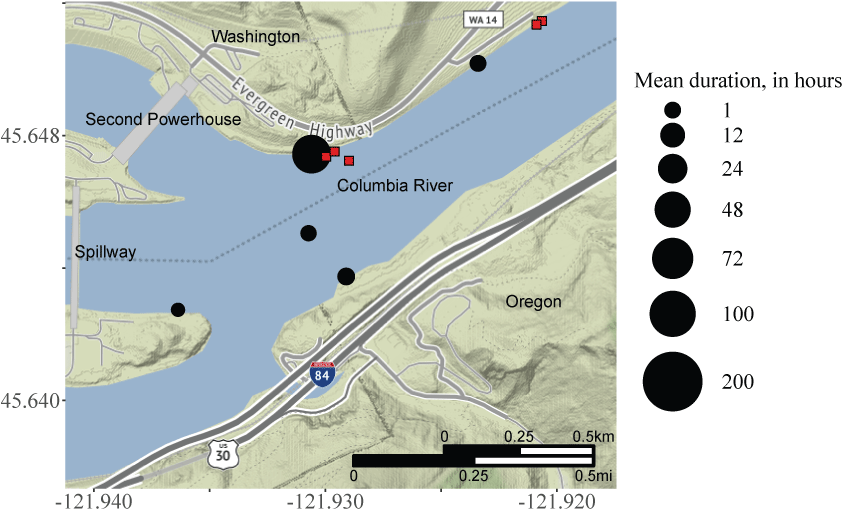
Mean residence time at telemetry monitoring sites for acoustic-tagged smallmouth bass collected, tagged, and released in the North Shore zone, upstream from Bonneville Dam, Columbia River, Oregon, during August–December 2020. Squares indicate the release locations of individual smallmouth bass. Base map tiles by Stamen Design, under CC BY 3.0; base map data by OpenStreetMap, under ODbL.
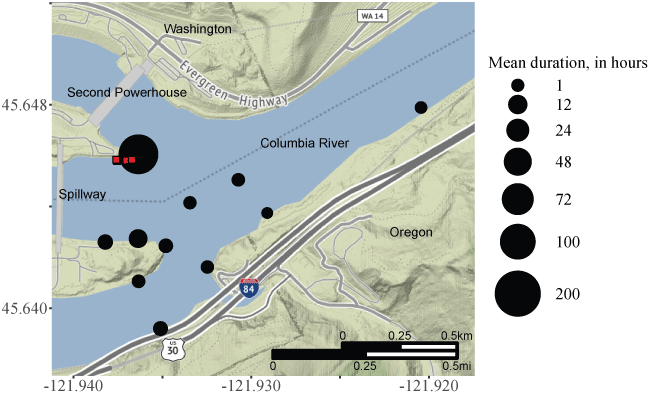
Behavior of Tagged Smallmouth Bass Released in the Boat Rock Zone
All five of the tagged smallmouth bass released in the Boat Rock zone were detected on receivers in that zone and in the Goose Island zone (table 3). Smallmouth bass released in the Boat Rock zone spent the largest percentage of detected time in the Goose Island zone (84.9 percent) and a comparatively small percentage of time in the Boat Rock zone (14.1 percent; table 4). Two of the Boat Rock-released smallmouth bass were detected briefly in the East Bradford Island zone and one smallmouth bass was detected in the Cascades Island zone (table 3; fig. 6).
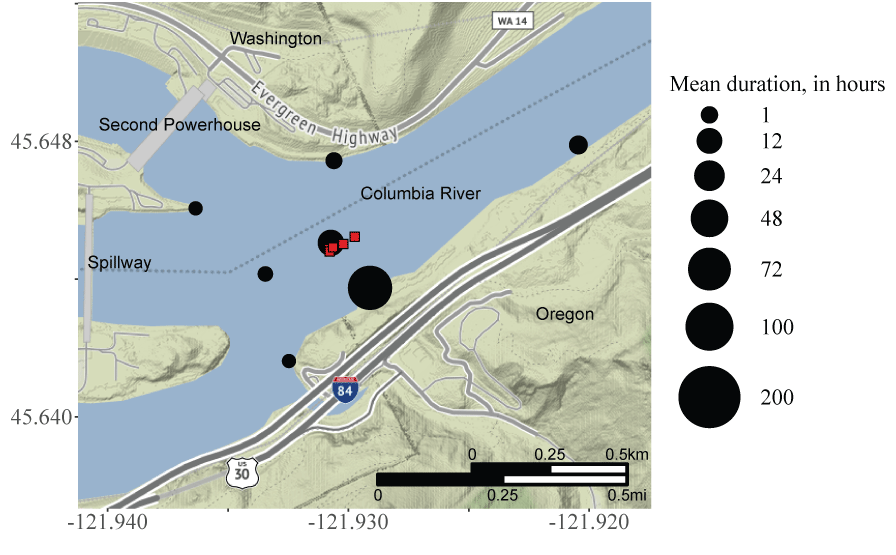
Mean residence time at telemetry monitoring sites for acoustic-tagged smallmouth bass collected, tagged, and released at Boat Rock, upstream from Bonneville Dam, Columbia River, Oregon, during August–December 2020. Squares indicate the release locations of individual smallmouth bass. Base map tiles by Stamen Design, under CC BY 3.0; base map data by OpenStreetMap, under ODbL.
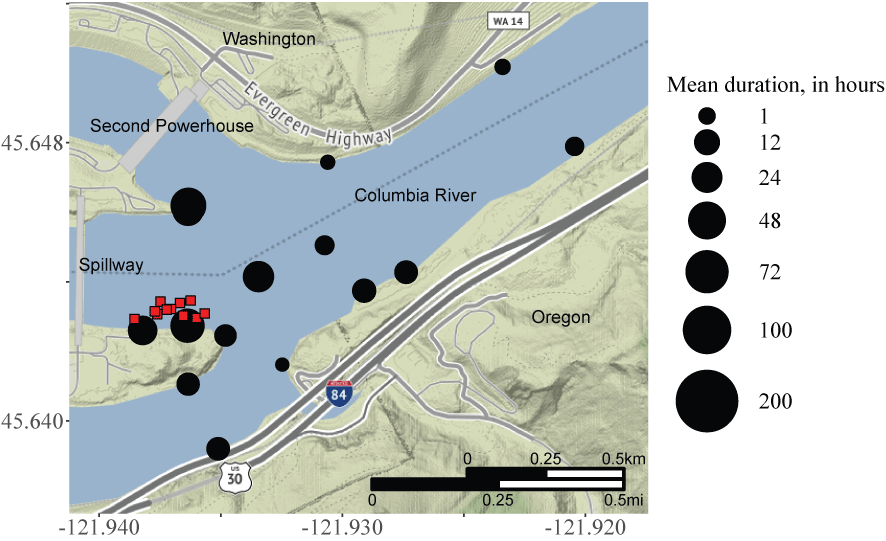
Behavior of Tagged Smallmouth Bass Released in the Goose Island Zone
Smallmouth bass released in the Goose Island zone predominantly remained within their release zone. Four of the five tagged smallmouth bass were detected in the Goose Island zone (table 3) and these smallmouth bass spent 86.3 percent of the observed residence time (table 4) within that zone. One tagged smallmouth bass was detected in each of the North Shore Island, East Bradford Island, and South Bradford Island zones (table 3), following their release in the Goose Island zone. However, residence times in these zones were short (<2 minutes; fig. 7).
Mean residence time at telemetry monitoring sites for acoustic-tagged smallmouth bass collected, tagged, and released at Goose Island, upstream from Bonneville Dam, Columbia River, Oregon, during August–December 2020. Squares indicate the release locations of individual smallmouth bass. Base map tiles by Stamen Design, under CC BY 3.0; base map data by OpenStreetMap, under ODbL.
Behavior of Tagged Smallmouth Bass Released in the East Bradford Island Zone
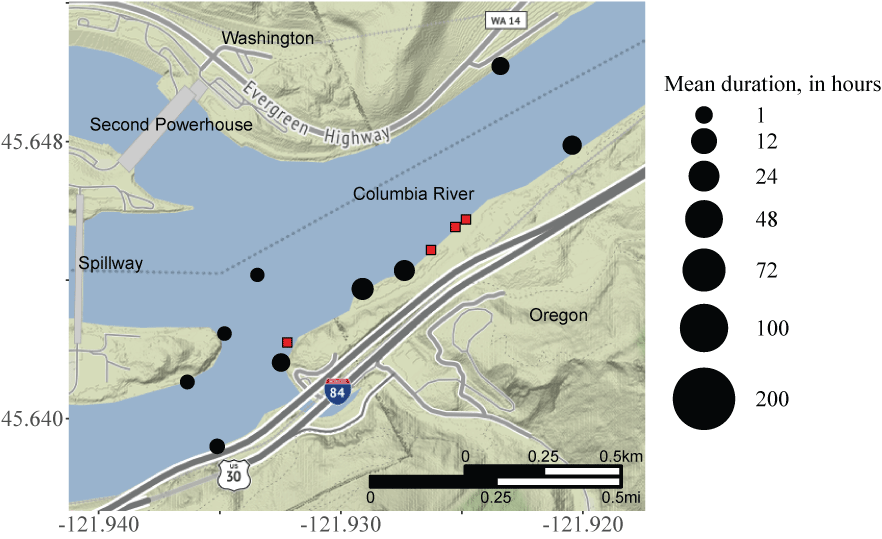
Most of the tagged smallmouth bass released in the East Bradford Island zone were detected in nearby zones but these smallmouth bass primarily resided in their zone of release and in the North Bradford Island zone. All five tagged smallmouth bass were detected in the East Bradford Island zone, and four tagged smallmouth bass from that release group also were detected in the Goose Island, Cascades Island, and North Bradford Island zones (table 3). Three of the East Bradford Island-released smallmouth bass also were detected in the Boat Rock zone and South Bradford Island zone. Tagged smallmouth bass from the East Bradford Island zone spent 70.0 percent of the time in their release zone and 23.8 percent of the time in the North Bradford Island zone (table 4). Average residence times in other zones of the study area were short (fig. 8).
Mean residence time at telemetry monitoring sites for acoustic-tagged smallmouth bass collected, tagged, and released at East Bradford Island, upstream from Bonneville Dam, Columbia River, Oregon, during August–December 2020. Squares indicate the release locations of individual smallmouth bass. Base map tiles by Stamen Design, under CC BY 3.0; base map data by OpenStreetMap, under ODbL.
Behavior of Tagged Smallmouth Bass Released in the Cascades Island Zone
Four of the five smallmouth bass tagged and released in the Cascades Island zone were detected on receivers near the release site (table 3). Three tagged smallmouth bass from the Cascades Island zone were detected in the East Bradford Island zone and two smallmouth bass apiece were detected in Goose Island and North Bradford Island zones (table 3). Tagged smallmouth bass released in the Cascades Island zone spent most of their time in their zone of release (88.1 percent) and in the North Bradford Island zone (5.8 percent; table 4). Cascades Island-released smallmouth bass spent little time in other zones of the study area (fig. 9).
Mean residence time at telemetry monitoring sites for acoustic-tagged smallmouth bass collected, tagged, and released at Cascades Island, upstream from Bonneville Dam, Columbia River, Oregon, during August–December 2020. Squares indicate the release locations of individual smallmouth bass. Base map tiles by Stamen Design, under CC BY 3.0; base map data by OpenStreetMap, under ODbL.
Behavior of Tagged Smallmouth Bass Released in the North Bradford Island Zone
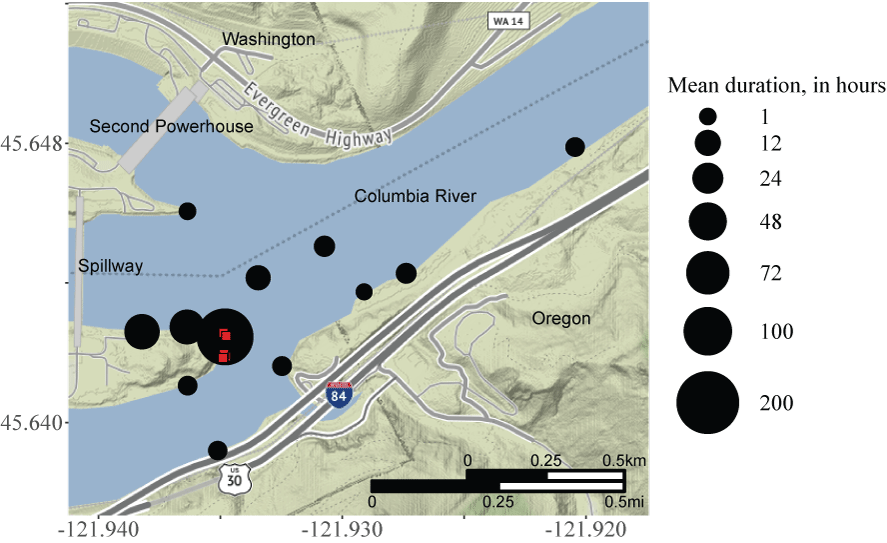
Eleven smallmouth bass tagged and released in the North Bradford Island zone were detected in the North Bradford Island and East Bradford Island zones and 10 of the smallmouth bass were detected in the Cascades Island zone (table 3). Smallmouth bass released in the North Bradford Island zone spent a considerable percentage of their residence time in the North Bradford Island (37.7 percent), East Bradford Island (22.3 percent), Cascades Island (22.2 percent), South Bradford Island (8.0 percent), and Goose Island (7.1 percent; table 4; fig. 10).
Mean residence time at telemetry monitoring sites for acoustic-tagged smallmouth bass collected, tagged, and released at North Bradford Island, upstream from Bonneville Dam, Columbia River, Oregon, during August–December 2020. Squares indicate the release locations of individual smallmouth bass. Base map tiles by Stamen Design, under CC BY 3.0; base map data by OpenStreetMap, under ODbL.
Behavior of Tagged Smallmouth Bass Released in the South Bradford Island Zone
The two smallmouth bass released in the South Bradford Island zone were both detected in that zone and in the East Bradford Island zone (table 3); however, those smallmouth bass spent most of their time (97.7 percent; table 4) in the South Bradford Island zone (fig. 11).
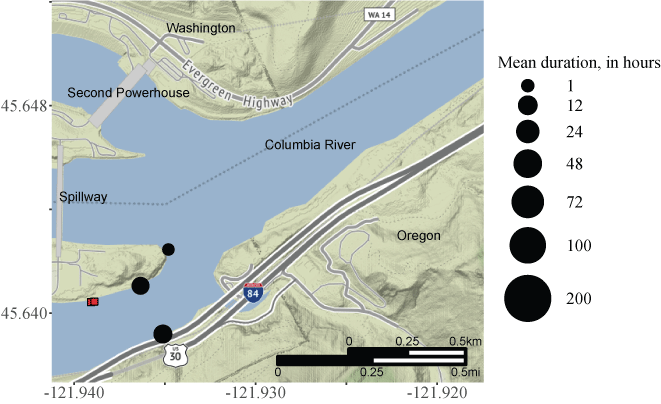
Mean residence time at telemetry monitoring sites for acoustic-tagged smallmouth bass collected, tagged, and released at South Bradford Island, upstream from Bonneville Dam, Columbia River, Oregon, during August–December 2020. Squares indicate the release locations of individual smallmouth bass. Base map tiles by Stamen Design, under CC BY 3.0; base map data by OpenStreetMap, under ODbL.
Discussion
Results from the telemetry study showed that tagged smallmouth bass primarily had high site fidelity in the forebay of Bonneville Dam during fall months in 2020. Nearly all (95 percent) of the smallmouth bass that were collected, tagged, and released in various zones of the study area subsequently were detected on receivers located within their respective zone of release, and data from 90 percent of the tagged smallmouth bass contributed to behavior and movement information collected during the study. For all zones, except the Boat Rock zone, tagged smallmouth bass spent the greatest percentage of time in their zone of release, ranging from 37.7 percent for smallmouth bass released in the North Bradford Island zone to 95.1 percent for smallmouth bass released in the North Shore zone. Smallmouth bass released in the Boat Rock zone spent a relatively small percentage of time (14.1 percent) in their release zone, but all five smallmouth bass were detected in the Goose Island zone where they spent most of their time (84.9 percent). Smallmouth bass that moved outside their zone of release were most likely to be detected in adjacent zones. For example, 2 of the 5 smallmouth bass tagged and released in the North Shore zone were detected in the Boat Rock zone, but none of the North Shore-released smallmouth bass were detected in the East Braford, Cascades Island, or South Bradford Island zones. Similarly, most smallmouth bass tagged and released in the North Bradford Island zone were detected in nearby East Bradford Island (11 smallmouth bass) and Cascades Island (10 smallmouth bass) zones, whereas few smallmouth bass were detected farther away in Goose Island (3 smallmouth bass) or North Shore zones (1 smallmouth bass). These findings suggest that smallmouth bass primarily remained near where they were collected, tagged, and released during the study period.
We found that some tagged smallmouth bass eventually moved upstream or downstream out of the monitoring array and failed to return during the study period. One-fourth (9 smallmouth bass) of the tagged smallmouth bass moved upstream and out of the array. Smallmouth bass with this behavior originated from every zone of interest, except for the South Bradford Island zone (in which only two tagged smallmouth bass were released). A greater percentage of tagged smallmouth bass (44.4 percent; 16 smallmouth bass) moved downstream out of the array and did not return. These smallmouth bass originated from all zones except for Boat Rock and Goose Island. These upstream and downstream movements may be related to seasonal migrations that occur when smallmouth bass move to locate overwintering habitat (Munther, 1970; Langhurst and Schoenike, 1990; Ettinger-Dietzel and others, 2016). The configuration of telemetry receivers facilitated description of directional movements of tagged smallmouth bass that left the monitoring array, but the extent of the movements is unclear because we were focused only on behavior in the Bonneville Dam forebay.
Data collected during this study provided unique insights into smallmouth bass behavior during fall months in the forebay of Bonneville Dam, but these findings likely do not apply to other times of the year. Tagged smallmouth bass moved freely between, and spent substantial time in, the Cascades Island, East Bradford Island, and North Bradford Island zones, which are located immediately upstream from the Bonneville Dam spillway. We found that nearly all the tagged smallmouth bass released in each of these three zones were subsequently detected in the other zones within this group and residence time was high at these locations. However, the Bonneville Dam spillway was not operated during this study and smallmouth bass are unlikely to tolerate water velocity increases that occur in these zones when the spillway is operated during other months of the year (Edwards and others, 1983; Probst and others, 1984; Rankin 1986; Sechnick and others, 1986; Groshens and Orth, 1993). Furthermore, smallmouth bass commonly initiate substantial movements during spring and early summer for spawning (Todd and Rabeni 1989; Langhurst and Schoenike, 1990; Rubenson and Olden, 2016; Rubenson and Olden, 2020). Based on these factors, we presume that population distribution and behavior patterns in the Bonneville Dam forebay undergo seasonal changes that were not captured during this study.
Observations from collection efforts for tagging suggest that the smallmouth bass population is large and broadly distributed throughout the forebay of Bonneville Dam during fall months. Collection efforts for acoustic tagging were unhindered (in any of the zones of interest) by the previous removal of 80 smallmouth bass for contaminant analysis. Furthermore, we never collected previously tagged smallmouth bass although they were confirmed to be present based on telemetry detection records. These observations indicate that a substantial number of smallmouth bass were present in the forebay of Bonneville Dam during this study.
References Cited
Deng, Z.D., Martinez, J.J., Li, H., Harnish, R.A., Woodley, C.M., Hughes, J.A., Li, X., Fu, T., Lu, J., McMichael, G.A., Weiland, M.A., Eppard, M.B., Skalski, J.R., and Townsend, R.L., 2017, Comparing the survival rate of juvenile Chinook salmon migrating through hydropower systems using injectable and surgical acoustic transmitters: Scientific Reports, v. 7, no. 1, 8 p., accessed December 4, 2020, at https://doi.org/10.1038/srep42999.
Ettinger-Dietzel, S.A., Dodd, H.R., Westhoff, J.T., and Siepker, M.J., 2016, Movement and habitat selection patterns of smallmouth bass Micropterus dolomieu in an Ozark river: Journal of Freshwater Ecology, v. 31, no. 1, p. 61–75, accessed February 24, 2021, at https://www.tandfonline.com/doi/full/10.1080/02705060.2015.1025867.
Groshens, T.P., and Orth, D.J., 1993, An assessment of the transferability of habitat criteria for smallmouth bass: Virginia Water Resources Research Center, Bulletin 180, 120 p., accessed February 24, 2021 at https://vtechworks.lib.vt.edu/bitstream/handle/10919/46623/WRRC_Bull_180.pdf?sequence=1.
Langhurst, R.W., and Schoenike, D.L., 1990, Seasonal migration of smallmouth bass in the Embarrass and Wolf rivers, Wisconsin: North American Journal of Fisheries Management, v. 10, no. 2, p. 224–227, accessed February 19, 2021, at https://afspubs.onlinelibrary.wiley.com/doi/pdfdirect/10.1577/1548-8675%281990%29010%3C0224%3ASMOSBI%3E2.3.CO%3B2.
McMichael, G.A., Eppard, M.B., Carlson, T.J., Carter, J.A., Ebberts, B.D., Brown, R.S., Weiland, M., Ploskey, G.R., Harnish, R.A., and Deng, Z.D., 2010, The juvenile salmon acoustic telemetry system–a new tool: Fisheries, v. 35, no. 1, p. 9–22, accessed January 20, 2021, at https://doi.org/10.1577/1548-8446-35.1.9.
Munther, G.L., 1970, Movement and distribution of smallmouth mass in the Middle Snake River: Transactions of the American Fisheries Society, v. 99, no. 1, p. 44–53, accessed February 18, 2021, at https://doi.org/10.1577/1548-8659(1970)99<44:MADOSB>2.0.CO;2.
Rubenson, E.S., and Olden, J.D., 2020, An intruder in salmonid rearing habitat—Current and future distributions of smallmouth bass (Micropterus dolomieu) in the Columbia River basin: Canadian Journal of Fisheries and Aquatic Sciences, v. 77, p. 314–325, accessed December 1, 2020, at https://cdnsciencepub.com/doi/pdf/10.1139/cjfas-2018-0357.
Rubenson, E.S., and Olden, J.D., 2016, Spatiotemporal spawning patterns of smallmouth bass at its upstream invasion edge: Transactions of the American Fisheries Society, v. 145, p. 693–702, accessed November 14, 2020, at https://depts.washington.edu/oldenlab/wordpress/wp-content/uploads/2016/06/TAFS_2016b.pdf.
Sechnick, C.W., Carline, R.F., Stein, R.A., and Rankin, E.T., 1986, Habitat selection by smallmouth bass in response to physical characteristics of a simulated stream: Transactions of the American Fisheries Society, v. 115, no. 2, p. 314–321, accessed February 24, 2021, at https://www.tandfonline.com/doi/abs/10.1577/1548-8659(1986)115%3C314%3AHSBSBI%3E2.0.CO%3B2.
Todd, B.L., and Rabeni, C.F., 1989, Movement and habitat use by stream-dwelling smallmouth bass: Transactions of the American Fisheries Society, v. 118, no. 3, p. 229–242, accessed February 24, 2021, at https://afspubs.onlinelibrary.wiley.com/doi/abs/10.1577/1548-8659(1989)118%3C0229:MAHUBS%3E2.3.CO;2.
URS Corporation, 2012, Upland and river operable units remedial investigation report: U.S. Army Corps of Engineers, prepared by URS Corporation, Bradford Island, Cascade Locks, Oregon, accessed November 20, 2000, at https://www.oregon.gov/deq/FilterDocs/BradfordRIfinal0612-1.pdf.
URS Corporation, 2016, Baseline human health and ecological risk assessment, river operable unit: U.S. Army Corps of Engineers, prepared by URS Corporation, Portland, Oregon, 88 p., accessed November 20, 2000, at https://usace.contentdm.oclc.org/digital/collection/p16021coll7/id/8609.
U.S. Army Corps of Engineers, 2017, Final feasibility study—Bradford Island upland operable unit, Cascade Locks, Oregon: U.S. Army Corps of Engineers, Portland, Oregon, 136 p., accessed November 20, 2020, at https://usace.contentdm.oclc.org/digital/collection/p16021coll7/id/4750.
Conversion Factors
International System of Units to U.S. customary units
Publishing support provided by the U.S. Geological Survey
Science Publishing Network, Tacoma Publishing Service Center
For more information concerning the research in this report,
contact the
Director, Western Fisheries Research Center
U.S. Geological Survey
6505 NE 65th Street
Seattle, Washington 98115-5016
Suggested Citation
Kock, T.J., Hansen, G.S., and Evans, S.D., 2021, Behavior and movement of smallmouth bass (Micropterus dolomieu) in the forebay of Bonneville Dam, Columbia River, August–December 2020: U.S. Geological Survey Open-File Report 2021–1099, 13 p., https://doi.org/10.3133/ofr20211099.
ISSN: 2331-1258 (online)
Study Area
| Publication type | Report |
|---|---|
| Publication Subtype | USGS Numbered Series |
| Title | Behavior and movement of smallmouth bass (Micropterus dolomieu) in the forebay of Bonneville Dam, Columbia River, August–December 2020 |
| Series title | Open-File Report |
| Series number | 2021-1099 |
| DOI | 10.3133/ofr20211099 |
| Year Published | 2021 |
| Language | English |
| Publisher | U.S. Geological Survey |
| Publisher location | Reston, VA |
| Contributing office(s) | Western Fisheries Research Center |
| Description | vii, 13 p. |
| Country | United States |
| State | Oregon, Washington |
| Other Geospatial | Bonneville Dam |
| Online Only (Y/N) | Y |
| Google Analytic Metrics | Metrics page |