

Occurrence and Distribution of PFAS in Sampled Source Water of Public Drinking-Water Supplies in the Surficial Aquifer in Delaware, 2018; PFAS and Groundwater Age-Dating Results
Links
- Document: Report (2.36 MB pdf) , HTML , XML
- Data Release: USGS data release - Data in support of the occurrence and distribution of per- and polyfluoroalkyl substances in sampled source water of public drinking-water supplies in the surficial aquifer in Delaware, 2018:
- Database: USGS National Water Information System database - USGS water data for the Nation
- Download citation as: RIS | Dublin Core
Acknowledgments
This project was funded under a cooperative agreement between the Delaware Geological Survey (DGS) and the U.S. Geological Survey (USGS), in support of the Delaware Department of Natural Resources and Environmental Control (DNREC). The author would like to thank DNREC employees for their excellent help, cooperation, and support in providing the database of public water-supply wells and assisting in the selection of replacement wells for this study. The author would also like to thank USGS employees Deborah A. Bringman and Michael S. Brownley, who provided office and field technical support for this project, as well as Meghan N. Petenbrink and Alexander M. Soroka who provided significant help with data analysis and manuscript preparation, and Irene Fisher for her per- and polyfluorinated alkyl substances expertise. In addition, thank you to all the well owners and water managers who allowed access to their property to sample the wells for this study.
Abstract
The U.S. Geological Survey, in cooperation with the Delaware Department of Natural Resources and Environmental Control and the Delaware Geological Survey, conducted a groundwater-quality investigation to (1) describe the occurrence and distribution of PFAS, and (2) document any changes in groundwater quality in the Columbia aquifer public water-supply wells in the Delaware Coastal Plain between 2000 and 2008 and between 2008 and 2018. Thirty public water-supply wells located throughout the Columbia aquifer of the Delaware Coastal Plain were sampled from August through November 2018. Groundwater collected from the wells was analyzed for the occurrence and distribution of 18 per- and polyfluorinated alkyl substances (PFAS) as well as groundwater age. Descriptive statistical analyses were performed to assess PFAS analytical results within the well network and the combined perfluorooctanoic acid (PFOA) and perfluorooctane sulfonate (PFOS) concentrations were compared to the U.S. Environmental Protection Agency’s (EPA) health advisory level (HAL) for informational purposes only and not for evidence of compliance or noncompliance with Federal regulations. The EPA’s HAL is a health-based reference level for public drinking water as supplied to customers and is not applied to source (raw) water. Groundwater-age data were compared for sites sampled in 2000, 2008, and 2018 to document any changes.
All samples were analyzed for 18 PFAS using EPA Method 537 (modified). Forty-four percent of the analyzed PFAS were detected in the study well network. Sixteen of the sampled wells have one or more PFAS detections, and as many as eight different PFAS were found in a single sample. Wells with a higher number of PFAS detected (five or more) were in New Castle and Sussex Counties. The PFAS most frequently detected were PFOA, with 47 percent detection; perfluorohexanoic acid (PFHxA), with 33 percent detection; and PFOS and perfluorohexane sulfonate (PFHxS), with 27 percent detection each. PFAS concentrations were below 1,000 parts per trillion (ppt). Two wells exceeded the EPA’s lifetime-drinking water health advisory level of 70 ppt for combined concentrations of PFOA and PFOS.
The average age of groundwater entering the screens of the supply wells sampled in 2018 ranged from 8.2 to 45.8 years, with a median groundwater age of 25.7 years. Groundwater age was positively correlated with well depth and negatively correlated with dissolved oxygen. Groundwater age and PFAS concentrations were negatively correlated in the Columbia aquifer. Data from the 23 resampled wells indicate a significant positive difference in the average modeled groundwater-sample-age results. The average groundwater age from samples collected in 2018 was generally 5 years older than the average groundwater age from samples collected in 2008. The same pattern was found during cycle two (2008) of this study, where the 2008 groundwater age was on average 7 years older than the samples collected in 2000. The distribution of groundwater sample ages among the 17 trend wells and during the three study cycles (2000, 2008, and 2018) indicates that sample-age medians were statistically different from zero; well-water sample-age data show a slight increase in groundwater sample age.
Introduction
Groundwater is the primary drinking water source in Delaware. Previous studies have documented the influence of human activities on the quality of this important resource through the detection of low concentrations (<1 microgram per liter [µg/L] or parts per billion [ppb]) of pesticides, volatile organic compounds, and other manmade chemicals in supply wells. These chemicals were detected in source waters of 30 Delaware public water-supply wells (fig. 1) sampled in previous monitoring studies completed in 2000 (Ferrari, 2002), 2008 (Reyes, 2010), and in this 2018 study. All 30 wells sampled are screened in the Columbia surficial aquifer (well-depth range was between 37 and 139 feet below land surface). Although concentrations of these organic compounds were generally low, all water samples had at least one compound detected, and most samples had multiple detections. These results demonstrate the influence of human activities on the quality of this important drinking water resource.
As part of the Source Water Assessment and Protection Program, which was created by Congress as part of the Safe Drinking-Water Act Amendments of 1996, State of Delaware officials have a continued interest in monitoring and in observing broad changes in the water quality of source waters since previous sampling events (2000 and 2008) detected low-level contamination in supply well samples. As part of this new sampling effort, per- and polyfluoroalkyl substances (PFAS) were included. PFAS, which are a large group of manmade chemicals that include perfluorooctanoic acid (PFOA), perfluorooctane sulfanate (PFOS), and hexafluoropropylene oxide dimer acid (HFPO-DA or Gen X), have come to the attention of researchers and risk managers because of their persistence, toxicity, and number of adverse effects in humans and laboratory animals (U.S. Environmental Protection Agency, 2018). Although there are many chemicals included in the PFAS group and the U.S. Environmental Protection Agency (EPA) has not established a maximum contaminant level (MCL) for all of them, the EPA did establish a lifetime drinking-water health advisory level (HAL) of 70 parts per trillion (ppt; or 0.07 ppb) for PFOA and PFOS in May 2016, as these have been the most extensively produced and studied PFAS (U.S. Environmental Protection Agency, 2016a). Both chemicals are potentially of concern to human health in the Coastal Plain aquifer and warrant continued study of their and other PFAS distribution in groundwater. Although combined concentrations of PFOA and PFOS were compared to the EPA’s HAL, these comparisons were made for informational purposes and not for evidence of compliance or noncompliance with Federal regulations. The EPA HAL is a health-based reference level for public drinking water as supplied to customers and is not applied to source (raw) water. Groundwater-age data were collected as part of this study by averaging the laboratory sulfur hexafluoride (SF6) ages estimated from each of two samples collected from each water-supply well and were compared for sites sampled in 2000, 2008, and 2018 to document any groundwater-age changes.
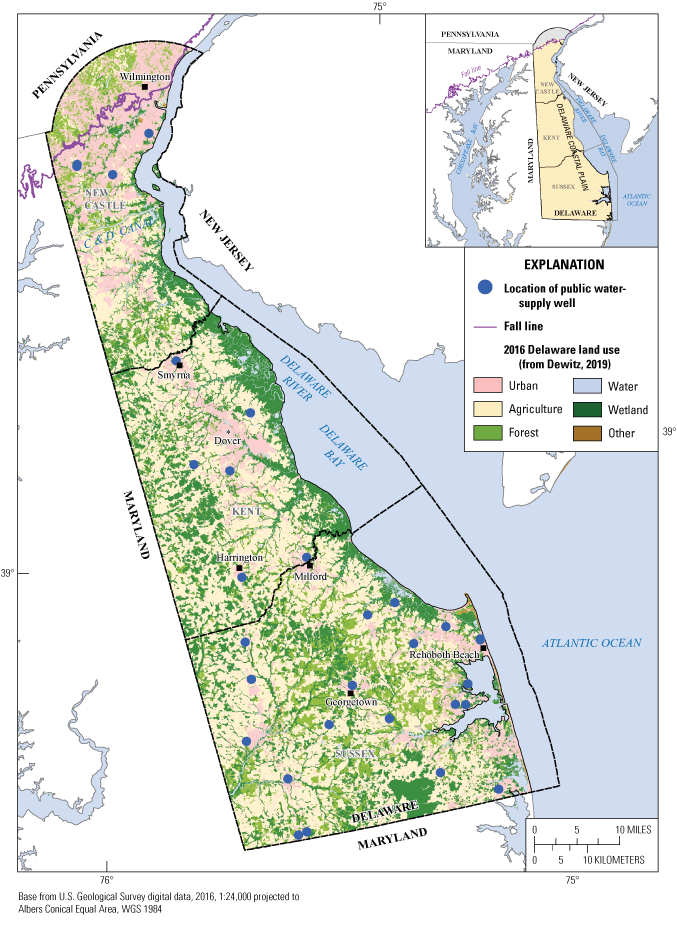
Drinking-water wells distribution and Delaware land use.
Description of Study Area
The study area falls entirely in the Delaware portion of the Atlantic Coastal Plain Physiographic Province and all wells sampled are screened in the Columbia aquifer (Benson and others, 1986; Reyes, 2010). The Columbia aquifer consists primarily of sands and gravels of fluvial and marginal marine origin and is an important drinking water resource in the Atlantic Coastal Plain of Delaware. Since the Columbia aquifer is largely unconfined, it is susceptible to contamination from spills, unmanaged wastes, and the application of agricultural chemicals on or near the land surface.
Agriculture is the predominant land use in Delaware with corn, soybeans, and small grains as the major crops. In 2017, approximately 37 percent of the available land area was used for farming (U.S. Department of Agriculture, 2017). Most of the agricultural activity in Delaware takes place in Kent and Sussex Counties and south of the Chesapeake and Delaware (C&D) Canal in New Castle County. The primary land uses surrounding this relatively shallow public-supply well network in the Coastal Plain of Delaware include agriculture, and low-density urban and suburban areas associated with small towns and communities (fig. 1).
PFAS General Description
What are PFAS?
Per- and polyfluoroalkyl substances (PFAS) are a large group (more than 4,000) of man-made, highly persistent chemicals that have been in use since the 1940s. PFAS are found in a wide range of consumer and industrial products such as cookware, pizza boxes, carpets, stain repellants, and firefighting foams, as well as other common products (fig. 2). PFAS are released into the air, soil, and water by PFAS manufacturing and processing facilities (such as metal plating operations), historical use in firefighting foams, and regular everyday use by consumers. Owing to their widespread use, persistence in the environment, and long half-lives, most people in the United States have been exposed to PFAS. There is evidence that because of their long half-lives and toxicity, continued exposure above threshold levels for specific PFAS may lead to adverse health effects (U.S. Environmental Protection Agency, 2016a; Agency for Toxic Substances and Disease Registry, 2018). PFOA and PFOS have been the most extensively produced and studied of these chemicals. Both chemicals are very persistent in the environment and human body, and can bioaccumulate in living organisms (U.S. Environmental Protection Agency, 2017).
There are a variety of ways in which people can be exposed to PFAS and at different levels of exposure, for instance
-
Food ingestion and food packaging
-
Daily exposure with commonly used items such as, but not limited to, carpets, cookware, rain gear, and so forth
-
Occupational exposure
-
Drinking water

Examples of products that use per- and polyfluoroalkyl substances (PFAS). Photographs from unsplash.com.
PFAS Effects on the Human Body
There is evidence that exposure to PFAS can lead to adverse health outcomes in humans or animals as they can accumulate within the body. Some studies have indicated that PFAS can cause reproductive, developmental, liver, kidney, and immunological adverse effects, as well as cancer and other health issues (U.S. Environmental Protection Agency, 2016c, 2017). The EPA established a drinking-water HAL of 70 ppt for combined concentrations of PFOA and PFOS (U.S. Environmental Protection Agency, 2016b). This HAL was established to provide information on the health risks of these chemicals and to allow for appropriate actions to protect consumers (U.S. Environmental Protection Agency, 2014). The State of Delaware adopted EPA’s 2016 HAL for combined concentrations of PFOA and PFOS as screening values for hazardous substances in the Delaware Natural Resources and Environmental Control (DNREC) Remediation Section that same year (2016).
Study Methods
This study was developed to obtain information on the spatial occurrence and distribution of PFAS in the unconfined aquifer in the Delaware Coastal Plain. Source water samples collected for this purpose were analyzed for PFAS and gaseous SF6 to determine groundwater ages.
Study Sampling Network
The study well network consisted of 30 drinking-water wells distributed throughout the State of Delaware and screened in the Columbia aquifer. Its purpose was to observe source groundwater quality across a network of previously sampled wells (Ferrari, 2002; Reyes, 2010), and identify and quantify the spatial and temporal changes in water quality in Delaware’s Columbia aquifer public-drinking water-supply wells between 2000, 2008, and 2018. All groundwater samples were collected from the source water to supply wells prior to any filtering or treatment and are therefore representative of the available groundwater resource rather than drinking water. The network (fig. 1; table 1) of 30 wells was sampled from August to November 2018, and the samples were analyzed for 18 PFAS using the modified EPA Method 537 (U.S. Environmental Protection Agency, 2009; table 2) and groundwater age.
Table 1.
Well-construction data for sampled public water-supply wells screened in the Columbia aquifer in Delaware and modeled ages of groundwater sampled during the 2000, 2008, and 2018 sampling periods.[USGS, U.S. Geological Survey; DGS, Delaware Geological Survey; DNREC, Delaware Natural Resources and Environmental Control; Equip. blank, a sample collected in which blank water is processed through the equipment used for environmental sample collections. It is similar to a field blank, but done in a controlled environment such as a laboratory; Resampled, 23 public water-supply wells sampled in 2008 and 2018; Resampled, trend, 17 public water-supply wells used as trend wells, sampled in 2000, 2008, and 2018; Replacement, 7 public water-supply wells sampled only in 2018; --, no data]
Table 2.
Information for per- and polyfluorinated alkyl substances (PFAS) for which unfiltered groundwater samples from public water-supply wells were analyzed in the Columbia aquifer in Delaware in 2018 under the modified U.S. Environmental Protection Agency Method 537 (U.S. Environmental Protection Agency, 2009).[NWIS, National Water Information System; ppt, parts per trillion; RDL, reportable detection limit; MDL, method detection limit]
To the extent possible, the 2018 well network was the same as in fall of 2000 and 2008. In the event a previously sampled well was no longer in use, U.S. Geological Survey (USGS) personnel worked with DNREC personnel to identify a suitable replacement well. Replacement wells were selected based on the following DNREC established criteria: (1) well located within a 1-mile radius with similar well construction, (2) used as a public drinking-water supply, and (3) screened in the unconfined aquifer.
Sampling Collection and Analysis
Wells were sampled and analyzed for PFAS and groundwater age. Field parameters (appendix 1; table 1.1) including water temperature, specific conductance, pH, dissolved oxygen, and alkalinity were determined in the field following the protocols outlined in U.S. Geological Survey (variously dated). All groundwater samples were collected from the raw-sample tap prior to any filtering or treatment and are therefore representative of the available groundwater resource rather than drinking water. Wells were purged to remove standing water in the casing (generally three well volumes) before samples were collected. Purging continued until dissolved oxygen (±0.3 milligrams per liter [mg/L]), pH (±0.1 units), specific conductance (±3 percent), water temperature (±0.2 degrees Celsius [°C]), and turbidity (±10 percent) stabilized. Direct collection of PFAS water-quality samples from the spigot was collected into two 250-milliliter (mL) bottles or one 500-mL bottle using elbow-length gloves. Another subset of samples was collected into 1-liter bottles for dissolved gases and SF6 analyses for groundwater age. Bottles were chilled to maintain a temperature of 4 °C during shipment to the laboratory.
PFAS analyses were performed by Maxxam Analytics, a subcontract lab from RTI Laboratories, Inc., following U.S. Environmental Protection Agency Method 537 for determination of selected perfluorinated alkyl acids in drinking water by solid phase extraction and liquid chromatography/tandem mass spectrometry protocol (U.S. Environmental Protection Agency, 2009). Concentrations of gaseous SF6 were determined at the USGS Groundwater Dating Laboratory, Chlorofluorocarbon/Dissolved Gas Laboratory in Reston, Virginia, to determine groundwater age (Plummer and Busenberg, 1999; Plummer and Friedman, 1999; Plummer and Busenberg, 2000; Busenberg and others, 2001).
Data Analysis
Descriptive statistical analyses were used to assess PFAS analytical results within the well network. Combined PFOA and PFOS concentrations were compared to the EPA’s HAL. This comparison was made for informational purposes only and not for evidence of compliance or noncompliance with Federal regulations because this health-based reference level is for public drinking water as supplied to customers and is not applied to source (raw) water.
Explanatory and nonparametric statistical tests were used to characterize water chemistry differences of groundwater-age data between the three sampling events (2000, 2008, and 2018), to identify changes in groundwater quality, and to identify patterns in groundwater chemistry during the new 10-year study period (2008 to 2018). Twenty-three of the wells sampled in 2008 were available for resampling and used for comparison between the 2008 and 2018 samples. Of the 23 resampled wells, 17 wells were sampled in 2000, 2008, and 2018; these wells were used for statistical trend analysis. PFAS censored data (less than or undetected at the method detection limit; table 3) were set to nondetects before any analyses or ranks and in the figures. PFAS concentrations with E values indicated that PFAS concentrations were detected below the reporting detection limit but above the method detection limit, and these were set as detections. All statistical tests were evaluated at the 95-percent confidence level (a=0.05). The R statistical program (ver. 4.0.2) was used to perform all the statistical analyses. All water-chemistry data collected for this report are available through the National Water Information System (NWIS) web page (https://waterdata.usgs.gov/nwis/) and ScienceBase (Reyes, 2021).
Table 3.
Concentrations and detections of per- and polyfluoroalkyl substances (PFAS) in sampled public water-supply wells in the Columbia Aquifer in Delaware, sampled in 2018 using the modified U.S. Environmental Protection Agency Method 537.[PFAS descriptions and list of analytical compounds are provided in table 2. A total of 30 public water-supply wells were sampled in 2018. USGS, U.S. Geological Survey; DGS, Delaware Geological Survey; ppt, parts per trillion; Environmental, groundwater sample from the public water-supply well; E, value is between method detection limit and reporting detection limit; <, less than, undetected at the method detection limit; HAL, EPA health advisory level for combined concentrations of perfluorooctanoic acid (PFOA) and perfluorooctane sulfonate (PFOS); ND, nondetected PFAS]
Quality-Control Sampling
Quality-control samples including equipment and field blanks, sequential replicate samples, and laboratory spikes, were collected to evaluate and estimate potential contamination bias and measure variability from water-quality data-collection processes following protocols described in Koterba and others (1995). An equipment blank was collected prior to sampling; seven field blanks and three replicates for PFAS were collected during field activities at selected wells (Reyes, 2021); all 30 wells have replicate samples for SF6 and dissolved gases for groundwater-age estimation. Field collection procedures for quality-control samples were established using the USGS National Field Manual (U.S. Geological Survey, variously dated) and in a manner consistent with procedures for the acquisition of environmental samples.
Equipment and field blanks were collected to estimate the accuracy of concentrations and to ensure that sample collection and processing did not result in contamination. No PFAS were detected in equipment or field blanks, indicating that selected equipment, cleaning, sampling, and handling procedures are sufficient to provide data that reflect environmental conditions.
Replicate field samples measure the combined precision of sampling and laboratory analysis procedures. All the replicate samples had results similar to or consistent (within a relative percent difference of 30 percent) with their respective environmental samples.
Spikes were analyzed to determine the extent of degradation of the analyte concentration during sample processing and analysis, recovery bias, and variability (Koterba and others, 1995). In this study, samples were spiked in the laboratory with a known quantity of PFAS. Spike data are available upon request from the USGS Maryland-Delaware-D.C. Water Science Center in Baltimore, Maryland, Water-Quality Data Section (https://www.usgs.gov/centers/md-de-dc-water/about).
PFAS Results
All 30 wells were analyzed for 18 PFAS using the modified EPA Method 537 (U.S. Environmental Protection Agency, 2009; table 2). More than half (16) of the sampled wells had one or more PFAS detections, and as many as eight PFAS were detected in two wells (Ri23-15 and Oi25-18; table 3). The spatial distribution of PFAS detections across Delaware is shown in figure 3. Wells with higher numbers of compounds detected (five or more) were located in New Castle and Sussex Counties. Forty-four percent of the analyzed PFAS (8 of 18) were detected in the study well network, with individual compound concentrations detected raging from E5.0 to 130 ppt. The four most frequently detected PFAS were PFOA with 47 percent detection, PFHxA with 33 percent detection, and PFOS and PFHxS with 27 percent detection each (table 3).
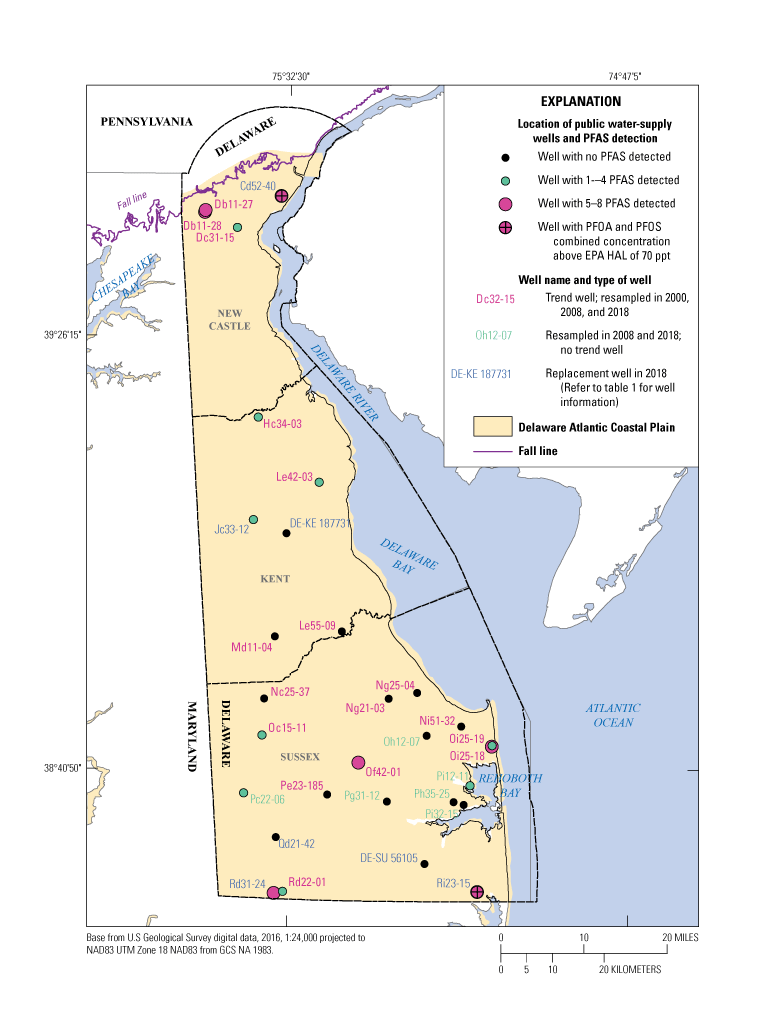
Location of public water-supply wells sampled in 2018 and per- and polyfluoroalkyl substances (PFAS) detection distribution in the Columbia aquifer in Delaware. EPA, U.S. Environmental Protection Agency; HAL, health advisory level; ppt, parts per trillion; PFOA, perfluorooctanoic acid; PFOS, perfluorooctane sulfonate.
Most of the PFAS detections were in oxic environments (dissolved oxygen levels greater than or equal to 1 mg/L), although higher concentrations of PFAS compounds (greater than or equal to 100 ppt) were observed in low-oxygen environments (fig. 4).
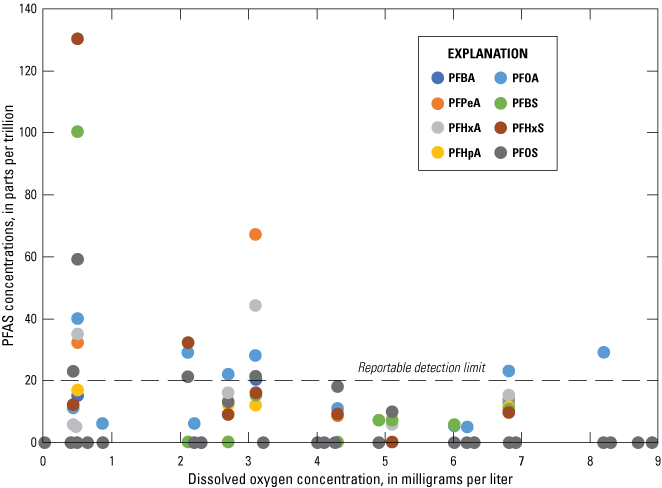
Distribution of per- and polyfluoroalkyl substances (PFAS) concentration by dissolved oxygen concentration in the Columbia aquifer, 2018. Refer to table 2 for PFAS descriptions and list of analytical compounds. Values plotted at 0 are nondetects, as discussed in the text.
Two wells (Cd52-40 in New Castle County and Ri23-15 in Sussex County), out of the 14 wells with combined PFOS and PFAS detections, were above the EPA drinking-water HAL of 70 ppt (fig. 5). Both wells are treated to remove PFAS from their system.
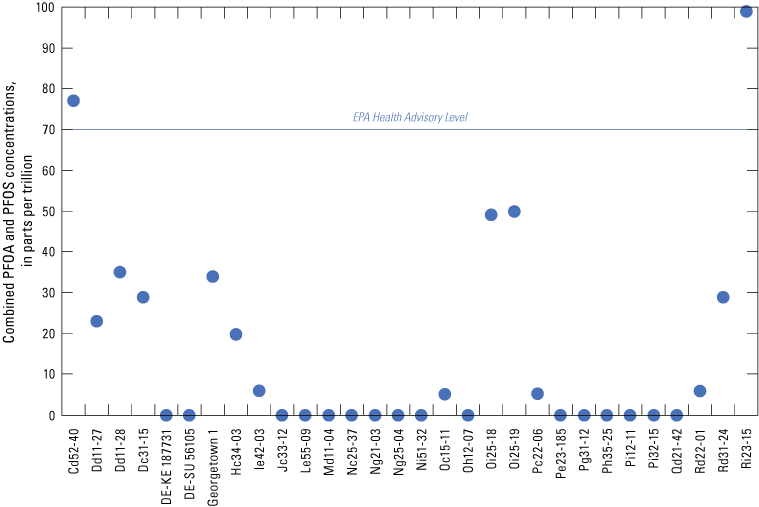
Comparison between combined concentrations of perfluorooctane sulfonate (PFOS) and perfluorooctanoic acid (PFOA) and the U.S. Environmental Protection Agency (EPA) drinking water health advisory level. Values plotted at 0 are nondetects, as discussed in the text.
Groundwater Age Results
Water that infiltrates the landscape and percolates downward toward the water table becomes recharge to the aquifer system. As additional recharge continues to enter the aquifer, older recharge is pushed deeper by the newer recharge, resulting in a trend of increasing groundwater age with depth. Groundwater age represents the average age of water withdrawn from the well, as well screens typically span several feet of aquifer sediment, thus integrating waters of various ages. Dissolved-gas analyses also were performed on samples of each well as part of the age-dating analysis to determine the average recharge temperature of the water in the aquifer (appendix 2; table 2.1). Recharge dates for groundwater samples were estimated based on measured concentrations of SF6, which is a common chemical refrigerant that has been released into the environment. The reported age in this study was calculated by averaging the laboratory SF6 ages estimated from each of two samples collected from each well (appendix 3; table 3.1).
The average groundwater age among the 30 wells sampled in 2018 ranged from 8.2 to 45.8 years, with a median of 25.7 years. Refer to table 1 for well-construction and groundwater-age data. The same relations from previous study years were observed; groundwater ages are positively correlated (R2=0.6024, p-value<0.0004) with well depth (fig. 6A) and negatively correlated (R2= –0.4293, p-value <0.018) with dissolved oxygen concentrations (fig. 6B) in the Columbia aquifer. The relation of groundwater-age data and total PFAS concentrations is shown in figure 7. This groundwater age-concentration relation supports the fact that PFAS are as result of anthropogenic activities and that these contaminants are relatively novel.
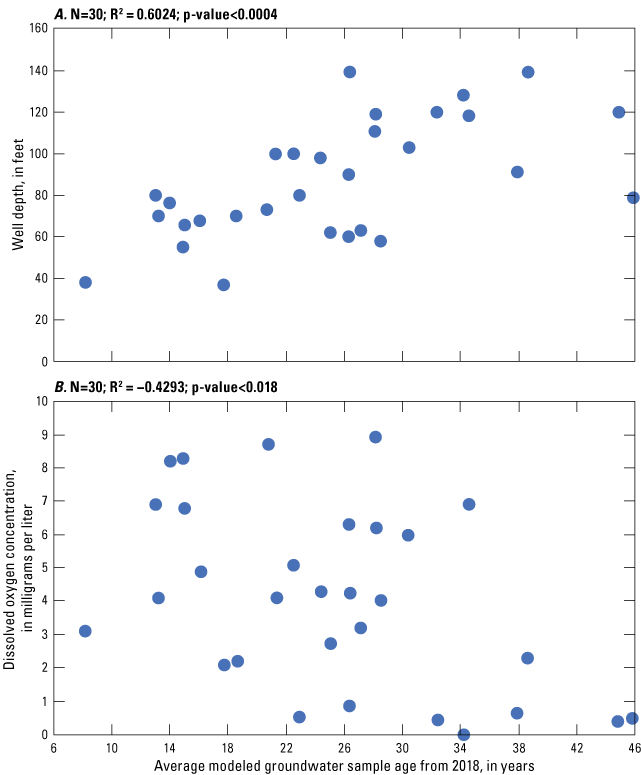
Relation of average modeled groundwater sample age to (A) well depth, and (B) dissolved oxygen concentrations in the Columbia aquifer in Delaware, 2018.
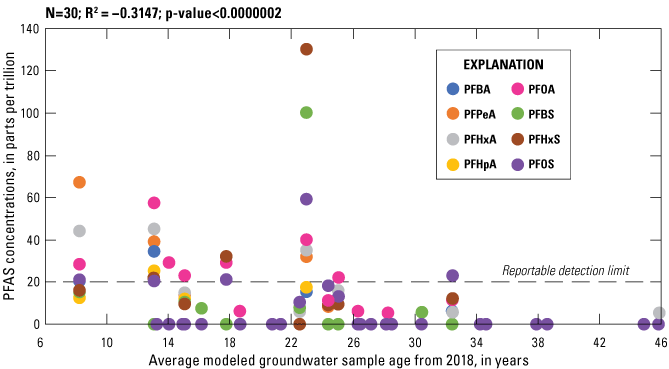
Relation of average modeled groundwater sample age to per- and polyfluoroalkyl substances (PFAS) concentrations in the Columbia aquifer in Delaware, 2018. Refer to table 2 for PFAS descriptions and list of analytical compounds. Values plotted at 0 are nondetects, as discussed in the text.
Comparison of the average modeled groundwater sample-age data (fig. 8A) from the 23 wells sampled in 2018 indicates that the average groundwater age was significantly different than the 2008 sample-age data; 2018 sample ages were, on average, 5 years older than 2008 sample ages. A similar pattern was found during cycle two (2008) of this study, where the 2008 average modeled groundwater age was, on average, 7 years older than the samples collected in 2000. The distribution of the groundwater sample ages among the 17 trend wells and during the three study cycles (fig. 8B) indicates that sample-age medians were statistically different than zero (p-value<0.00124). Well-water sample-age data show a slight increase in groundwater sample age. Groundwater age represents a mixture of older and young groundwater because well screens in public-supply wells are relatively long and pumping enhances the mixing of waters of disparate groundwater ages (Dunkle and others, 1993). The specific reason for the differences in groundwater ages is unknown, although Gholam and others (2006) indicated that this age difference could reflect a higher proportion of water drawn from slow-moving storage, possibly as a result of pumping for long periods of time, or a pumping increase that caused more water from older, deeper, or more distant sources to be drawn into the well.
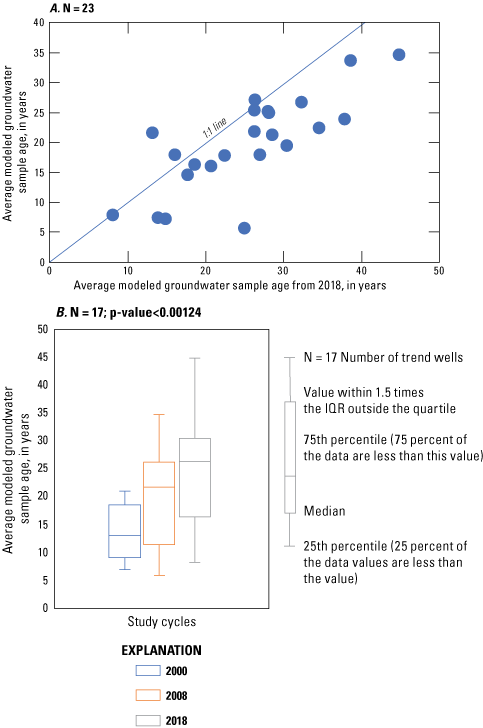
Average modeled groundwater sample age (A) comparison over the 10-year study period from the 23 sampled wells in the Columbia aquifer in Delaware between 2008 and 2018, and (B) distribution over the three sampling cycles in the Columbia aquifer in Delaware, 2000, 2008, and 2018. IQR, interquartile range.
Summary
This study’s results mark a baseline for per- and polyfluorinated alkyl substances (PFAS) concentration in the Columbia aquifer. Many findings from this study suggest the need to continue active monitoring for these anthropogenic contaminants. There was a widespread distribution of PFAS detections throughout Delaware, as well as a significant number of detections per wells and the variety of compounds detected, including the higher concentrations and high number of detections in younger waters and the results of the U.S. Environmental Protection Agency’s health advisory level exceedances for perfluorooctanoic acid (PFOA) and perfluorooctane sulfonate (PFOS) in source water samples. These findings show the susceptibility of this aquifer for these and other anthropogenic contaminants which may significantly affect the drinking water sources in the Columbia aquifer as a result of the aquifer’s characteristics (surficial aquifer; good soil drainage; and sandy, transmissive aquifer sediments) and the persistence of these compounds. Comparison of the average modeled groundwater ages indicates that the 2018 samples were significantly older than the 2008 and 2000 samples. Among the resampled wells, the average groundwater age difference was 7 years from 2000 to 2008 and 5 years from 2008 to 2018.
References Cited
Agency for Toxic Substances and Disease Registry, 2018, Toxicological profile for perfluoroalkyls (Draft for public comment): U.S. Department of Health and Human Services, Public Health Service web page, accessed January 2020 at https://www.atsdr.cdc.gov/.
Dewitz, J., 2019, National land cover database (NLCD) 2016 products (ver. 2.0, July 2020): U.S. Geological Survey data release, accessed January 2019 at https://doi.org/10.5066/P96HHBIE.
Dunkle, S.A., Plummer, L.N., Busenberg, E., Phillips, P.J., Denver, J.M., Hamilton, P.A., Michel, R.L., and Coplen, T.B., 1993, Chlorofluorocarbons (CCl3 F and CCl2 F2) as dating tools and hydrologic tracers in shallow groundwater of the Delmarva Peninsula, Atlantic Coastal Plain, United States: Water Resources Research, v. 29, no. 12, p. 3837–3860, accessed May 2019 at https://doi.org/10.1029/93WR02073.
Ferrari, M.J., 2002, Occurrence and distribution of selected contaminants in public drinking-water supplies in the surficial aquifer in Delaware: U.S. Geological Survey Open-File Report 01–327, 62 p., accessed January 2019 at https://pubs.usgs.gov/of/2001/ofr01-327/pdf/ofr-01-327.pdf.
Koterba, M.T., Wilde, F.D., and Lapham, W.W., 1995, Ground-water data-collection protocols and procedures for the National Water-Quality Assessment Program—Collection and documentation of water-quality samples and related data: U.S. Geological Survey Open-File Report 95–399, 113 p., accessed January 2019 at https://doi.org/10.3133/ofr95399.
Plummer, L.N., and Friedman, L.C., 1999, Tracing and dating young ground water: U.S. Geological Survey Fact Sheet 134-99, 4 p., accessed March 31, 2010, at https://pubs.usgs.gov/fs/FS-134-99/pdf/fs-134-99.pdf.
Reyes, B., 2010, Occurrence and distribution of organic chemicals and nutrients and comparison of water-quality data from public drinking-water supplies in the Columbia aquifer in Delaware, 2000–08: U.S. Geological Survey Scientific Investigations Report 2010–5206, 64 p., accessed January 2019 at https://doi.org/10.3133/sir20105206.
Reyes, B., 2021, Data in support of the occurrence and distribution of per- and polyfluoroalkyl substances in sampled source water of public drinking-water supplies in the surficial aquifer in Delaware, 2018: U.S. Geological Survey data release, https://doi.org/10.5066/P9T0IA3Z.
U.S. Department of Agriculture, 2017 Census of Agriculture—State data: National Agricultural Statistics Service web page, accessed March 31, 2019, at https://www.nass.usda.gov/Publications/AgCensus/2017/Full_Report/Volume_1,_Chapter_2_US_State_Level/st99_2_0001_0001.pdf.
U.S. Environmental Protection Agency, 2009, Method 537 determination of selected perfluorinated alkyl acids in drinking water by solid phase extraction and liquid chromatography/tandem mass spectrometry (LC/MS/MS) (ver. 1.1): U.S. Environmental Protection Agency, Office of Research and Development, EPA/600/R-08/092, 50 p., accessed June 2018 at https://www.well-labs.com/docs/epa_method_537_2009.pdf.
U.S. Environmental Protection Agency, 2014, External peer review of EPA’s draft health effects documents for perfluorooctanoic acid (PFOA) and perfluorooctane sulfonate (PFOS): Regulations.gov web page, accessed January 2020 at https://www.regulations.gov/document?D=EPA-HQ-OW-2014-0138-0027.
U.S. Environmental Protection Agency, 2016a, Drinking water health advisory for perfluorooctanoic acid (PFOA): U.S. Environmental Protection Agency Office of Water, EPA 822-R-16-005, May 2016, 103 p., accessed January 2020 at https://www.epa.gov/sites/production/files/2016-05/documents/pfoa_health_advisory_final-plain.pdf.
U.S. Environmental Protection Agency, 2016b, Groundwater and drinking water, drinking water health advisories for PFOA and PFOS, October 16, 2020: U.S. Environmental Protection Agency web page, accessed January 2020 at https://www.epa.gov/ground-water-and-drinking-water/drinking-water-health-advisories-pfoa-and-pfos.
U.S. Environmental Protection Agency, 2016c, Health effects support document for perfluorooctanoic acid (PFOA): U.S. Environmental Protection Agency Office of Water, EPA 822-R16-003, May 2016, 322 p., accessed January 2020 at https://www.epa.gov/sites/production/files/2016-05/documents/pfoa_hesd_final-plain.pdf.
U.S. Environmental Protection Agency, 2017, Technical fact sheet—Perfluorooctane sulfonate (PFOS) and perfluorooctanoic acid (PFOA), November 2017: U.S. Environmental Protection Agency web page, 8 p., accessed January 2020 at https://www.epa.gov/sites/production/files/2017-12/documents/ffrrofactsheet_contaminants_pfos_pfoa_11-20-17_508_0.pdf.
U.S. Environmental Protection Agency, 2018, Basic information on PFAS: U.S. Environmental Protection Agency web page, accessed November 2020 at https://www.epa.gov/pfas/basic-information-pfas#tab-3.
U.S. Geological Survey, variously dated, National field manual for the collection of water-quality data: U.S. Geological Survey Techniques of Water-Resources Investigations, book 9, accessed May 2019 at https://water.usgs.gov/owq/FieldManual/.
Glossary
Health Advisory Level (HAL)
A nonregulatory health-based reference level of chemical traces (usually in parts per million) in drinking water at which there are no adverse health risks when ingested over certain periods of time. Levels are established for 1 day, 10 days, long-term, and lifetime exposure periods. They contain a wide margin of safety and are set forth by the U.S. Environmental Protection Agency (EPA).
Maximum Contaminant Level (MCL)
As used in this report, an EPA drinking-water standard that is legally enforceable, and that sets the maximum permissible level of a contaminant in water that is delivered to any user of a public water system, at which no known or anticipated adverse effect on the health of persons occurs, and which allows an adequate margin of safety.
Secondary Maximum Contaminant Level (SMCL)
As used in this report, an EPA secondary drinking-water standard, and non-enforceable guidelines regulating contaminants that may cause cosmetic or aesthetic effects (such as taste, odor, or color) in drinking water. The EPA recommends secondary standards for water systems but does not require compliance. However, states may choose to adopt them as enforceable standards.
Appendix 1. Groundwater-quality data for sampled public water-supply wells in the Columbia aquifer in Delaware, sampled in 2018—Field parameters.
Table 1.1.
Groundwater-quality data for sampled public water-supply wells in the Columbia aquifer in Delaware, sampled in 2018—Field parameters.[A total of 30 public water-supply wells were sampled in 2018. USGS, U.S. Geological Survey; DGS, Delaware Geological Survey; °C, degrees Celsius; mm Hg, millimeters of mercury; mg/L, milligrams per liter; µS/cm, microsiemens per centimeter at 25 °C; pH is given in standard units; CaCO3, calcium carbonate; --, no data]
Appendix 2. Groundwater-quality data for sampled public water-supply wells in the Columbia aquifer in Delaware, sampled in 2018—Age dating, dissolved-gas data.
Table 2.1.
Groundwater-quality data for sampled public water-supply wells in the Columbia aquifer in Delaware, sampled in 2018—Age dating, dissolved-gas data.[A total of 30 public water-supply wells were sampled in 2018. USGS, U.S. Geological Survey; DGS, Delaware Geological Survey; °C, degrees Celsius; mg/L, milligrams per liter; CH4, methane; CO2, carbon dioxide; N2, nitrogen; O2, oxygen; Ar, argon]
Appendix 3. Groundwater-quality data for sampled public water-supply wells in the Columbia aquifer in Delaware, sampled in 2018—Age dating with sulfur hexafluoride data.
Table 3.1.
Groundwater-quality data for sampled public water-supply wells in the Columbia aquifer in Delaware, sampled in 2018—Age dating with sulfur hexafluoride data.[A total of 30 public water-supply wells were sampled in 2018. USGS, U.S. Geological Survey; DGS, Delaware Geological Survey; NOAA, National Oceanic and Atmospheric Administration; °C, degrees Celsius; mL, milliliters; fMol/L, fentomoles per liter; --, no data]
Conversion Factors
International System of Units to U.S. customary units
Temperature in degrees Celsius (°C) may be converted to degrees Fahrenheit (°F) as follows:
°F = (1.8 × °C) + 32.
Temperature in degrees Fahrenheit (°F) may be converted to degrees Celsius (°C) as follows:
°C = (°F – 32) / 1.8.
Datum
Vertical coordinate information is referenced to the North American Vertical Datum of 1988 (NAVD 88).
Horizontal coordinate information is referenced to North American Datum of 1983 (NAD 83).
Supplemental Information
Specific conductance is given in microsiemens per centimeter at 25 degrees Celsius (µS/cm at 25 °C).
Concentrations of chemical constituents in water are given in either milligrams per liter (mg/L) or as part per trillion (ppt).
Abbreviations
DNREC
Delaware Department of Natural Resources and Environmental Control
EPA
U.S. Environmental Protection Agency
HAL
health advisory level
HBSL
health-based screening level
MCL
maximum contaminant level
NWIS
National Water Information System
PFAS
per- and polyfluorinated alkyl substances
PFOA
perfluorooctanoic acid
PFOS
perfluorooctane sulfonate
ppb
parts per billion
ppt
parts per trillion
SMCL
secondary maximum contaminant level
USGS
U.S. Geological Survey
For additional information, contact:
Director, Maryland-Delaware-D.C. Water Science Center
U.S. Geological Survey
5522 Research Park Drive
Catonsville, MD 21228
or visit our website at https://www.usgs.gov/centers/md-de-dc-water/
Publishing support provided by the West Trenton Publishing Service Center
Suggested Citation
Reyes, B., 2021, Occurrence and distribution of PFAS in sampled source water of public drinking-water supplies in the surficial aquifer in Delaware, 2018; PFAS and groundwater age-dating results: U.S. Geological Survey Open-File Report 2021–1109, 27 p., https://doi.org/10.3133/ofr20211109.
ISSN: 2331-1258 (online)
Study Area
| Publication type | Report |
|---|---|
| Publication Subtype | USGS Numbered Series |
| Title | Occurrence and distribution of PFAS in sampled source water of public drinking-water supplies in the surficial aquifer in Delaware, 2018; PFAS and groundwater age-dating results |
| Series title | Open-File Report |
| Series number | 2021-1109 |
| DOI | 10.3133/ofr20211109 |
| Year Published | 2021 |
| Language | English |
| Publisher | U.S. Geological Survey |
| Publisher location | Reston, VA |
| Contributing office(s) | Maryland-Delaware-District of Columbia Water Science Center |
| Description | Report: vii, 27 p.; Data Release; Database |
| Country | United States |
| State | Delaware |
| Online Only (Y/N) | Y |
| Additional Online Files (Y/N) | N |
| Google Analytic Metrics | Metrics page |